Science Group PLC · LSE:SAG
Science — Sagentia Group — FY2014 Earnings Presentation
14 slides from Science's earnings presentation, Mar 4, 2015
Slide 1: 2014 Preliminary Results Presentation
2014 Preliminary Results Presentation March 2015 Martyn Ratcliffe Chairman Rebecca Hemsted Finance Director To be read in conjunction with the audited preliminary results announcement released on 4 March 2015
Slide 2: Science and Technology consultancy, International presence
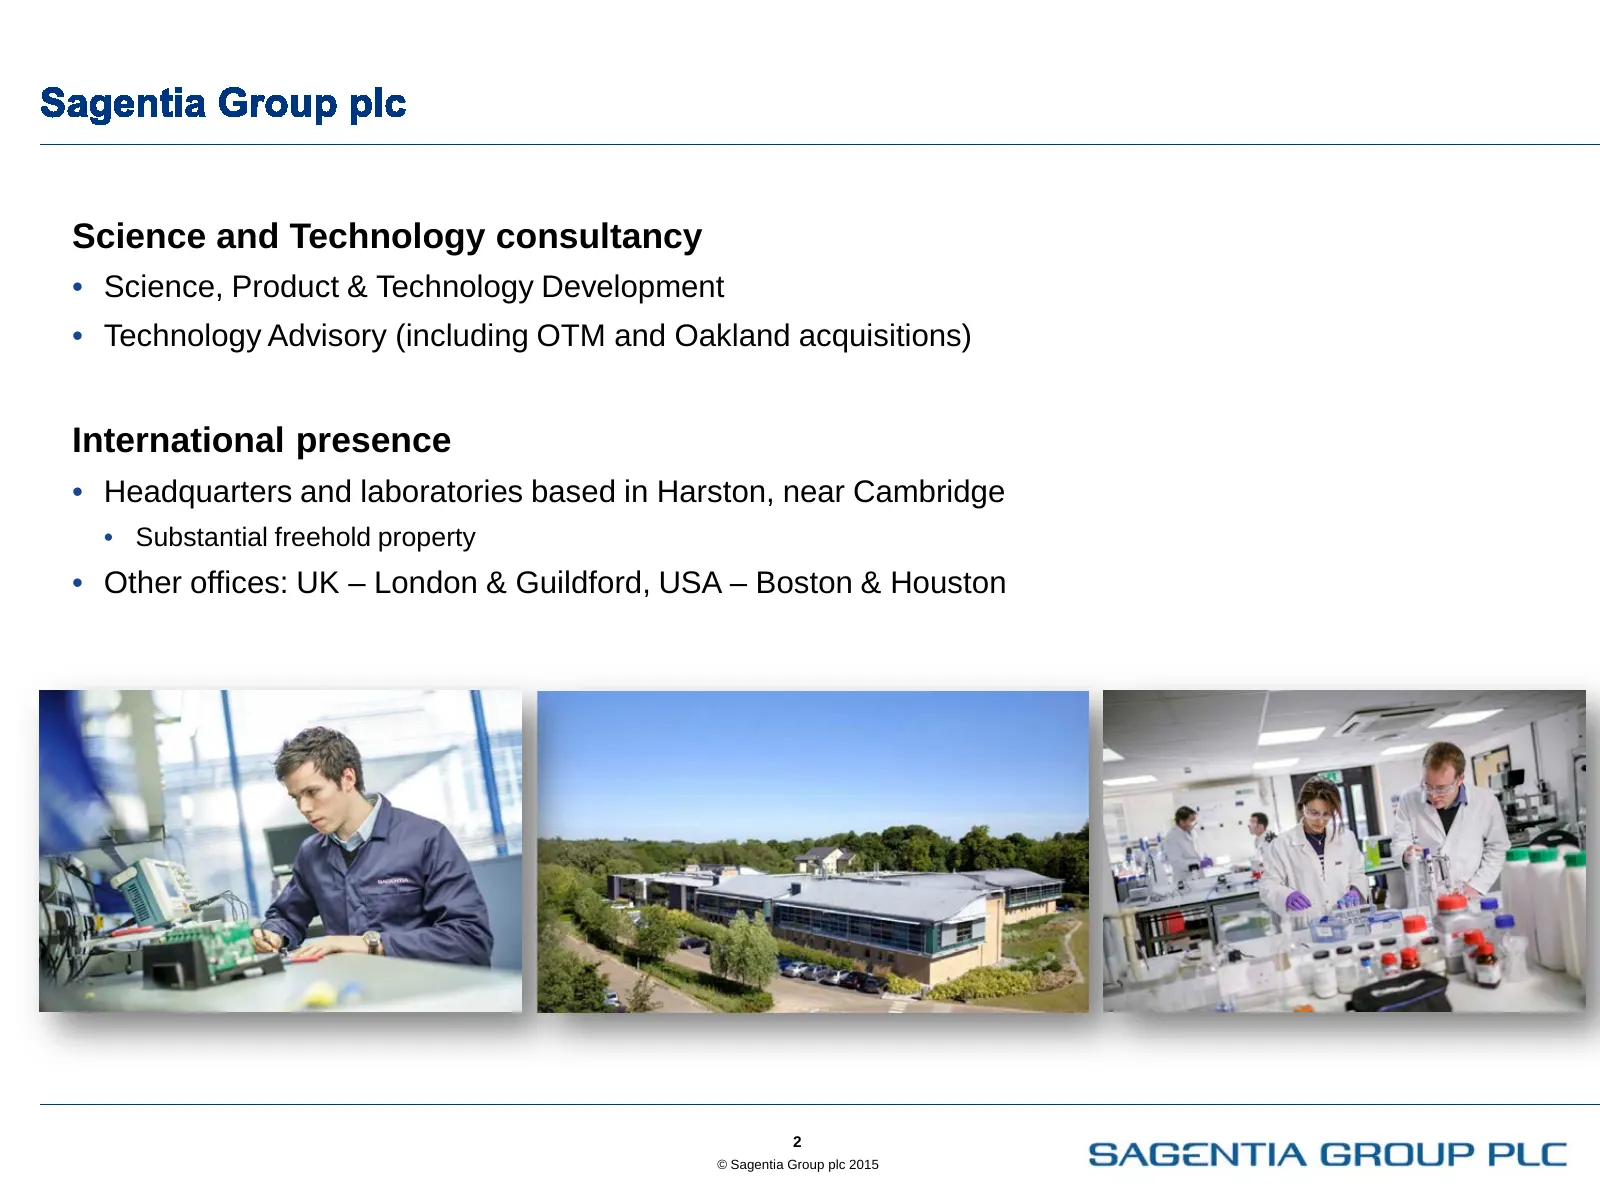
Science and Technology consultancy • Science, Product & Technology Development • Technology Advisory (including OTM and Oakland acquisitions) International presence • Headquarters and laboratories based in Harston, near Cambridge • Substantial freehold property • Other offices: UK – London & Guildfo
Slide 3: Satisfactory operating performance in volatile currency environment
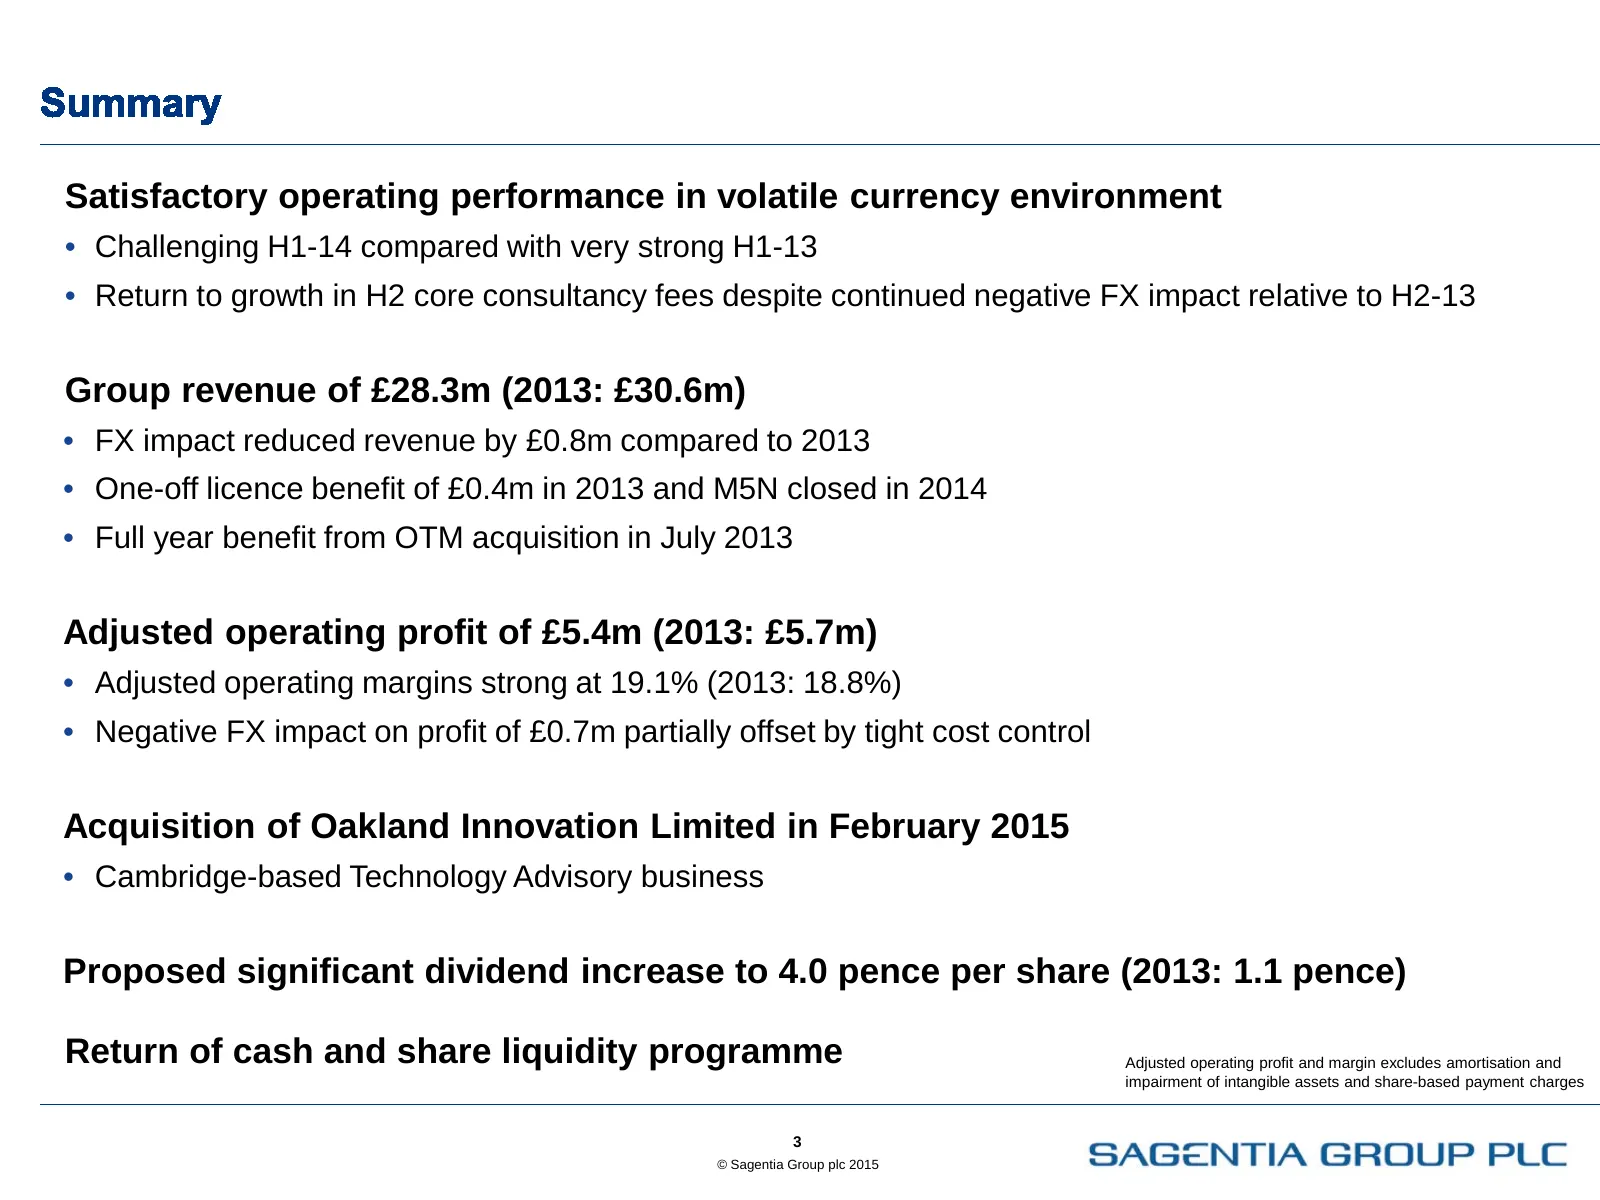
Satisfactory operating performance in volatile currency environment • Challenging H1-14 compared with very strong H1-13 • Return to growth in H2 core consultancy fees despite continued negative FX impact relative to H2-13 Group revenue of £28.3m (2013: £30.6m) • FX impact reduced revenue by £0.8m co
Slide 4: Operating profit of £4.7m and profit before tax of £4.2m
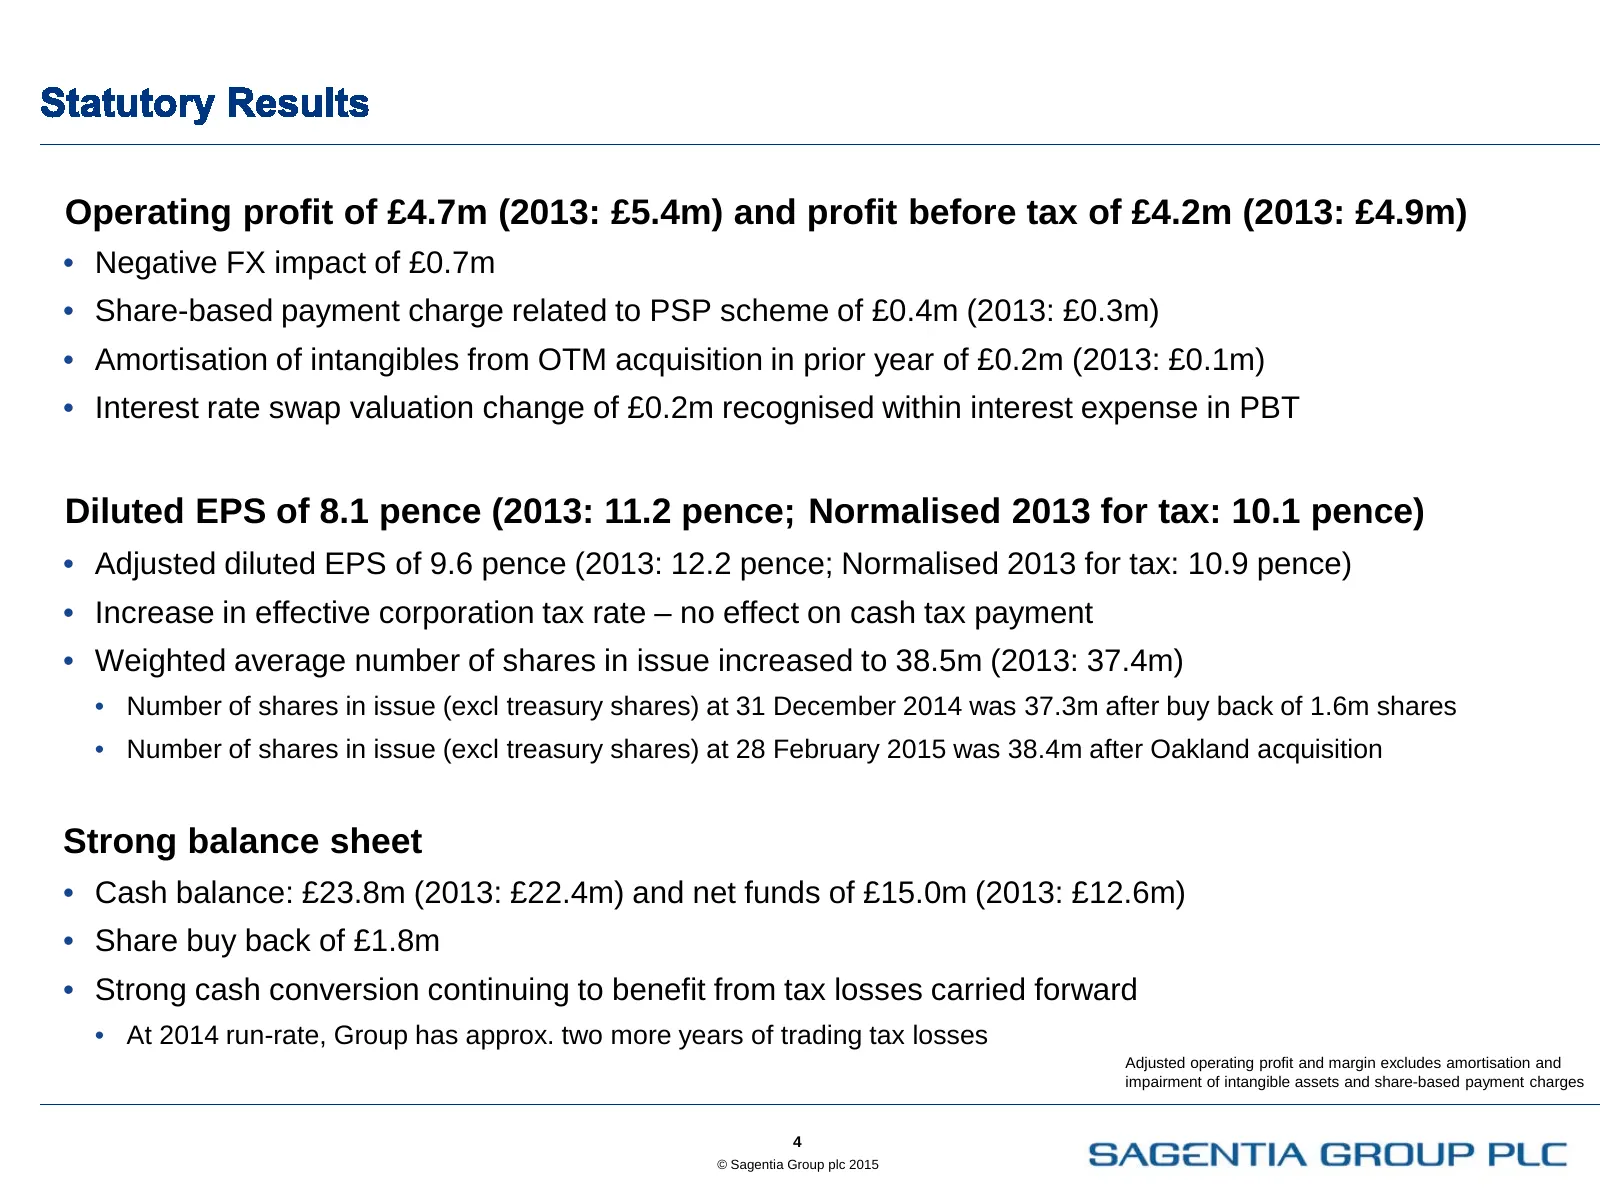
Operating profit of £4.7m (2013: £5.4m) and profit before tax of £4.2m (2013: £4.9m) • Negative FX impact of £0.7m • Share-based payment charge related to PSP scheme of £0.4m (2013: £0.3m) • Amortisation of intangibles from OTM acquisition in prior year of £0.2m (2013: £0.1m) • Interest rate swap va
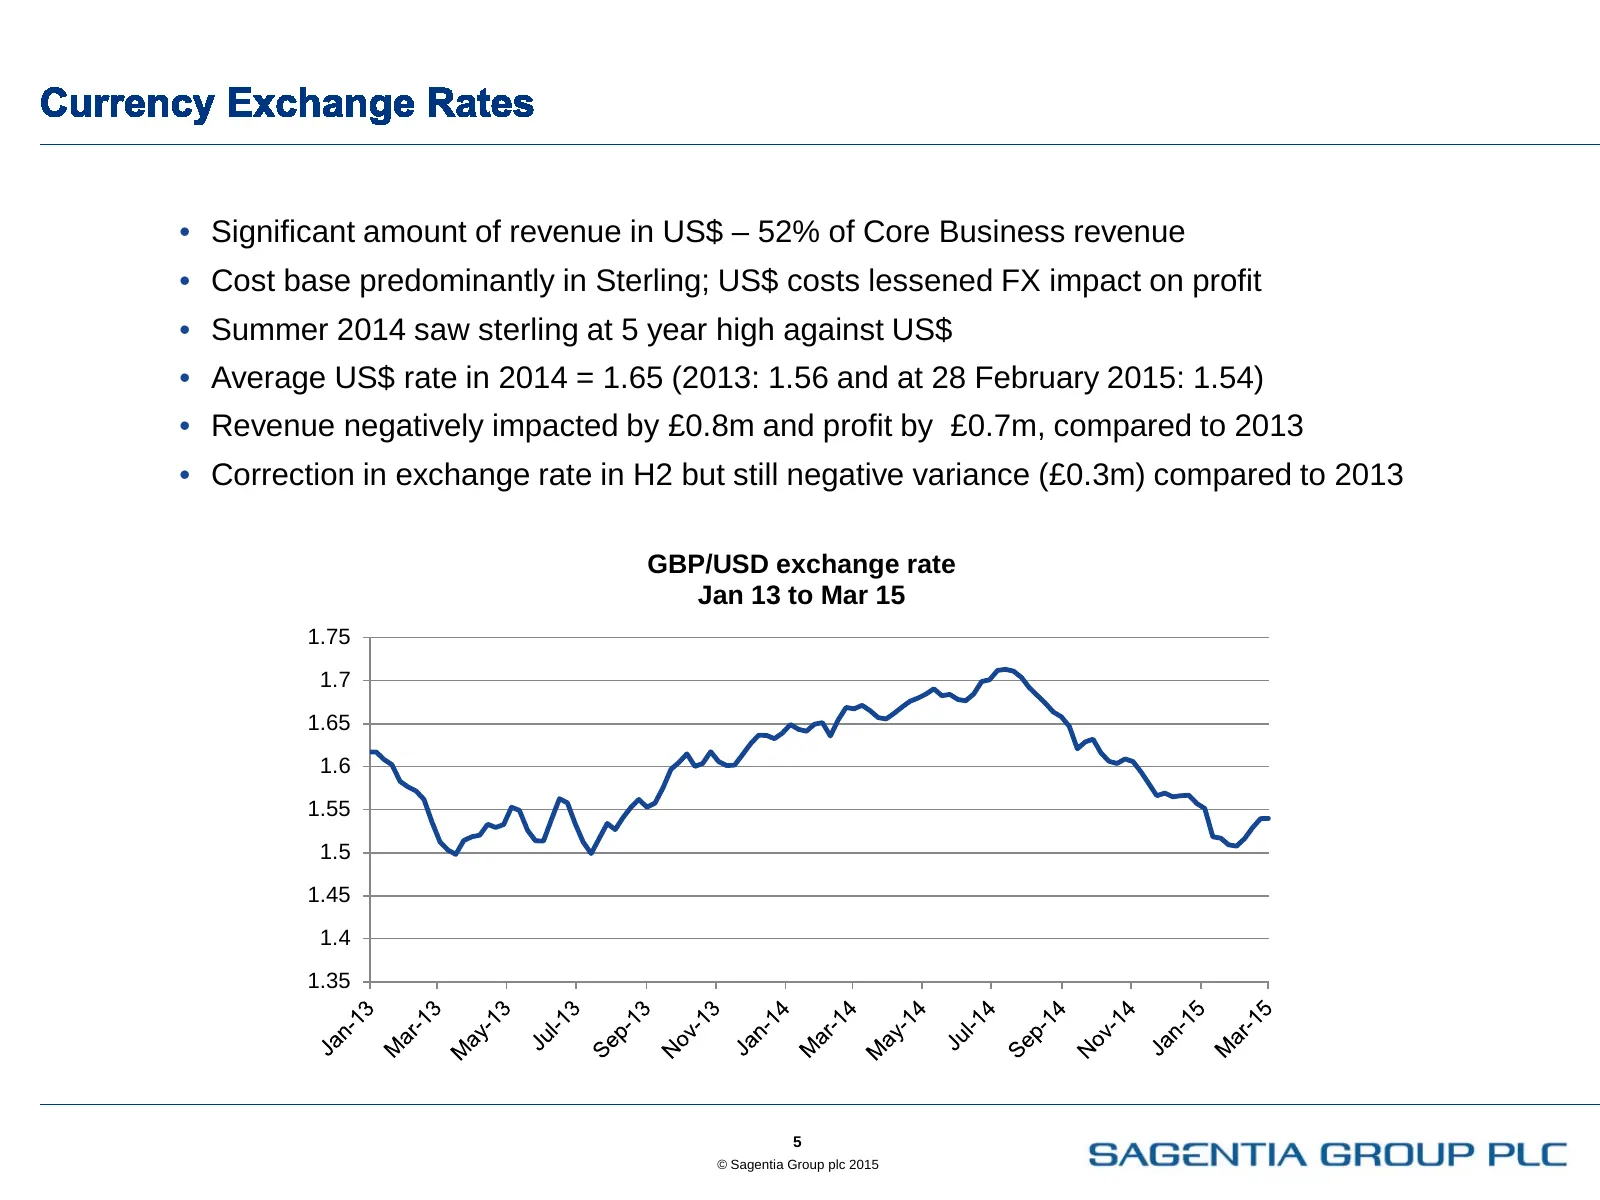
Slide 5: US$ revenue exposure and GBP/USD exchange rate
• Significant amount of revenue in US$ – 52% of Core Business revenue • Cost base predominantly in Sterling; US$ costs lessened FX impact on profit • Summer 2014 saw sterling at 5 year high against US$ • Average US$ rate in 2014 = 1.65 (2013: 1.56 and at 28 February 2015: 1.54) • Revenue negatively
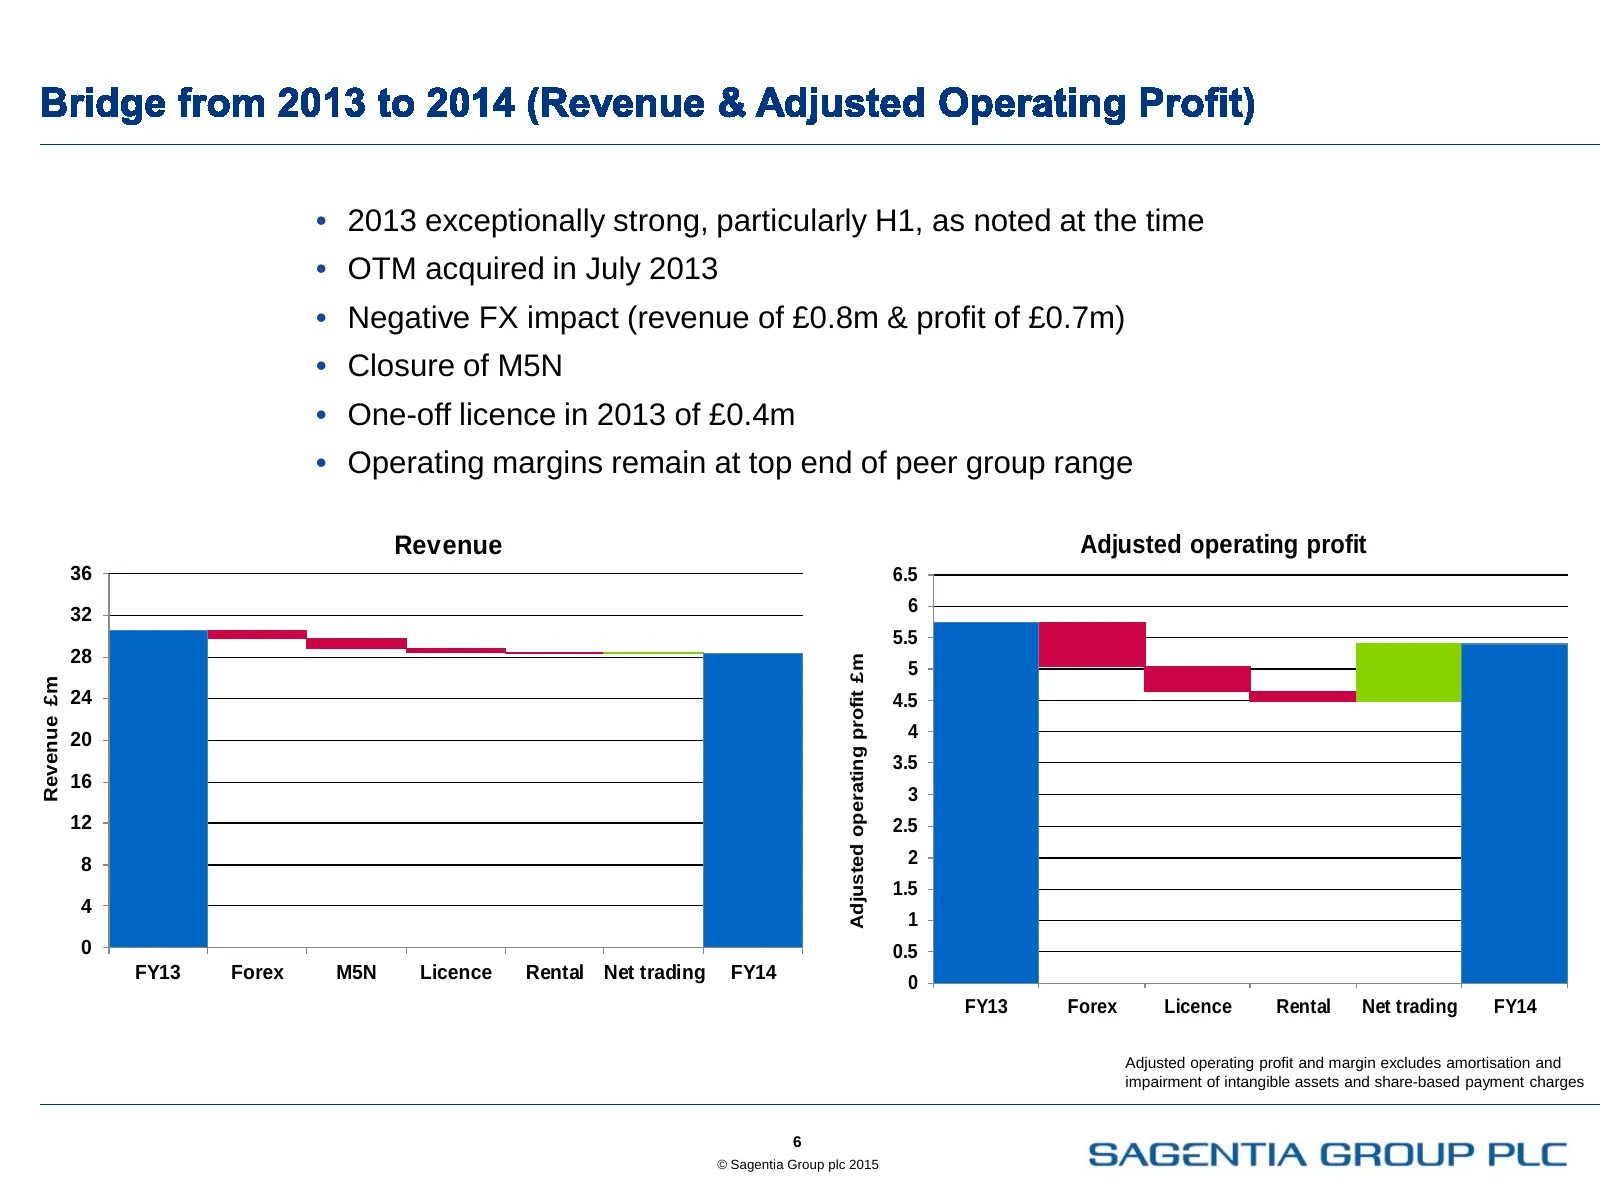
Slide 6: Revenue and adjusted operating profit bridge
• 2013 exceptionally strong, particularly H1, as noted at the time • OTM acquired in July 2013 • Negative FX impact (revenue of £0.8m & profit of £0.7m) • Closure of M5N • One-off licence in 2013 of £0.4m • Operating margins remain at top end of peer group range Revenue Adjusted operating profit 36
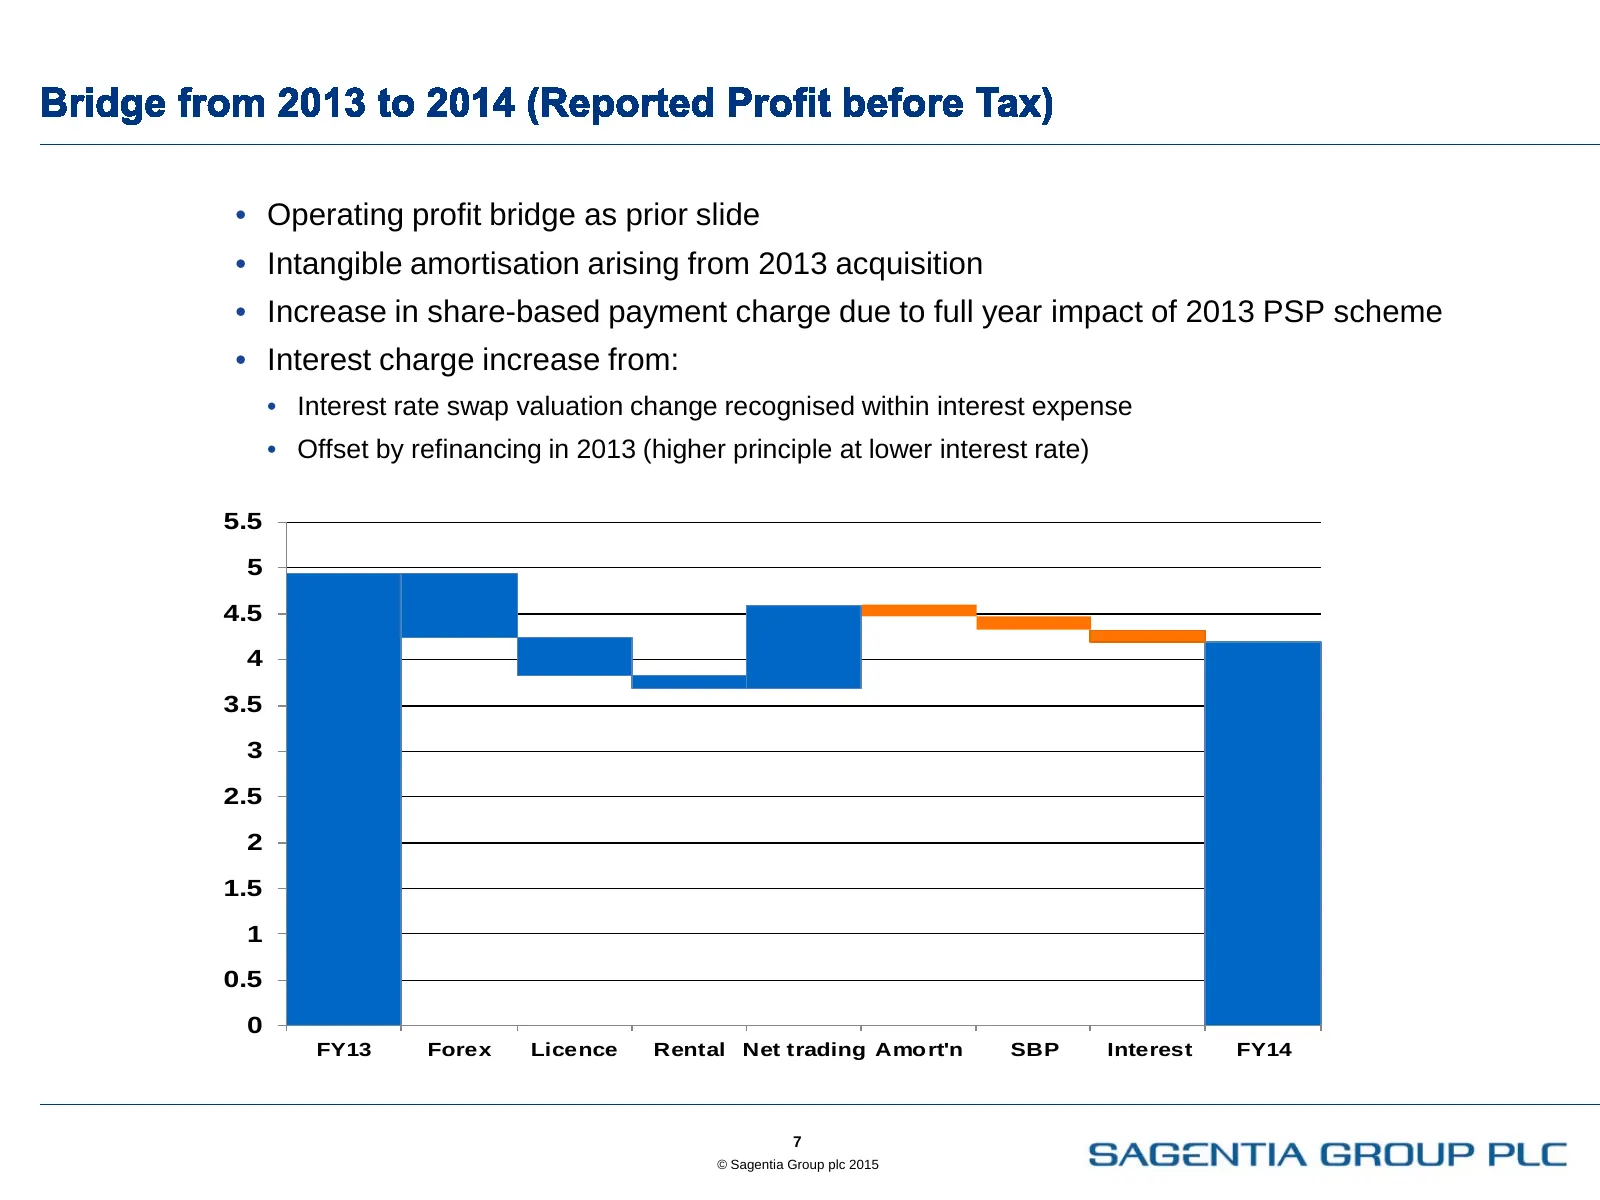
Slide 7: Operating profit bridge
• Operating profit bridge as prior slide • Intangible amortisation arising from 2013 acquisition • Increase in share-based payment charge due to full year impact of 2013 PSP scheme • Interest charge increase from: • Interest rate swap valuation change recognised within interest expense • Offset by r
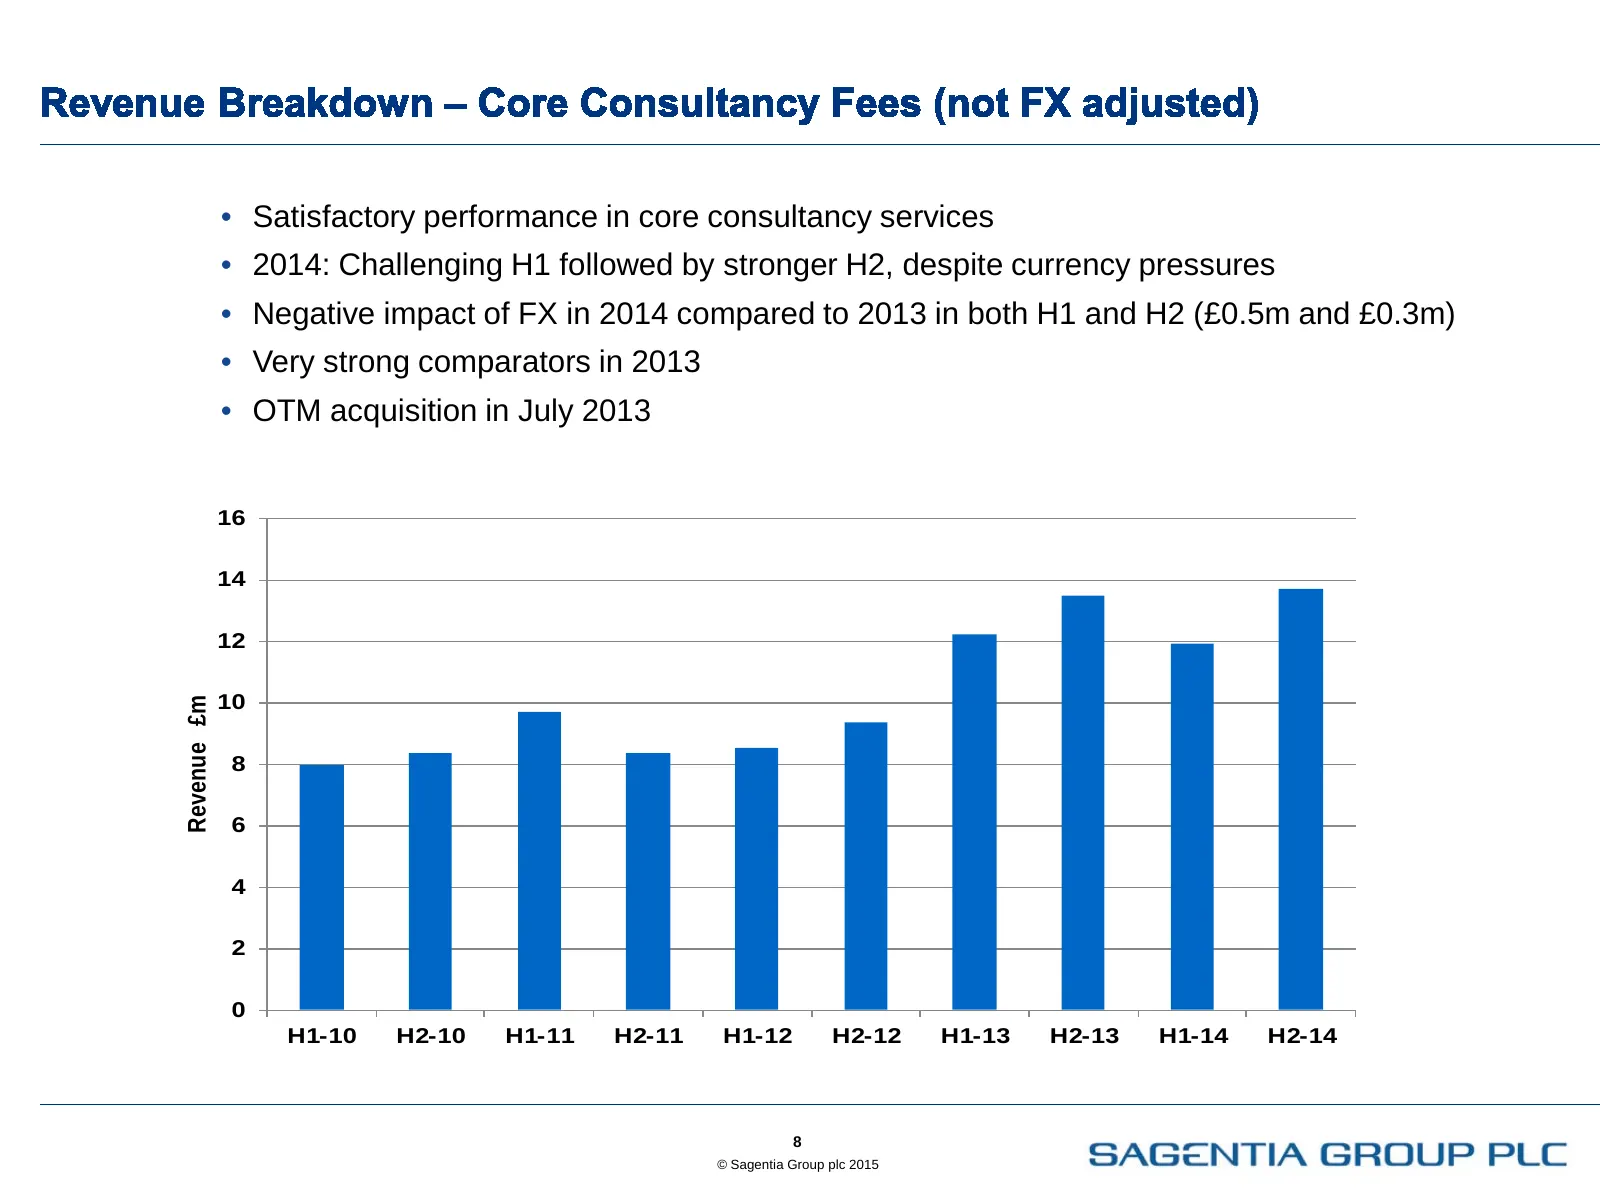
Slide 8: Revenue £m by half year
• Satisfactory performance in core consultancy services • 2014: Challenging H1 followed by stronger H2, despite currency pressures • Negative impact of FX in 2014 compared to 2013 in both H1 and H2 (£0.5m and £0.3m) • Very strong comparators in 2013 • OTM acquisition in July 2013 16 14 12 10 Revenue
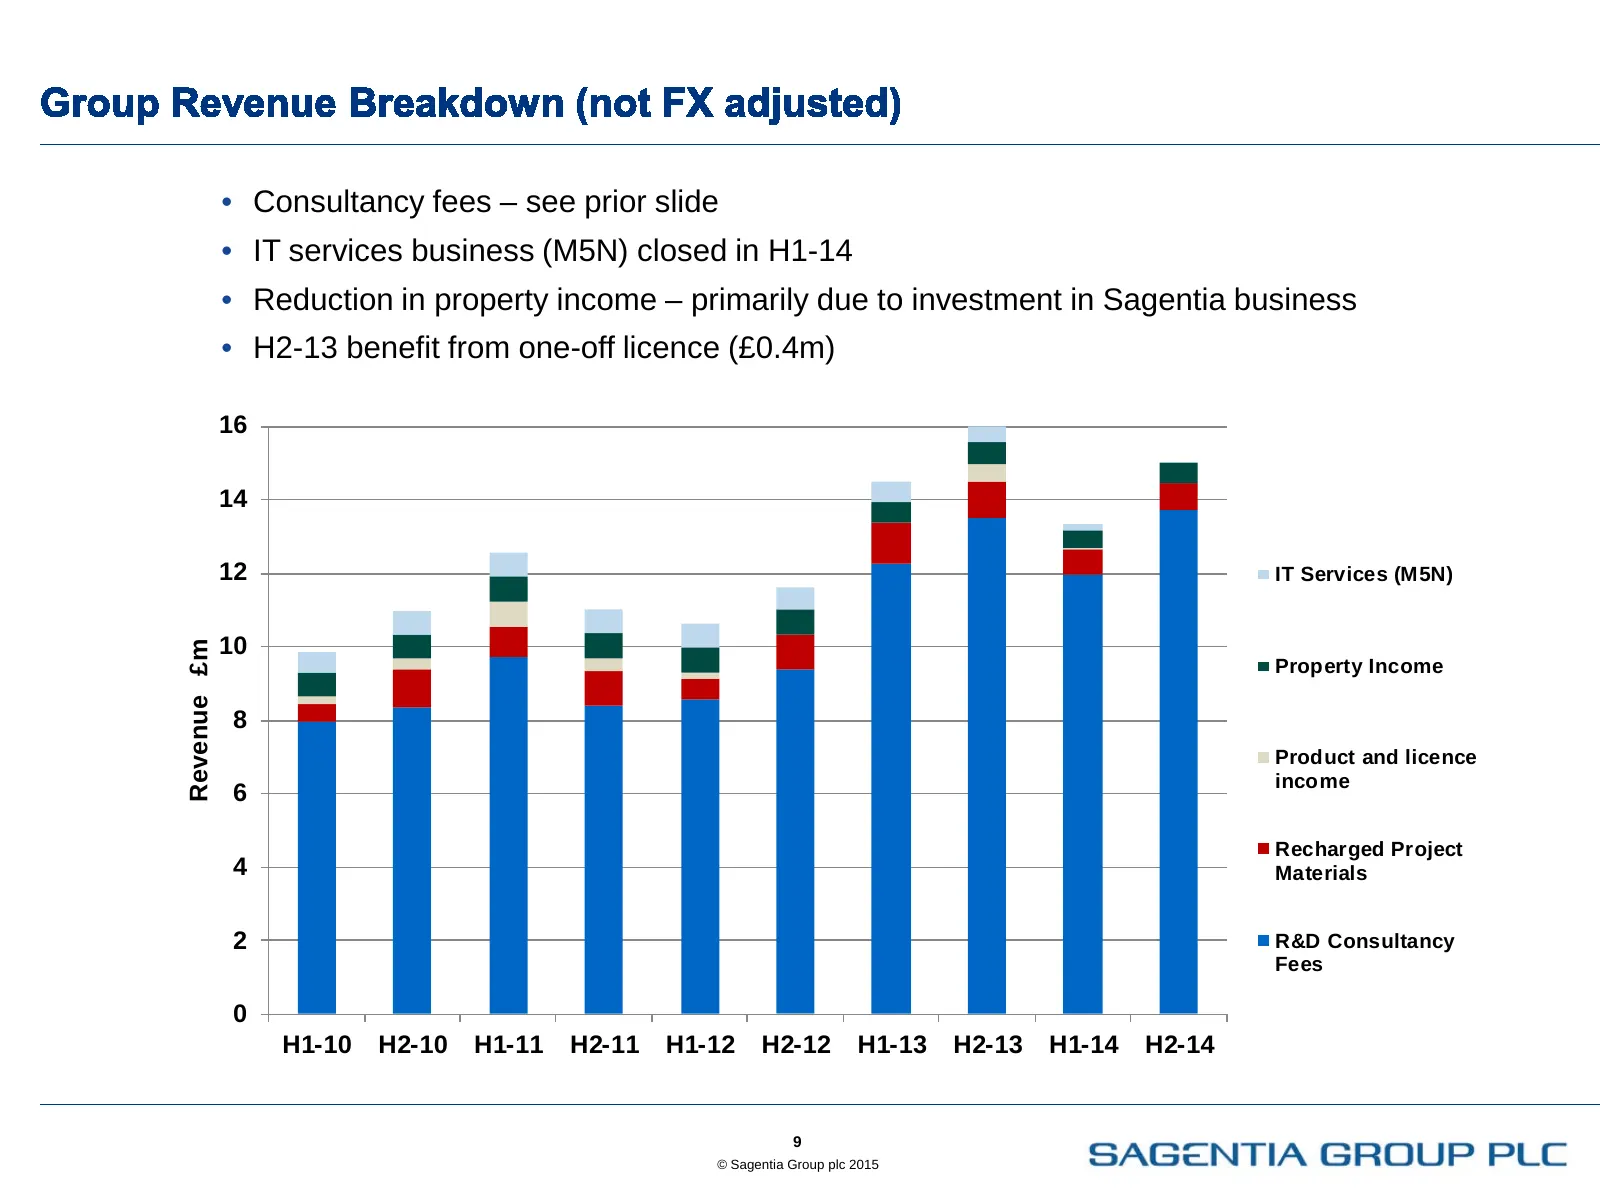
Slide 9: Revenue by type £m
• Consultancy fees – see prior slide • IT services business (M5N) closed in H1-14 • Reduction in property income – primarily due to investment in Sagentia business • H2-13 benefit from one-off licence (£0.4m) 16 14 12 IT Services (M5N) 10 Revenue £m Property Income 8 Product and licence income 6 Rec
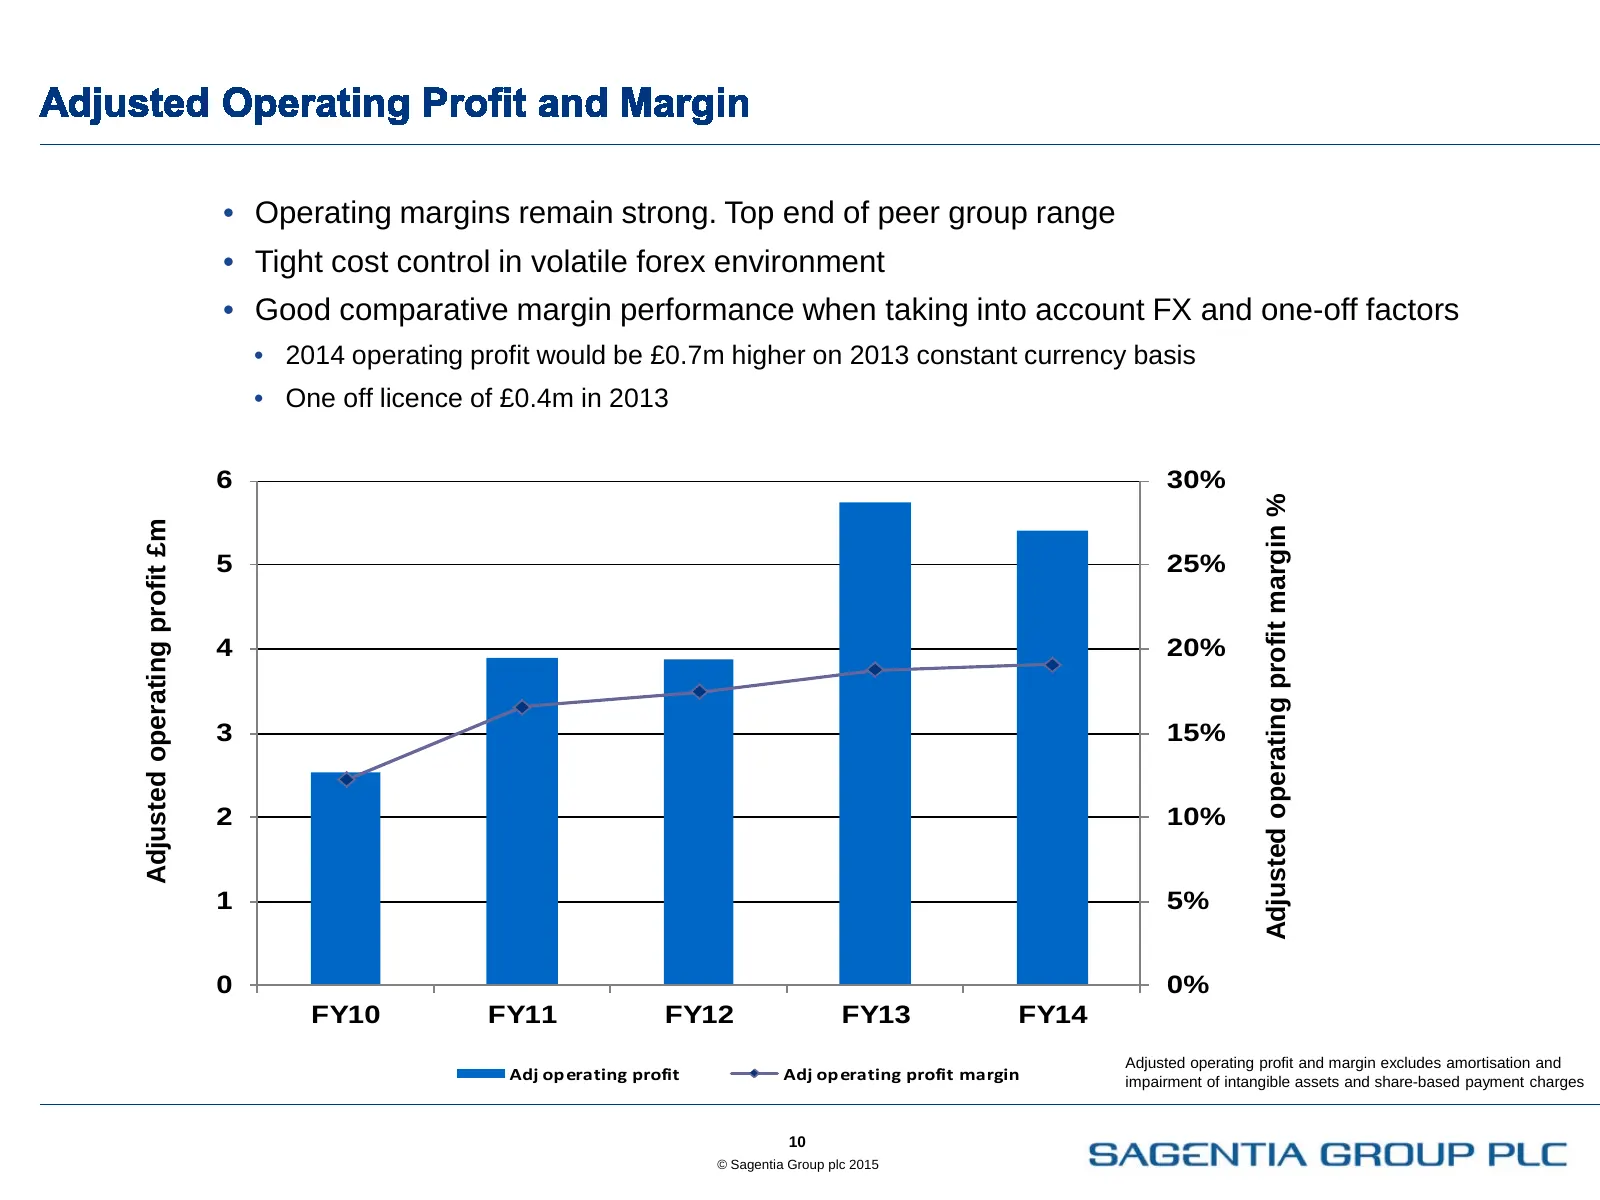
Slide 10: Adjusted operating profit and margin
• Operating margins remain strong. Top end of peer group range • Tight cost control in volatile forex environment • Good comparative margin performance when taking into account FX and one-off factors • 2014 operating profit would be £0.7m higher on 2013 constant currency basis • One off licence of £
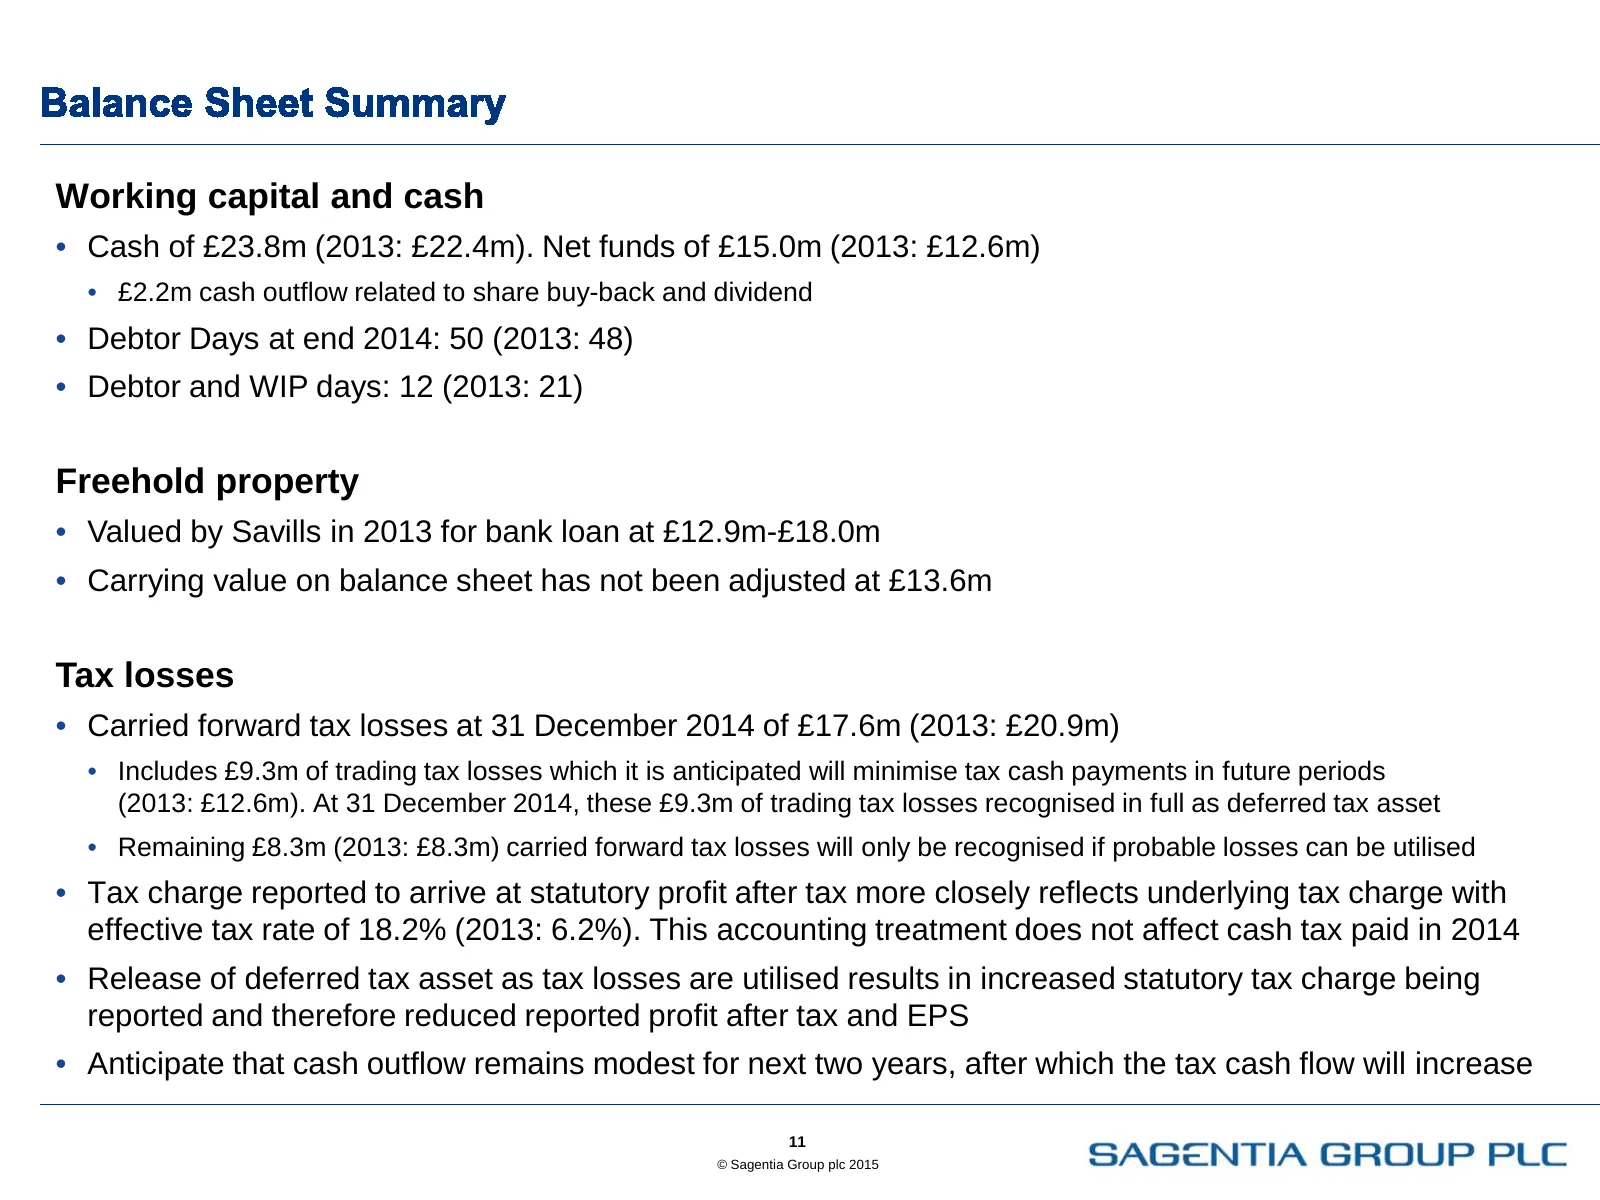
Slide 11: Working capital and cash, Freehold property, Tax losses
Working capital and cash • Cash of £23.8m (2013: £22.4m). Net funds of £15.0m (2013: £12.6m) • £2.2m cash outflow related to share buy-back and dividend • Debtor Days at end 2014: 50 (2013: 48) • Debtor and WIP days: 12 (2013: 21) Freehold property • Valued by Savills in 2013 for bank loan at £12.9m
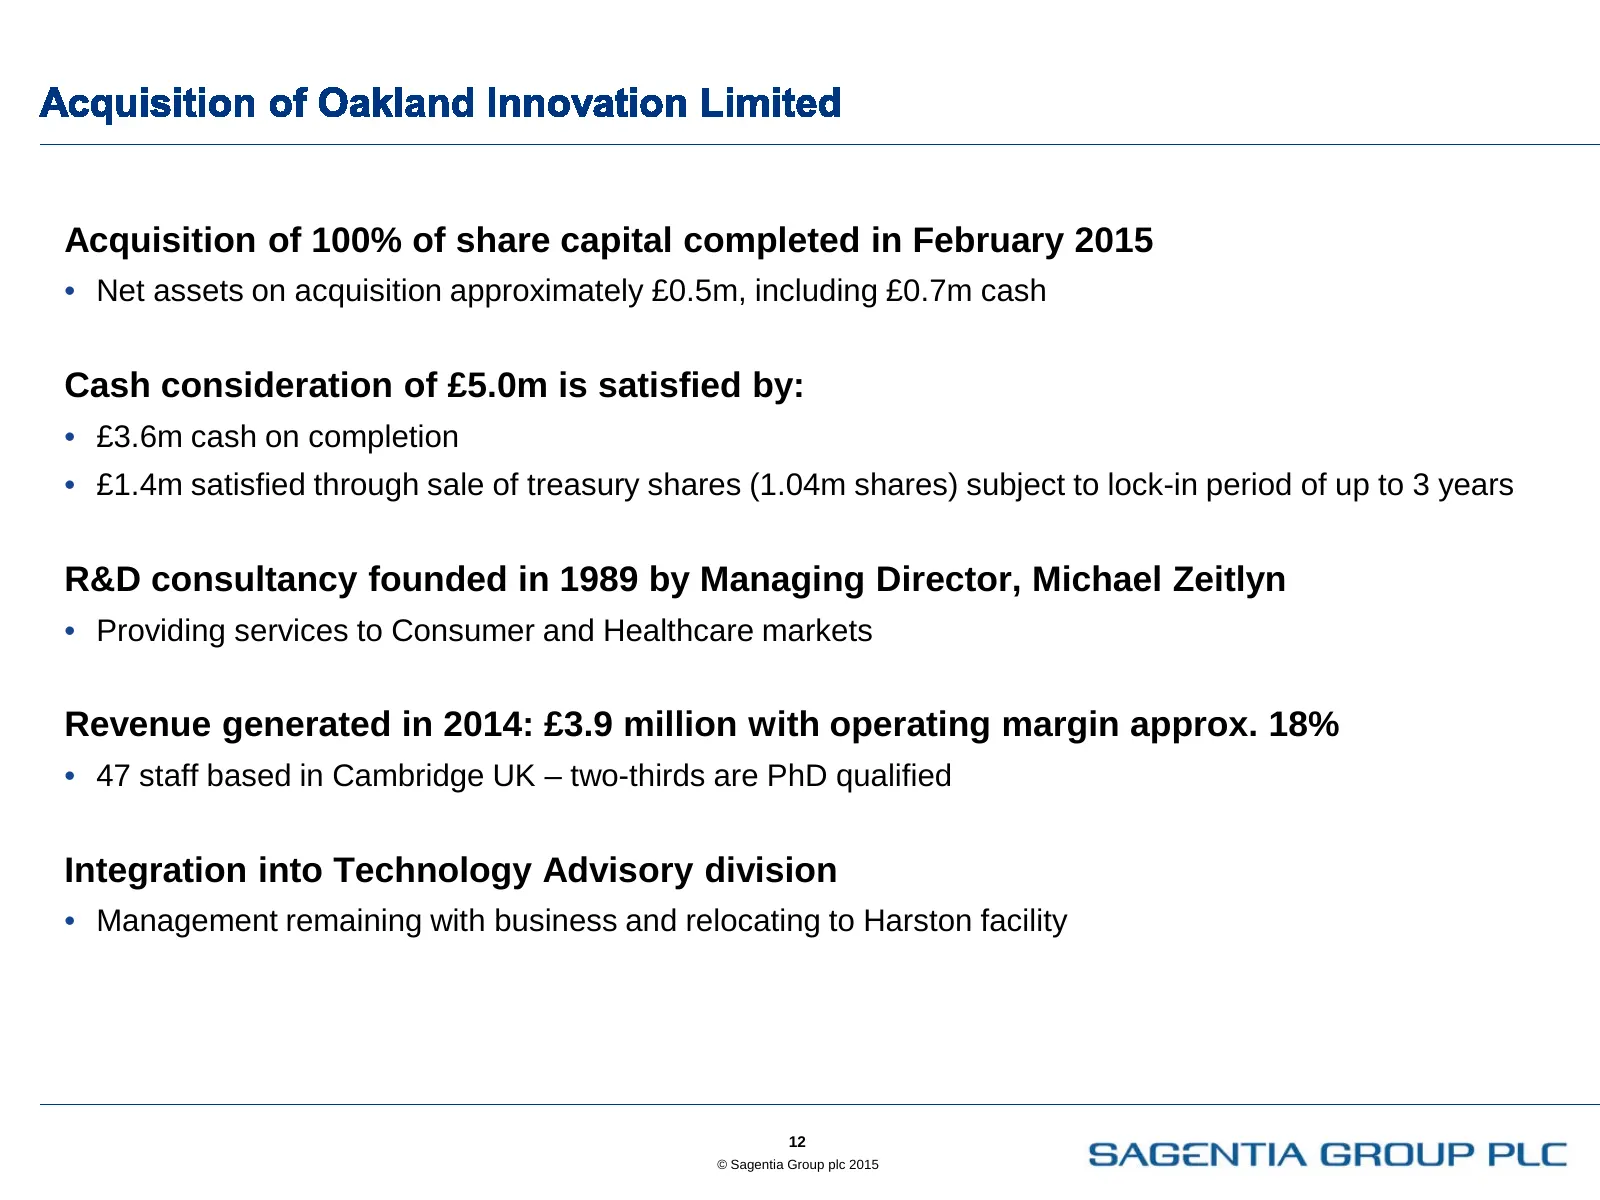
Slide 12: Acquisition of Oakland Innovation Limited
Acquisition of 100% of share capital completed in February 2015 • Net assets on acquisition approximately £0.5m, including £0.7m cash Cash consideration of £5.0m is satisfied by: • £3.6m cash on completion • £1.4m satisfied through sale of treasury shares (1.04m shares) subject to lock-in period of
Slide 13: Increasing dividend, buy-back programme and treasury shares
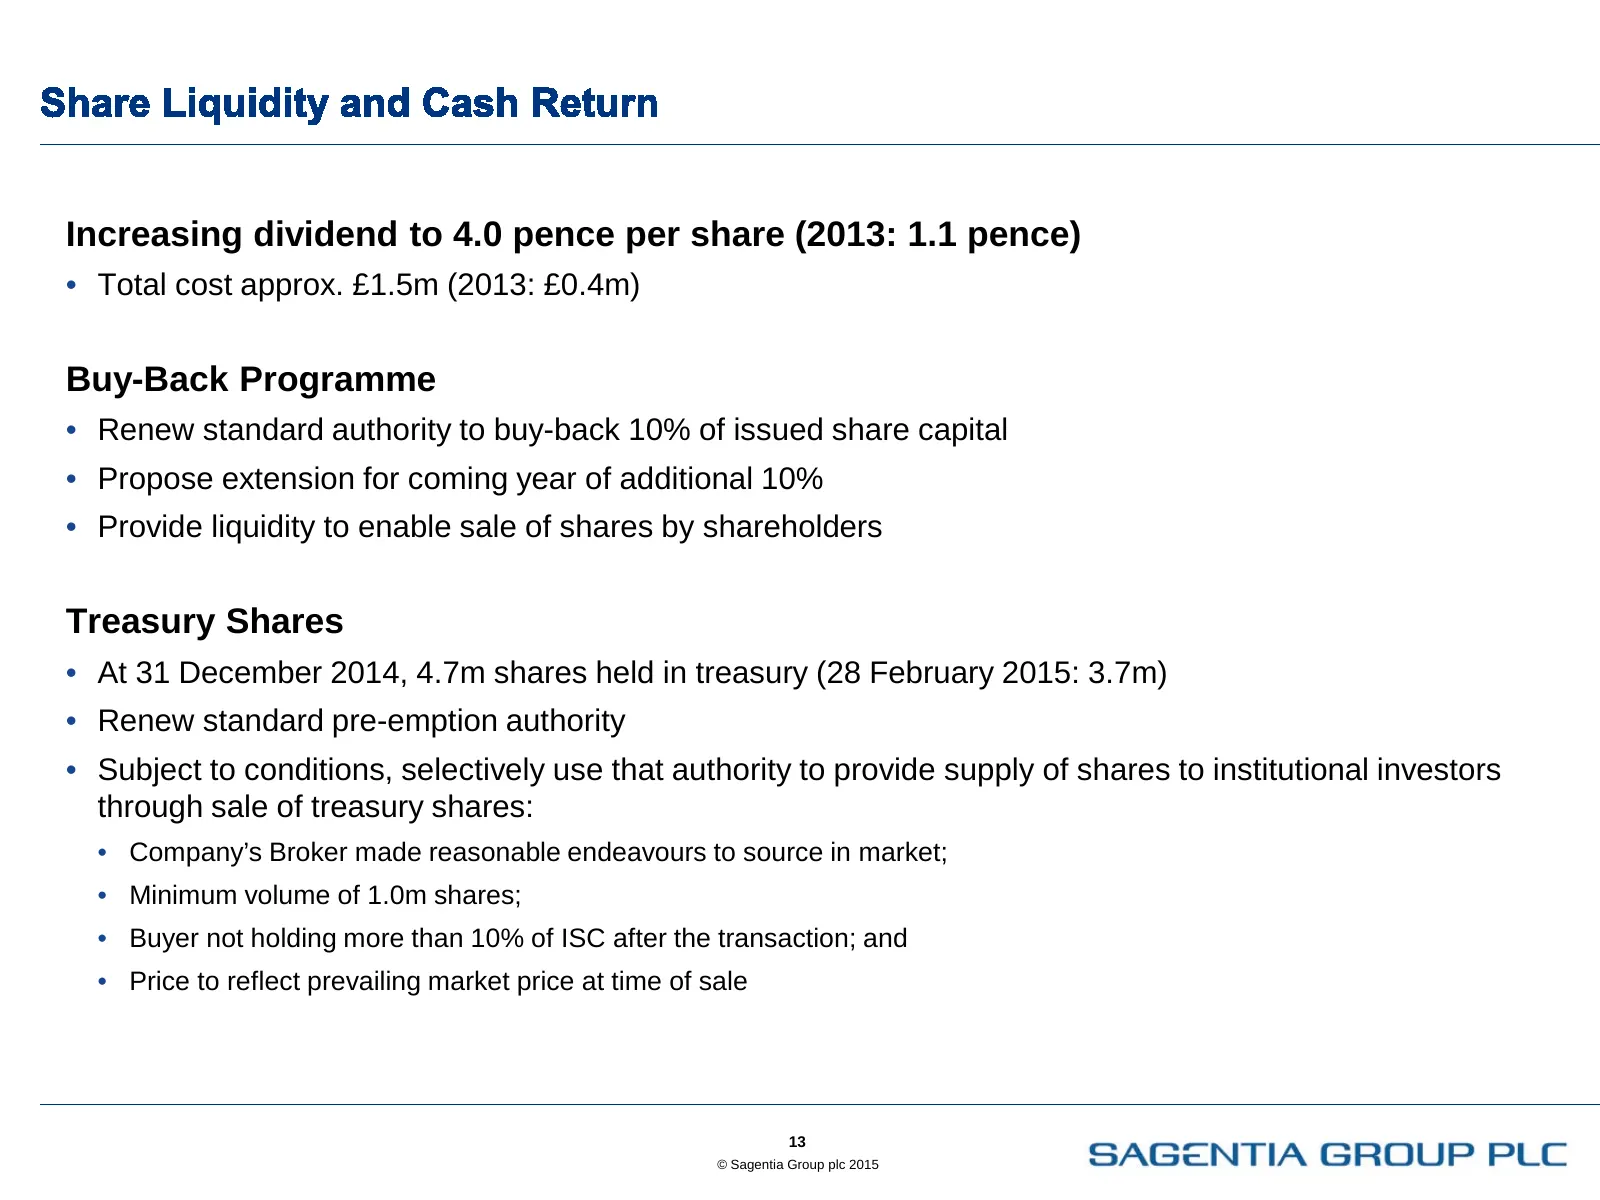
Increasing dividend to 4.0 pence per share (2013: 1.1 pence) • Total cost approx. £1.5m (2013: £0.4m) Buy-Back Programme • Renew standard authority to buy-back 10% of issued share capital • Propose extension for coming year of additional 10% • Provide liquidity to enable sale of shares by shareholde
Slide 14: Sagentia Group plc contact details
www.sagentia.com info@sagentia.com Sagentia is listed on the London Stock Exchange (SAG.L) SAGENTIA GROUP PLC
Source: Internet Archive copy of sciencegroup.com
More decks from Science Group PLC
 FY2025 Earnings Presentation18 slides · Mar 17, 2026
 Leatherhead Food Research — Technical Presentation (March 2026)37 slides · Mar 4, 2026
 H1 2025 Earnings Presentation12 slides · Jul 28, 2025
 FY2024 Earnings Presentation16 slides · Mar 24, 2025
 H1 2024 Earnings Presentation10 slides · Jul 23, 2024
 FY2023 Earnings Presentation19 slides · Mar 21, 2024