Cooper-Standard Holdings Inc. · NYSE:CPS
Cooper-Standard — Investor Day (September 2008)
44 slides from Cooper-Standard's investor day presentation, Sep 9, 2008
Slide 1: Investor Presentation / Update
Investor Presentation / Update September 9, 2008 New York City
Slide 2: Agenda
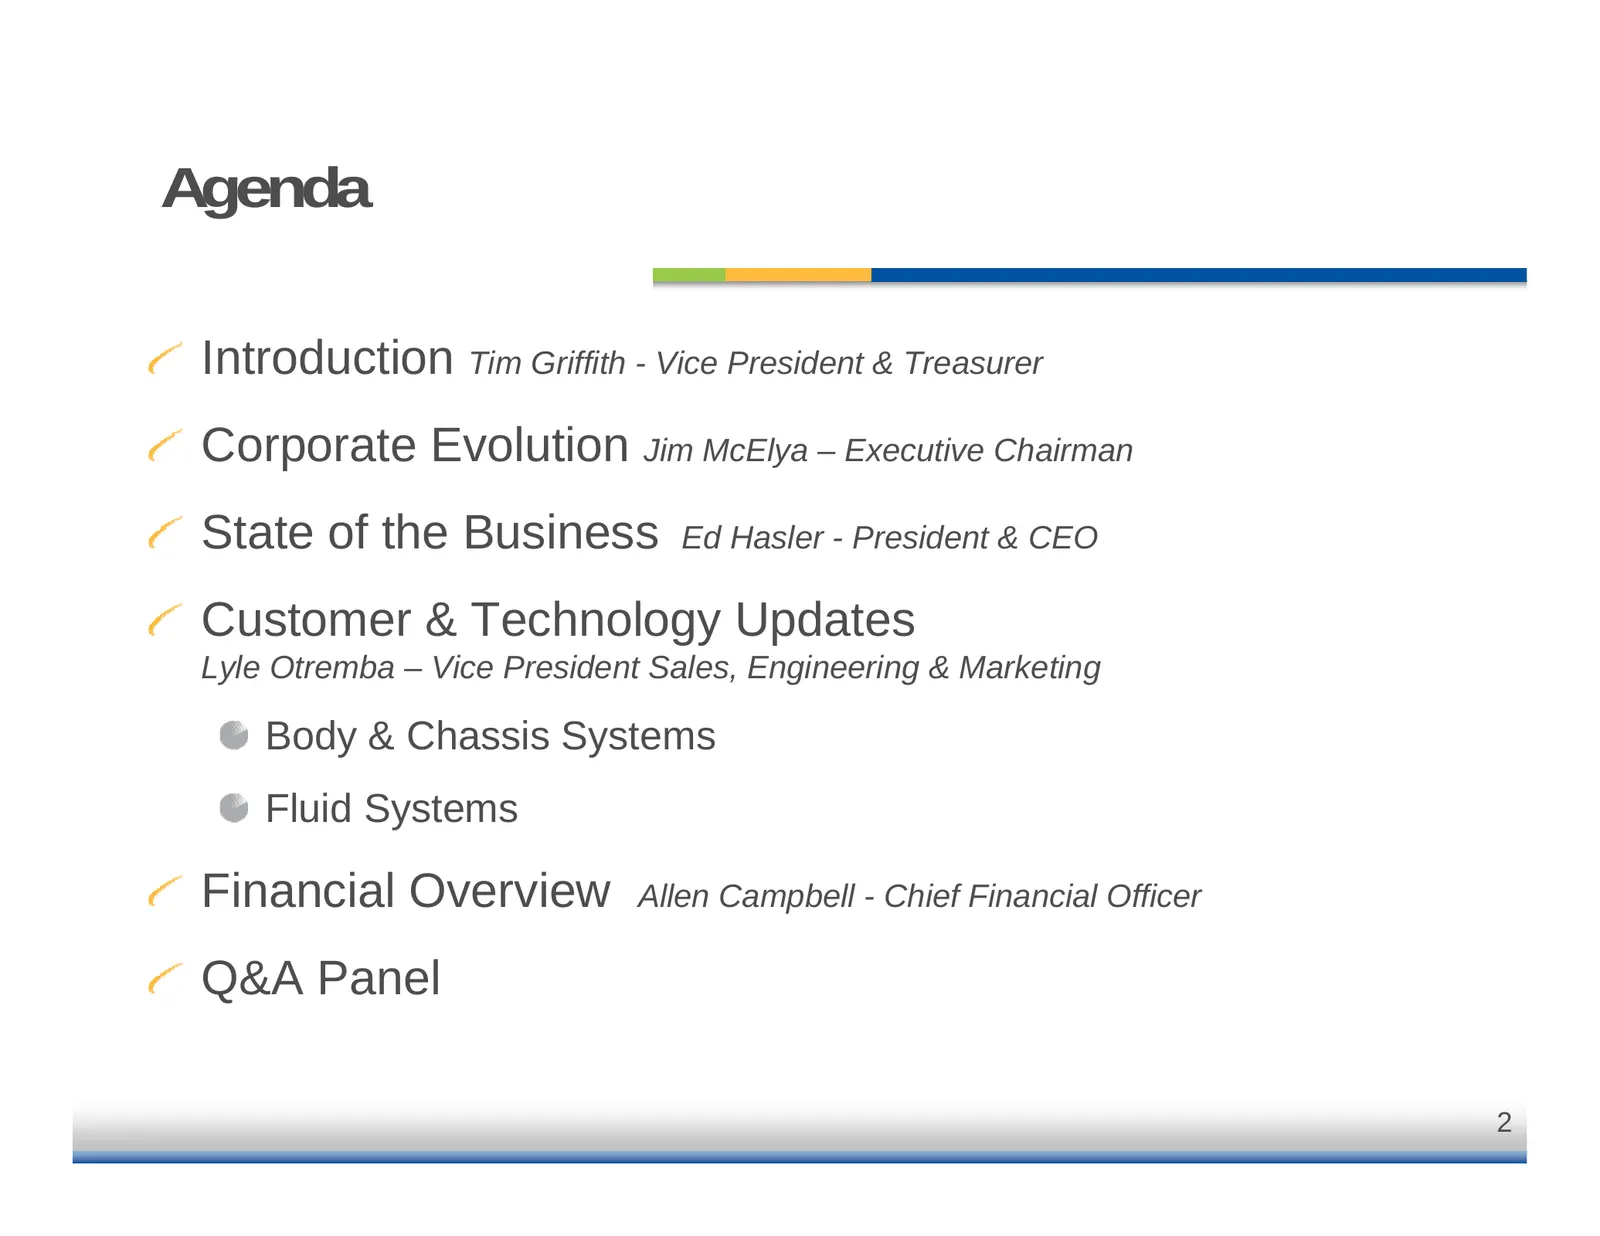
Agenda Introduction Tim Griffith - Vice President & Treasurer Corporate Evolution Jim McElya – Executive Chairman State of the Business Ed Hasler - President & CEO Customer & Technology Updates Lyle Otremba – Vice President Sales, Engineering & Marketing Body & Chassis Systems Fluid Systems Financia
Slide 3: Corporate Evolution
Corporate Evolution Jim McElya Executive Chairman
Slide 4: Revenue Growth
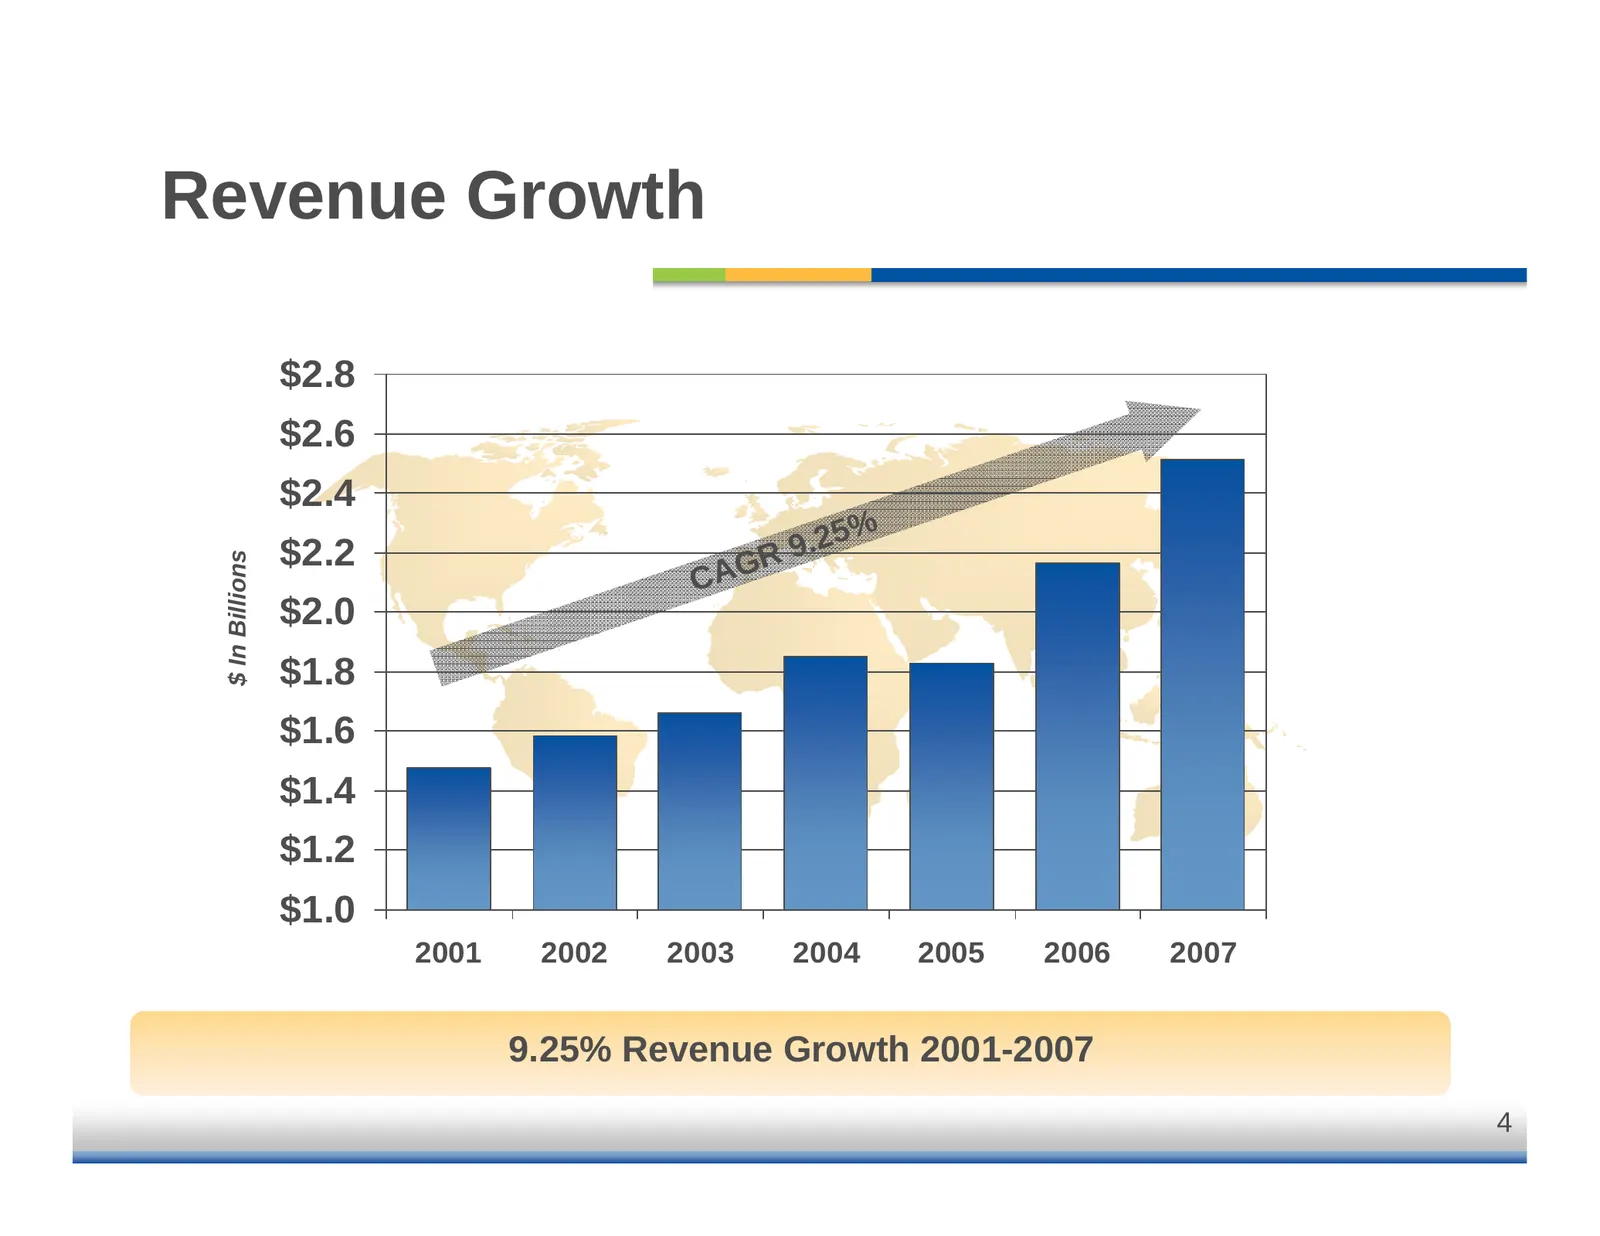
Revenue Growth $2.8 $2.6 $2.4 $2.2 9. 25% R $ In Billions CAG $2.0 $1.8 $1.6 $1.4 $1.2 $1.0 2001 2002 2003 2004 2005 2006 2007 9.25% Revenue Growth 2001-2007 4
Slide 5: History & Corporate Development
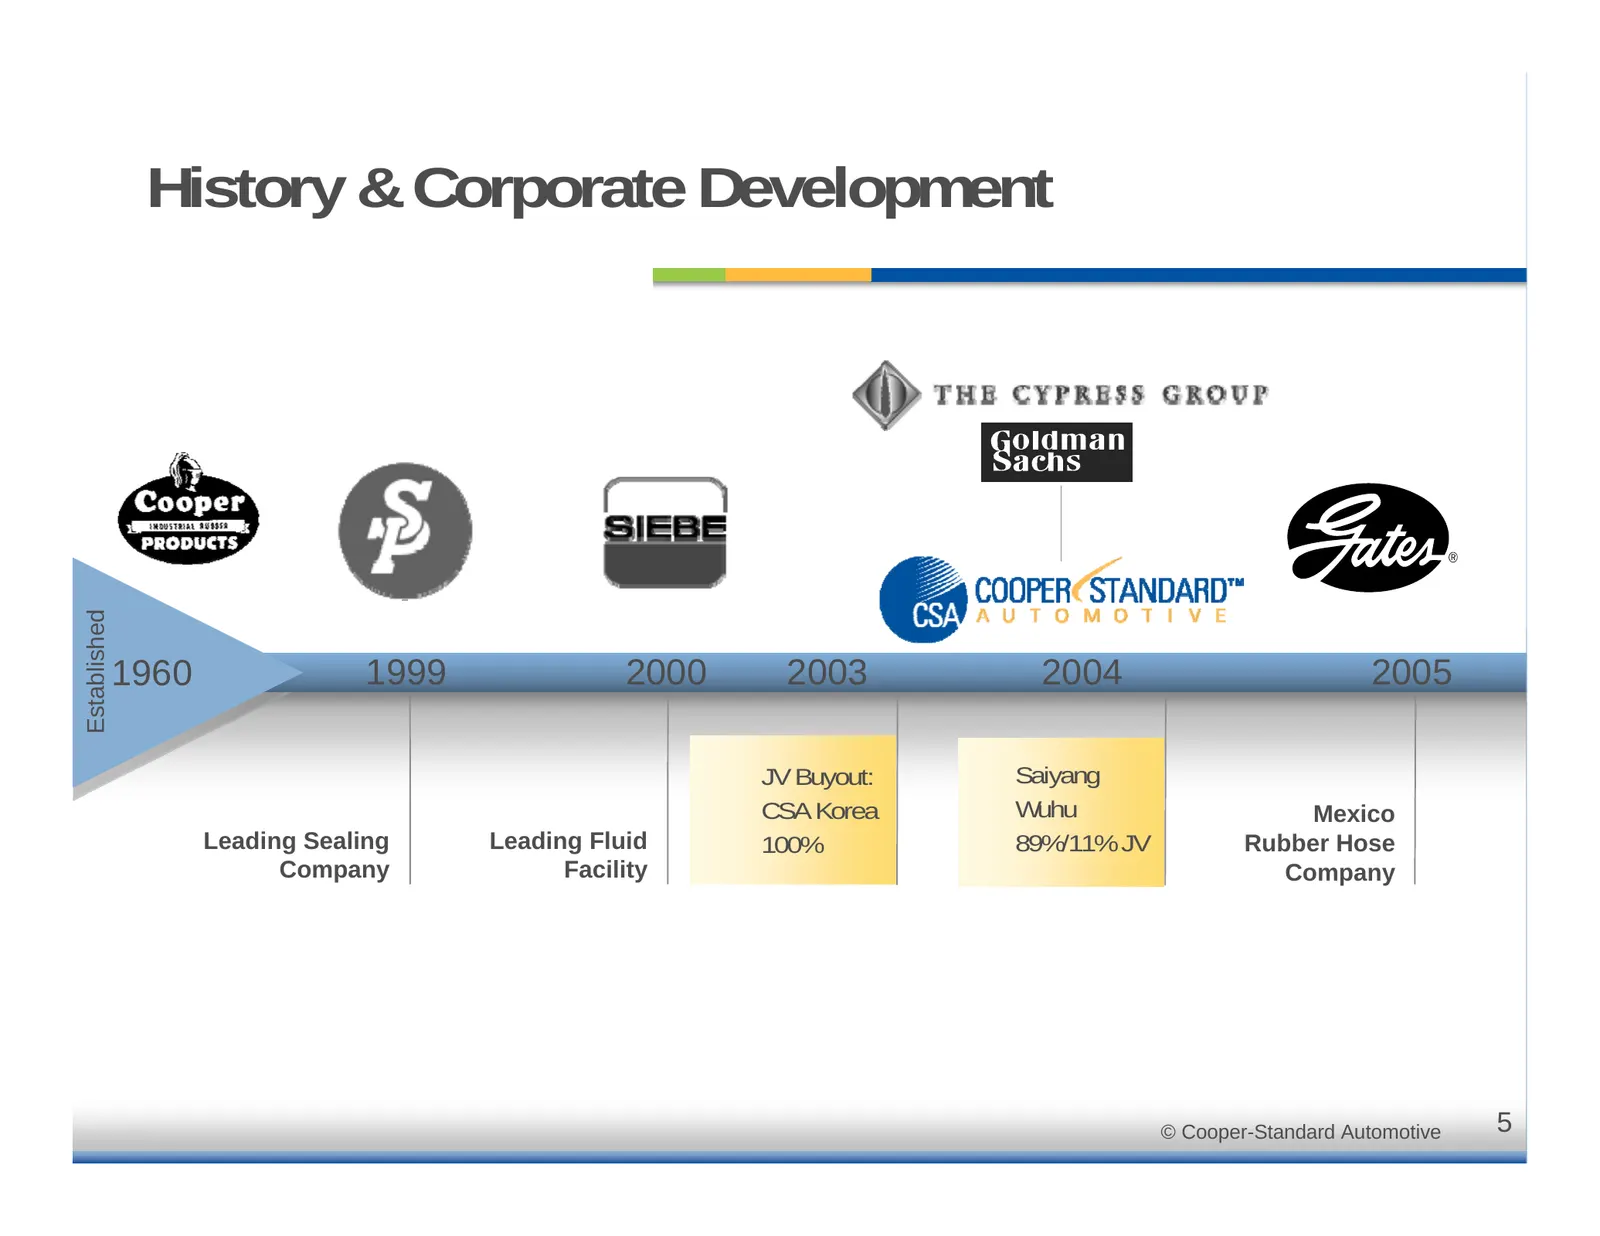
History & Corporate Development Established 1960 1999 2000 2003 2004 2005 JV Buyout: Saiyang CSA Korea Wuhu Mexico Leading Sealing Leading Fluid 100% 89%/11% JV Rubber Hose Company Facility Company © Cooper-Standard Automotive 5
Slide 6: History & Corporate Development
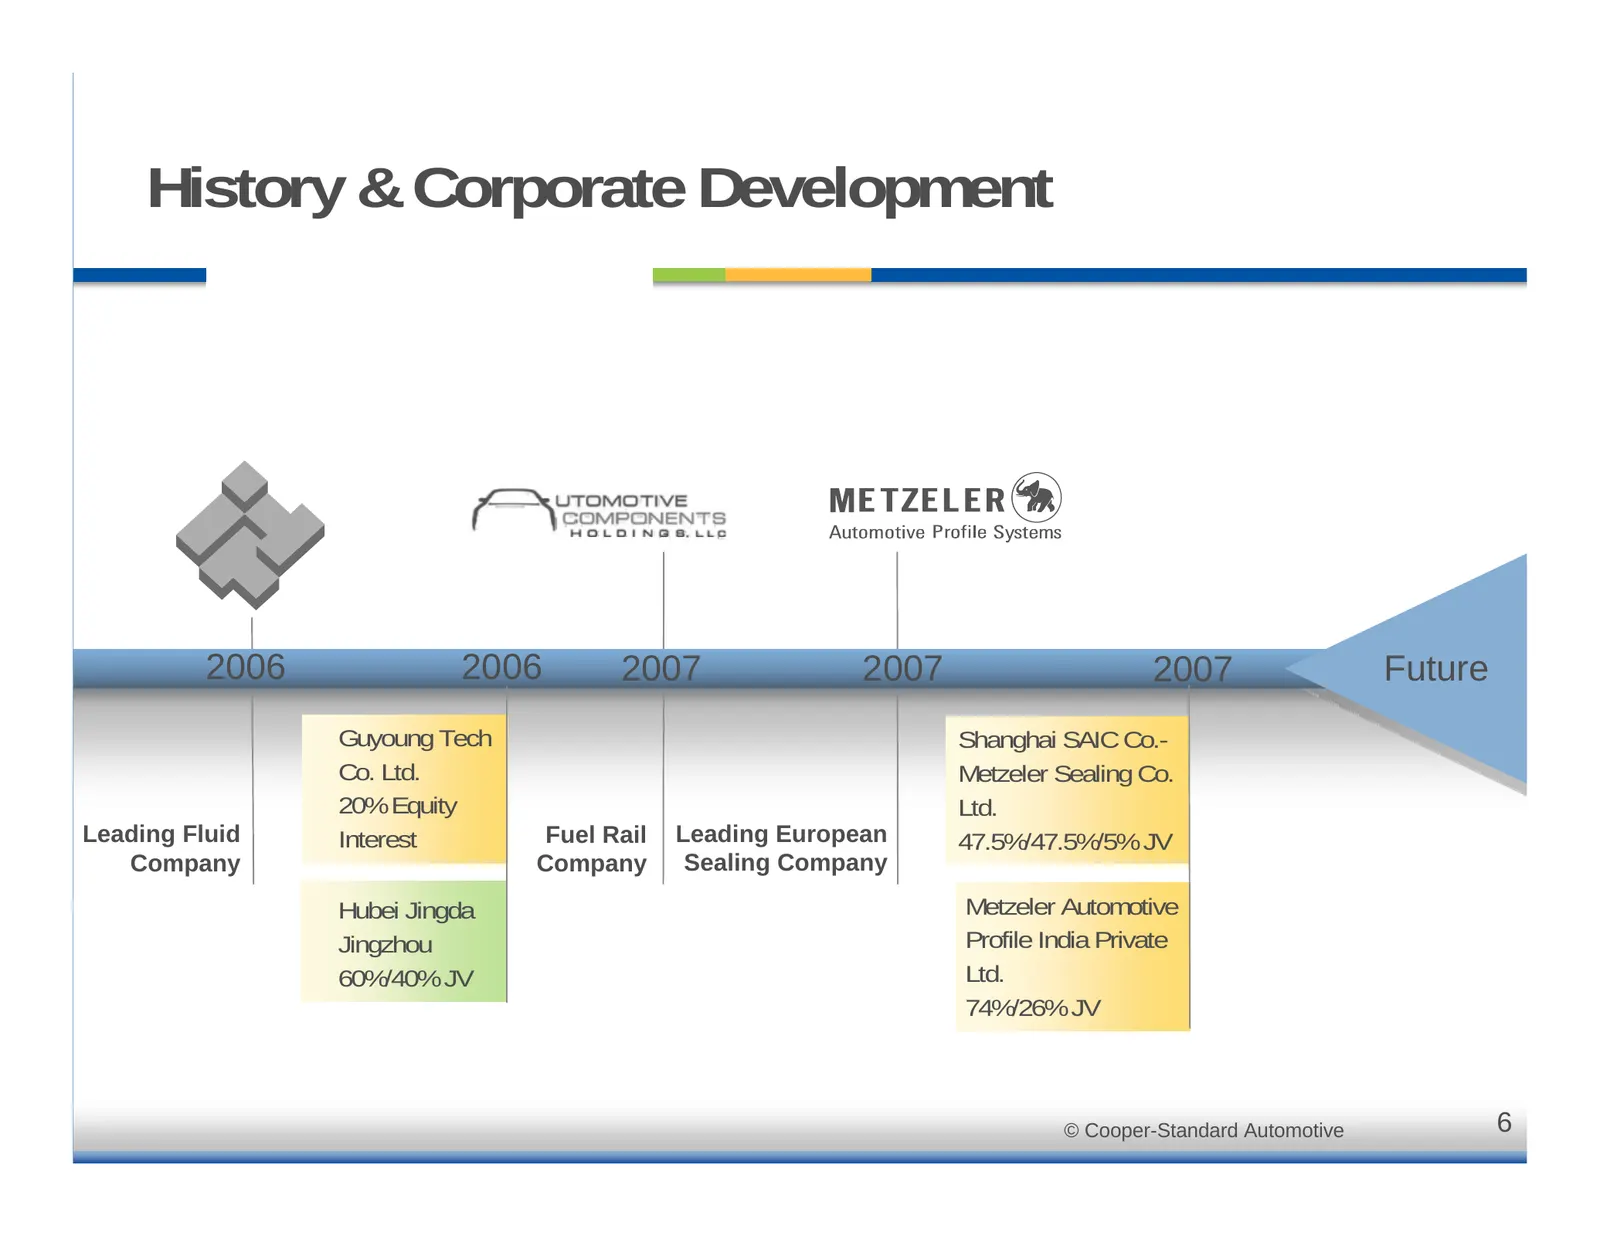
History & Corporate Development 2006 2006 2007 2007 2007 Future Guyoung Tech Shanghai SAIC Co.- Co. Ltd. Metzeler Sealing Co. 20% Equity Ltd. Leading Fluid Interest Fuel Rail Leading European 47.5%/47.5%/5% JV Company Company Sealing Company Hubei Jingda Metzeler Automotive Jingzhou Profile India Pr
Slide 7: Products & Segments
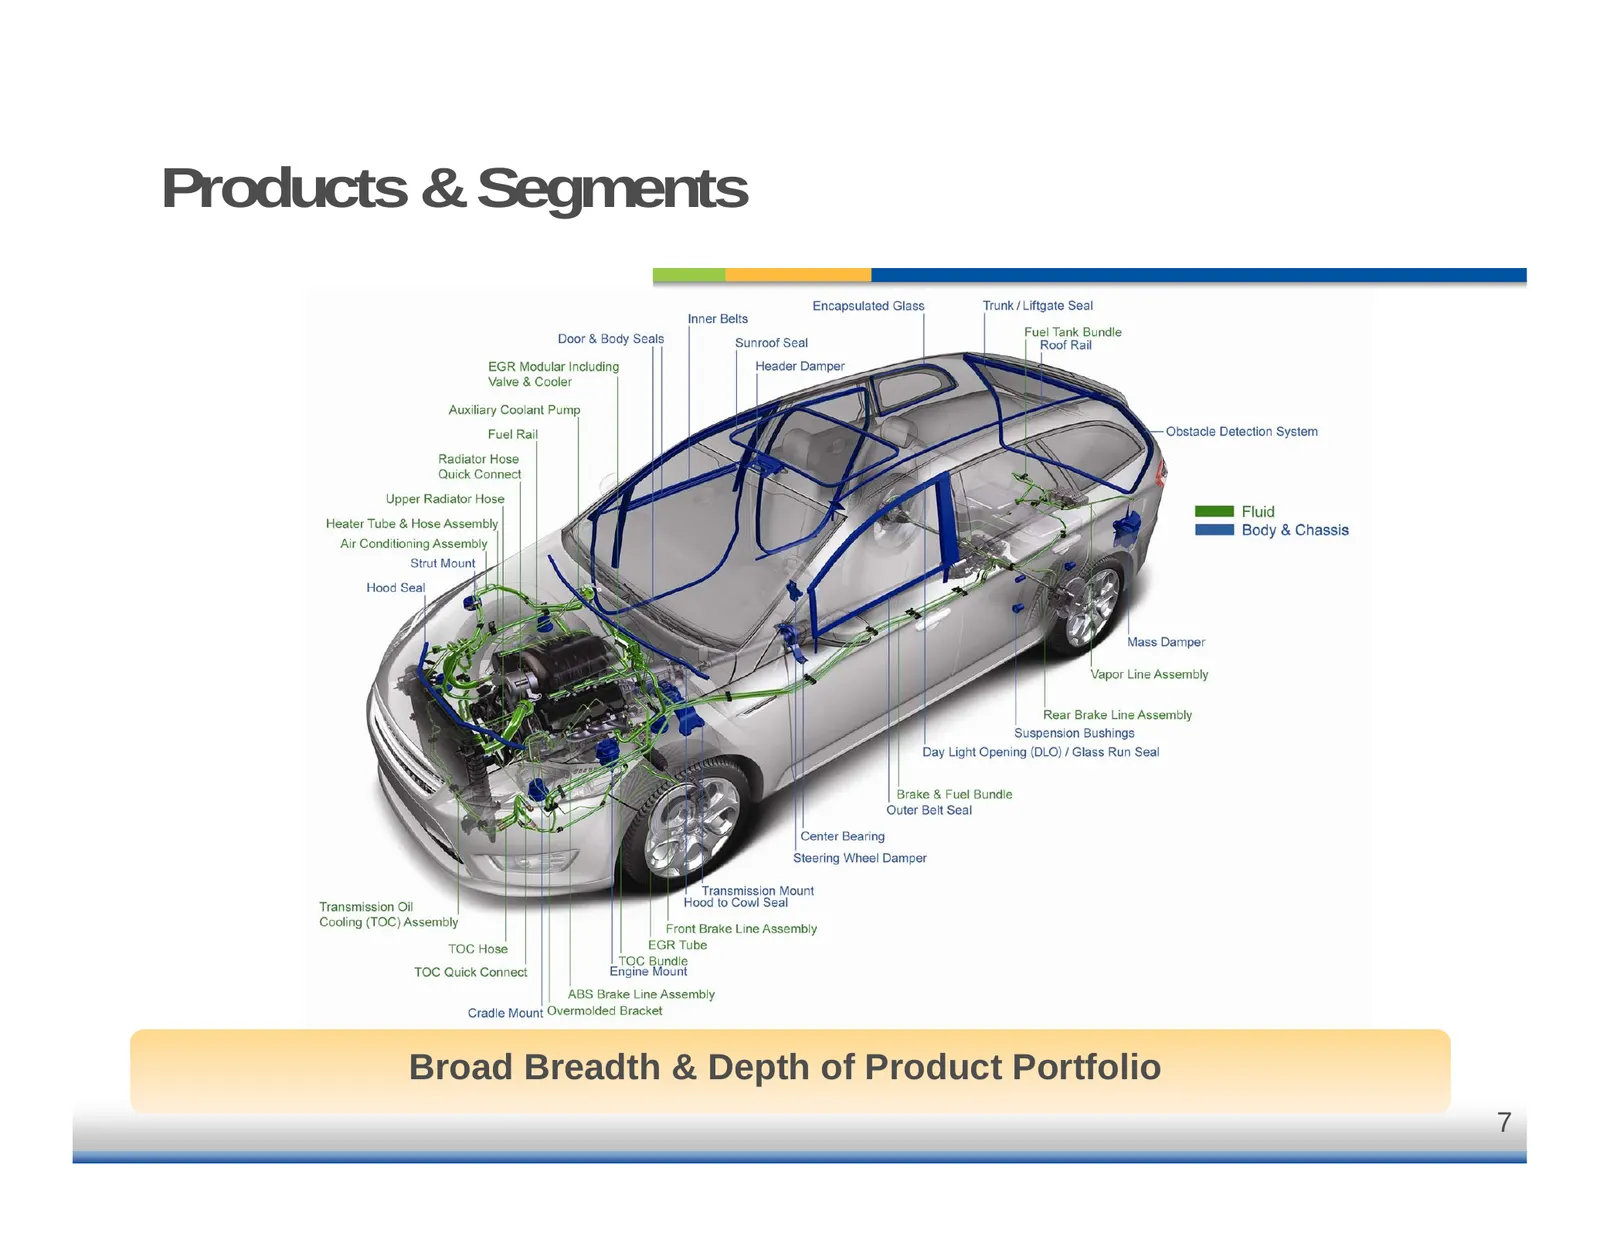
Products & Segments Broad Breadth & Depth of Product Portfolio 7
Slide 8: CSA Global Footprint
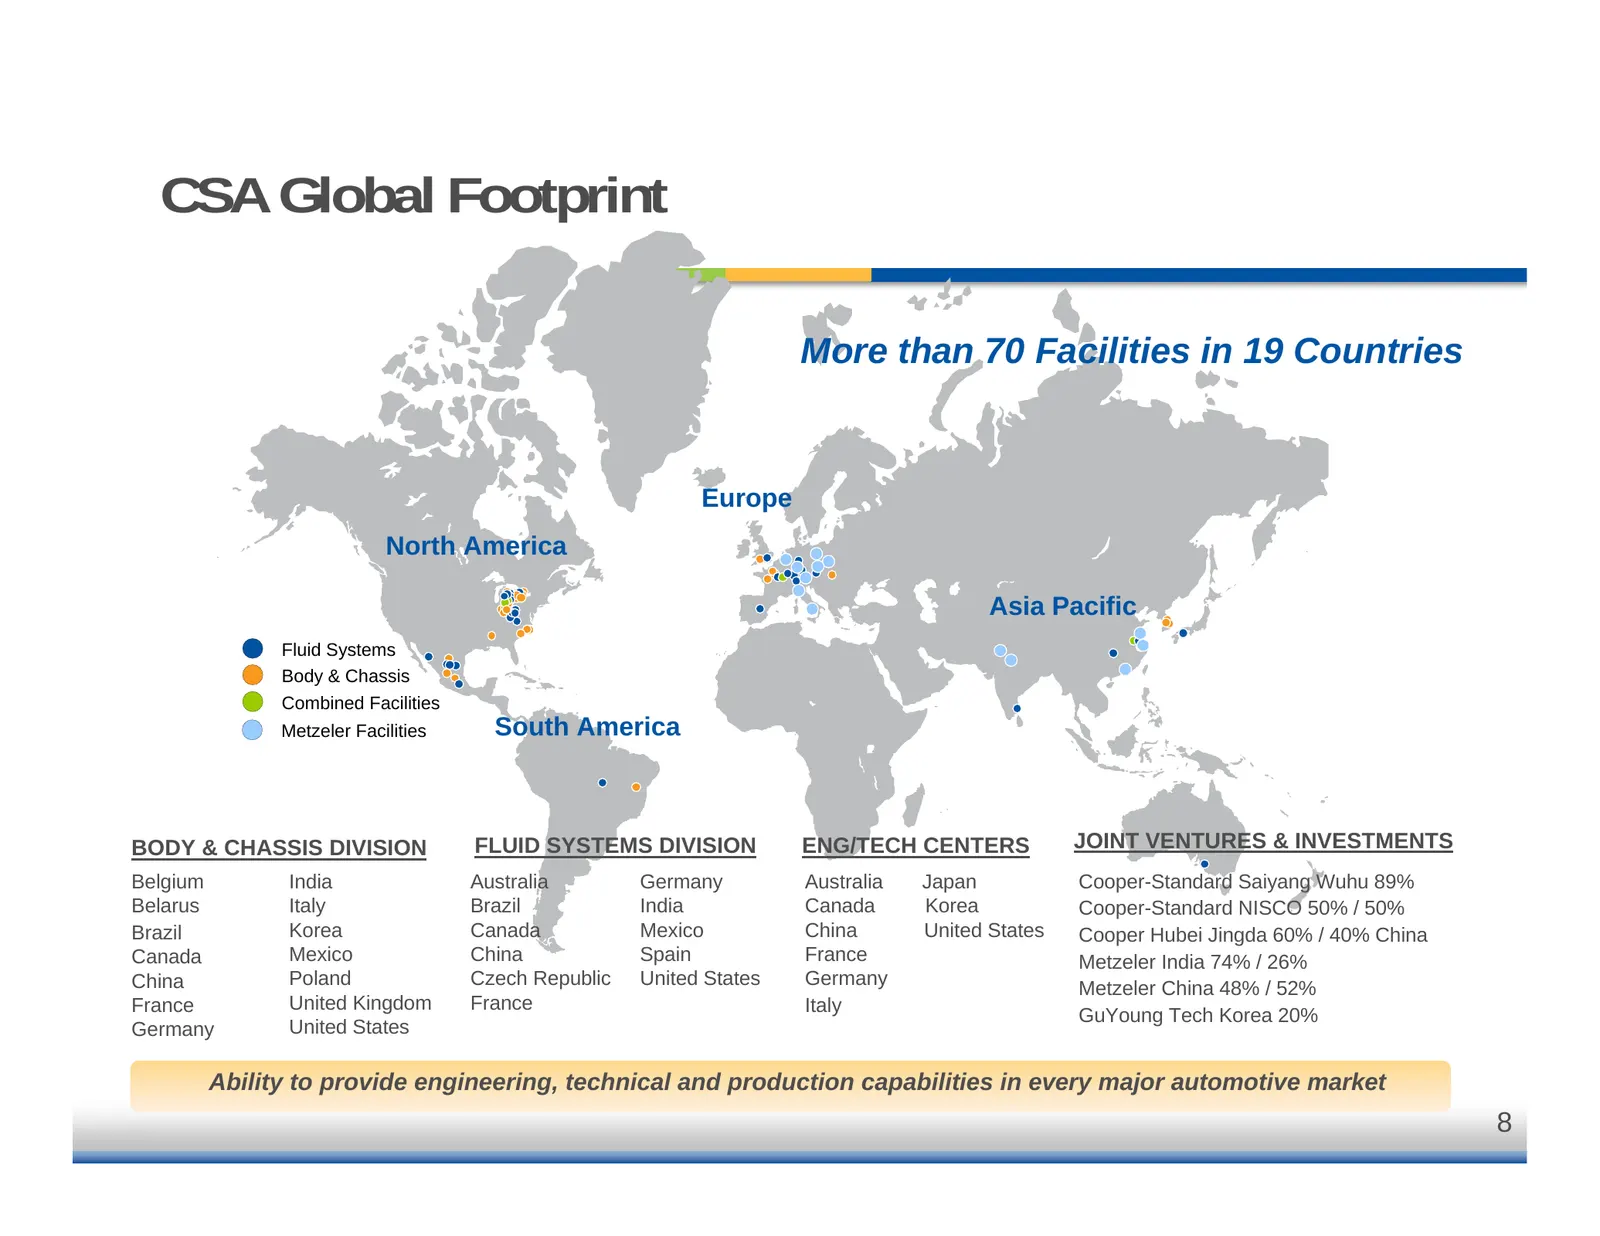
CSA Global Footprint More than 70 Facilities in 19 Countries Europe North America Asia Pacific Fluid Systems Body & Chassis Combined Facilities Metzeler Facilities South America BODY & CHASSIS DIVISION FLUID SYSTEMS DIVISION ENG/TECH CENTERS JOINT VENTURES & INVESTMENTS Belgium India Australia Germa
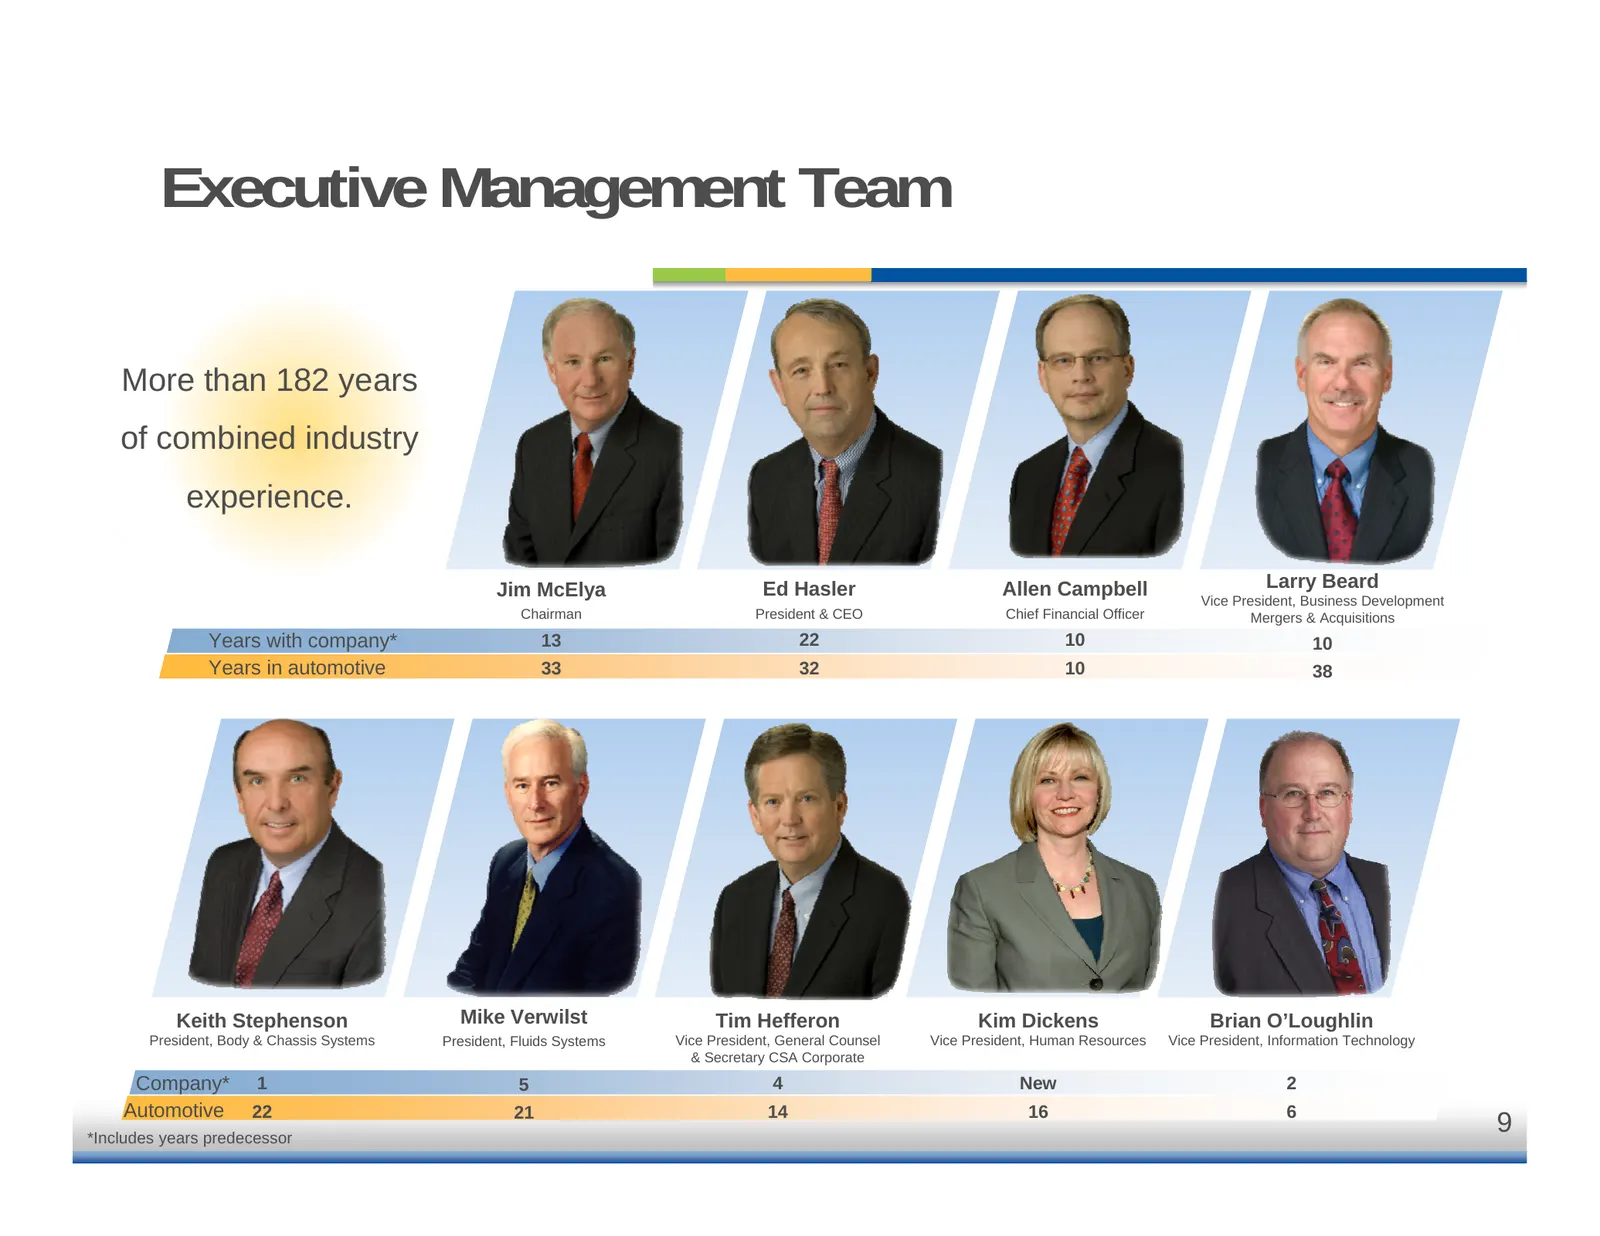
Slide 9: Executive Management Team
Executive Management Team More than 182 years of combined industry experience. Jim McElya Ed Hasler Allen Campbell Larry Beard Vice President, Business Development Chairman President & CEO Chief Financial Officer Mergers & Acquisitions Years with company* 13 22 10 10 Years in automotive 33 32 10 38
Slide 10: Corporate Evolution Summary
Corporate Evolution Summary Cooper-Standard is the result of a blending several strong companies into one major player Created product portfolio which positions the company as #1 or #2 in its markets Global supplier with ability to serve every major auto market in the world Strong and experienced ma
Slide 11: State of the Business & Strategic Focus
State of the Business & Strategic Focus Ed Hasler President and CEO
Slide 12: Cooper-Standard Automotive Mission Statement
Cooper-Standard Automotive Mission Statement Expand our leadership position in the global automotive industry by creating innovative solutions and long term value for our stakeholders. 12
Slide 13: Cooper-Standard Automotive Value Statements
Cooper-Standard Automotive Value Statements We create value through innovative solutions We are committed to our customers We strive to continuously improve We encourage teamwork and mutual respect We have a bias for action and superior performance We act with integrity in everything we do We are go
Slide 14: State of the Automotive Industry
State of the Automotive Industry Difficult environment in North America Sales levels and consumer confidence Production levels and product mix Cautious on Europe and Asia Commodity prices Overall customer trend towards global vehicle platforms 14
Slide 15: Global Production Trends
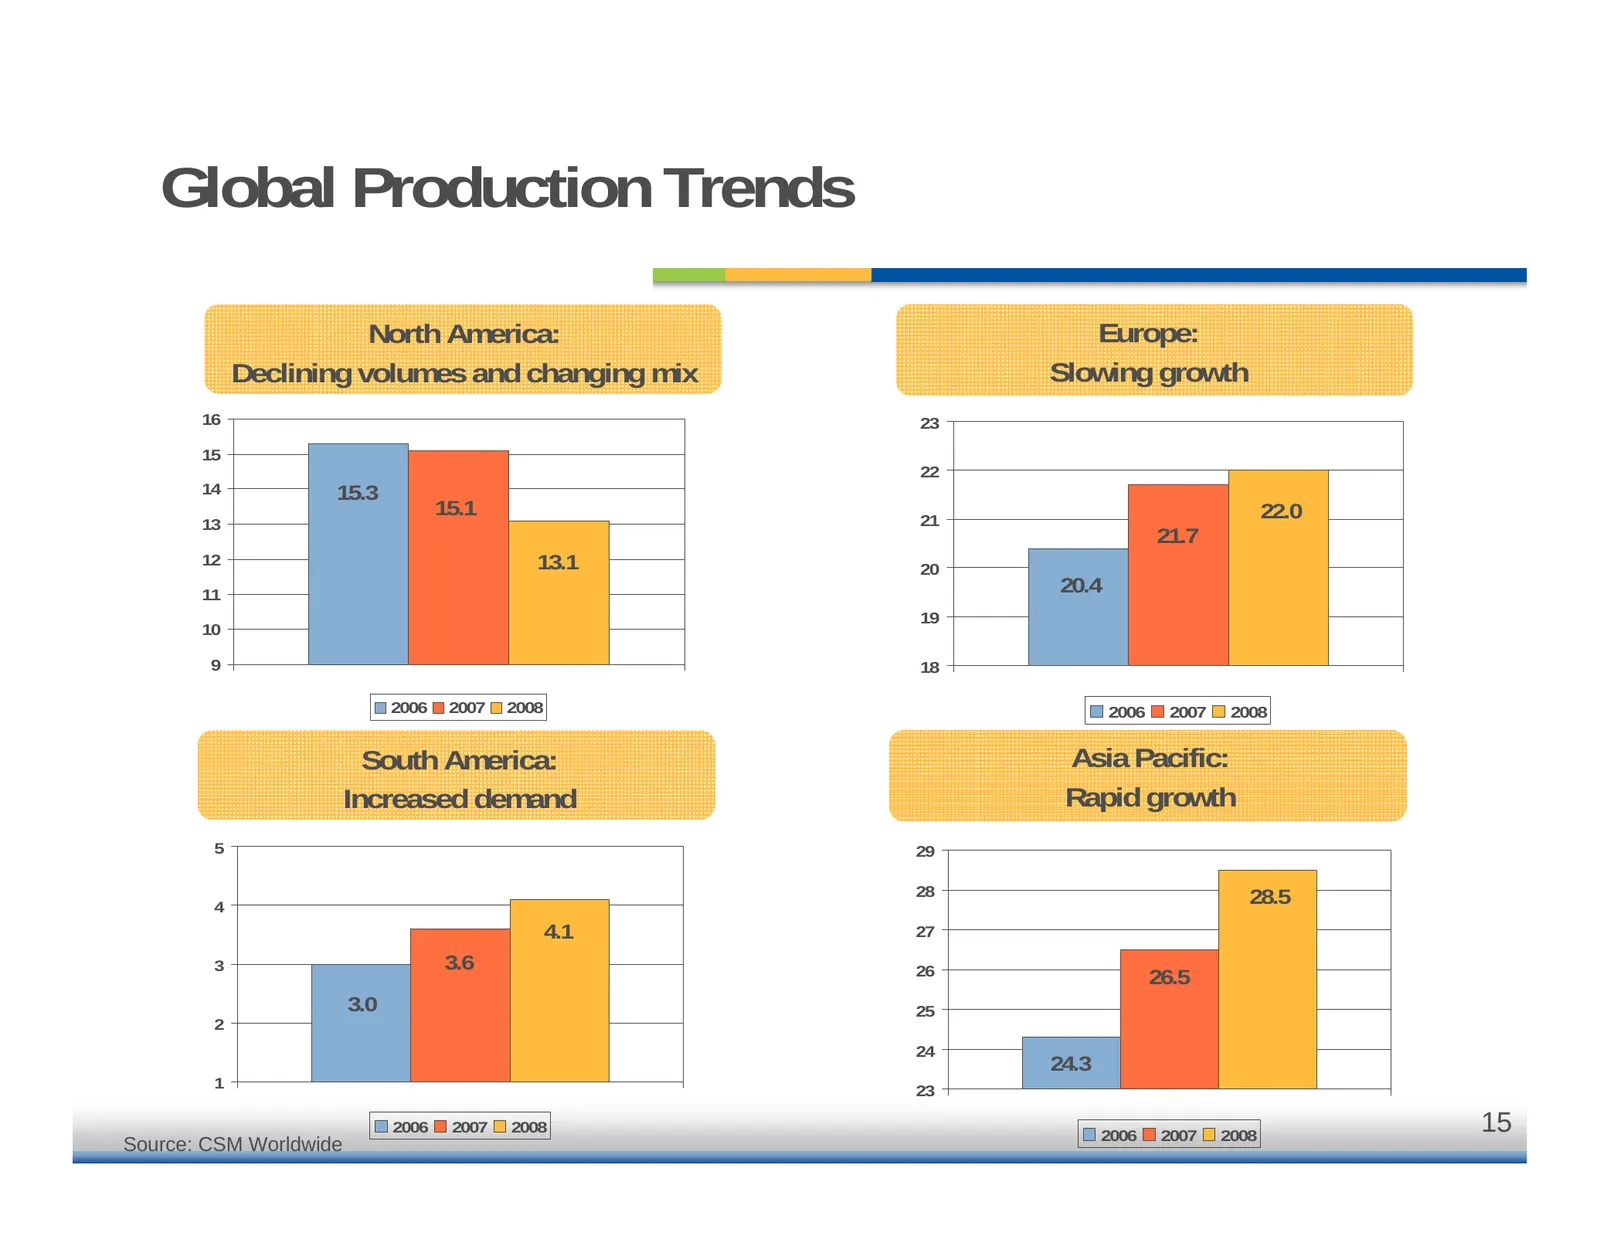
Global Production Trends North America: Europe: Declining volumes and changing mix Slowing growth 16 23 15 22 14 15.3 15.1 21 22.0 13 21.7 12 13.1 20 11 20.4 19 10 9 18 2006 2007 2008 2006 2007 2008 South America: Asia Pacific: Increased demand Rapid growth 5 29 28 28.5 4 4.1 27 3 3.6 26 26.5 3.0 25
Slide 16: Strategic Initiatives
Strategic Initiatives Customer mix and geographic diversification Targeting large volume global programs Provider of innovative solutions with global capabilities leading to new and conquest business CSA providing products to support future technology trends 16
Slide 17: Customer Mix Development
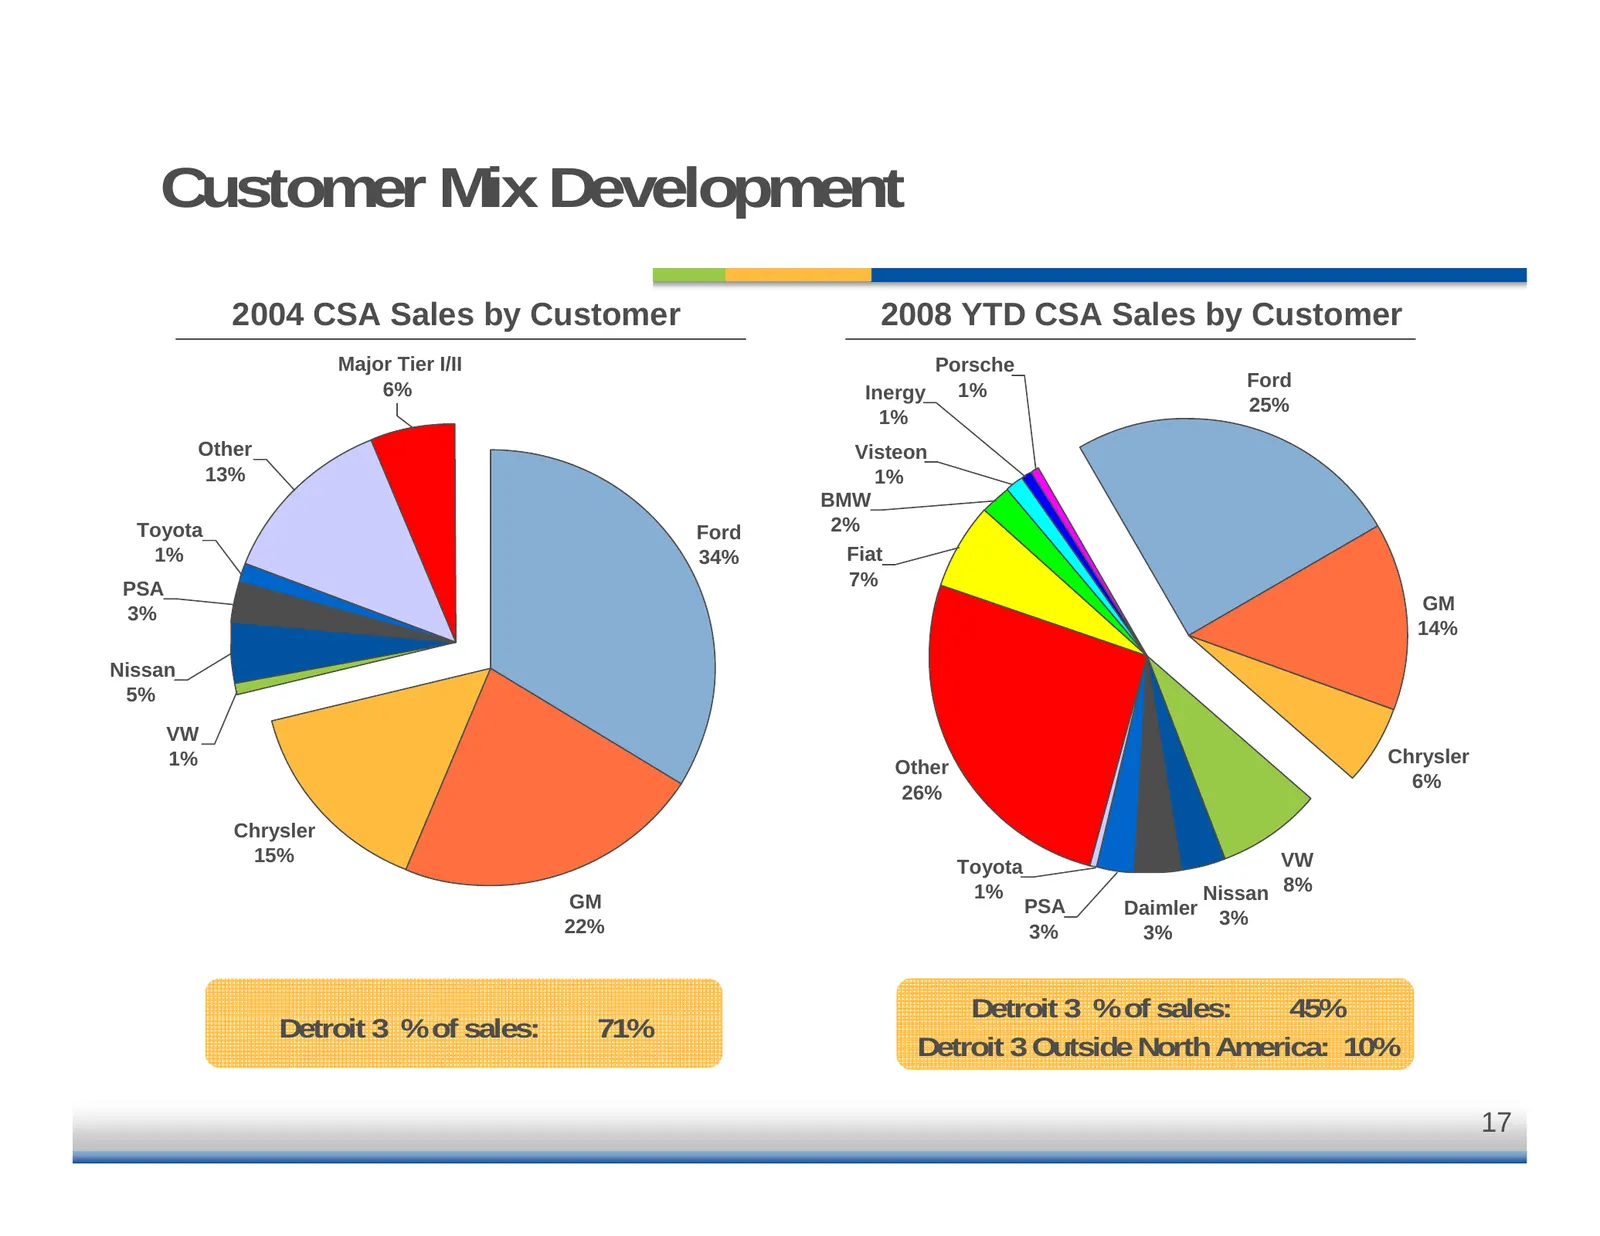
Customer Mix Development 2004 CSA Sales by Customer 2008 YTD CSA Sales by Customer Major Tier I/II Porsche 6% Ford Inergy 1% 25% 1% Other Visteon 13% 1% BMW Toyota Ford 2% 1% 34% Fiat PSA 7% 3% GM 14% Nissan 5% VW 1% Chrysler Other 6% 26% Chrysler 15% VW Toyota GM 1% Nissan 8% PSA Daimler 22% 3% 3%
Slide 18: Geographic Sales Development
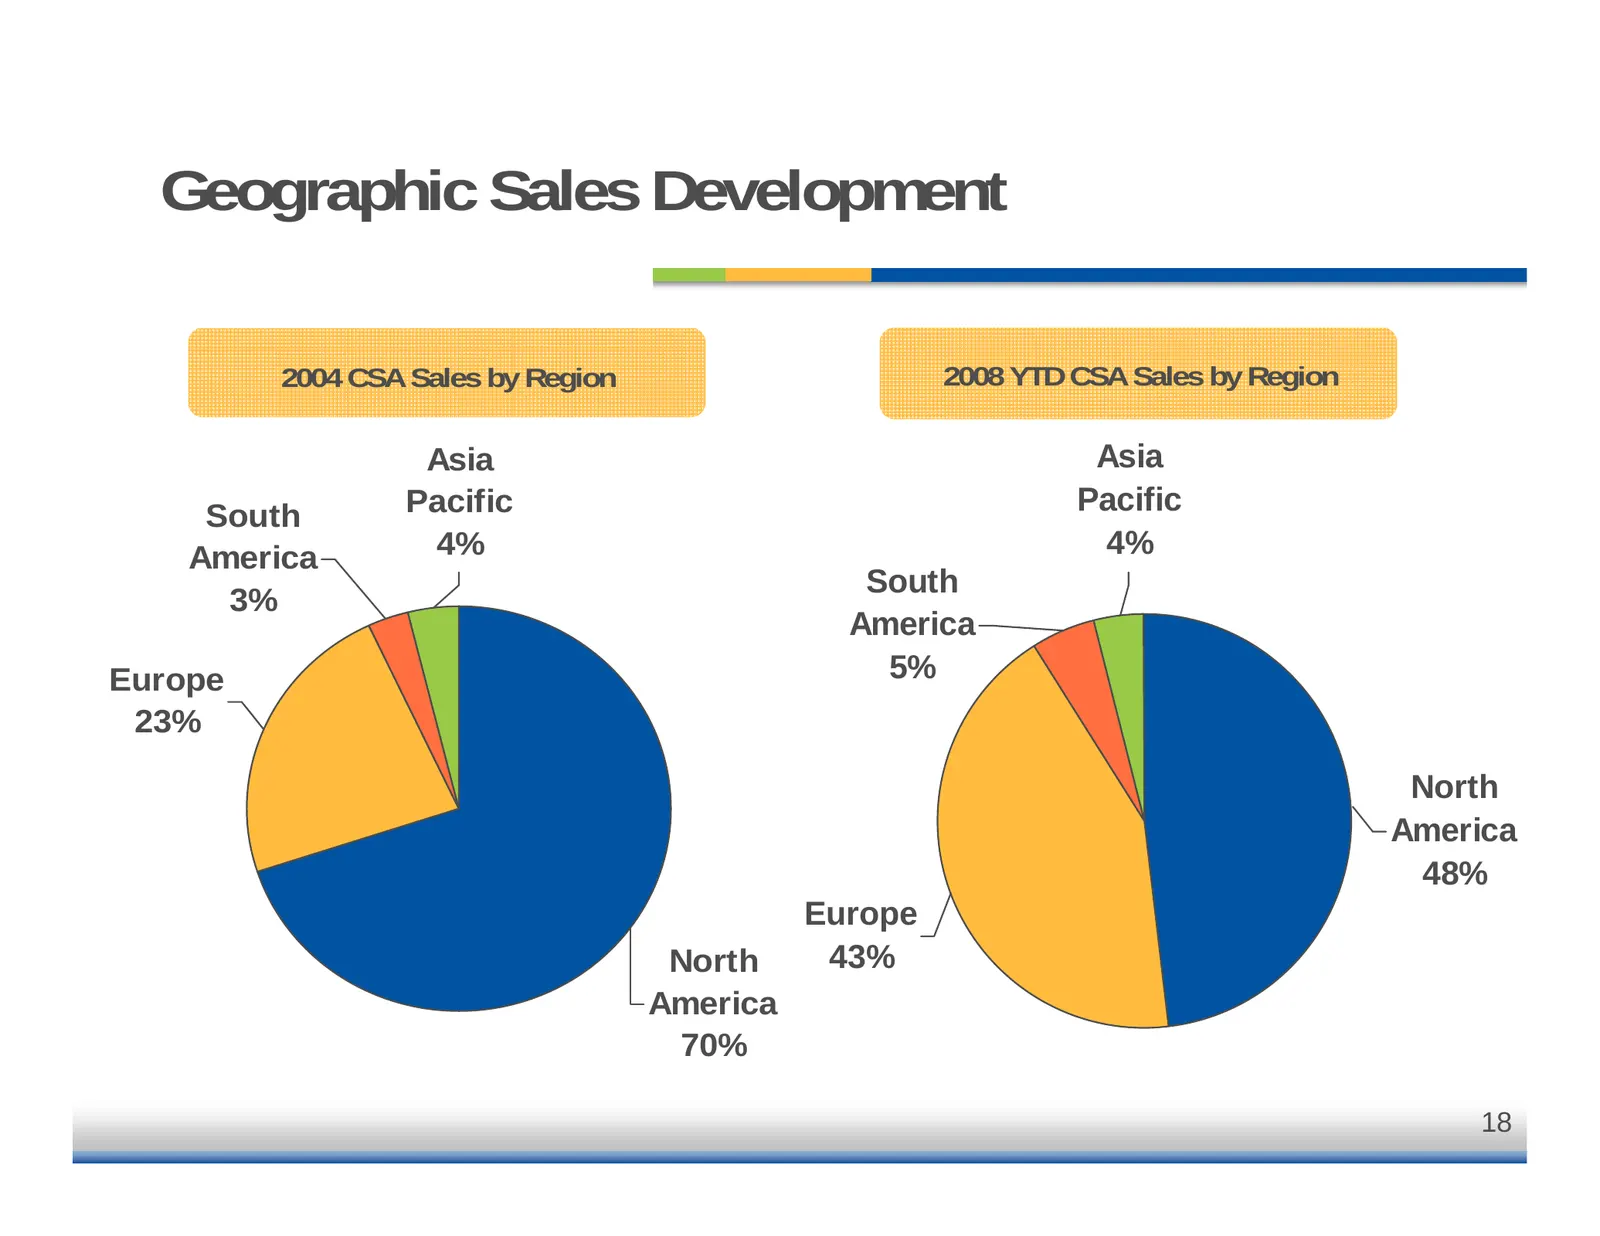
Geographic Sales Development 2004 CSA Sales by Region 2008 YTD CSA Sales by Region Asia Asia South Pacific Pacific America 4% 4% South 3% America Europe 5% 23% North America 48% Europe North 43% America 70% 18
Slide 19: Top Platforms by 2Q-2008 Revenue
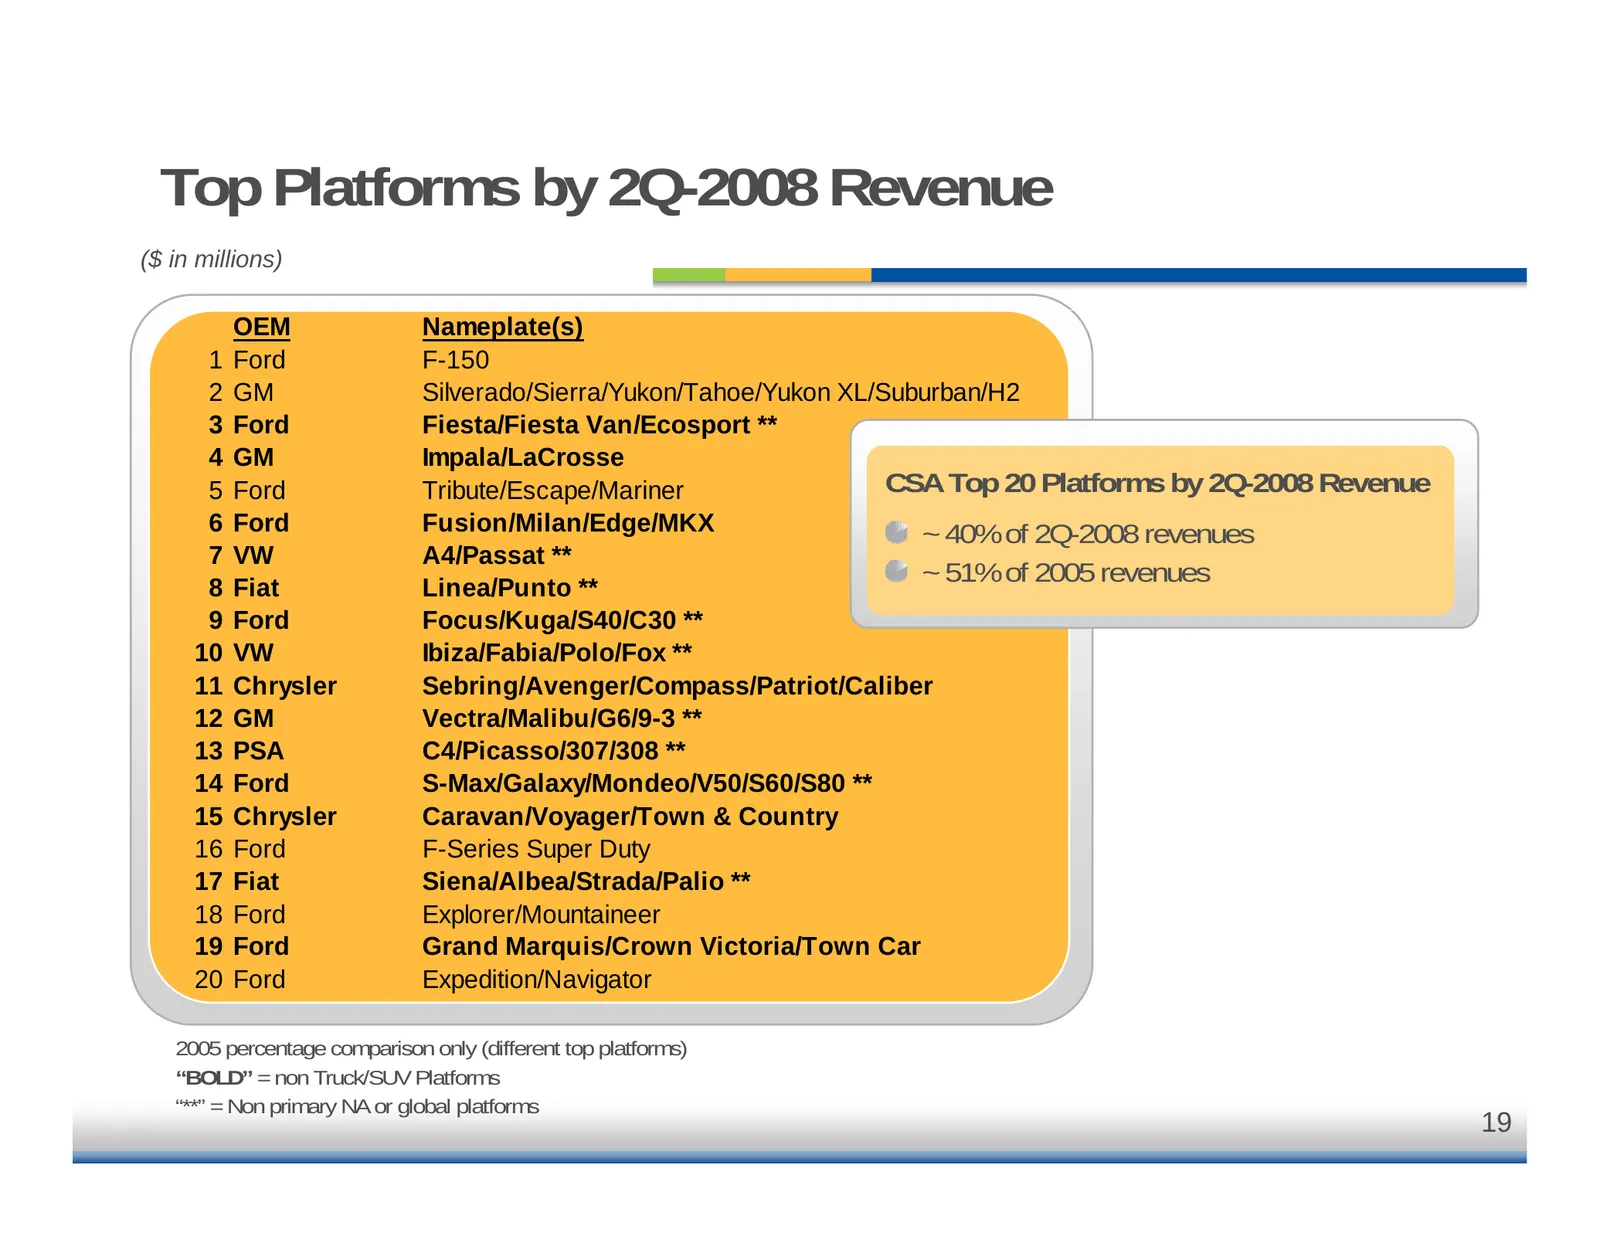
Top Platforms by 2Q-2008 Revenue ($ in millions) OEM Nameplate(s) 1 Ford F-150 2 GM Silverado/Sierra/Yukon/Tahoe/Yukon XL/Suburban/H2 3 Ford Fiesta/Fiesta Van/Ecosport ** 4 GM Impala/LaCrosse 5 Ford Tribute/Escape/Mariner CSA Top 20 Platforms by 2Q-2008 Revenue 6 Ford Fusion/Milan/Edge/MKX ~ 40% of
Slide 20: Customer Platform Globalization
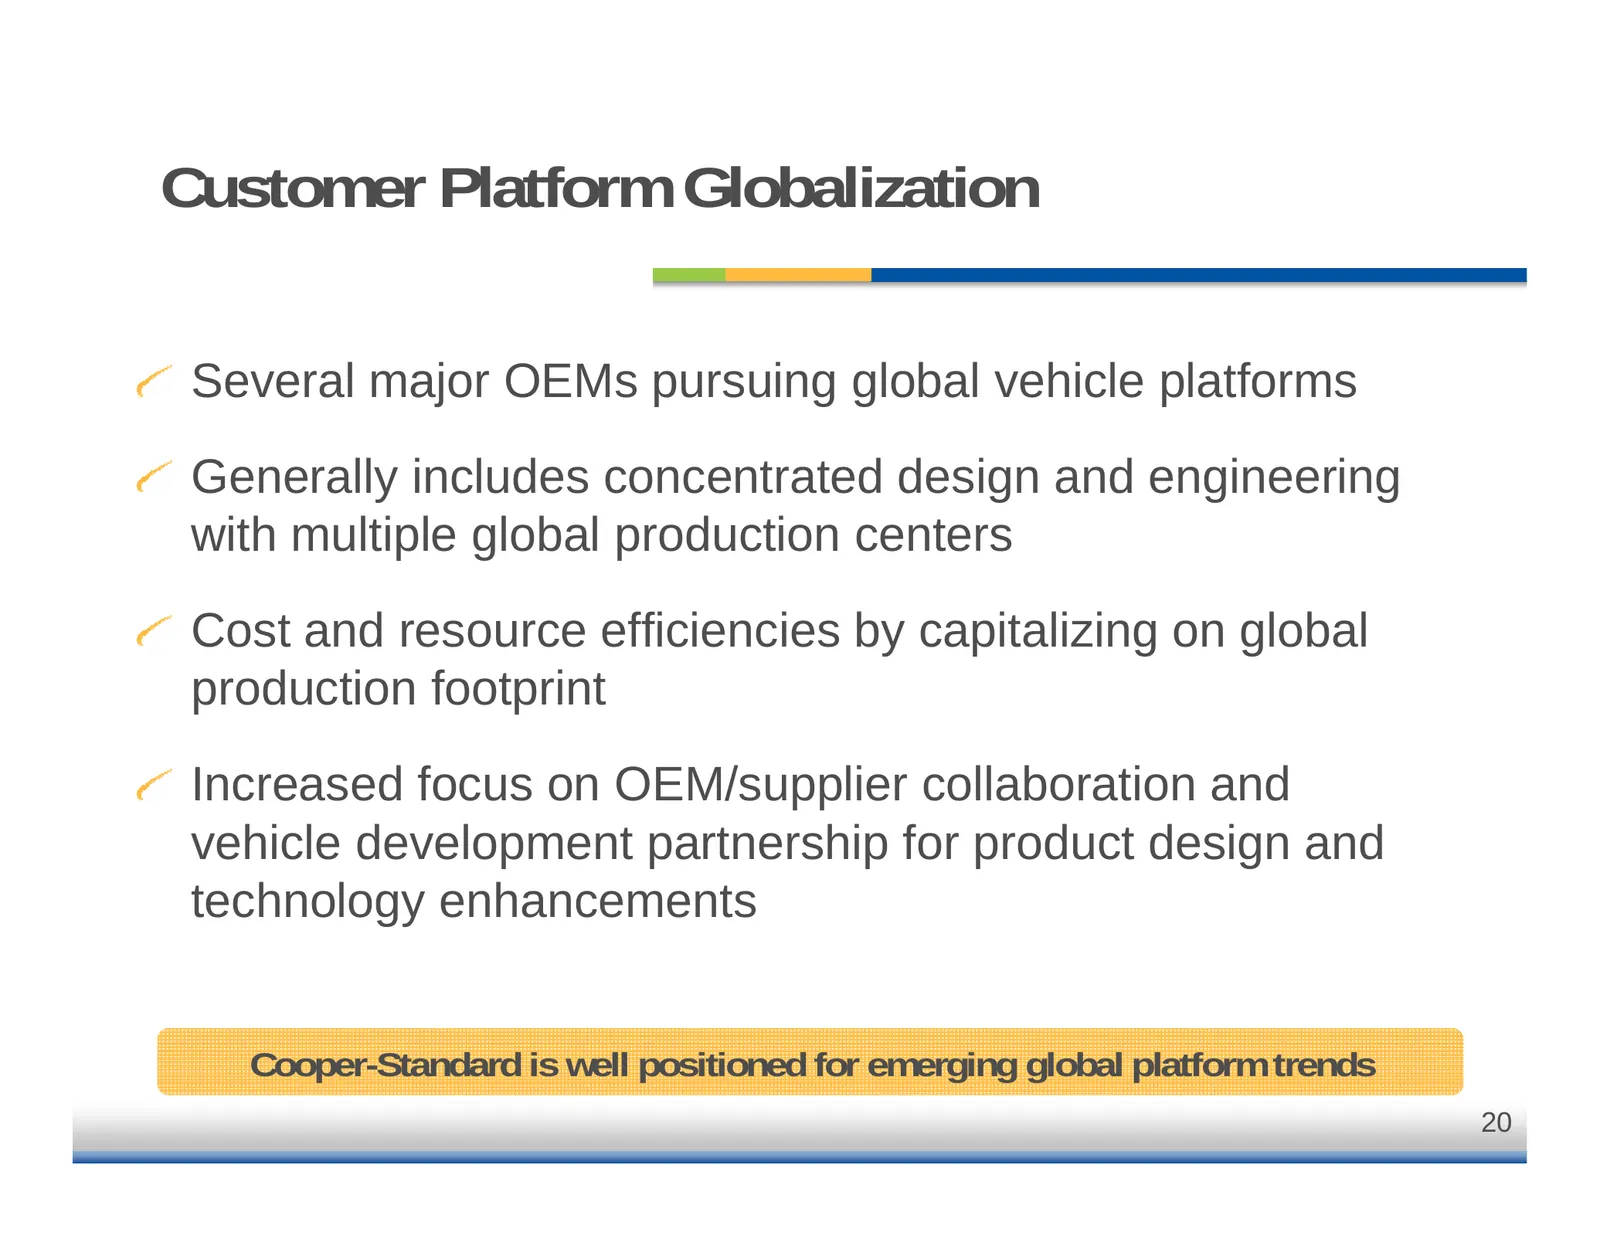
Customer Platform Globalization Several major OEMs pursuing global vehicle platforms Generally includes concentrated design and engineering with multiple global production centers Cost and resource efficiencies by capitalizing on global production footprint Increased focus on OEM/supplier collaborat
Slide 21: Technology Trends
Technology Trends Obstacle Detection System (ODS) Safety innovation Multi-state mount Improved ride and handling for changing powertrains Direct injection technology Fuel efficiency and evolving engine technologies Thermal management applications Hybrid cooling components technologies 21
Slide 22: Customer and Technology Update
Customer and Technology Update Lyle Otremba Vice President Sales, Engineering & Marketing
Slide 23: What is an Obstacle Detection System (ODS)?
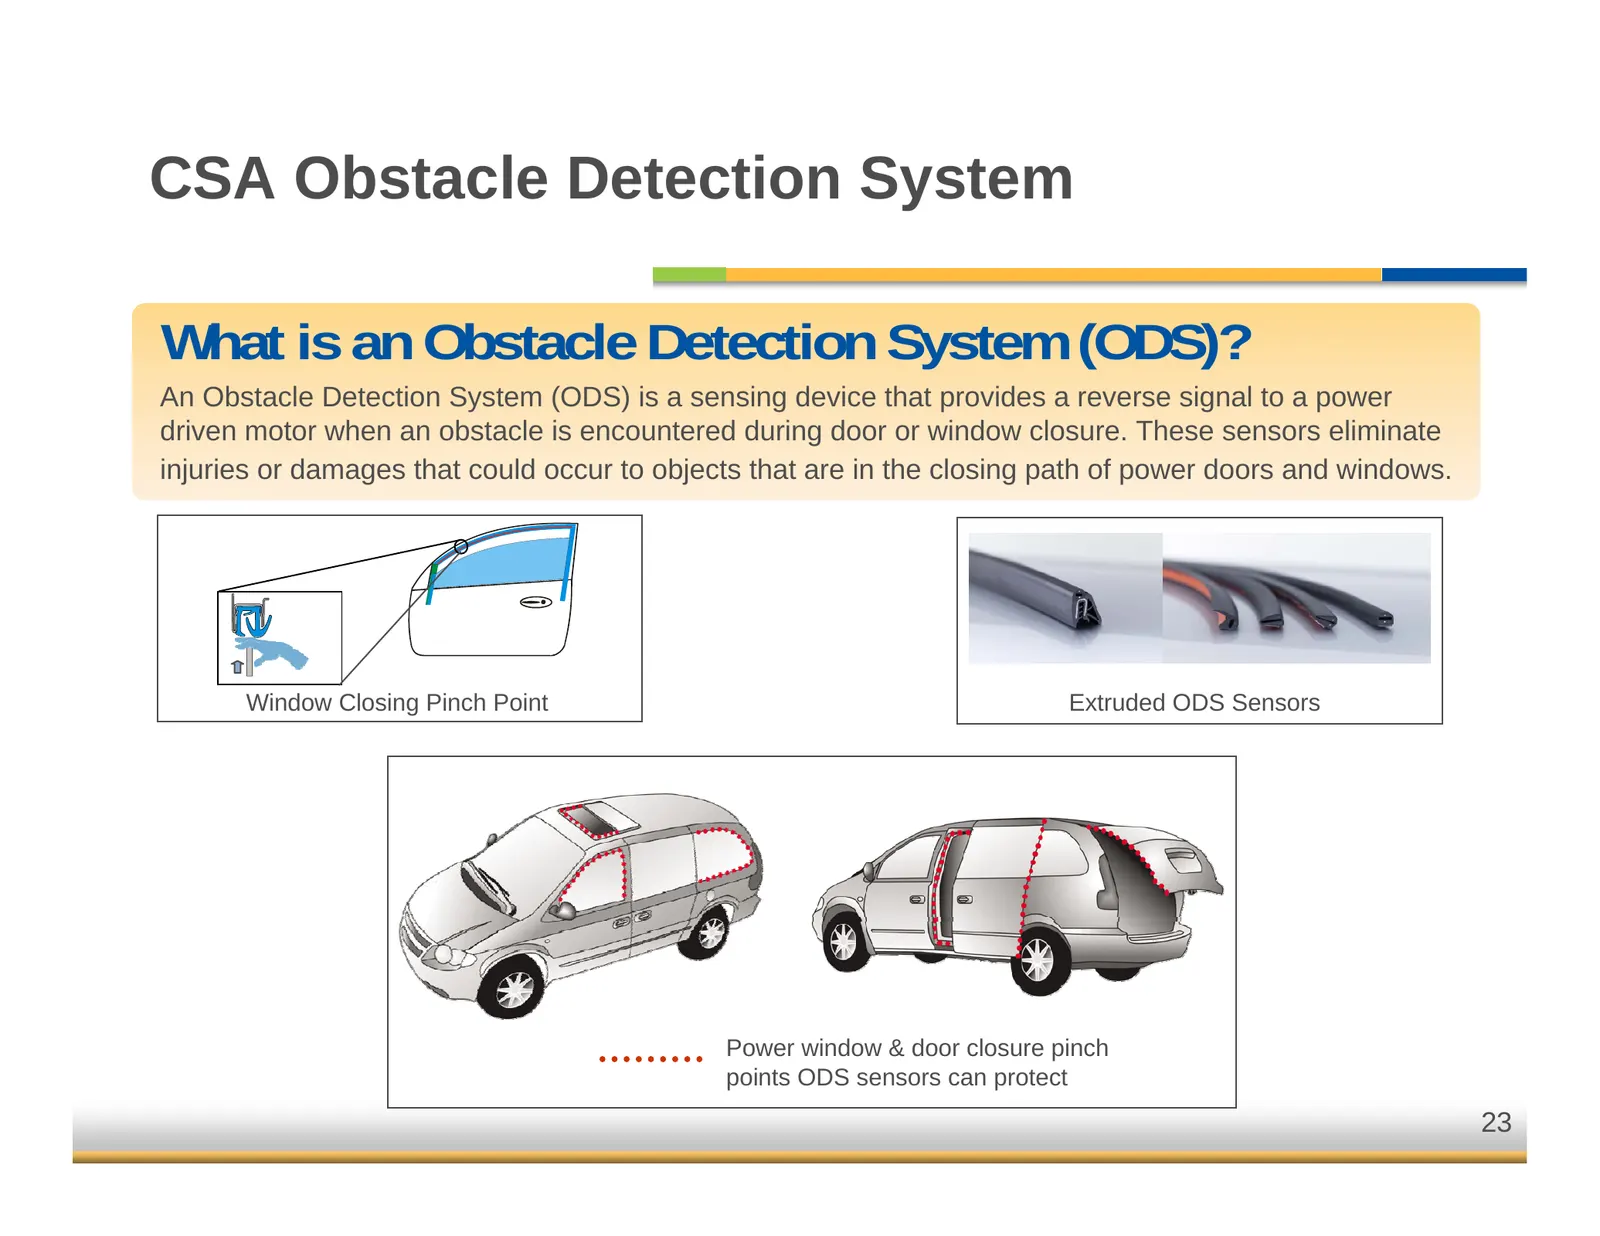
CSA Obstacle Detection System What is an Obstacle Detection System (ODS)? An Obstacle Detection System (ODS) is a sensing device that provides a reverse signal to a power driven motor when an obstacle is encountered during door or window closure. These sensors eliminate injuries or damages that coul
Slide 24: P-ODS Sensor Locations On Sienna XLE Demo Vehicle
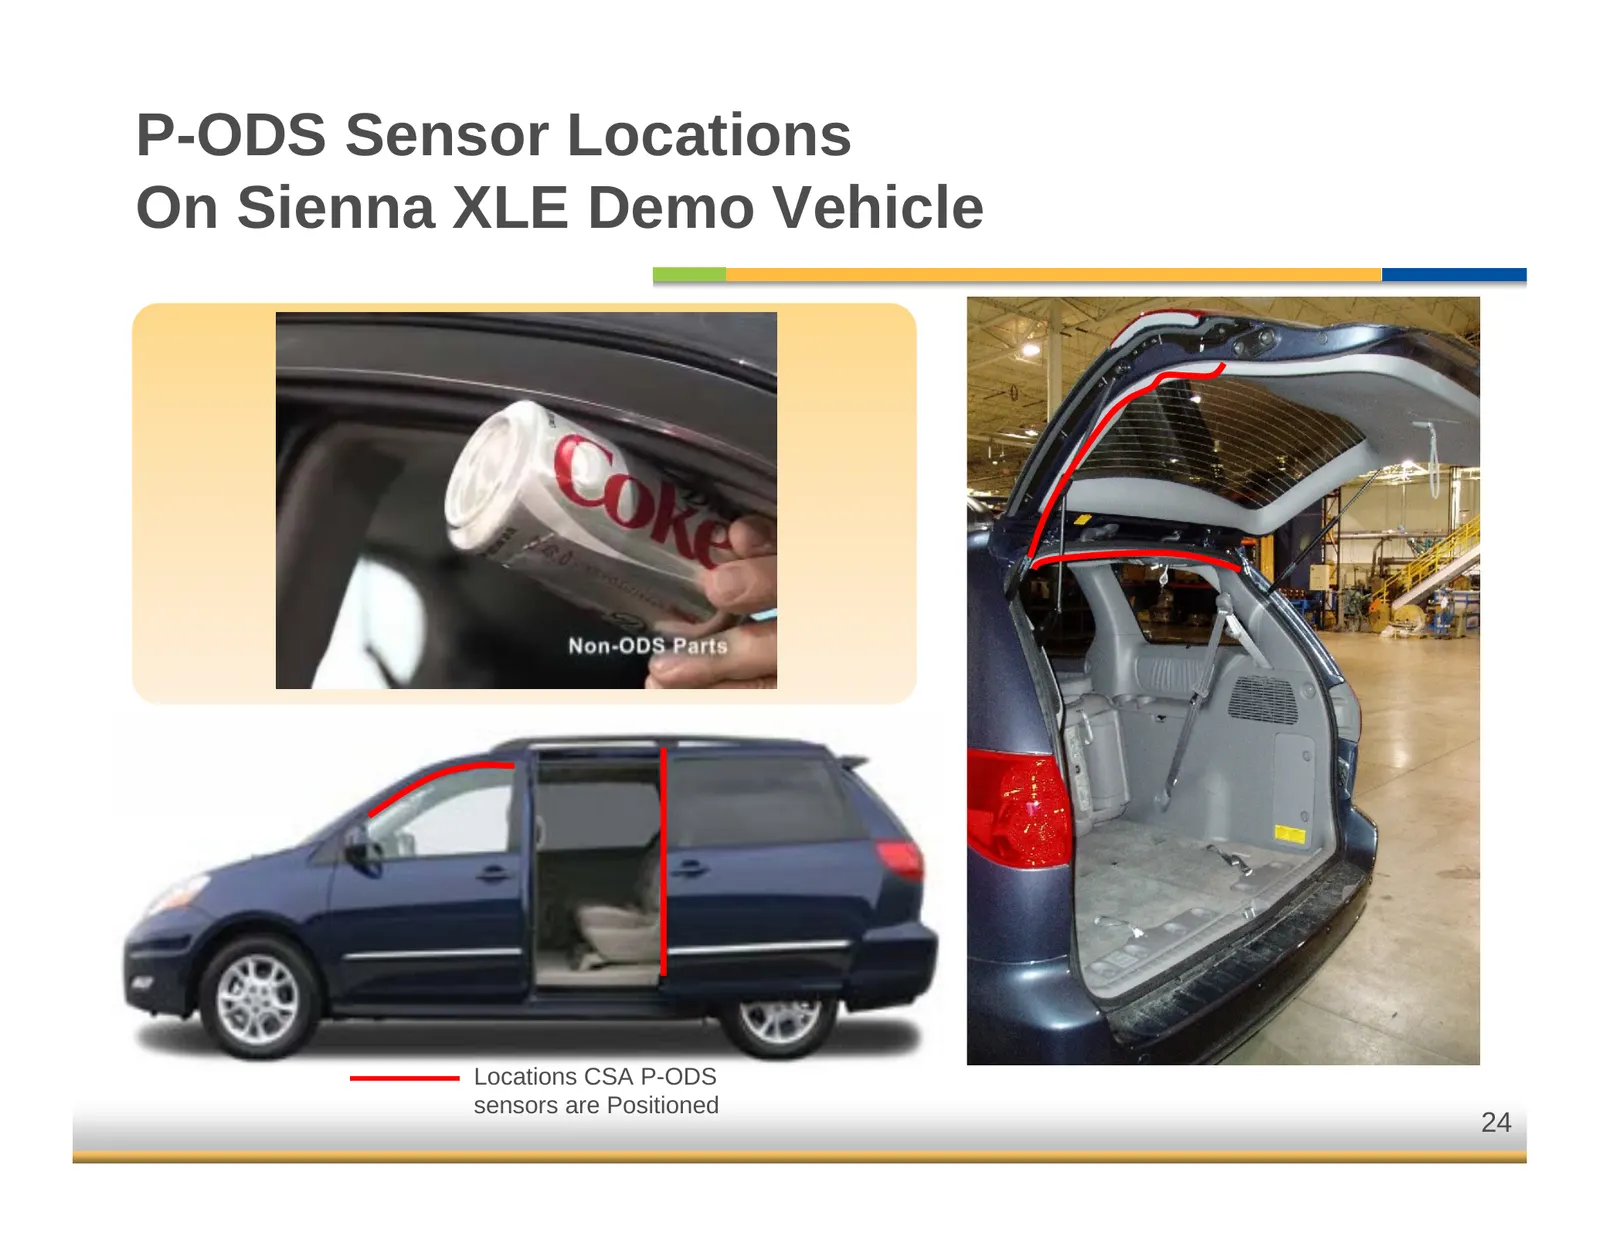
P-ODS Sensor Locations On Sienna XLE Demo Vehicle Locations CSA P-ODS sensors are Positioned 24
Slide 25: CSA Obstacle Detection System Facts
CSA Obstacle Detection System Facts Market Opportunity: Can be applied to moving glass, door and lift gate systems $1 billion market for sensor product only Pull-through market potential of weather seal trim is considerable. Legislation in U.S. mandating safer window systems may drive higher system
Slide 26: Impact of Vehicle Trends on Powertrain Mount Systems
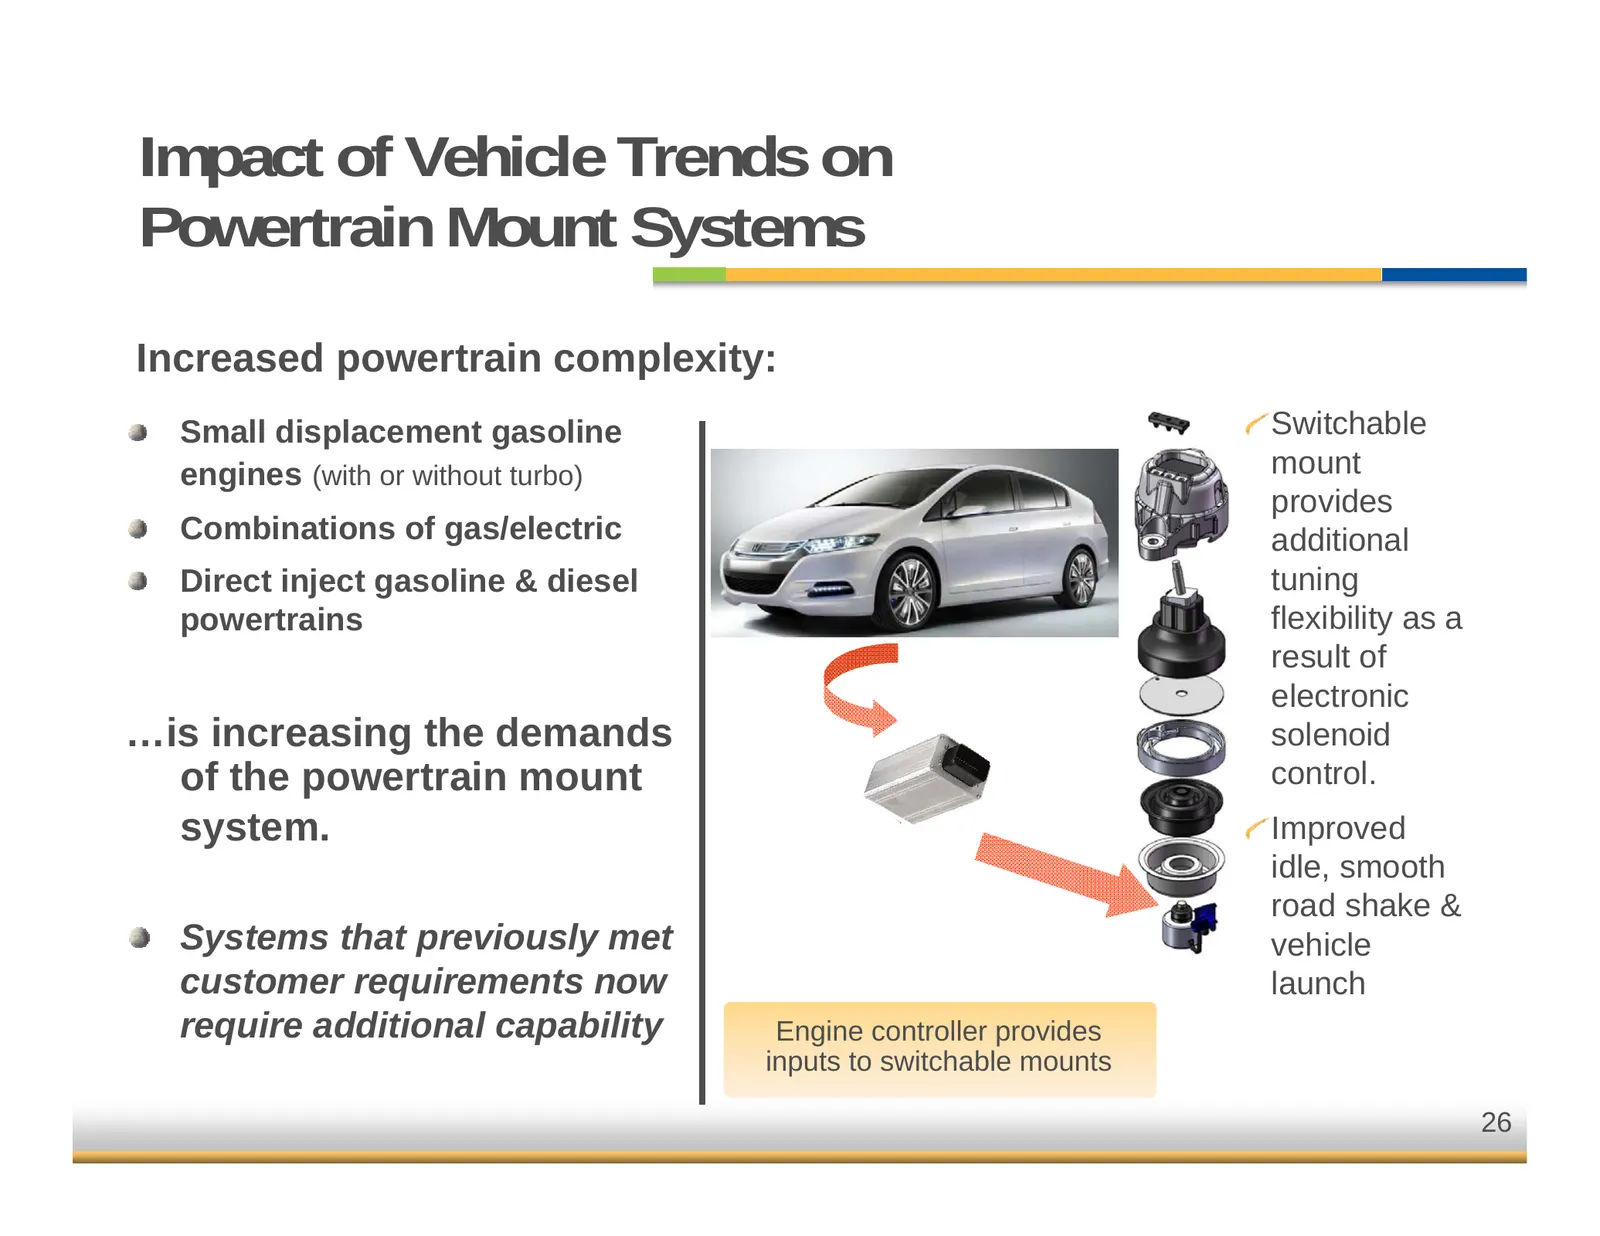
Impact of Vehicle Trends on Powertrain Mount Systems Increased powertrain complexity: Small displacement gasoline Switchable engines (with or without turbo) mount provides Combinations of gas/electric additional Direct inject gasoline & diesel tuning powertrains flexibility as a result of electronic
Slide 27: Switchable Mount Performance
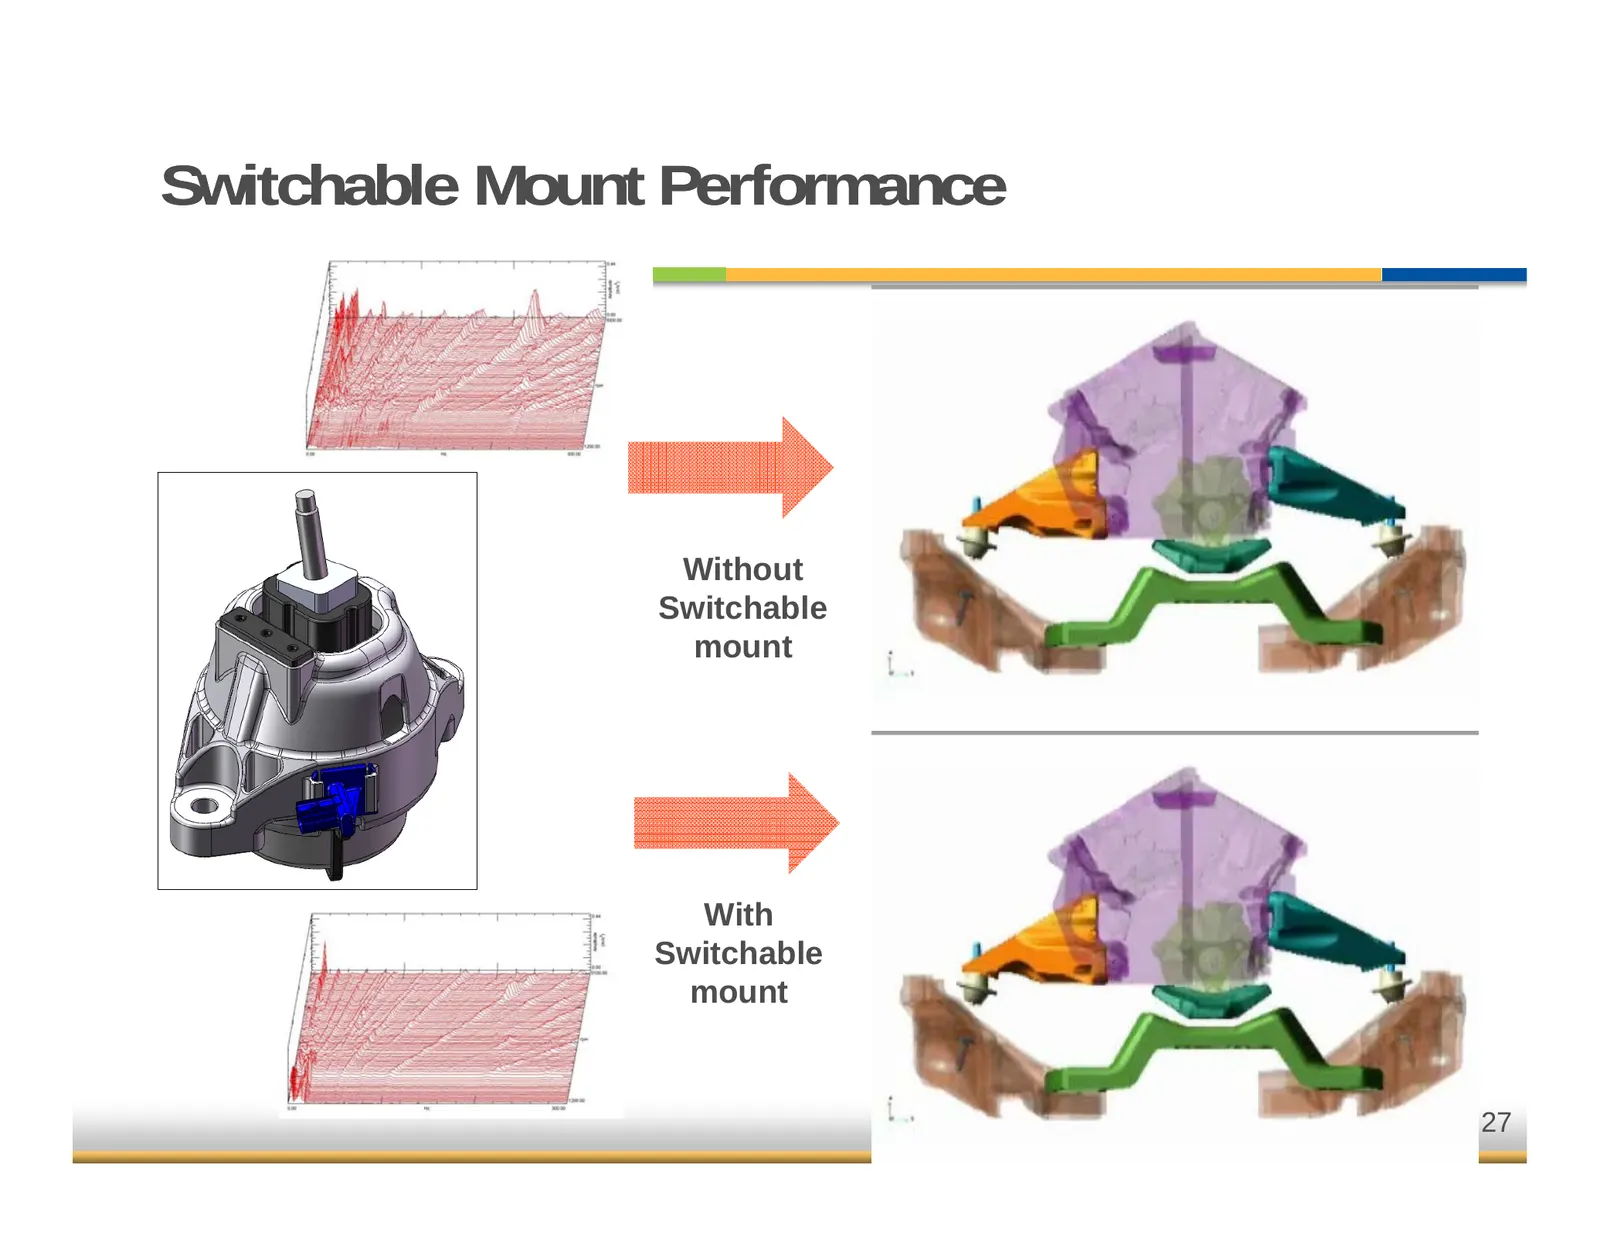
Switchable Mount Performance Without Switchable mount With Switchable mount 27
Slide 28: CSA Switchable Mount Facts
CSA Switchable Mount Facts Market Opportunity: Target is for hybrids, high-end diesels, variable displacement powertrains, etc. Total market value is over $300 million. CSA Technology Advantages: Proven powertrain mount system supplier with full product range. Patent Pending design provides greater
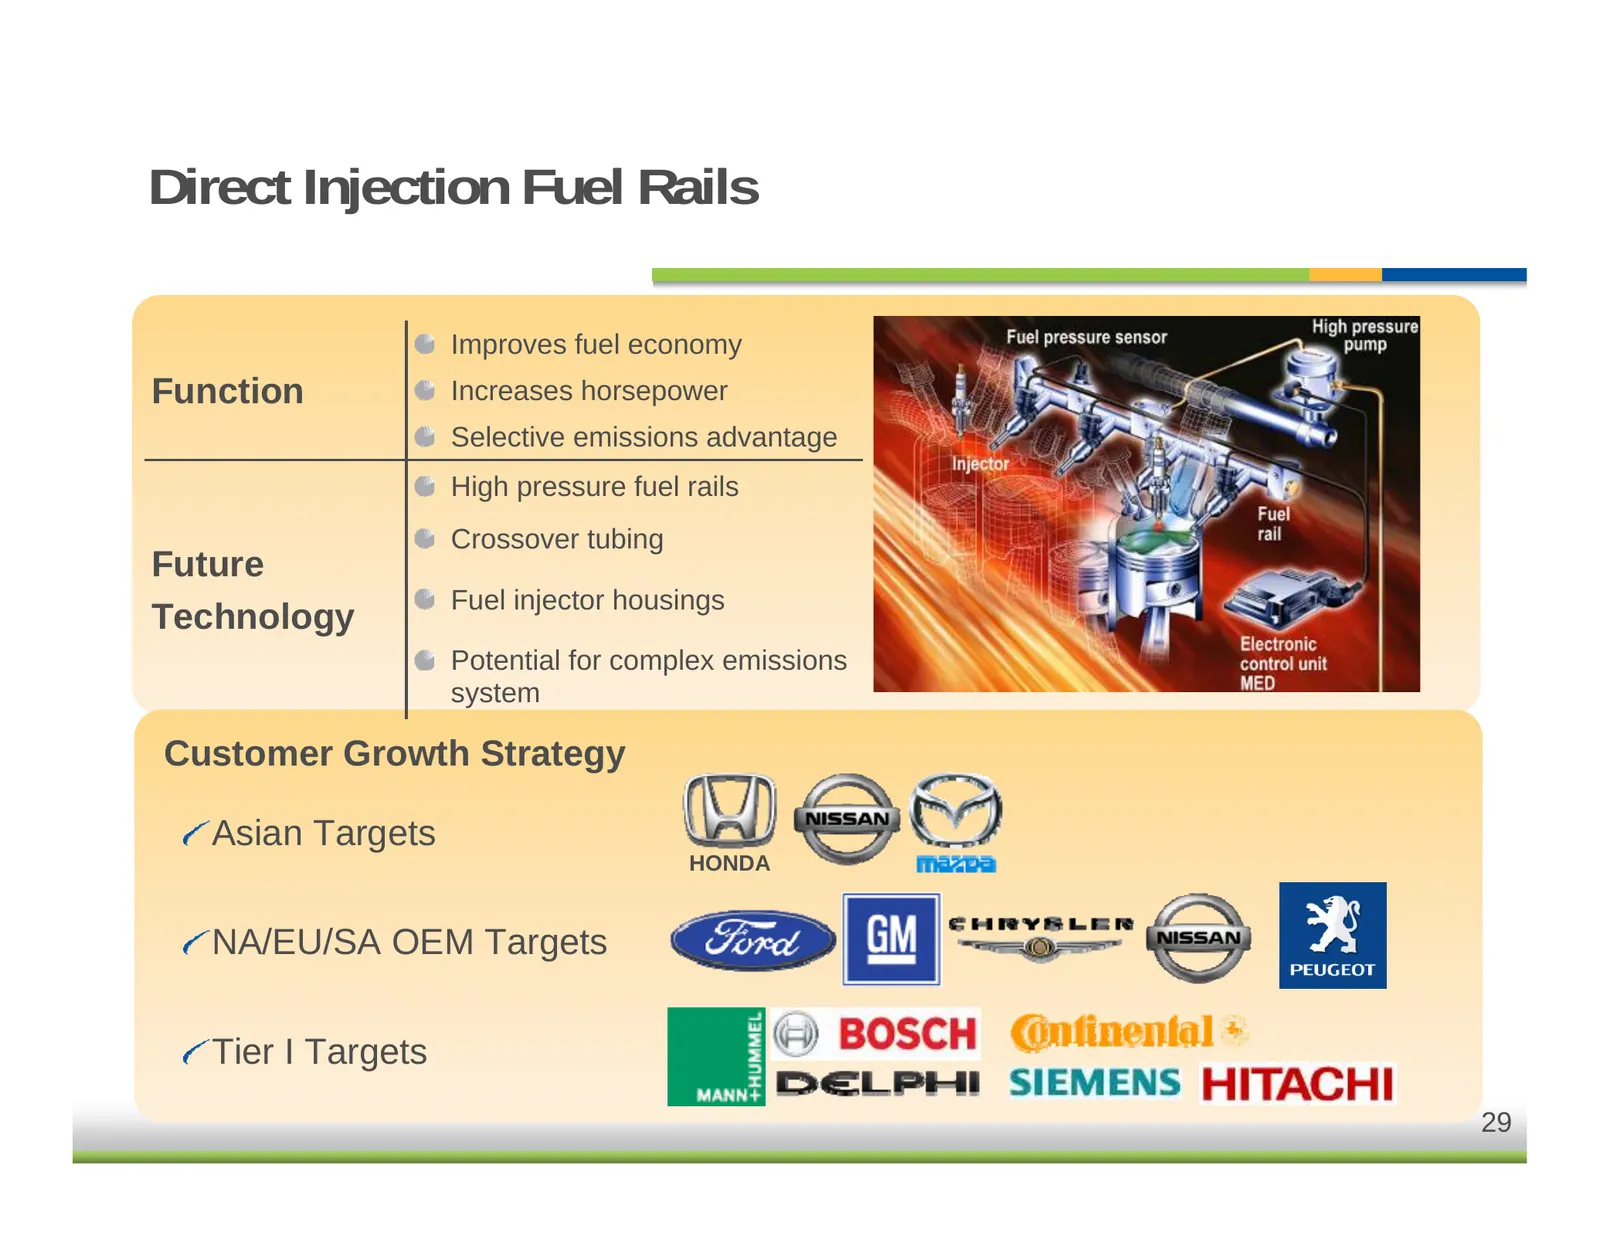
Slide 29: Direct Injection Fuel Rails
Direct Injection Fuel Rails Improves fuel economy Function Increases horsepower Selective emissions advantage High pressure fuel rails Crossover tubing Future Fuel injector housings Technology Potential for complex emissions system Customer Growth Strategy Asian Targets HONDA NA/EU/SA OEM Targets Ti
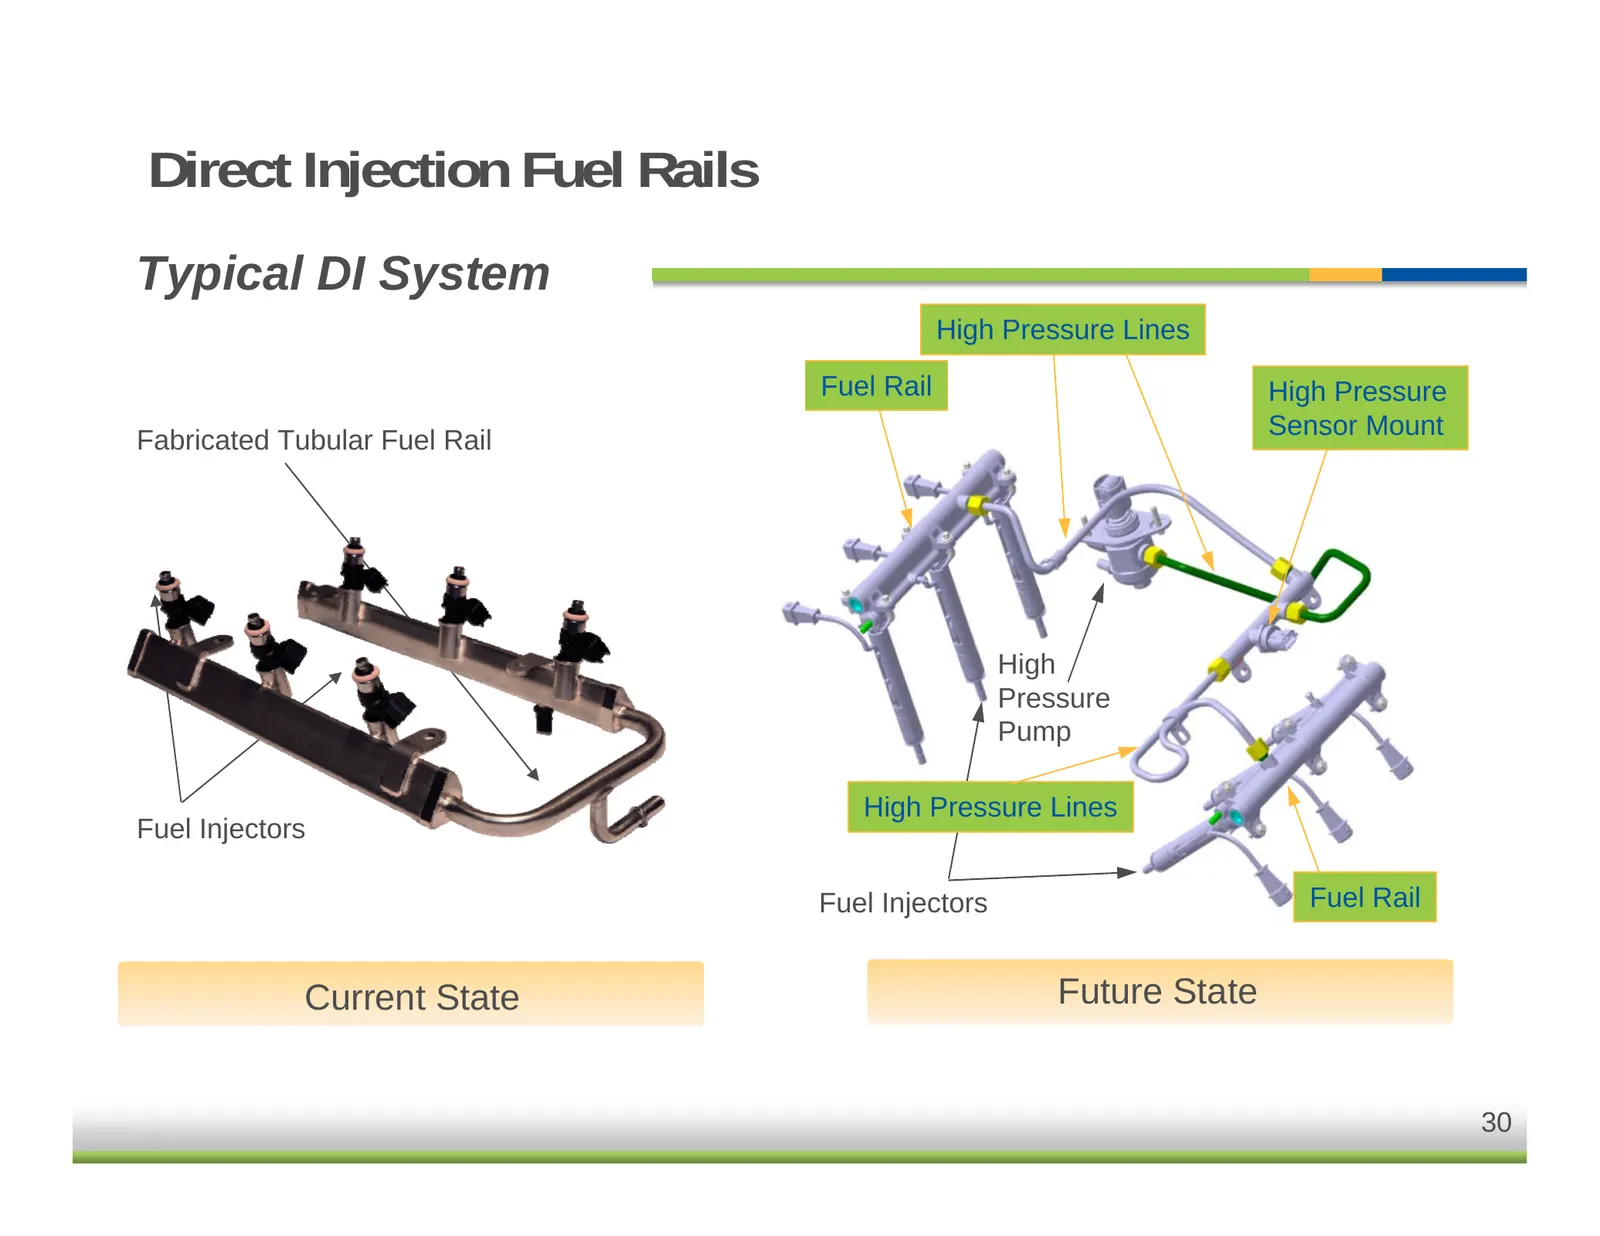
Slide 30: Direct Injection Fuel Rails
Direct Injection Fuel Rails Typical DI System High Pressure Lines Fuel Rail High Pressure Sensor Mount Fabricated Tubular Fuel Rail High Pressure Pump High Pressure Lines Fuel Injectors Fuel Injectors Fuel Rail Current State Future State 30
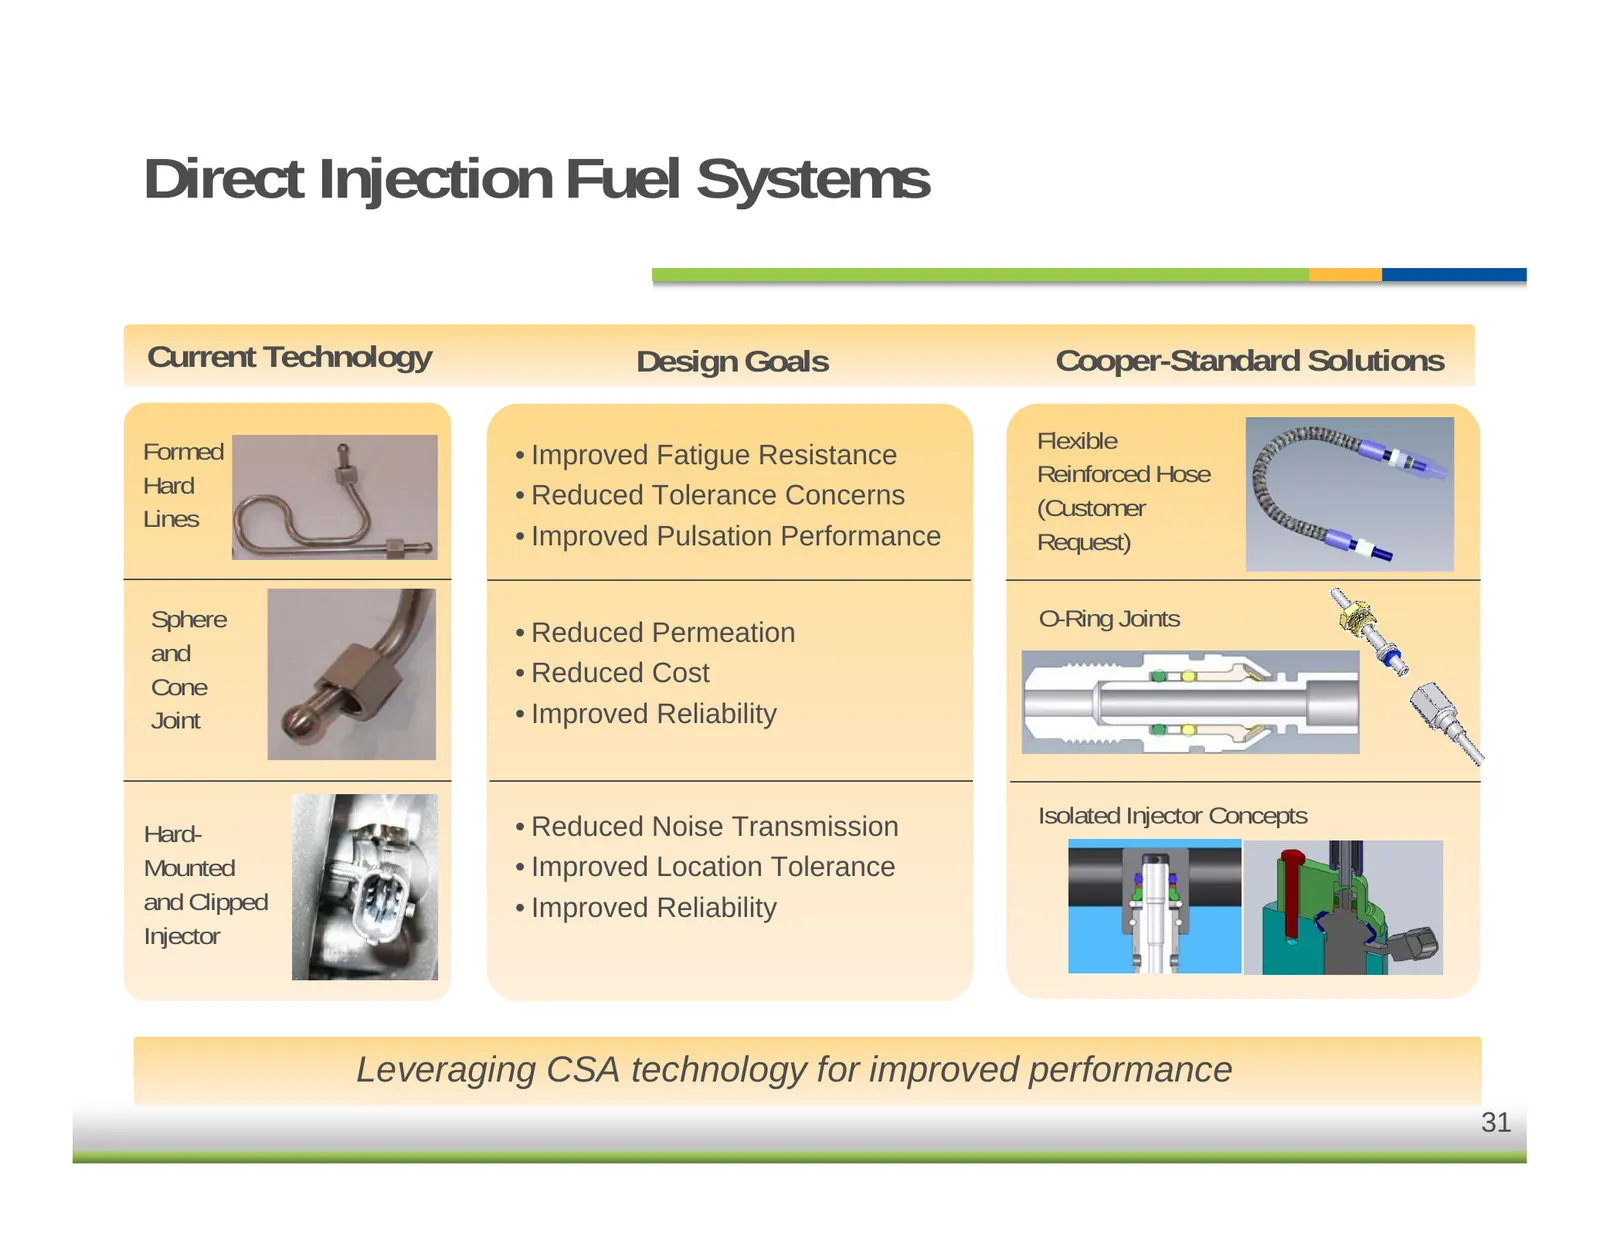
Slide 31: Direct Injection Fuel Systems
Direct Injection Fuel Systems Current Technology Design Goals Cooper-Standard Solutions Formed Flexible • Improved Fatigue Resistance Hard Reinforced Hose • Reduced Tolerance Concerns (Customer Lines • Improved Pulsation Performance Request) Sphere O-Ring Joints • Reduced Permeation and Cone • Reduc
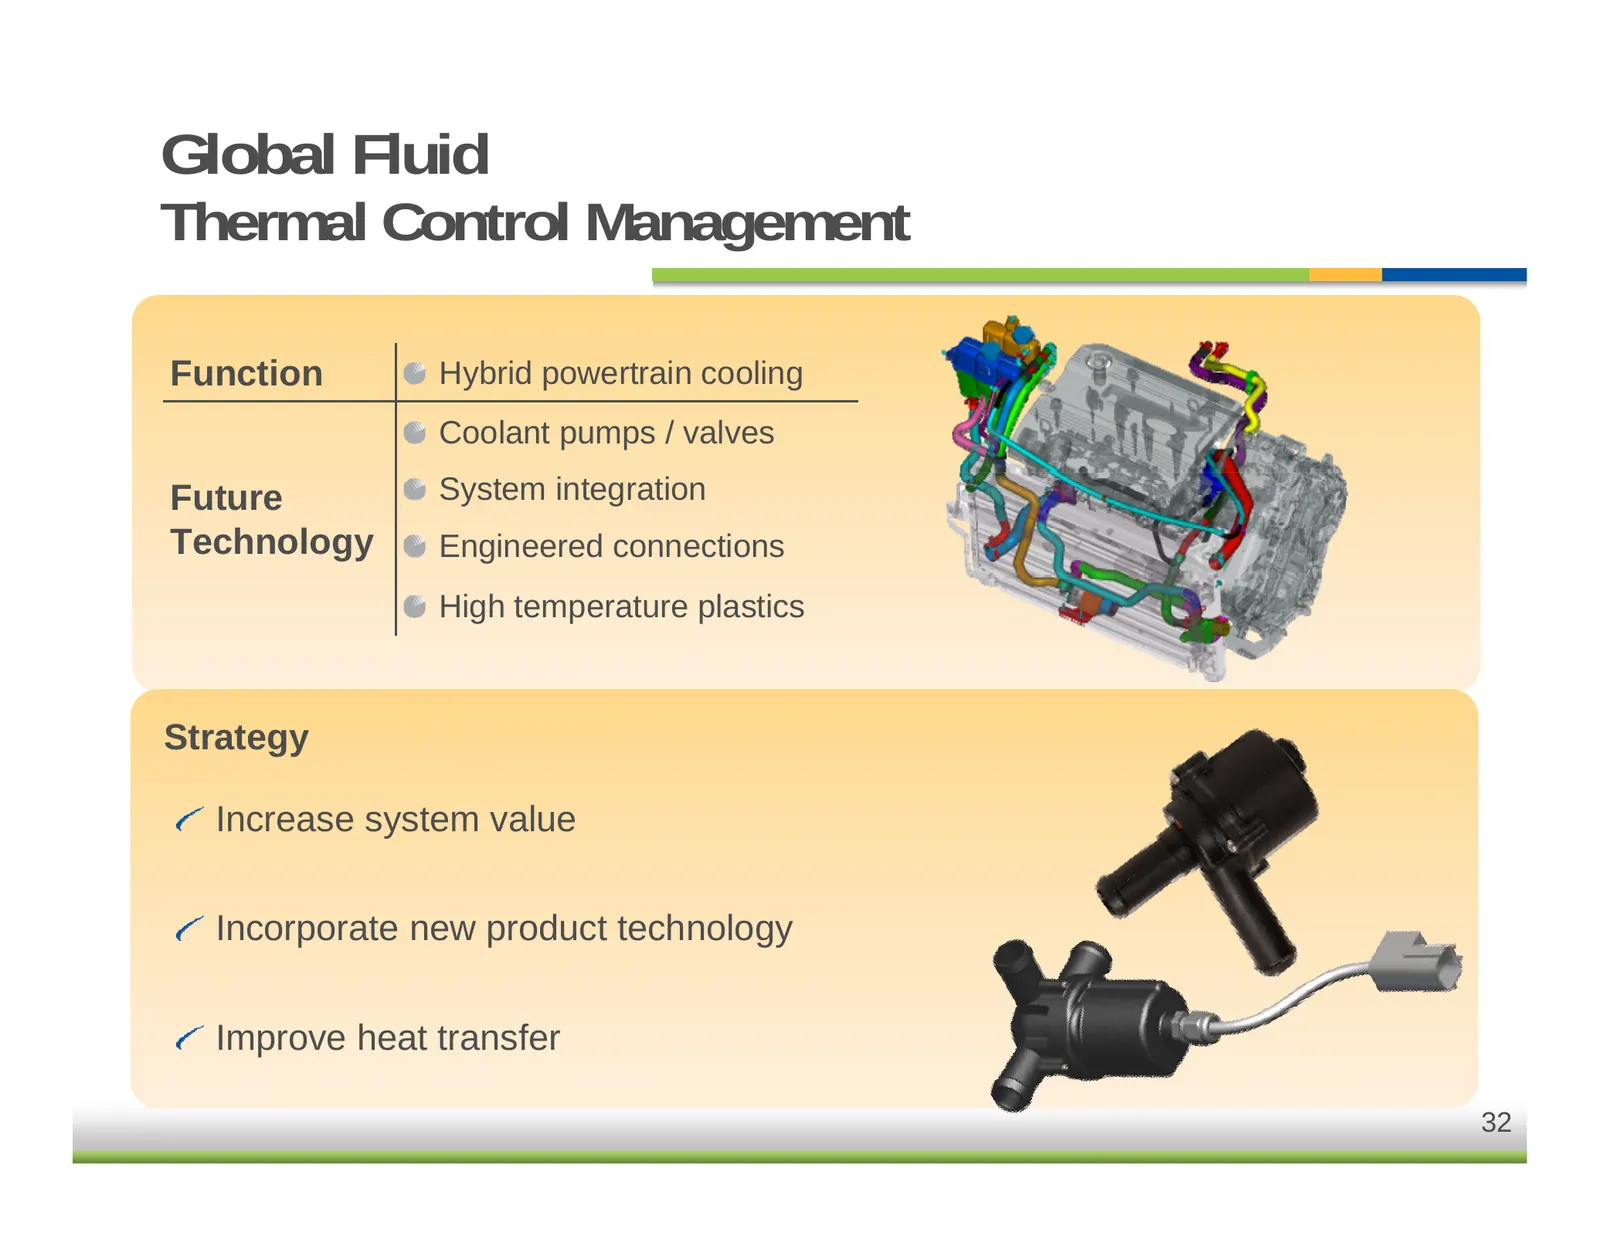
Slide 32: Global Fluid Thermal Control Management
Global Fluid Thermal Control Management Function Hybrid powertrain cooling Coolant pumps / valves Future System integration Technology Engineered connections High temperature plastics Strategy Increase system value Incorporate new product technology Improve heat transfer 32
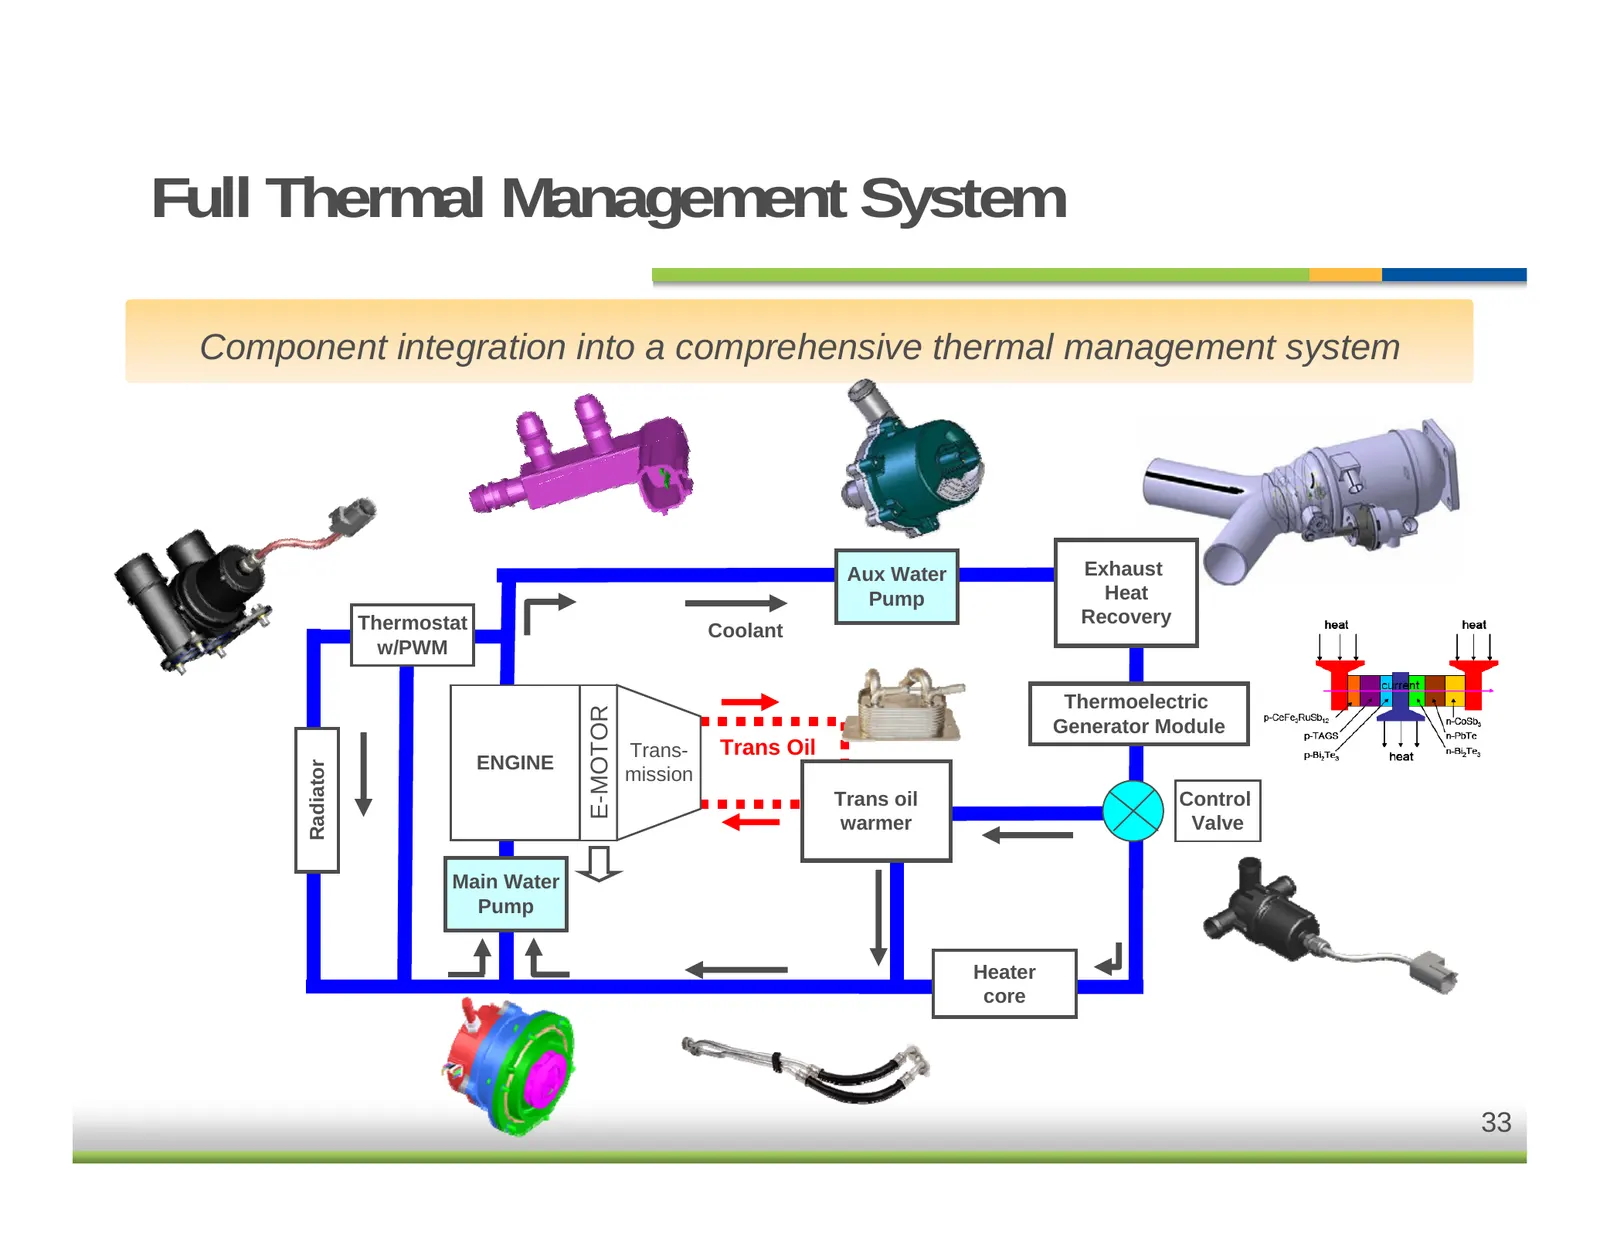
Slide 33: Full Thermal Management System
Full Thermal Management System Component integration into a comprehensive thermal management system Aux Water Exhaust Pump Heat Thermostat Recovery Coolant w/PWM Thermoelectric E-MOTOR Generator Module Trans- Trans Oil ENGINE Radiator mission Trans oil Control warmer Valve Main Water Pump Heater cor
Slide 34: Financial Overview
Financial Overview Allen Campbell CFO
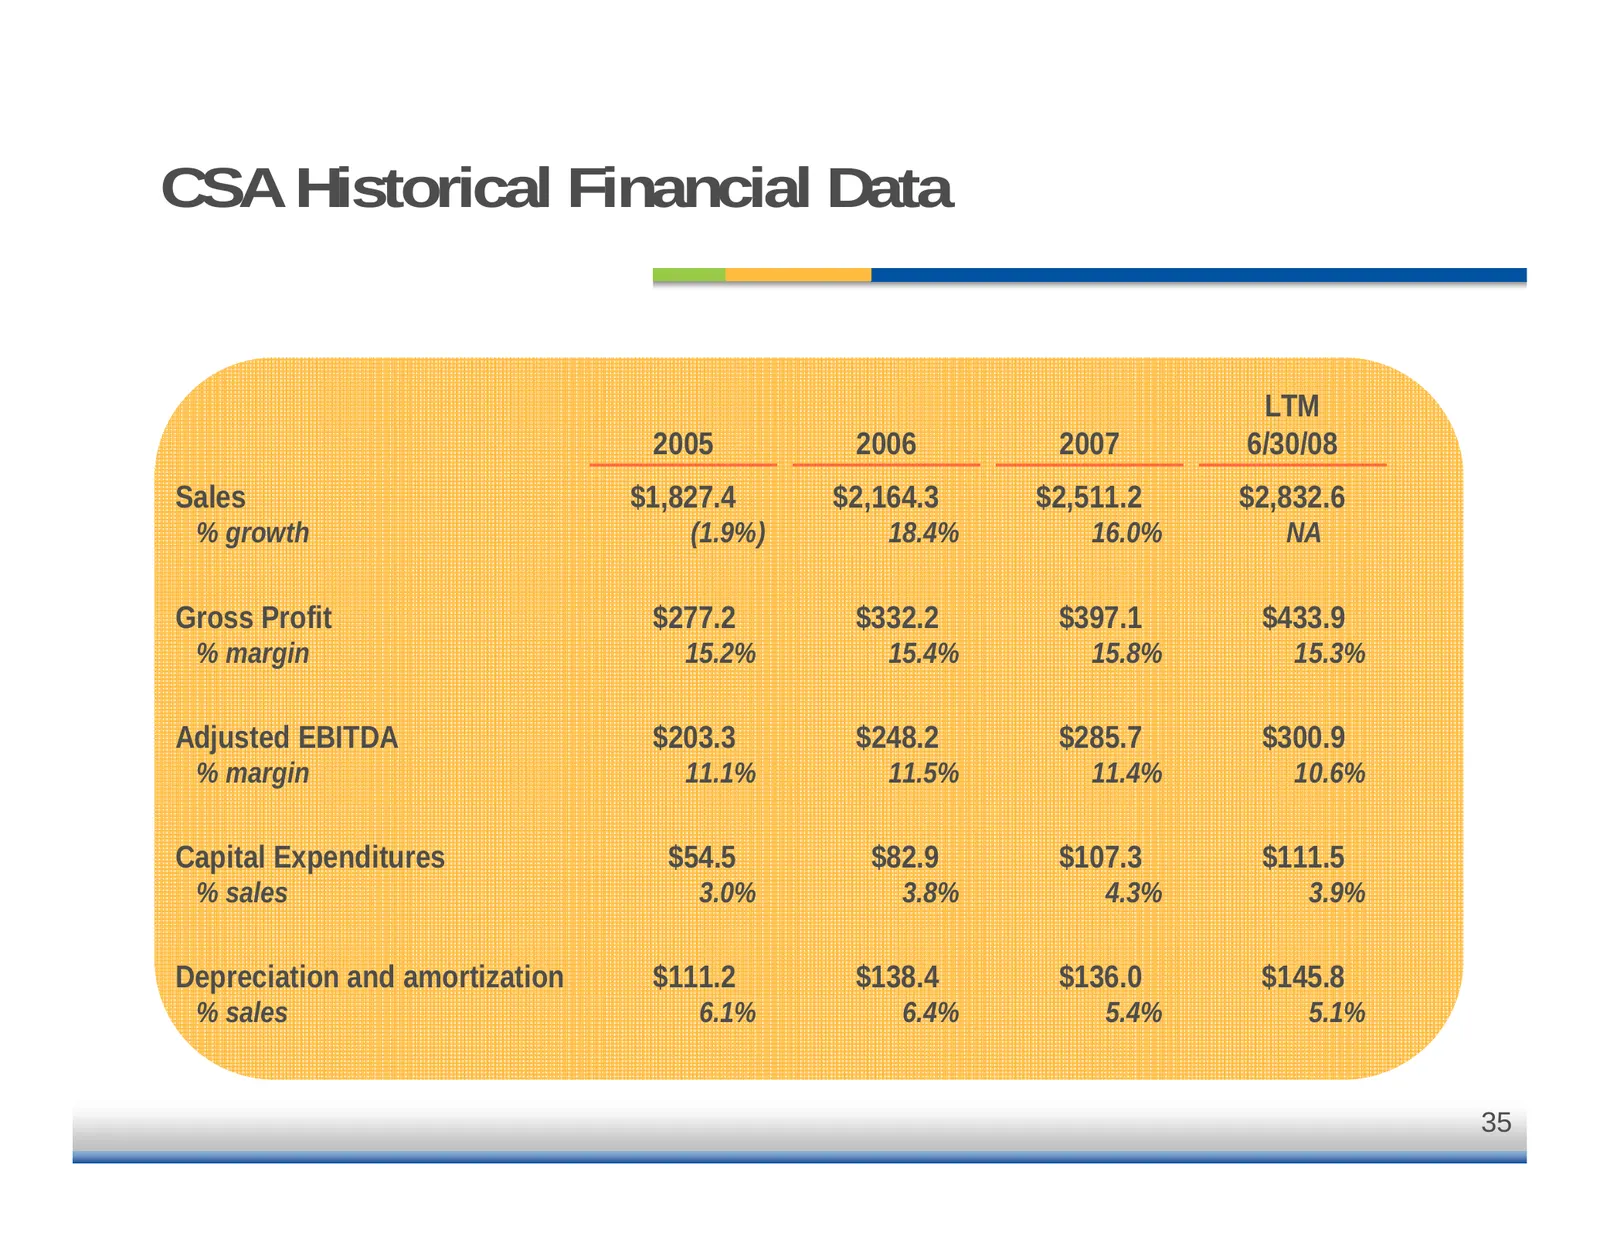
Slide 35: CSA Historical Financial Data
CSA Historical Financial Data LTM 2005 2006 2007 6/30/08 Sales $1,827.4 $2,164.3 $2,511.2 $2,832.6 % growth (1.9%) 18.4% 16.0% NA Gross Profit $277.2 $332.2 $397.1 $433.9 % margin 15.2% 15.4% 15.8% 15.3% Adjusted EBITDA $203.3 $248.2 $285.7 $300.9 % margin 11.1% 11.5% 11.4% 10.6% Capital Expenditure
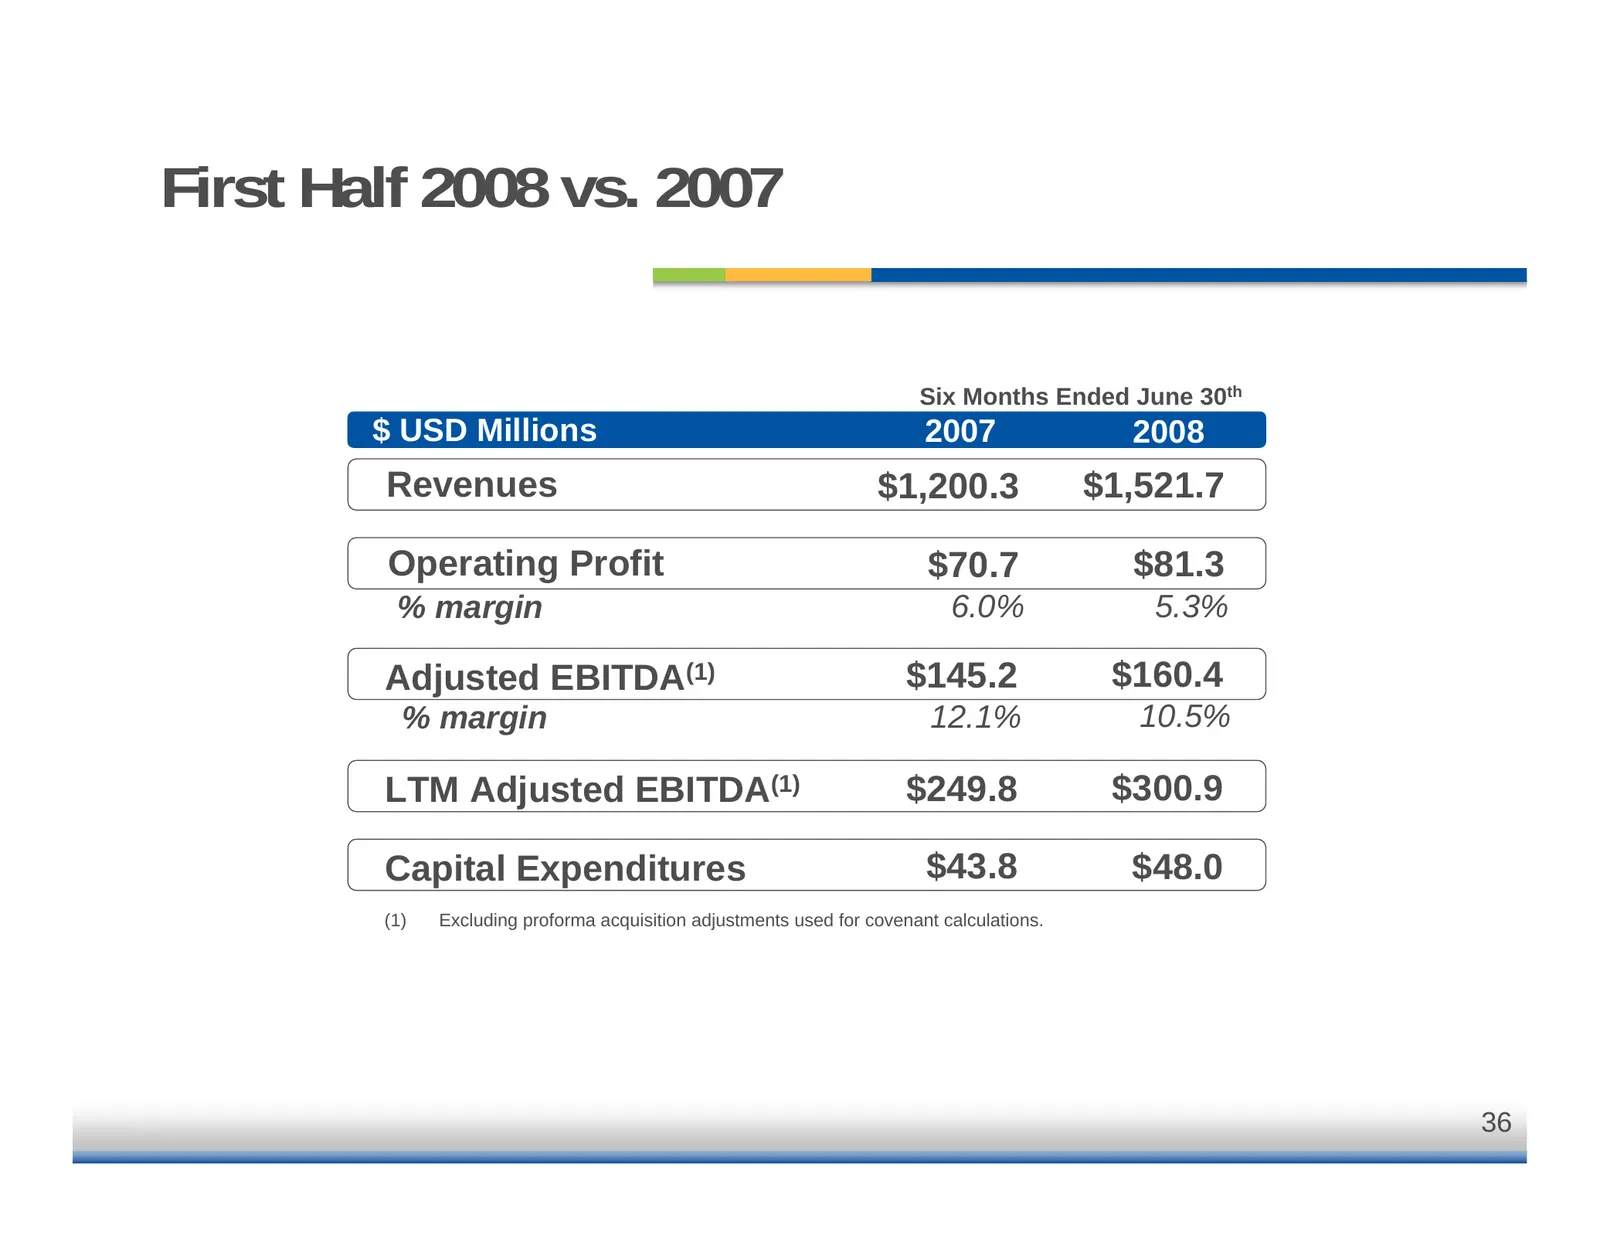
Slide 36: First Half 2008 vs. 2007
First Half 2008 vs. 2007 Six Months Ended June 30th $ USD Millions 2007 2008 Revenues $1,200.3 $1,521.7 Operating Profit $70.7 $81.3 % margin 6.0% 5.3% Adjusted EBITDA(1) $145.2 $160.4 % margin 12.1% 10.5% LTM Adjusted EBITDA(1) $249.8 $300.9 Capital Expenditures $43.8 $48.0 (1) Excluding proforma a
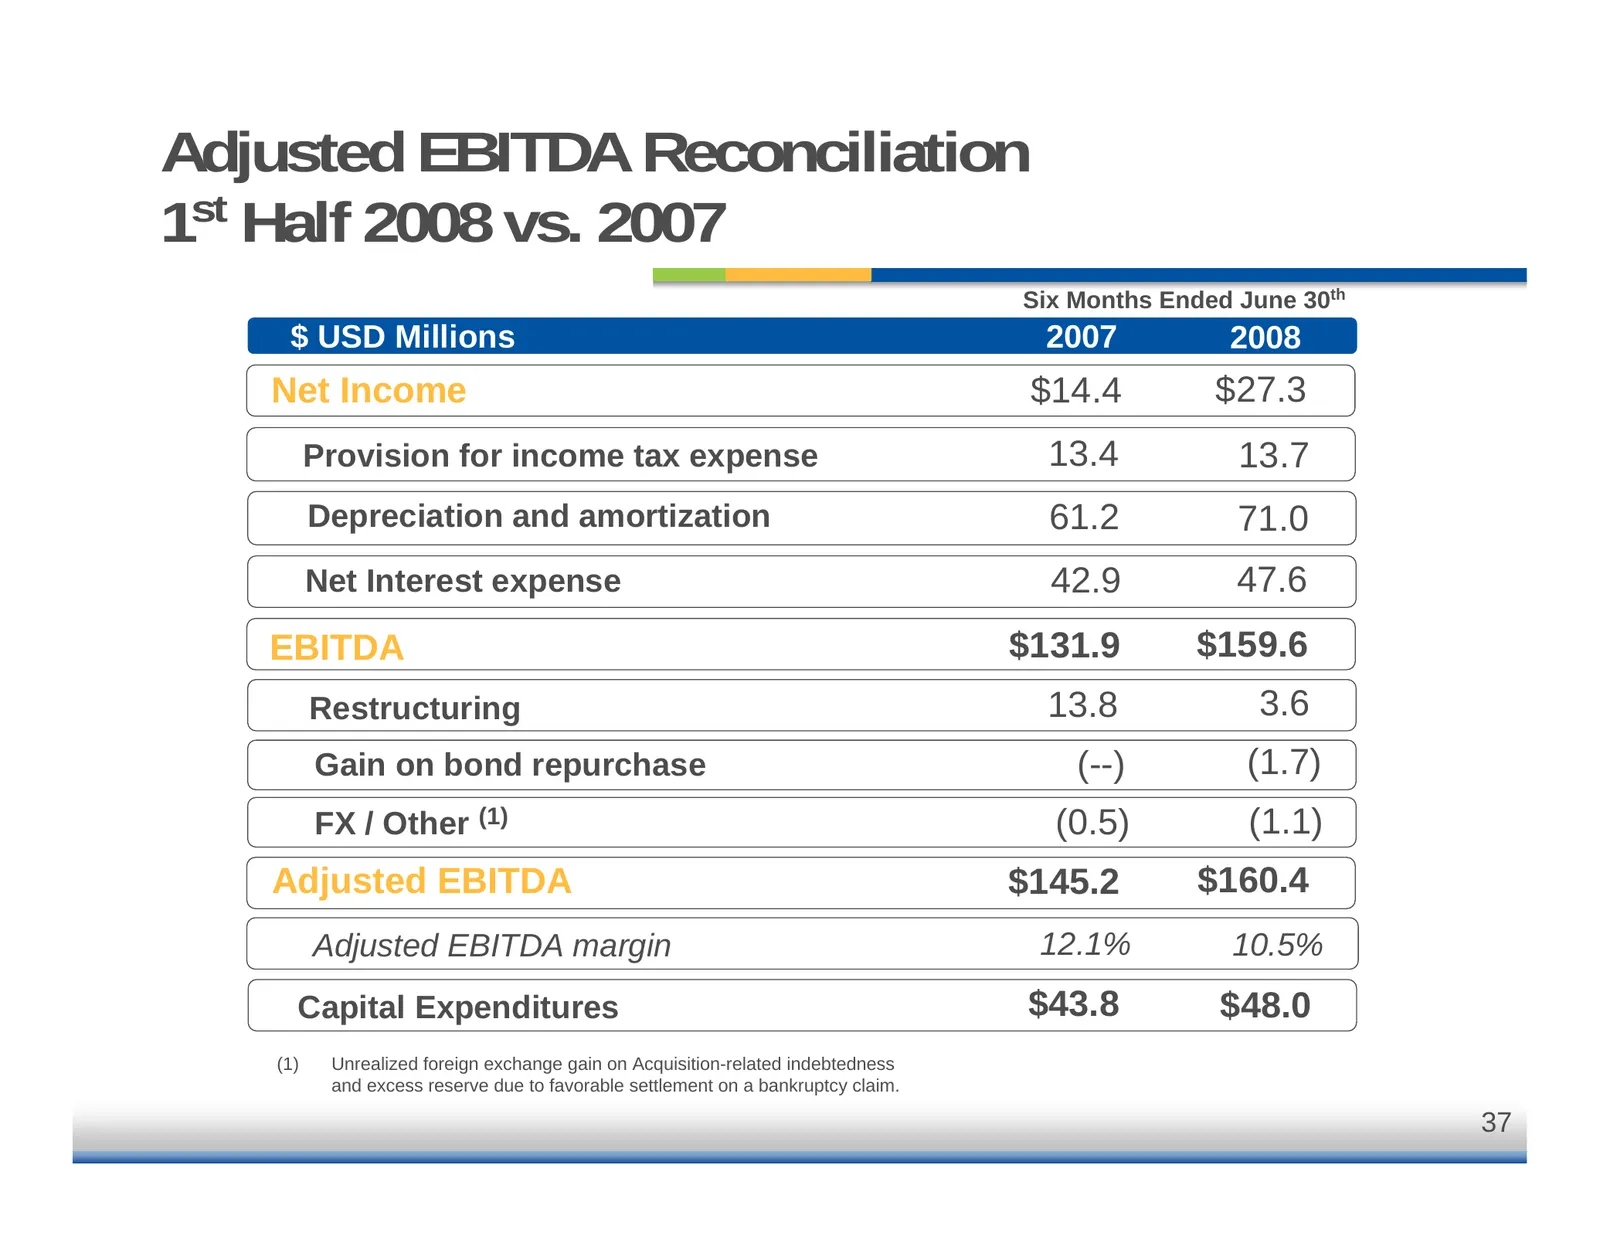
Slide 37: Adjusted EBITDA Reconciliation 1st Half 2008 vs. 2007
Adjusted EBITDA Reconciliation 1st Half 2008 vs. 2007 Six Months Ended June 30th $ USD Millions 2007 2008 Net Income $14.4 $27.3 Provision for income tax expense 13.4 13.7 Depreciation and amortization 61.2 71.0 Net Interest expense 42.9 47.6 EBITDA $131.9 $159.6 Restructuring 13.8 3.6 Gain on bond
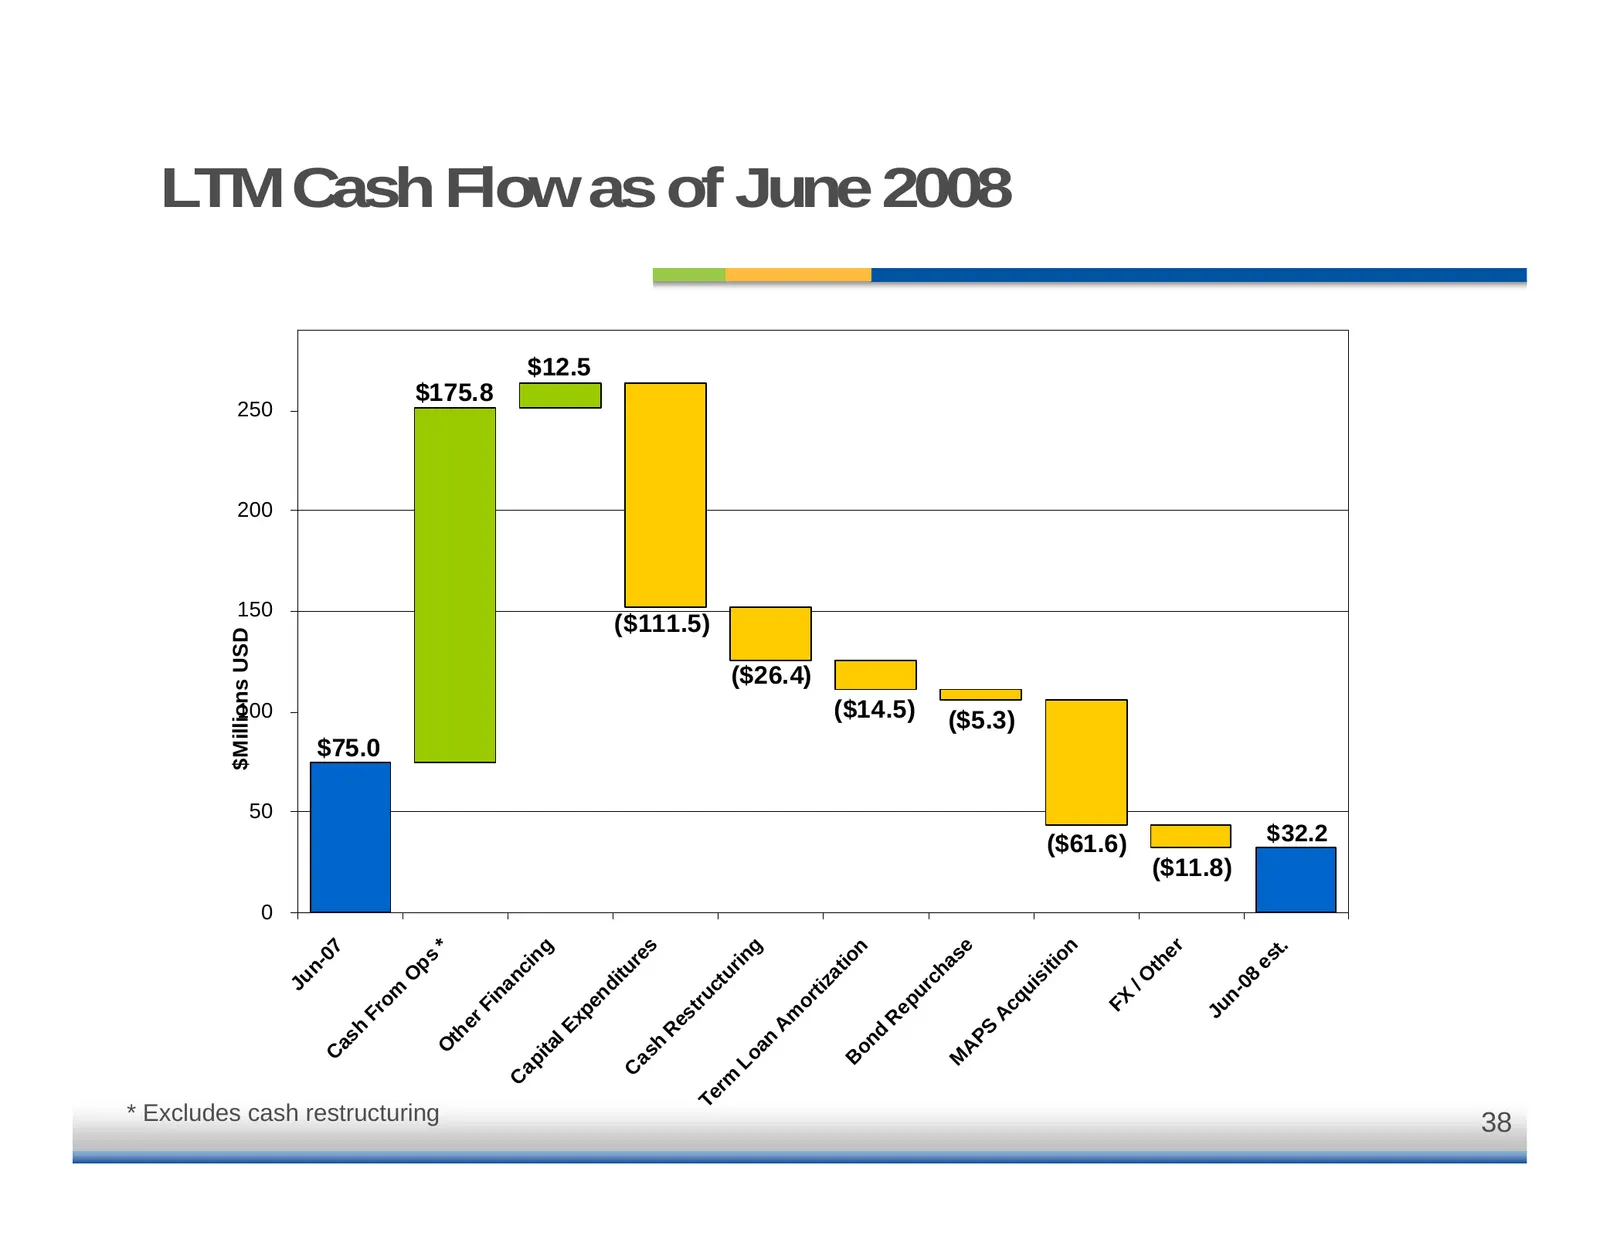
Slide 38: LTM Cash Flow as of June 2008
$Millions USD 0 50 100 150 200 250 Ju n- C 07 as h $75.0 Fr om O ps * Excludes cash restructuring O * th er $175.8 Fi na C nc ap in ita g lE $12.5 xp en di C tu re as h s R es tr ($111.5) Te uc rm tu Lo rin an g A m ($26.4) or tiz at B io on n d R ($14.5) ep ur ch M as e A PS A LTM Cash Flow as of J
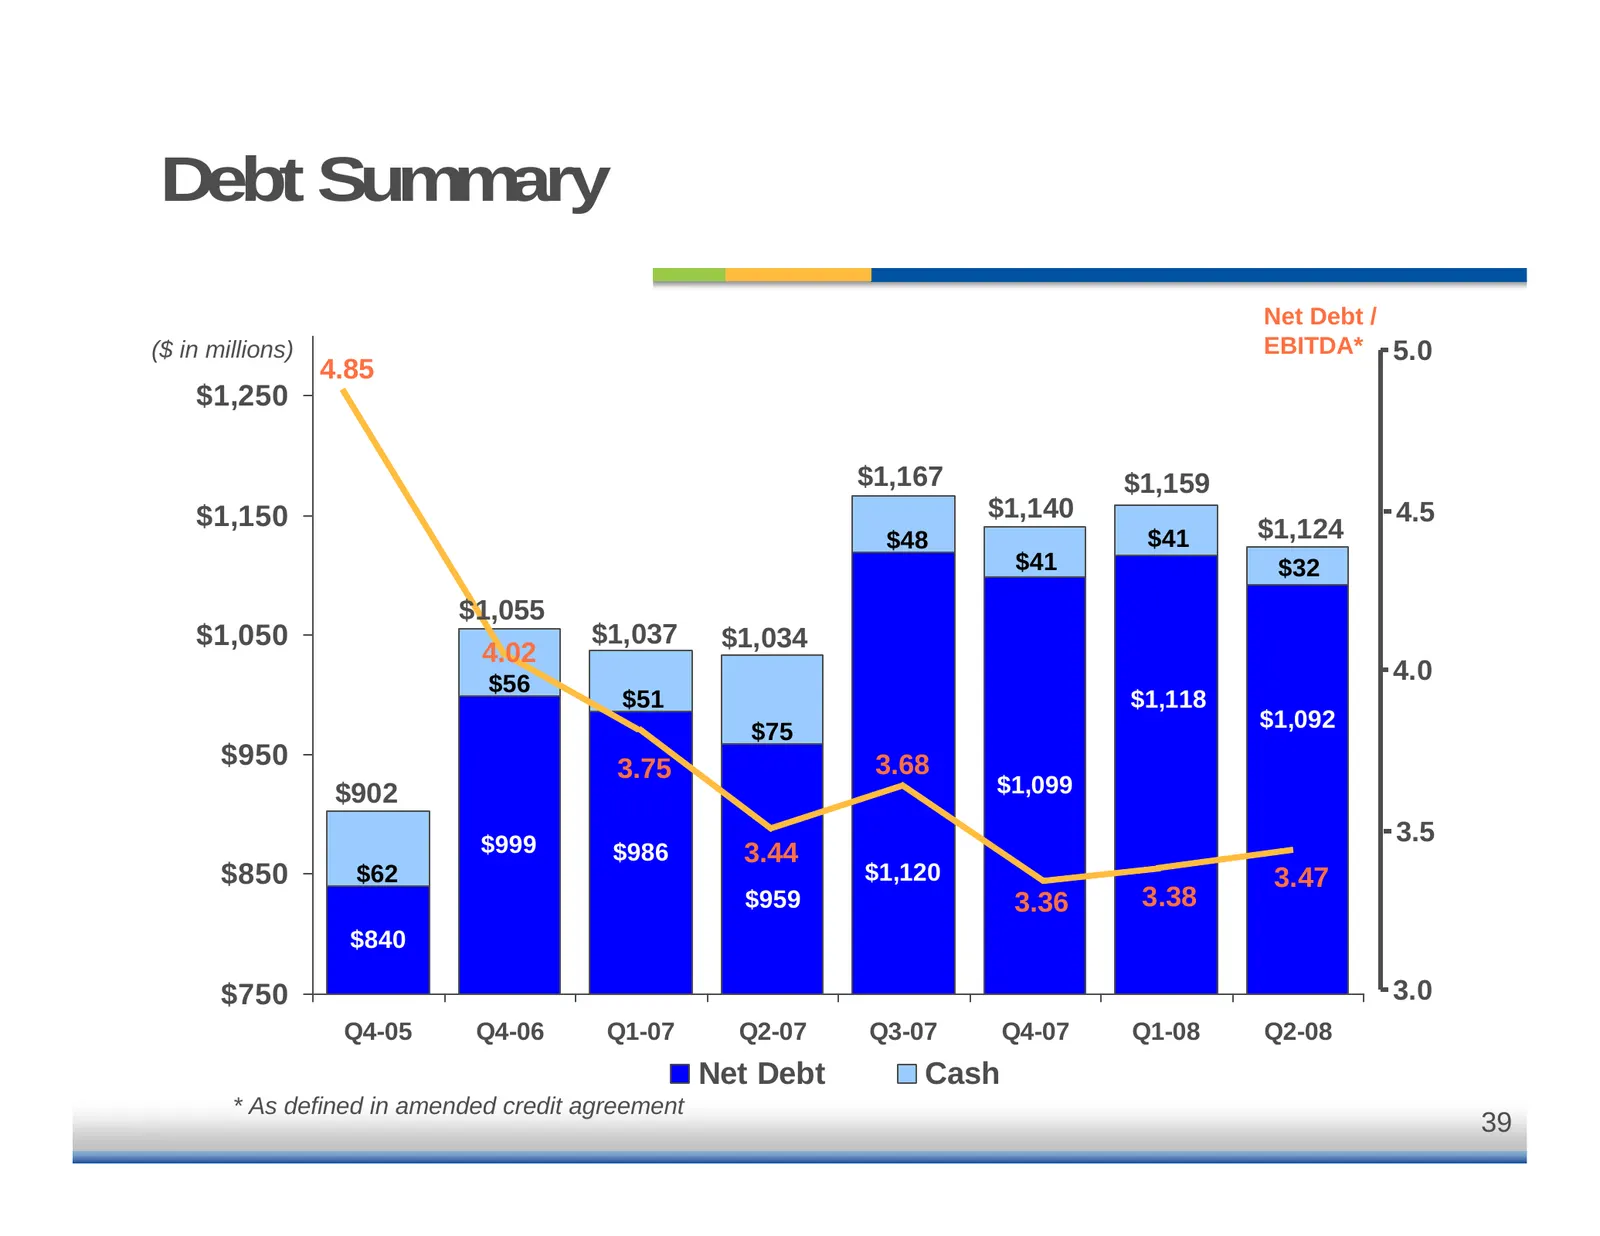
Slide 39: Debt Summary
Debt Summary Net Debt / ($ in millions) EBITDA* 5.0 4.85 $1,250 $1,167 $1,159 $1,150 $1,140 4.5 $48 $41 $1,124 $41 $32 $1,055 $1,050 $1,037 $1,034 4.02 $56 4.0 $51 $1,118 $75 $1,092 $950 3.75 3.68 $902 $1,099 $999 3.5 $986 3.44 $850 $62 $1,120 3.47 $959 3.36 3.38 $840 $750 3.0 Q4-05 Q4-06 Q1-07 Q2-0
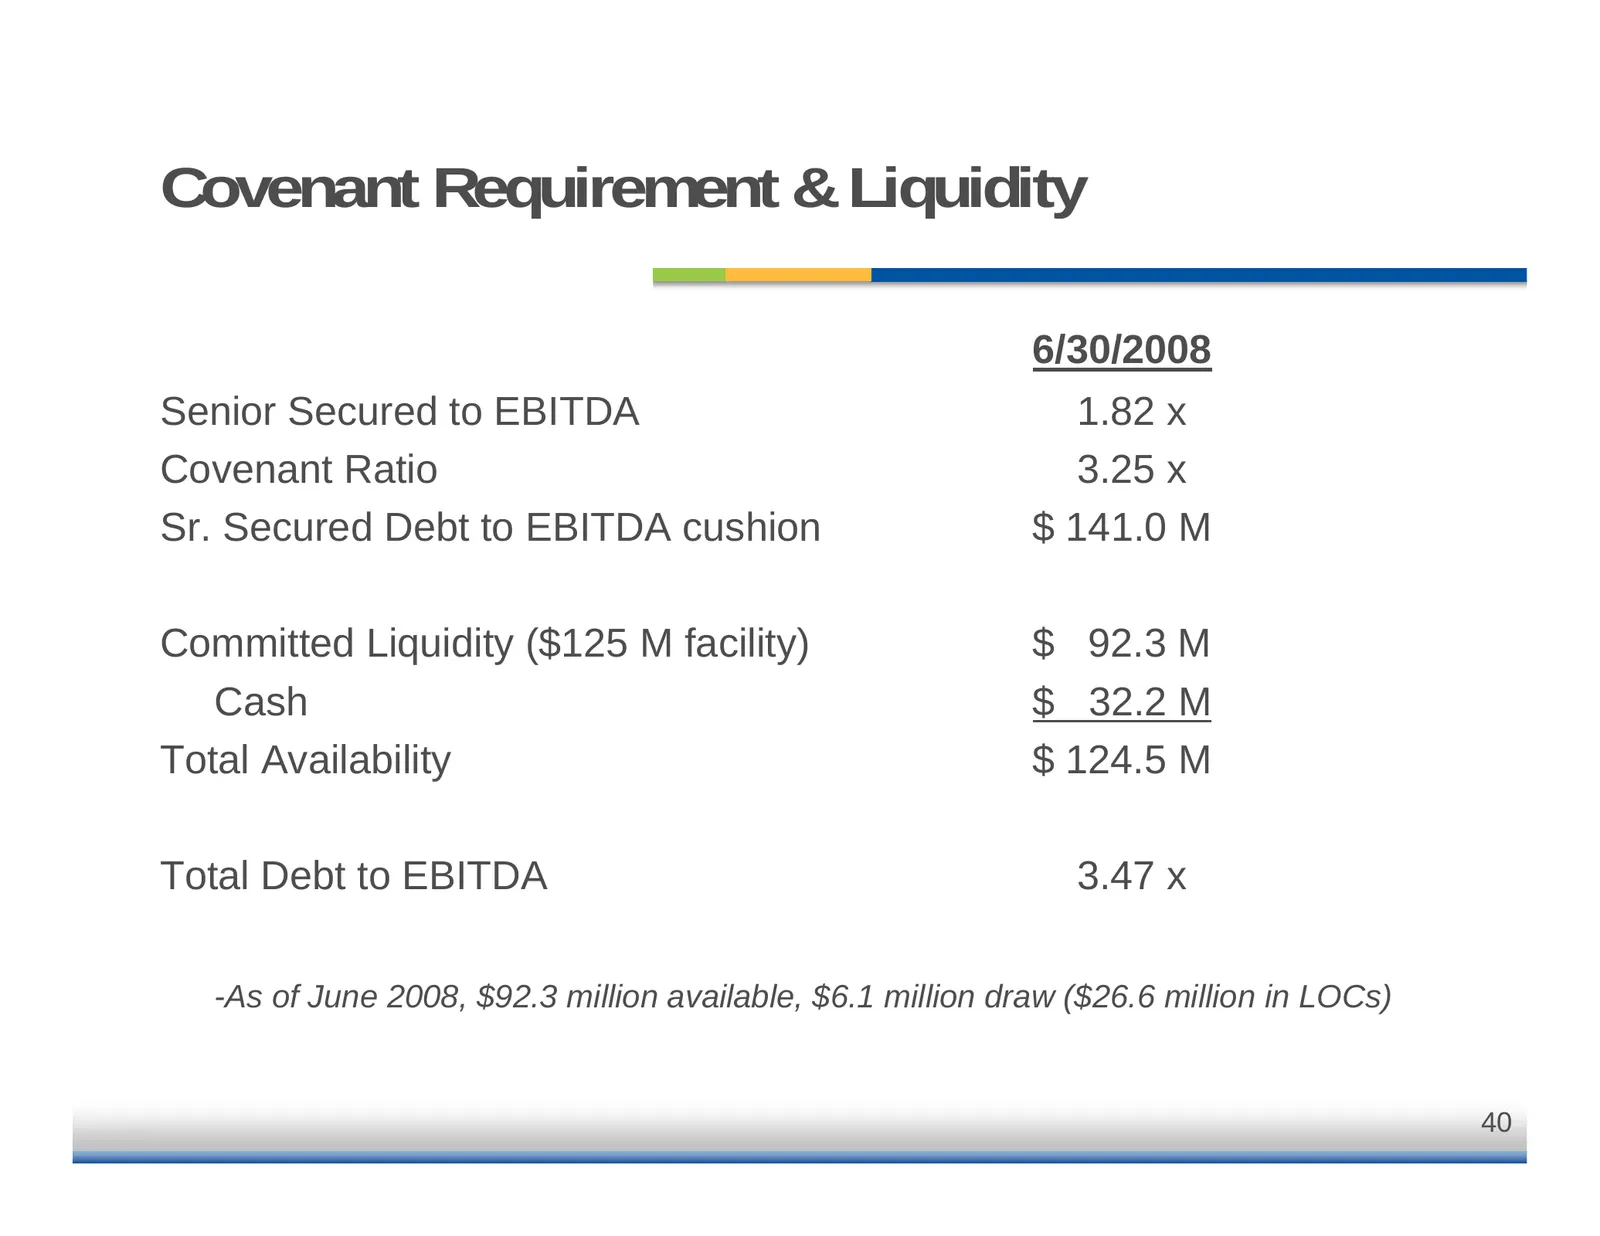
Slide 40: Covenant Requirement & Liquidity
Covenant Requirement & Liquidity 6/30/2008 Senior Secured to EBITDA 1.82 x Covenant Ratio 3.25 x Sr. Secured Debt to EBITDA cushion $ 141.0 M Committed Liquidity ($125 M facility) $ 92.3 M Cash $ 32.2 M Total Availability $ 124.5 M Total Debt to EBITDA 3.47 x -As of June 2008, $92.3 million availabl
Slide 41: Debt Maturity Profile as of June 2008
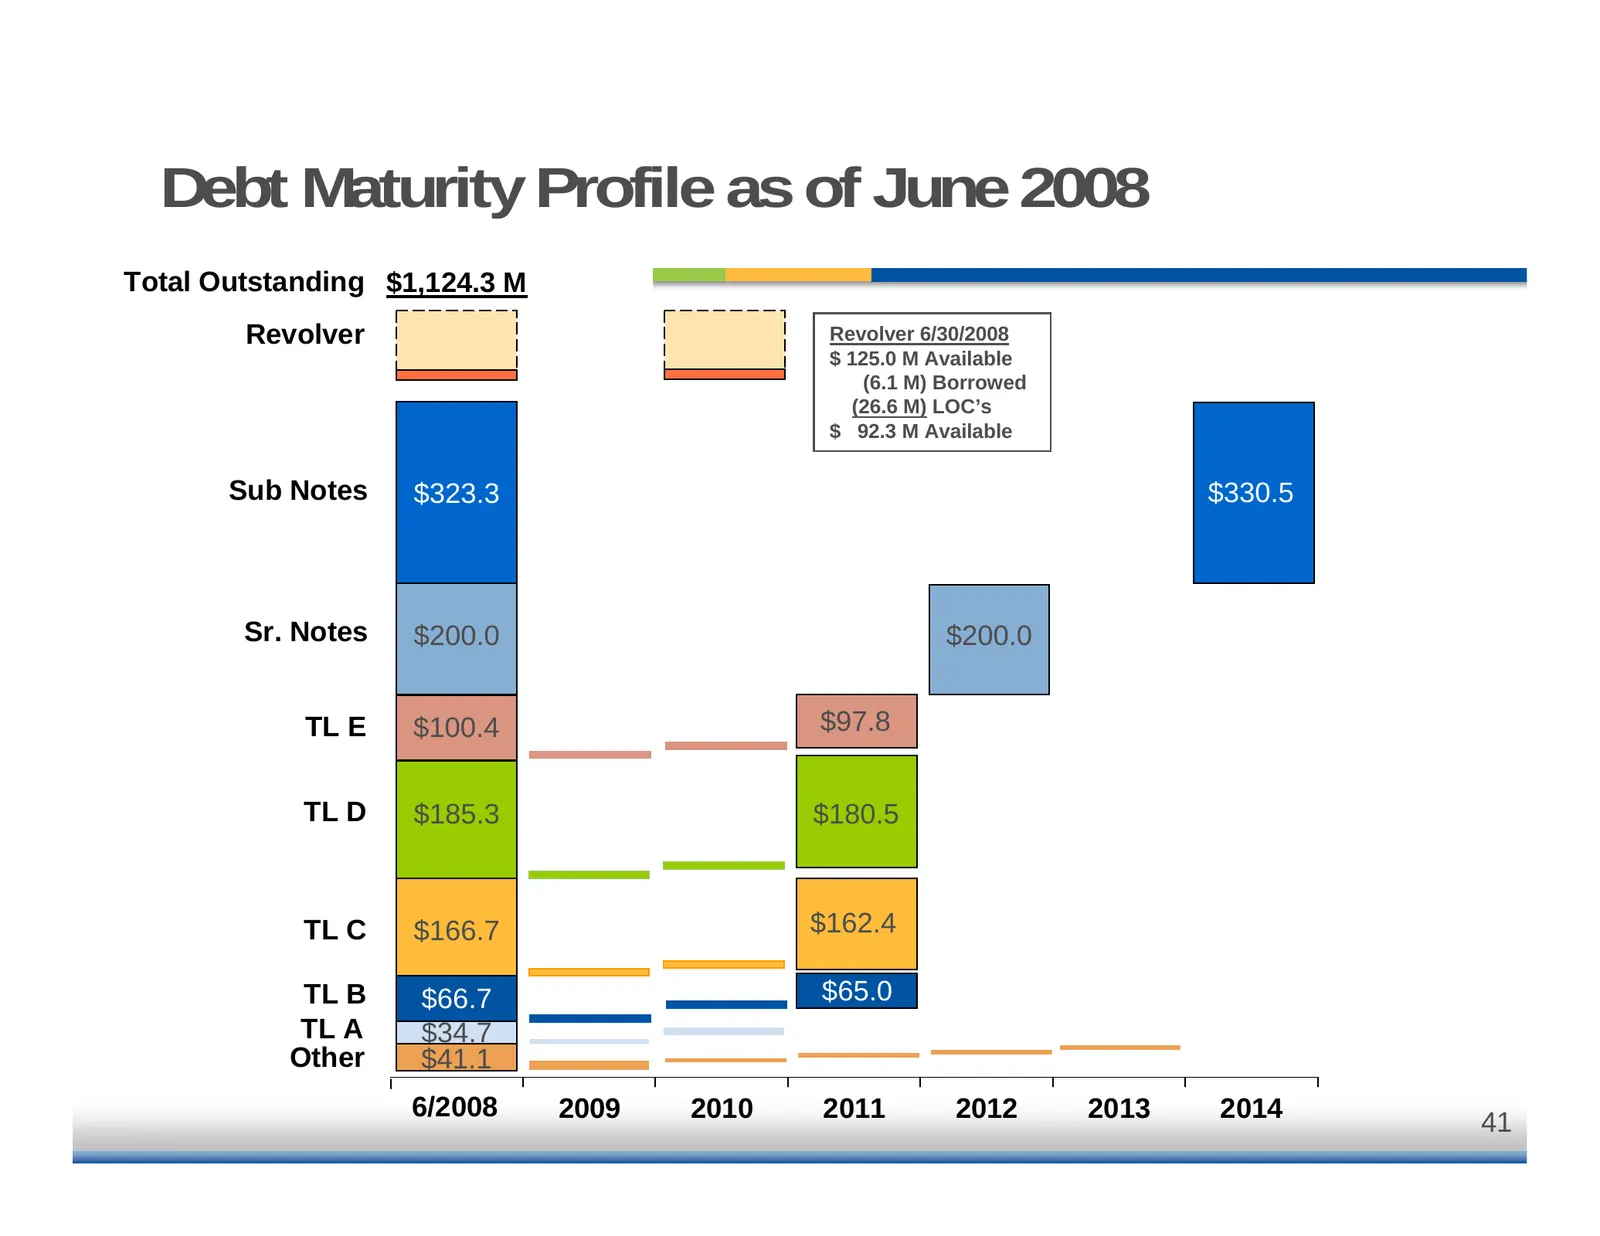
Debt Maturity Profile as of June 2008 Total Outstanding $1,124.3 M Revolver Revolver 6/30/2008 $ 125.0 M Available (6.1 M) Borrowed (26.6 M) LOC’s $ 92.3 M Available Sub Notes $323.3 $330.5 Sr. Notes $200.0 $200.0 TL E $100.4 $97.8 TL D $185.3 $180.5 TL C $166.7 $162.4 TL B $66.7 $65.0 TL A $34.7 Ot
Slide 42: Closing Summary
Closing Summary Ed Hasler – President & CEO
Slide 43: Summary
Summary Significant progress on customer and geographic diversification Strong financial performance Positioned to weather difficult industry environment Key product and technology developments aligned with industry trends 43
Slide 44: Question and Answer
Question and Answer Panel Gy" STANDARD™ AVA U TOMOTIVE
Source: Internet Archive copy of cooperstandard.com
More decks from Cooper-Standard Holdings Inc.
 Q3 2026 Earnings Presentation27 slides · Nov 5, 2026
 Investor Presentation (September 2026)18 slides · September 2026
 JP Morgan 2026 Auto Conference18 slides · Aug 12, 2026
 Q2 2026 Earnings Presentation27 slides · Aug 6, 2026
 Investor Presentation (June 2026)25 slides · June 2026
 Q1 2026 Earnings Presentation24 slides · May 7, 2026