Cooper-Standard Holdings Inc. · NYSE:CPS
Cooper-Standard — Investor Presentation (September 2026)
18 slides from Cooper-Standard's investor presentation, September 2026
Slide 1: Driving Sustainable Long-term Value
Driving Sustainable Long-term Value Investor Presentation September 2026
Slide 2: Forward-Looking Statements
Forward-Looking Statements This presentation includes “forward-looking statements” within the meaning of U.S. federal securities laws, and we intend that such forward-looking statements be subject to the safe harbor created thereby. Our use of words “estimate,” “expect,” “anticipate,” “project,” “pl

Slide 3: Company Overview
| Company Overview G CooperStandard
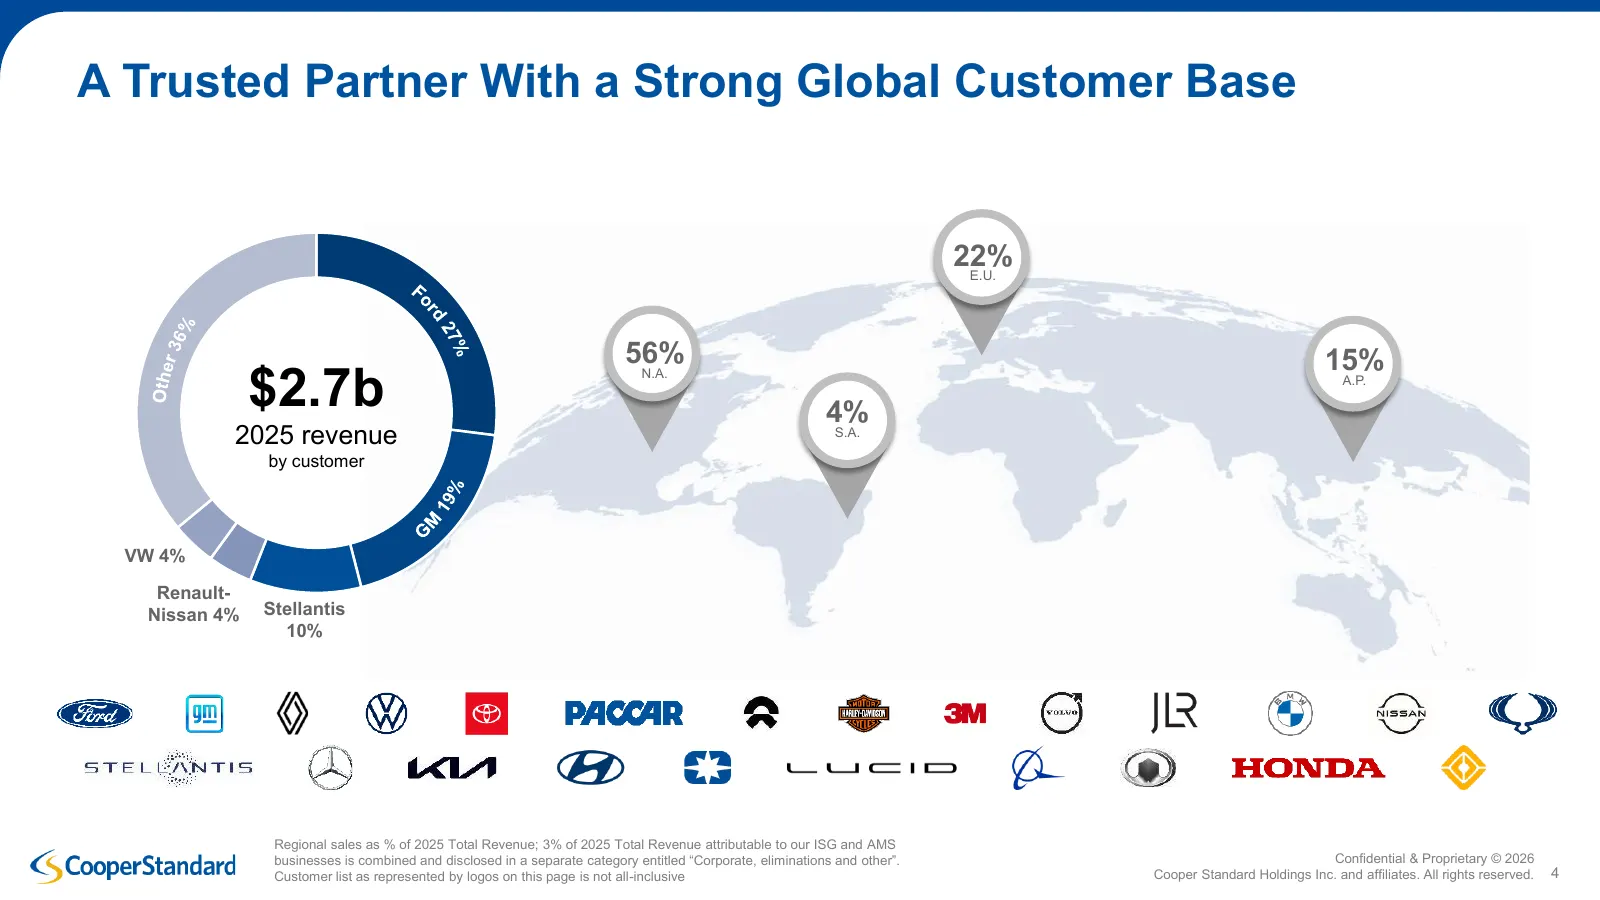
Slide 4: A Trusted Partner With a Strong Global Customer Base
A Trusted Partner With a Strong Global Customer Base 22% E.U. F or d % 27 r 36 56% 15% % $2.7b Othe N.A. A.P. 4% 2025 revenue S.A. by customer % 19 M G VW 4% Renault- Nissan 4% Stellantis 10% Regional sales as % of 2025 Total Revenue; 3% of 2025 Total Revenue attributable to our ISG and AMS business
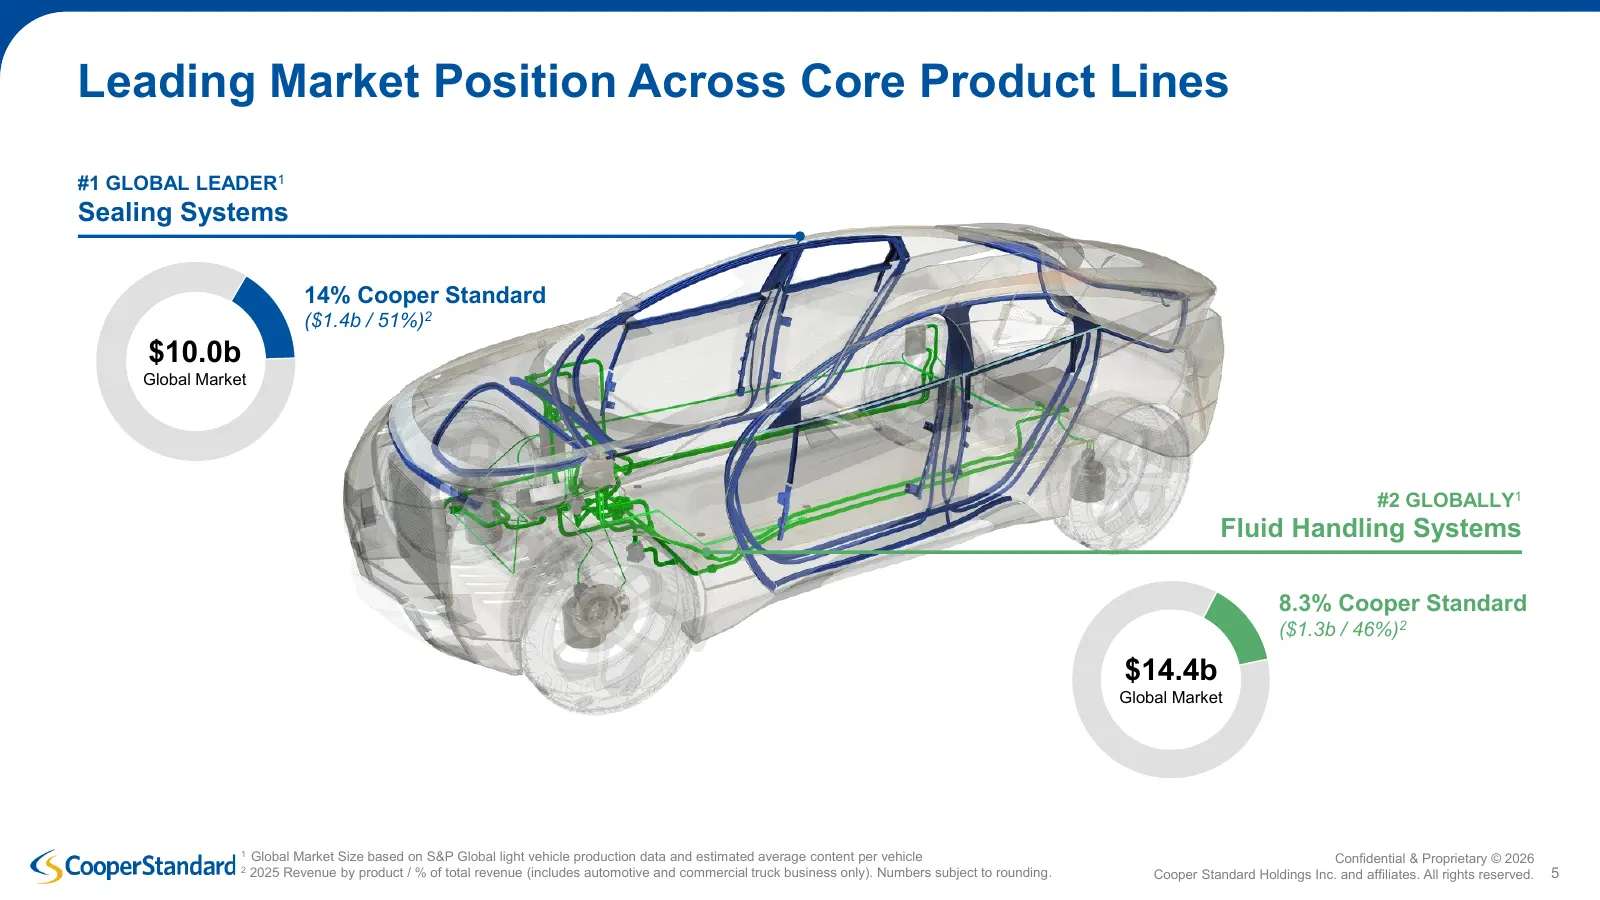
Slide 5: Leading Market Position Across Core Product Lines
Leading Market Position Across Core Product Lines #1 GLOBAL LEADER1 Sealing Systems 14% Cooper Standard ($1.4b / 51%)2 $10.0b Global Market #2 GLOBALLY1 Fluid Handling Systems 8.3% Cooper Standard ($1.3b / 46%)2 $14.4b Global Market 1 Global Market Size based on S&P Global light vehicle production d
Slide 6: Product Lines Essential for Consumer Comfort and Safety
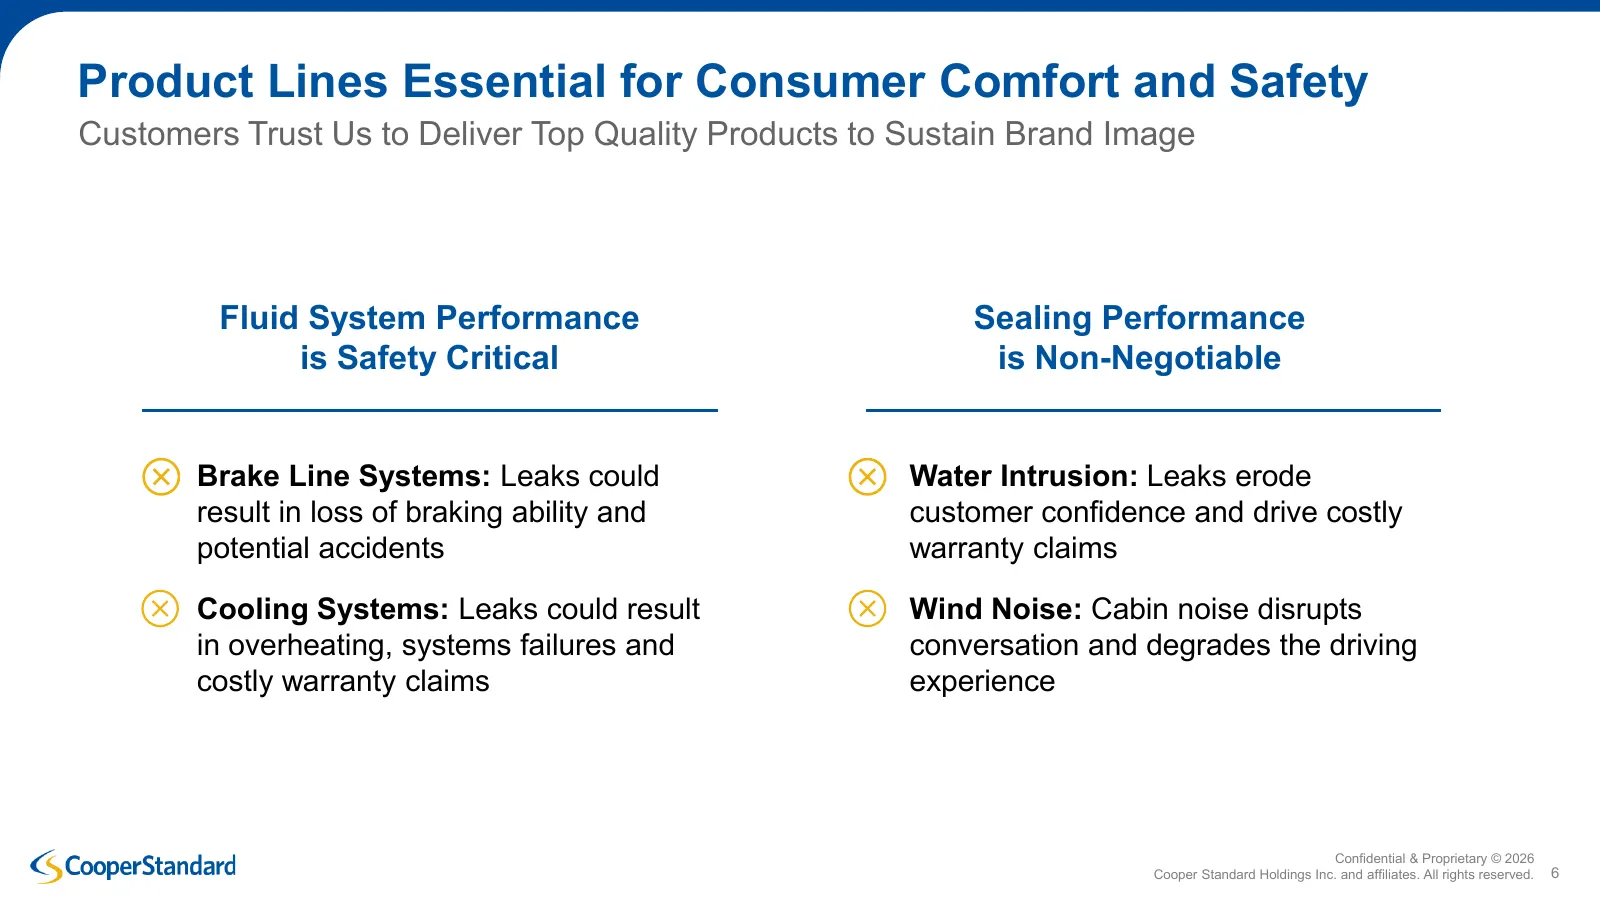
Product Lines Essential for Consumer Comfort and Safety Customers Trust Us to Deliver Top Quality Products to Sustain Brand Image Fluid System Performance Sealing Performance is Safety Critical is Non-Negotiable Brake Line Systems: Leaks could Water Intrusion: Leaks erode result in loss of braking a
Slide 7: Continually Recognized for Quality, Service and Sustainability
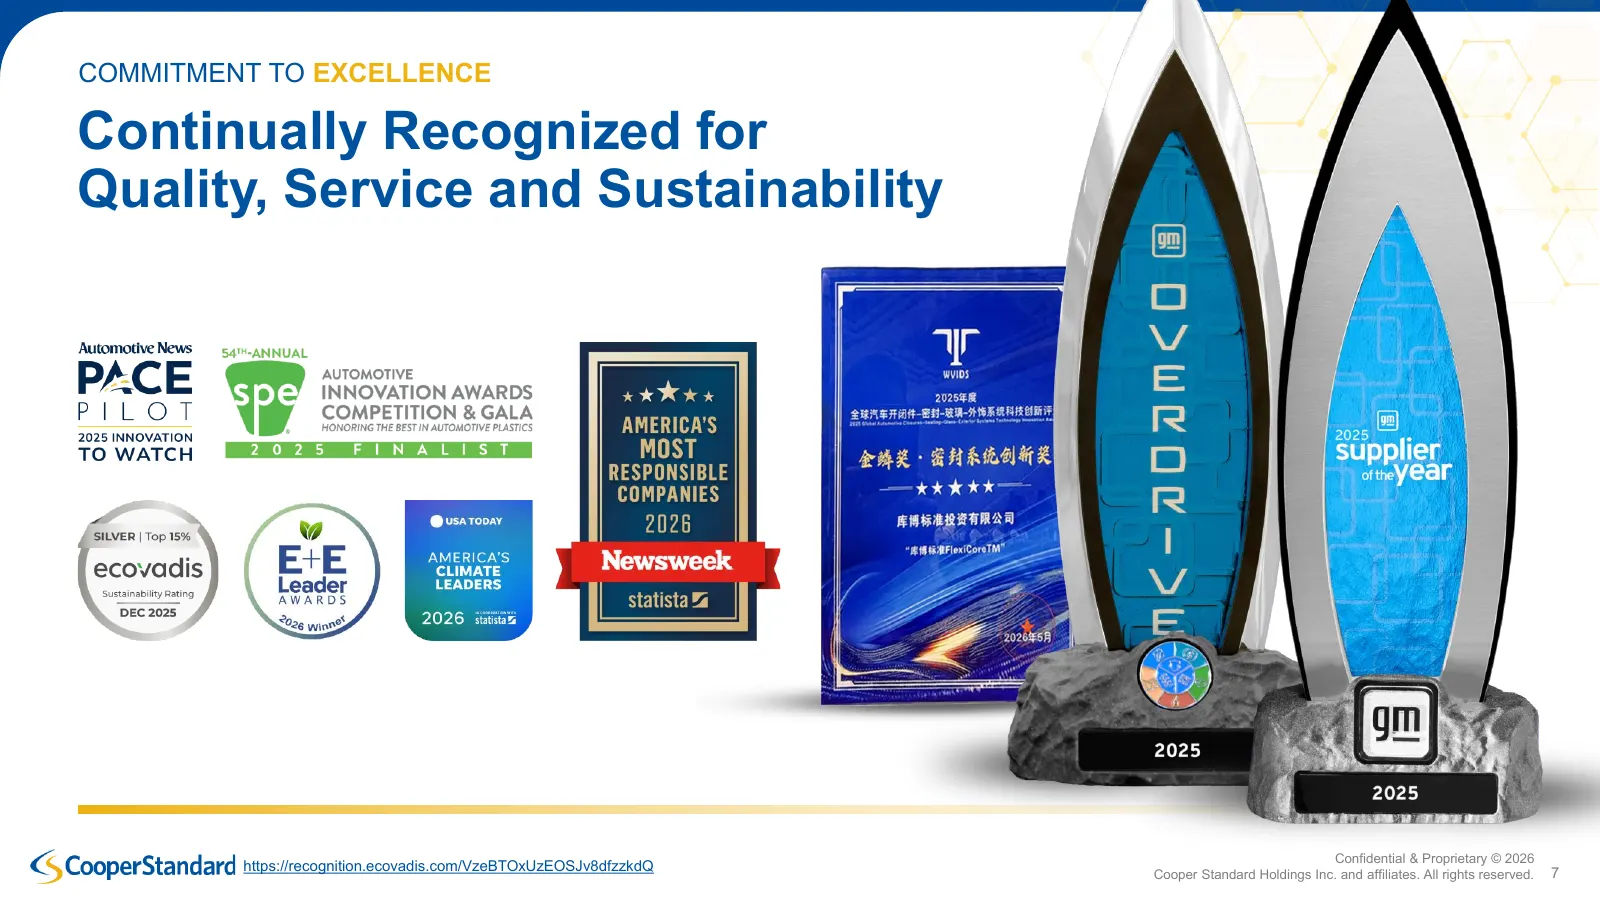
COMMITMENT TO EXCELLENCE Continually Recognized for Quality, Service and Sustainability Confidential & Proprietary © 2026 https://recognition.ecovadis.com/VzeBTOxUzEOSJv8dfzzkdQ Cooper Standard Holdings Inc. and affiliates. All rights reserved. 7
Slide 8: Strategy for Profitable Growth
Strategy for Profitable Growth
Slide 9: Sealing Systems: Accelerating Profitable Growth
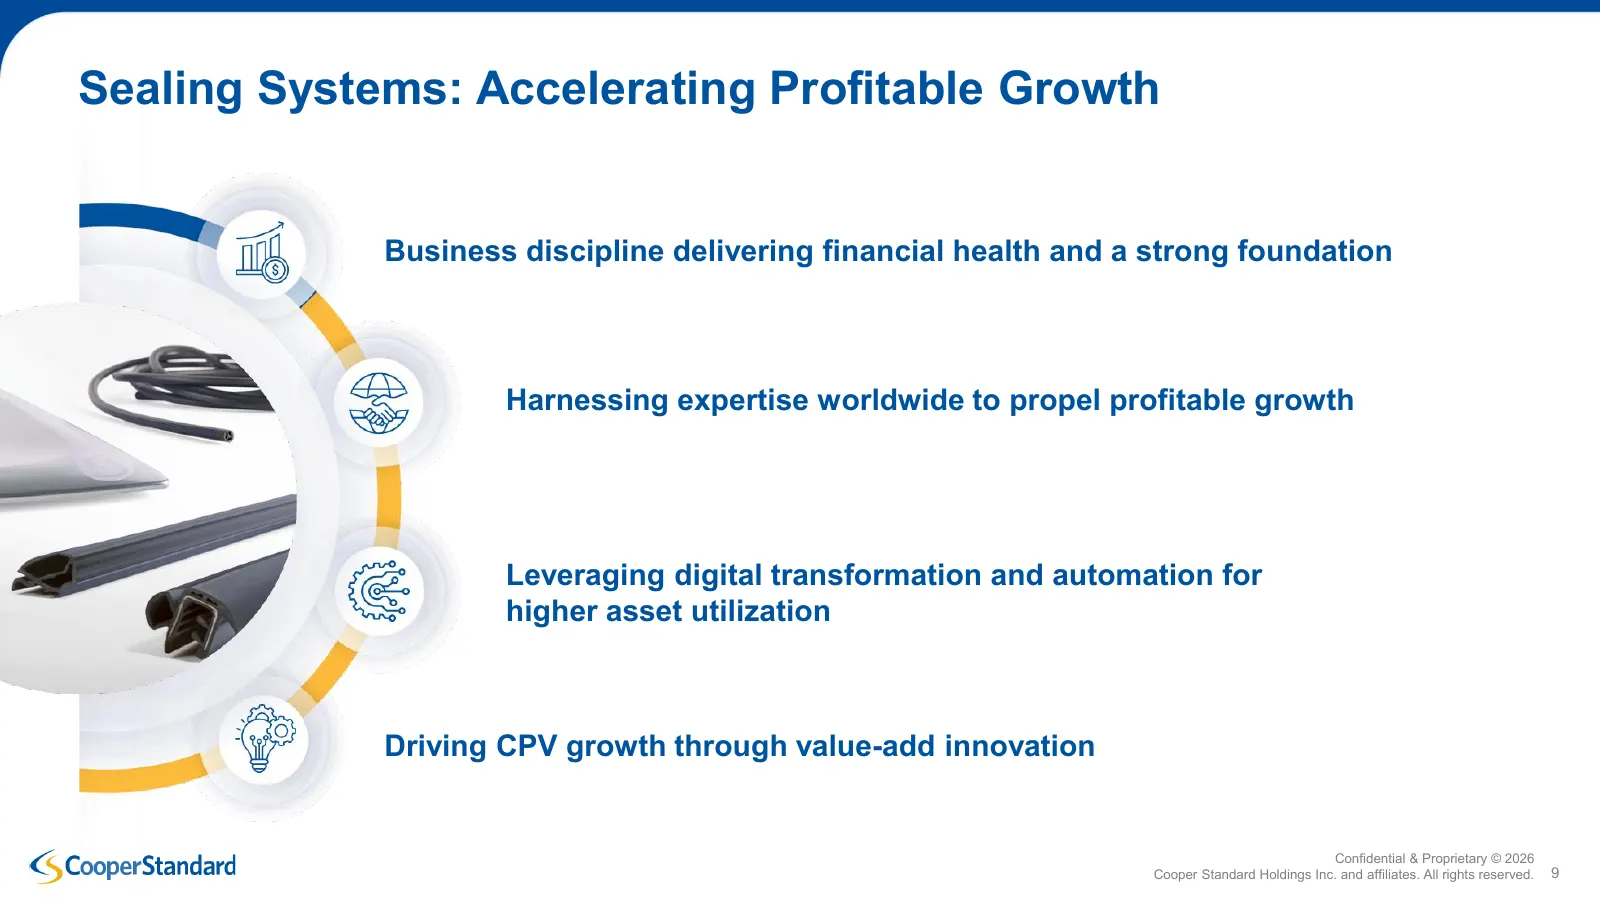
Sealing Systems: Accelerating Profitable Growth Business discipline delivering financial health and a strong foundation Harnessing expertise worldwide to propel profitable growth Leveraging digital transformation and automation for higher asset utilization Driving CPV growth through value-add innova
Slide 10: Fluid Handling: Becoming the Undisputed Supplier of Choice
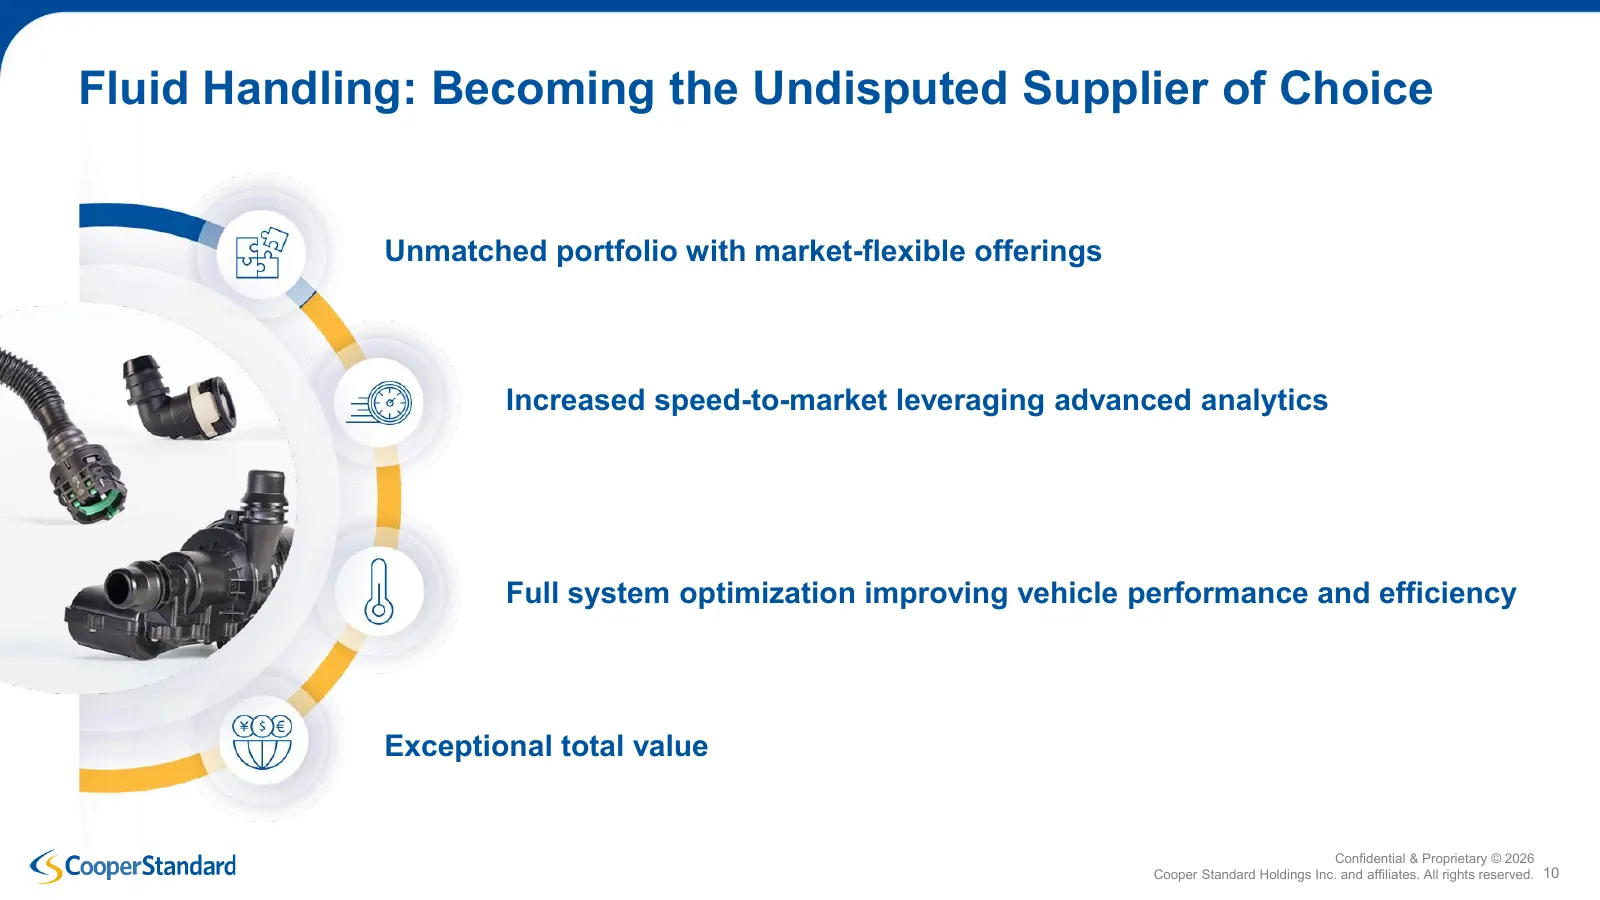
Fluid Handling: Becoming the Undisputed Supplier of Choice Unmatched portfolio with market-flexible offerings Increased speed-to-market leveraging advanced analytics Full system optimization improving vehicle performance and efficiency Exceptional total value Confidential & Proprietary © 2026 Cooper
Slide 11: Strategic Financial Targets
Strategic Financial Targets
Slide 12: Consistent Progress Toward Strategic Financial Targets
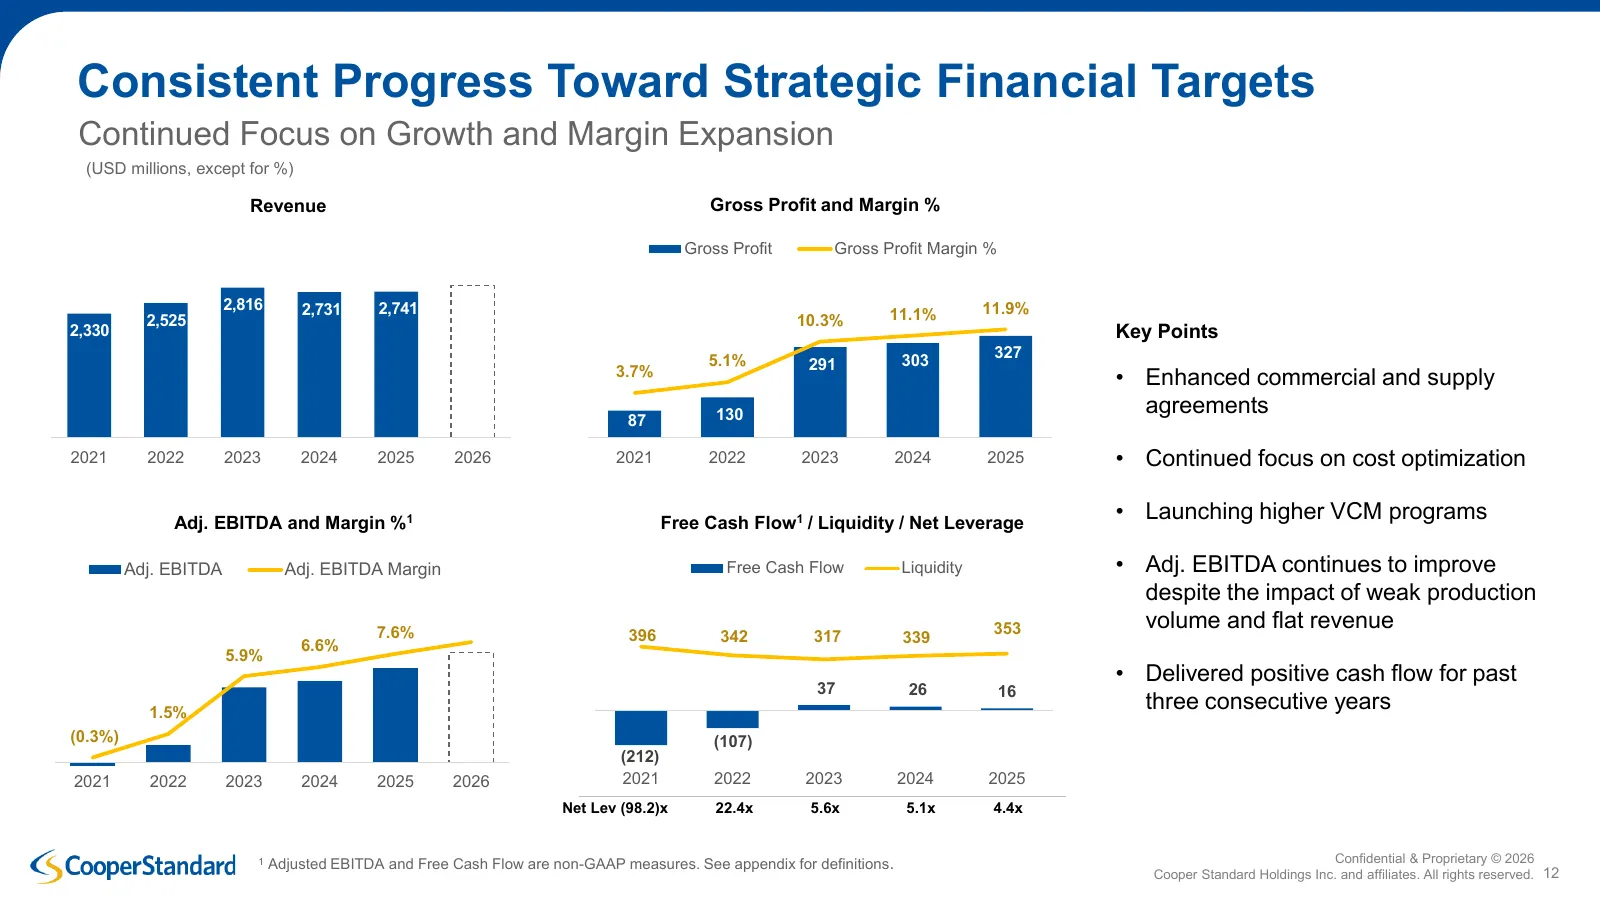
Consistent Progress Toward Strategic Financial Targets Continued Focus on Growth and Margin Expansion (USD millions, except for %) Revenue Gross Profit and Margin % Gross Profit Gross Profit Margin % 2,816 2,731 2,741 11.9% 2,525 10.3% 11.1% 2,330 Key Points 5.1% 303 327 3.7% 291 • Enhanced commerci
Slide 13: Strong Net New Business Awards Continue
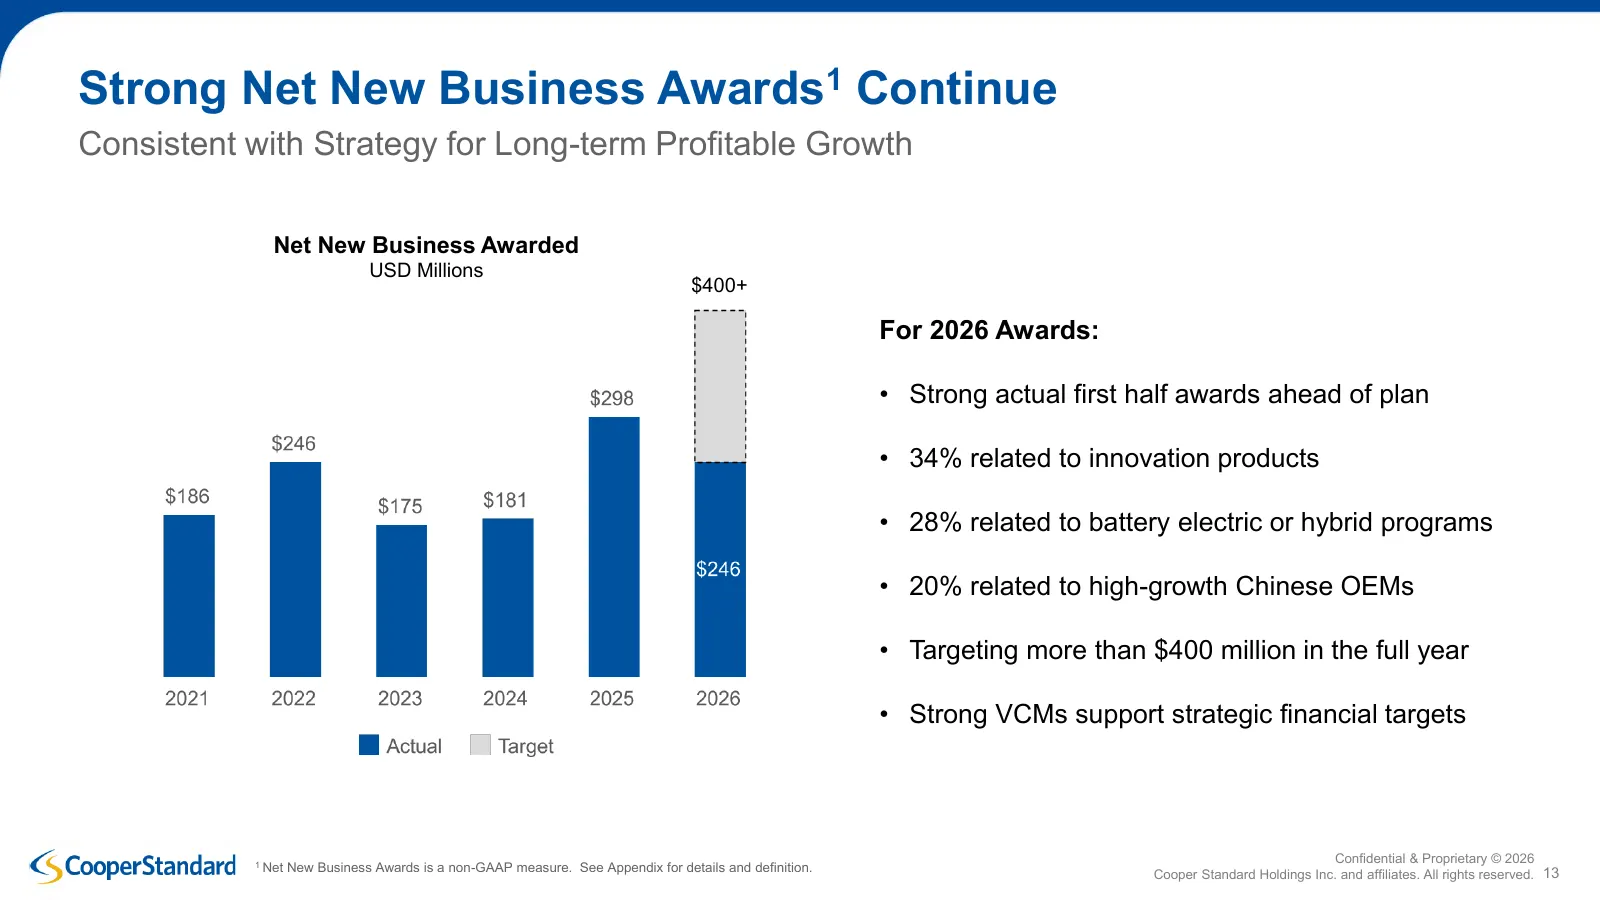
Strong Net New Business Awards1 Continue Consistent with Strategy for Long-term Profitable Growth Net New Business Awarded USD Millions $400+ For 2026 Awards: • Strong actual first half awards ahead of plan • 34% related to innovation products • 28% related to battery electric or hybrid programs • 2
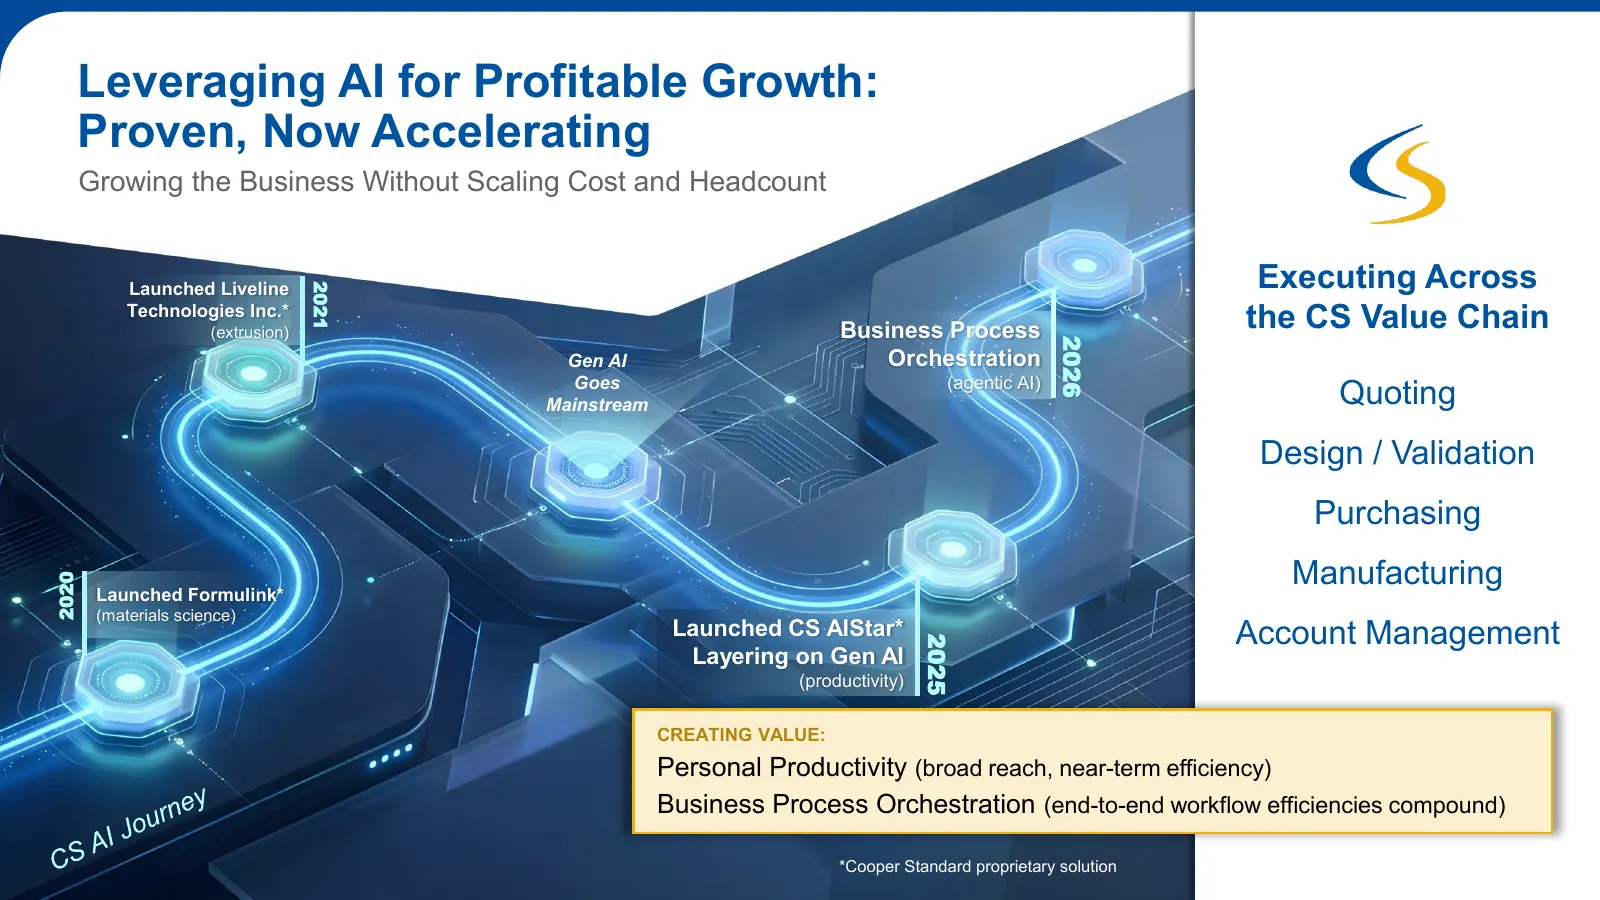
Slide 14: Leveraging AI for Profitable Growth: Proven, Now Accelerating
Leveraging AI for Profitable Growth: Proven, Now Accelerating Growing the Business Without Scaling Cost and Headcount Launched Liveline Executing Across 2021 Technologies Inc.* (extrusion) Business Process the CS Value Chain 2026 Gen AI Orchestration Goes (agentic AI) Mainstream Quoting Design / Val
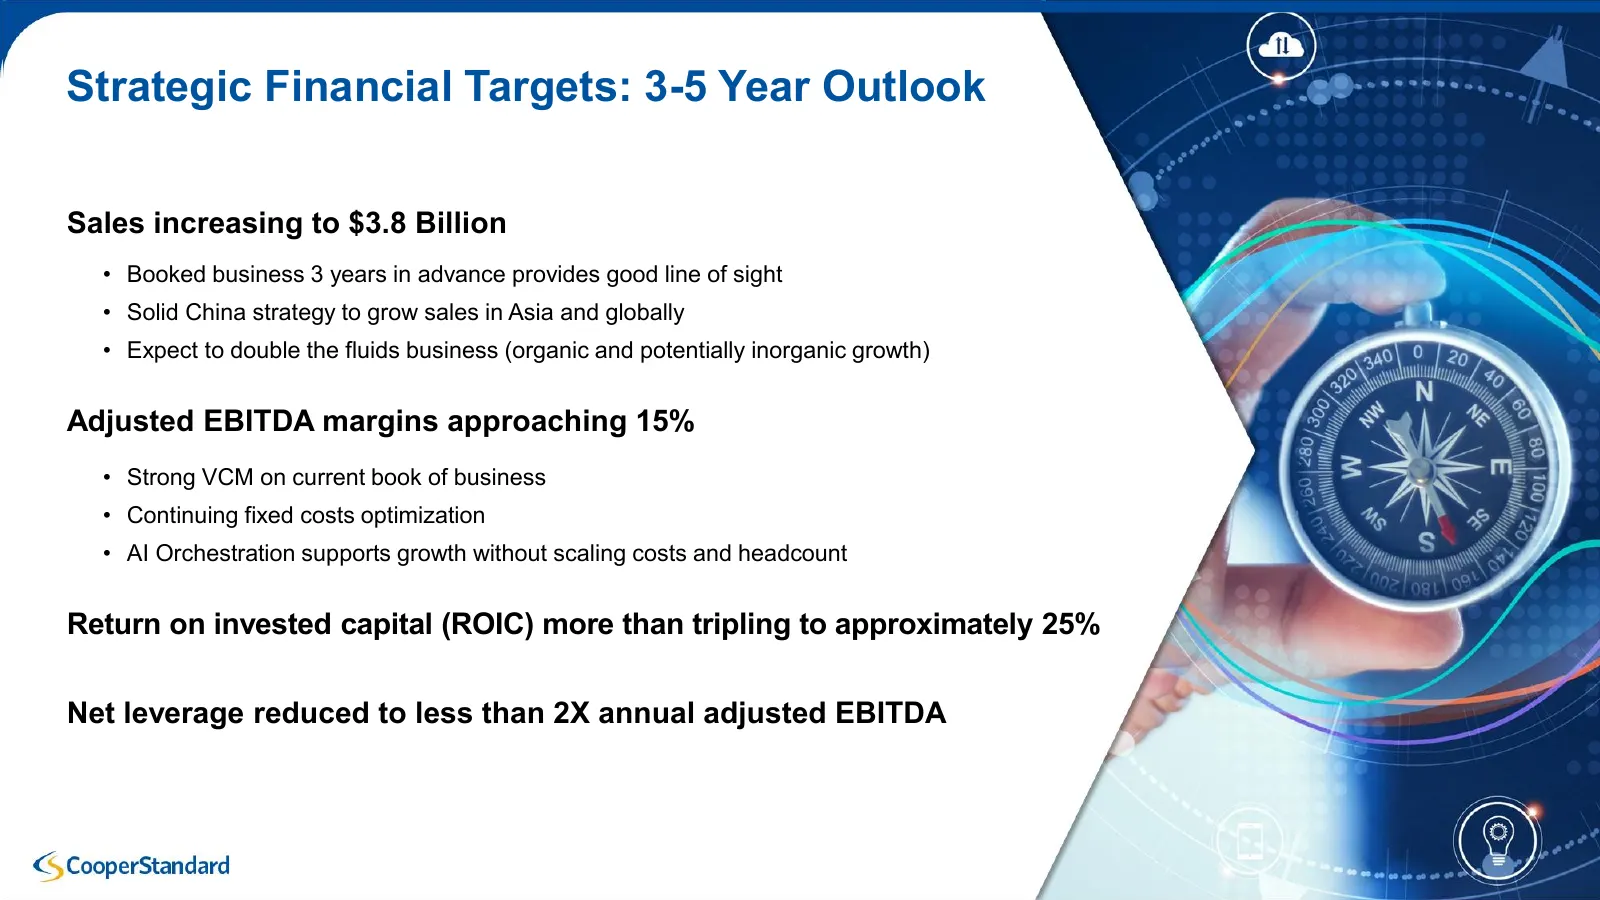
Slide 15: Strategic Financial Targets: 3-5 Year Outlook
Strategic Financial Targets: 3-5 Year Outlook Sales increasing to $3.8 Billion • Booked business 3 years in advance provides good line of sight • Solid China strategy to grow sales in Asia and globally • Expect to double the fluids business (organic and potentially inorganic growth) Adjusted EBITDA

Slide 16: Appendix
G CooperStandard
Slide 17: Non-GAAP Financial Measures
Non-GAAP Financial Measures EBITDA, adjusted EBITDA, adjusted EBITDA margin, adjusted net income (loss), adjusted earnings (loss) per share and free cash flow are measures not recognized under U.S. GAAP and which exclude certain non-cash and special items that may obscure trends and operating perfor
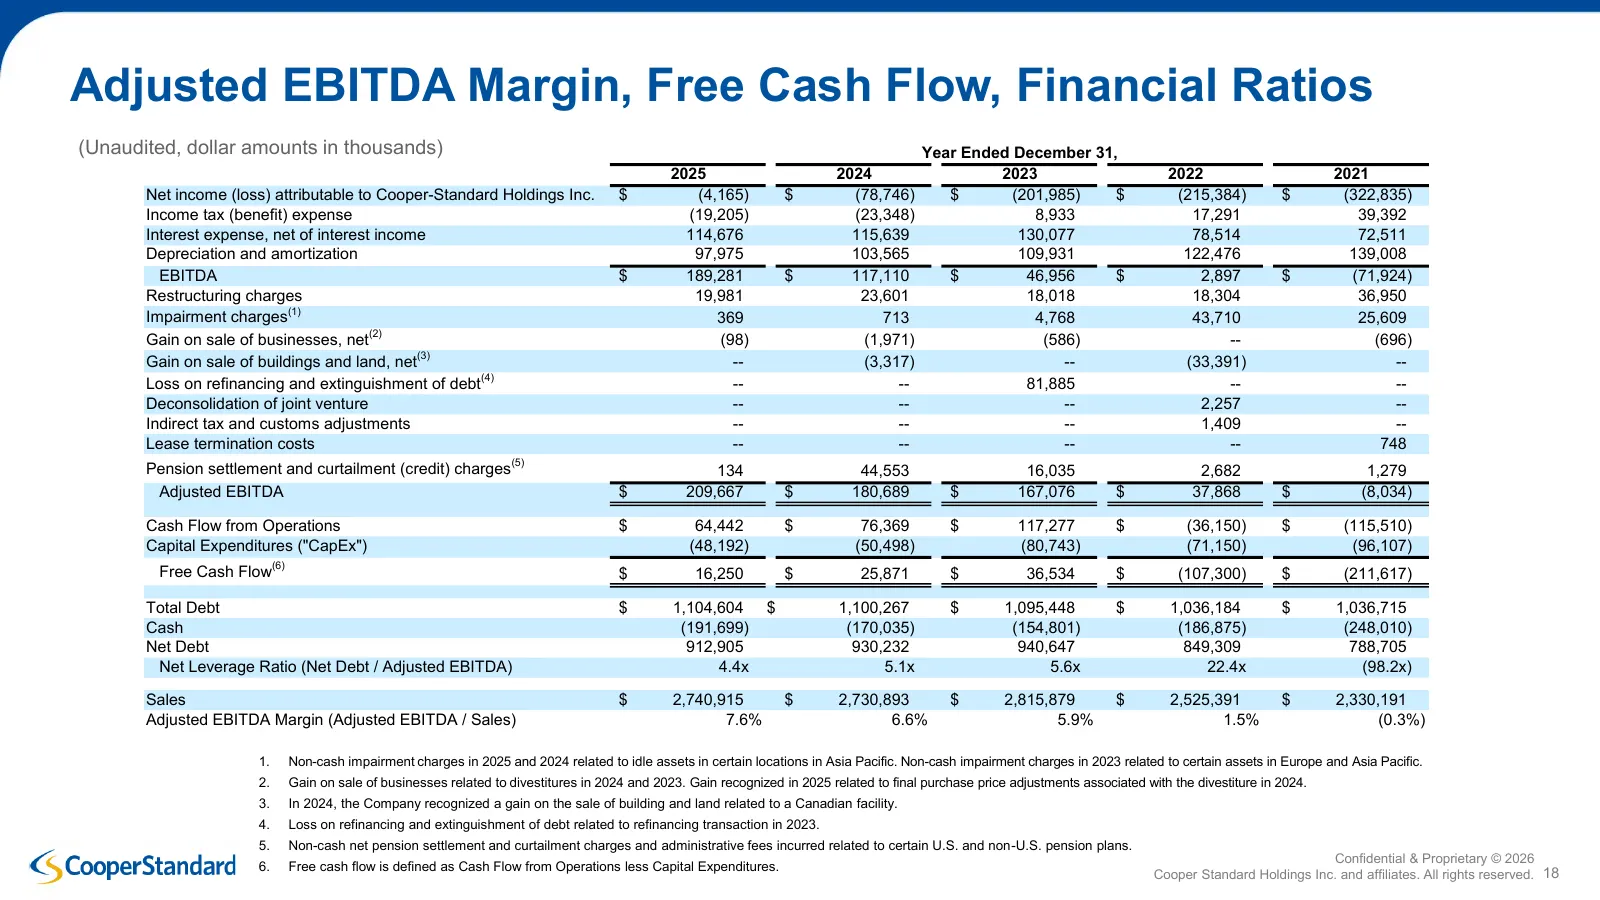
Slide 18: Adjusted EBITDA Margin, Free Cash Flow, Financial Ratios
Adjusted EBITDA Margin, Free Cash Flow, Financial Ratios (Unaudited, dollar amounts in thousands) Year Ended December 31, 2025 2024 2023 2022 2021 Net income (loss) attributable to Cooper-Standard Holdings Inc. $ (4,165) $ (78,746) $ (201,985) $ (215,384) $ (322,835) Income tax (benefit) expense (19
Source: company website
More decks from Cooper-Standard Holdings Inc.
 Q3 2026 Earnings Presentation27 slides · Nov 5, 2026
 JP Morgan 2026 Auto Conference18 slides · Aug 12, 2026
 Q2 2026 Earnings Presentation27 slides · Aug 6, 2026
 Investor Presentation (June 2026)25 slides · June 2026
 Q1 2026 Earnings Presentation24 slides · May 7, 2026
 Investor Presentation (March 2026)24 slides · March 2026