Cooper-Standard Holdings Inc. · NYSE:CPS
Cooper-Standard — Q3 2026 Earnings Presentation
27 slides from Cooper-Standard's earnings presentation, Nov 5, 2026

Slide 1: Creating Sustainable Solutions TOGETHER
Creating Sustainable Solutions TOGETHER Third Quarter 2026 Earnings Presentation November 5, 2026
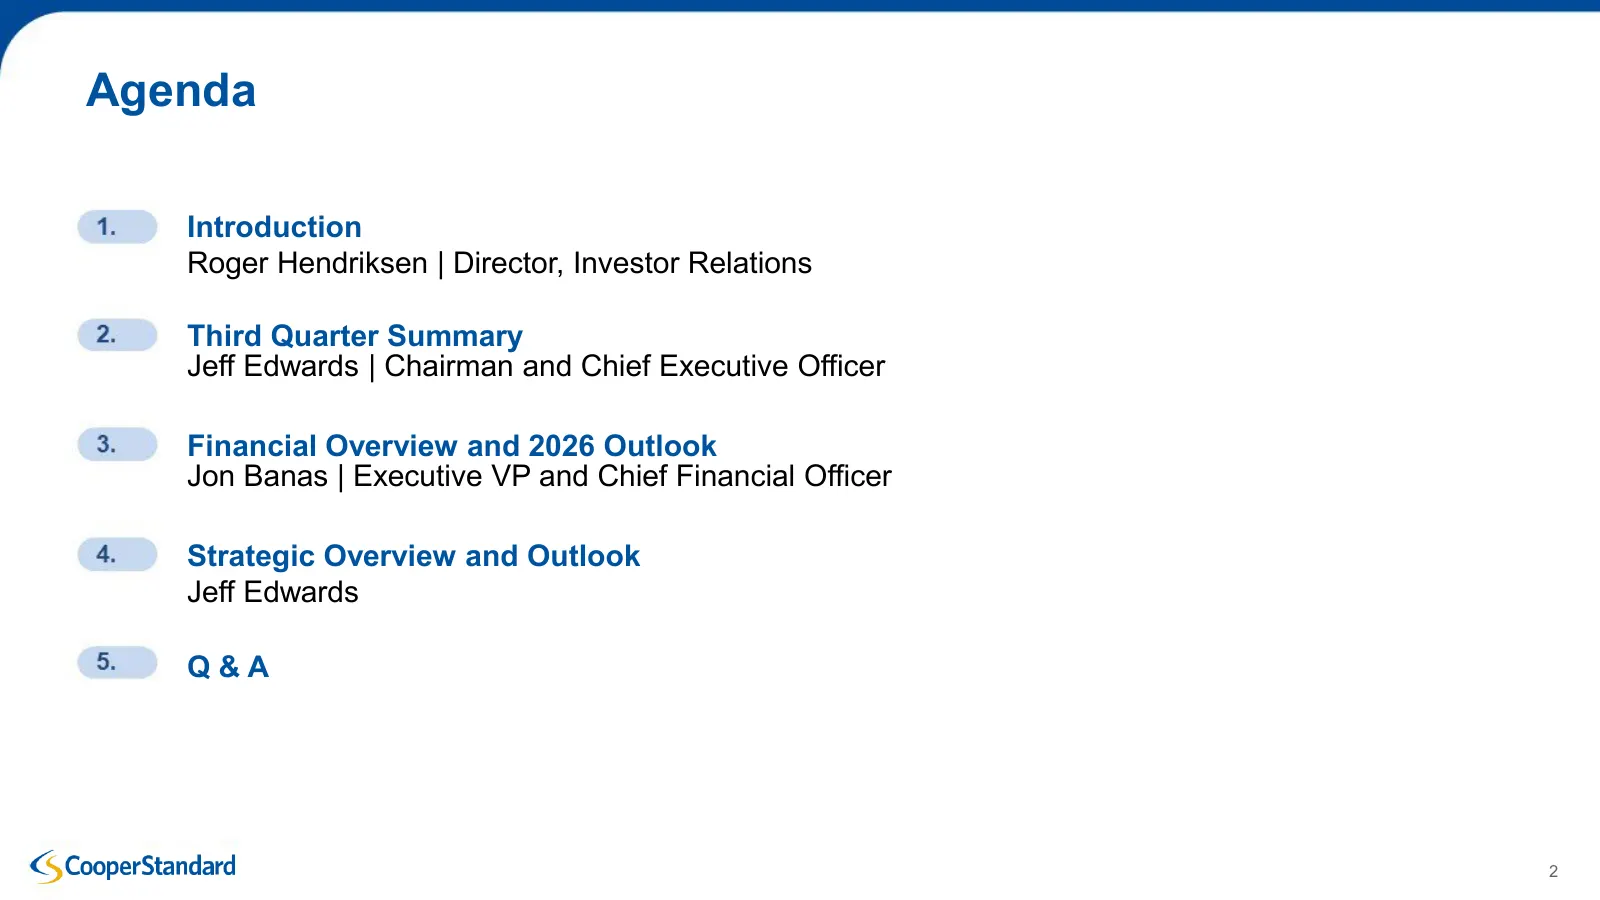
Slide 2: Agenda
Agenda Introduction Roger Hendriksen | Director, Investor Relations Third Quarter Summary Jeff Edwards | Chairman and Chief Executive Officer Financial Overview and 2026 Outlook Jon Banas | Executive VP and Chief Financial Officer Strategic Overview and Outlook Jeff Edwards Q&A 2
Slide 3: Forward-Looking Statements
Forward-Looking Statements This presentation includes “forward-looking statements” within the meaning of U.S. federal securities laws, and we intend that such forward-looking statements be subject to the safe harbor created thereby. Our use of words “estimate,” “expect,” “anticipate,” “project,” “pl
Slide 4: Third Quarter Summary
Third Quarter Summary Jeff Edwards, Chairman and CEO
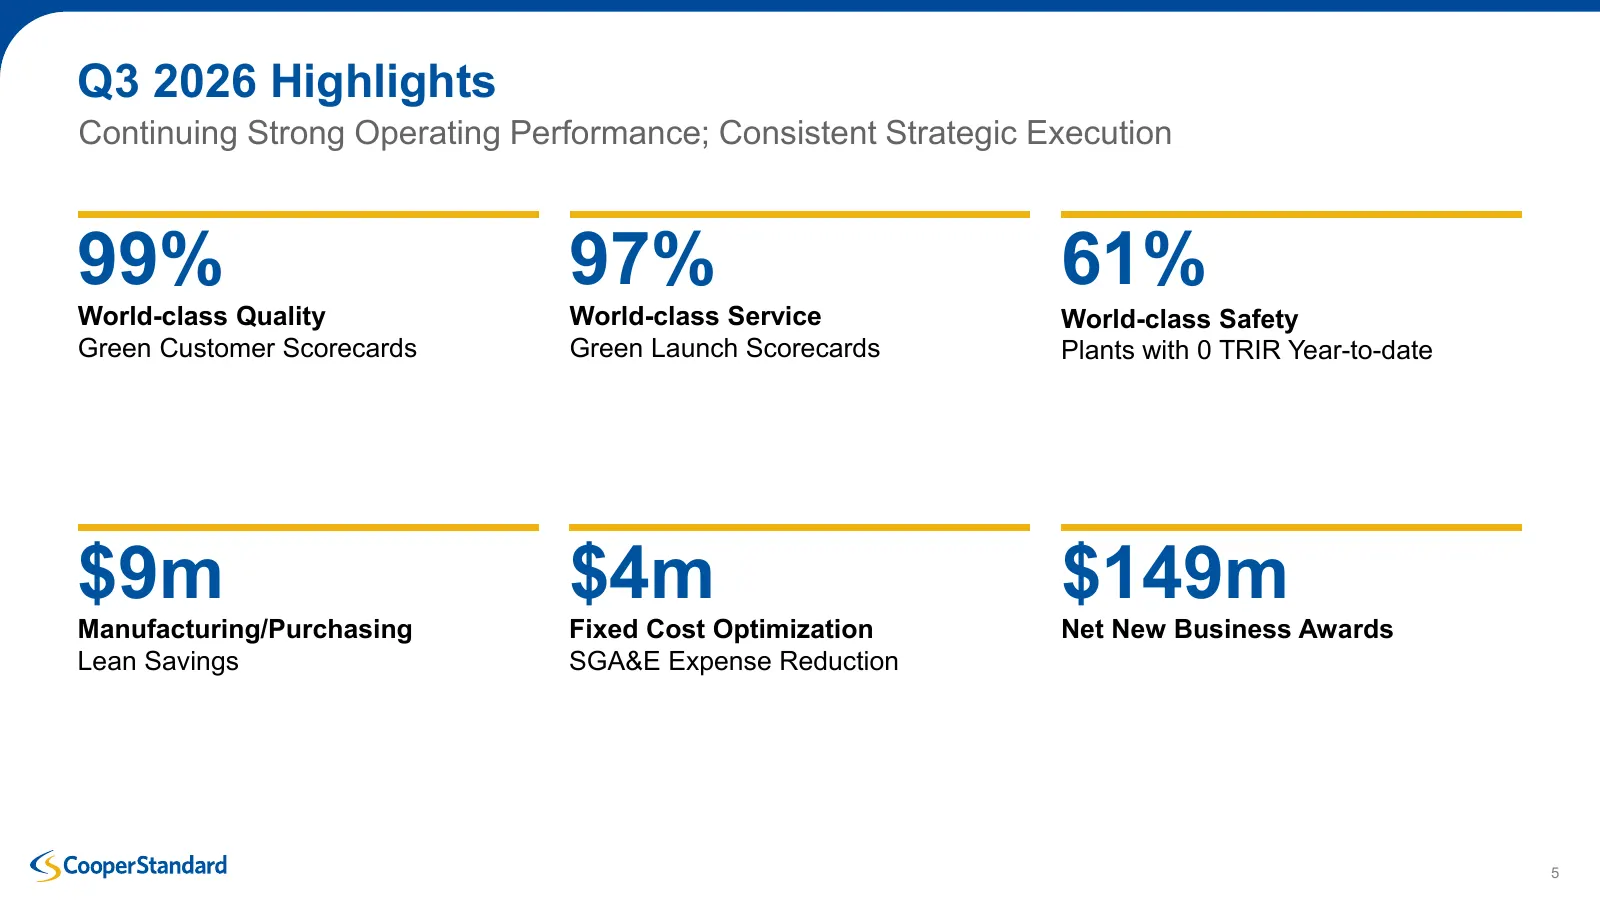
Slide 5: Q3 2026 Highlights
Q3 2026 Highlights Continuing Strong Operating Performance; Consistent Strategic Execution 99% 97% 61% World-class Quality World-class Service World-class Safety Green Customer Scorecards Green Launch Scorecards Plants with 0 TRIR Year-to-date $9m $4m $149m Manufacturing/Purchasing Fixed Cost Optimi
Slide 6: Net New Business Awards Continue at Record Pace
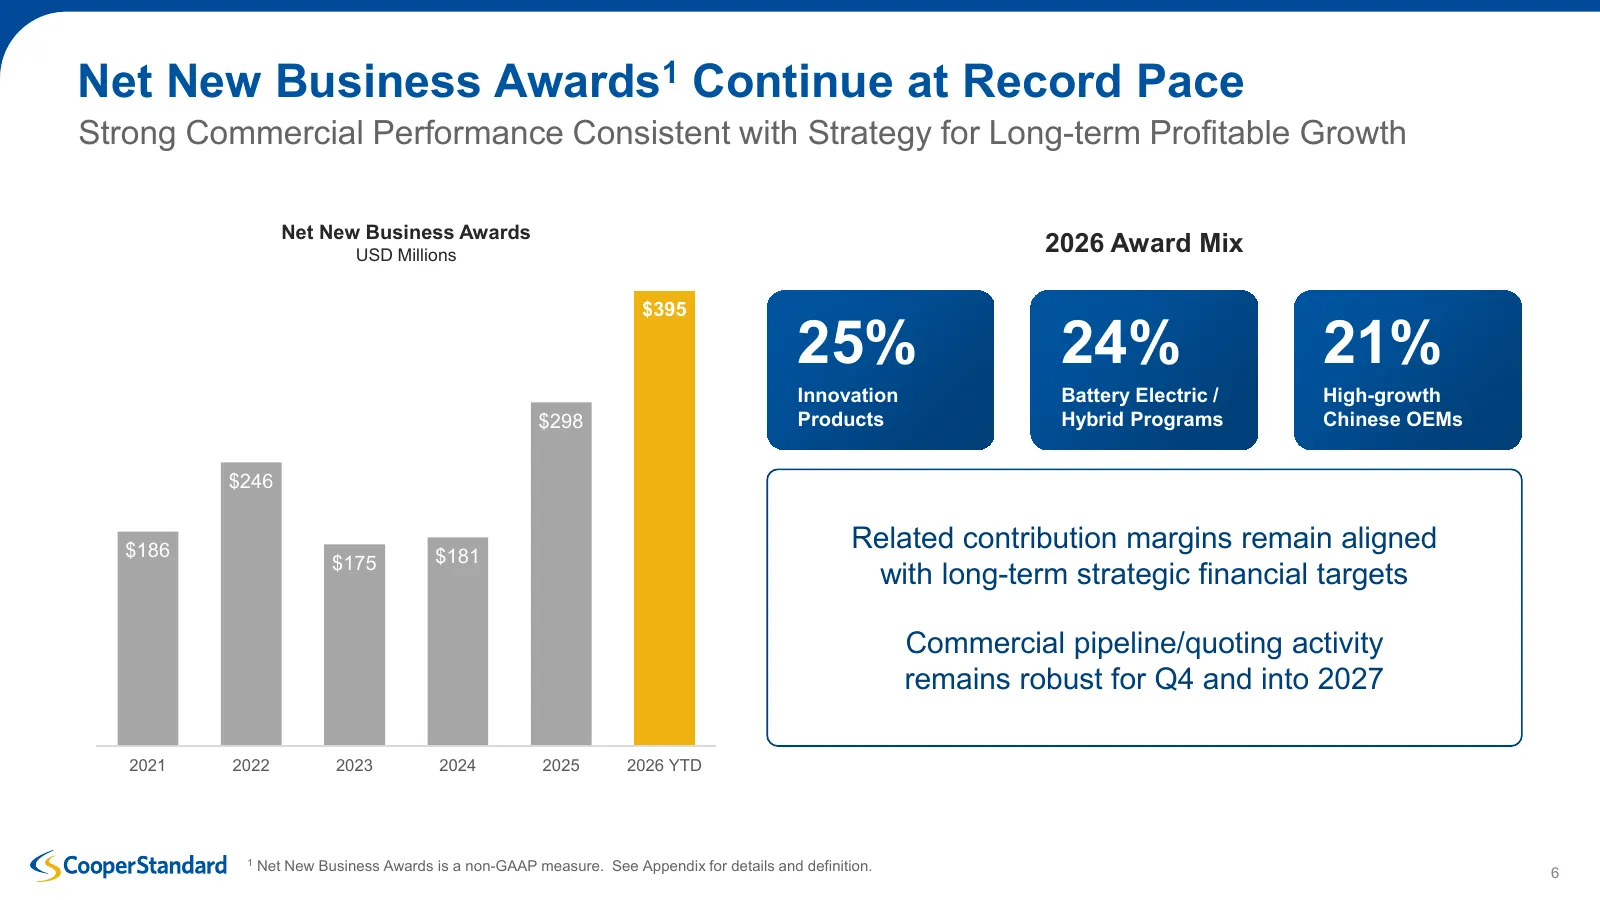
Net New Business Awards1 Continue at Record Pace Strong Commercial Performance Consistent with Strategy for Long-term Profitable Growth Net New Business Awards USD Millions 2026 Award Mix $395 25% 24% 21% Innovation Battery Electric / High-growth $298 Products Hybrid Programs Chinese OEMs $246 $186
Slide 7: Ongoing Recognition for Quality, Service and Culture
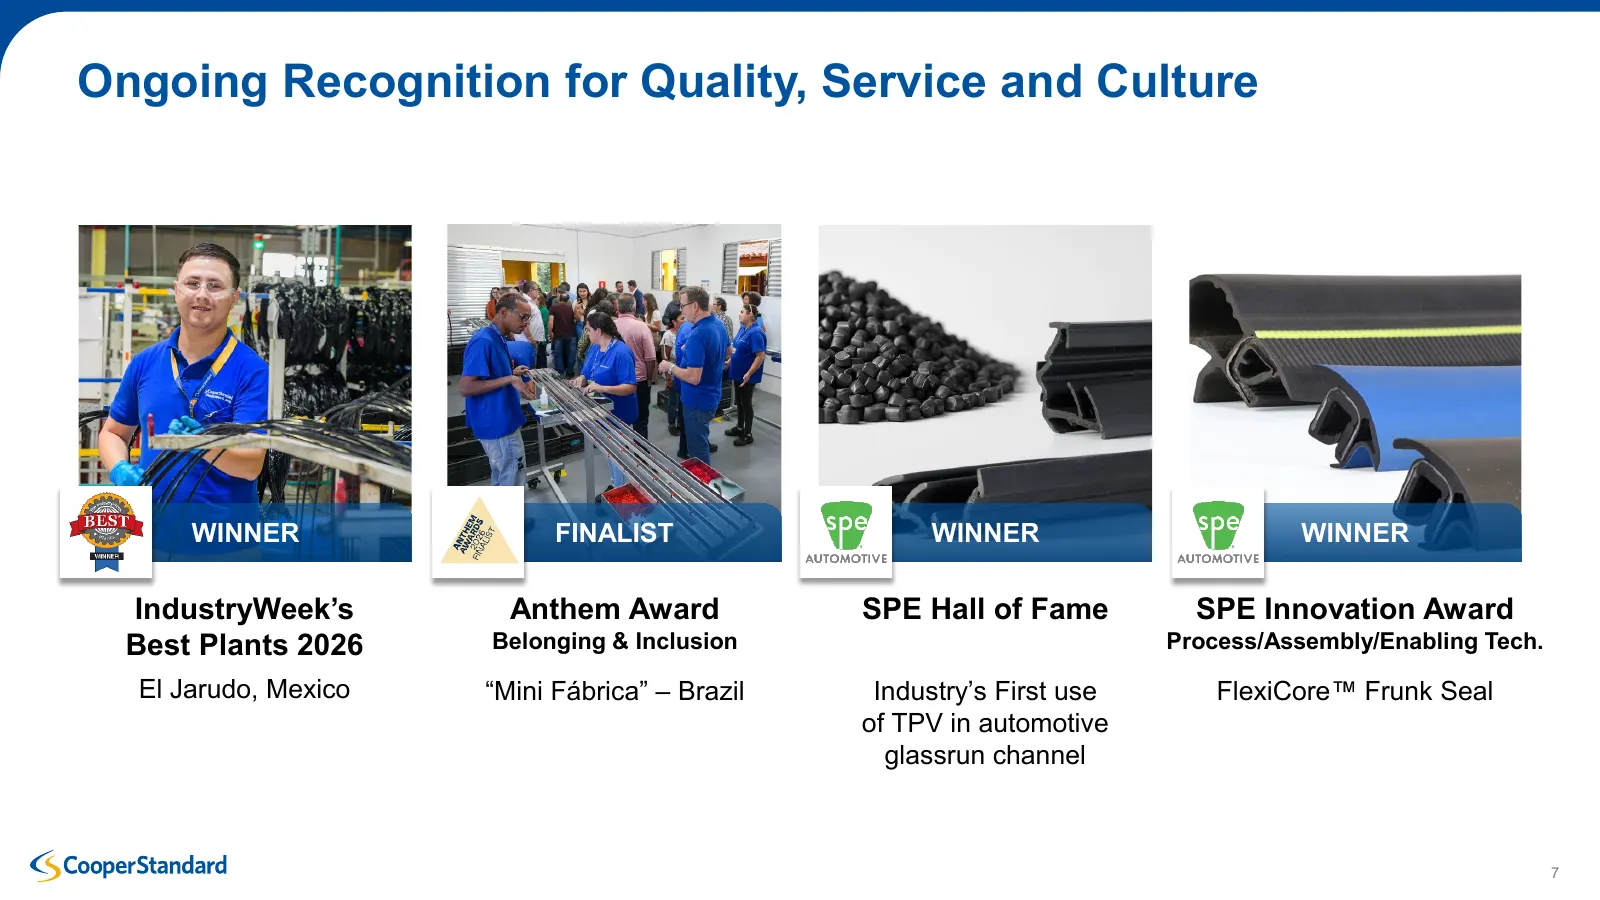
Ongoing Recognition for Quality, Service and Culture WINNER FINALIST WINNER WINNER IndustryWeek’s Anthem Award SPE Hall of Fame SPE Innovation Award Best Plants 2026 Belonging & Inclusion Process/Assembly/Enabling Tech. El Jarudo, Mexico “Mini Fábrica” – Brazil Industry’s First use FlexiCore Frunk S
Slide 8: Financial Overview and 2026 Outlook
Financial Overview and 2026 Outlook Jon Banas, Executive VP and CFO
Slide 9: Financial Results
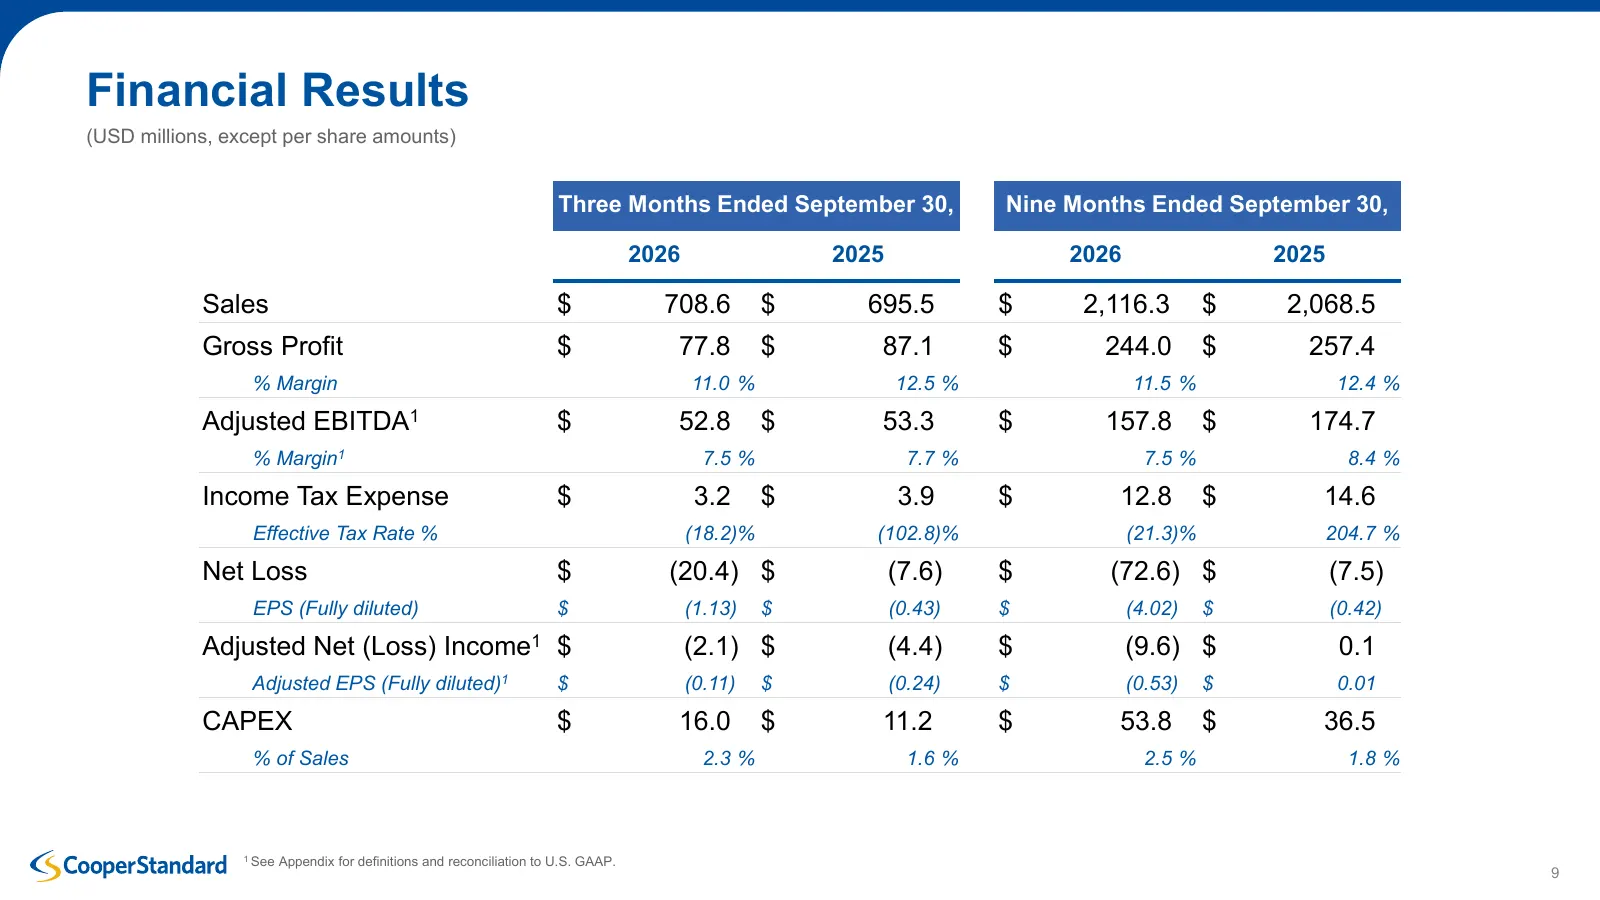
Financial Results (USD millions, except per share amounts) Three Months Ended September 30, Nine Months Ended September 30, 2026 2025 2026 2025 Sales $ 708.6 $ 695.5 $ 2,116.3 $ 2,068.5 Gross Profit $ 77.8 $ 87.1 $ 244.0 $ 257.4 % Margin 11.0 % 12.5 % 11.5 % 12.4 % Adjusted EBITDA1 $ 52.8 $ 53.3 $ 1
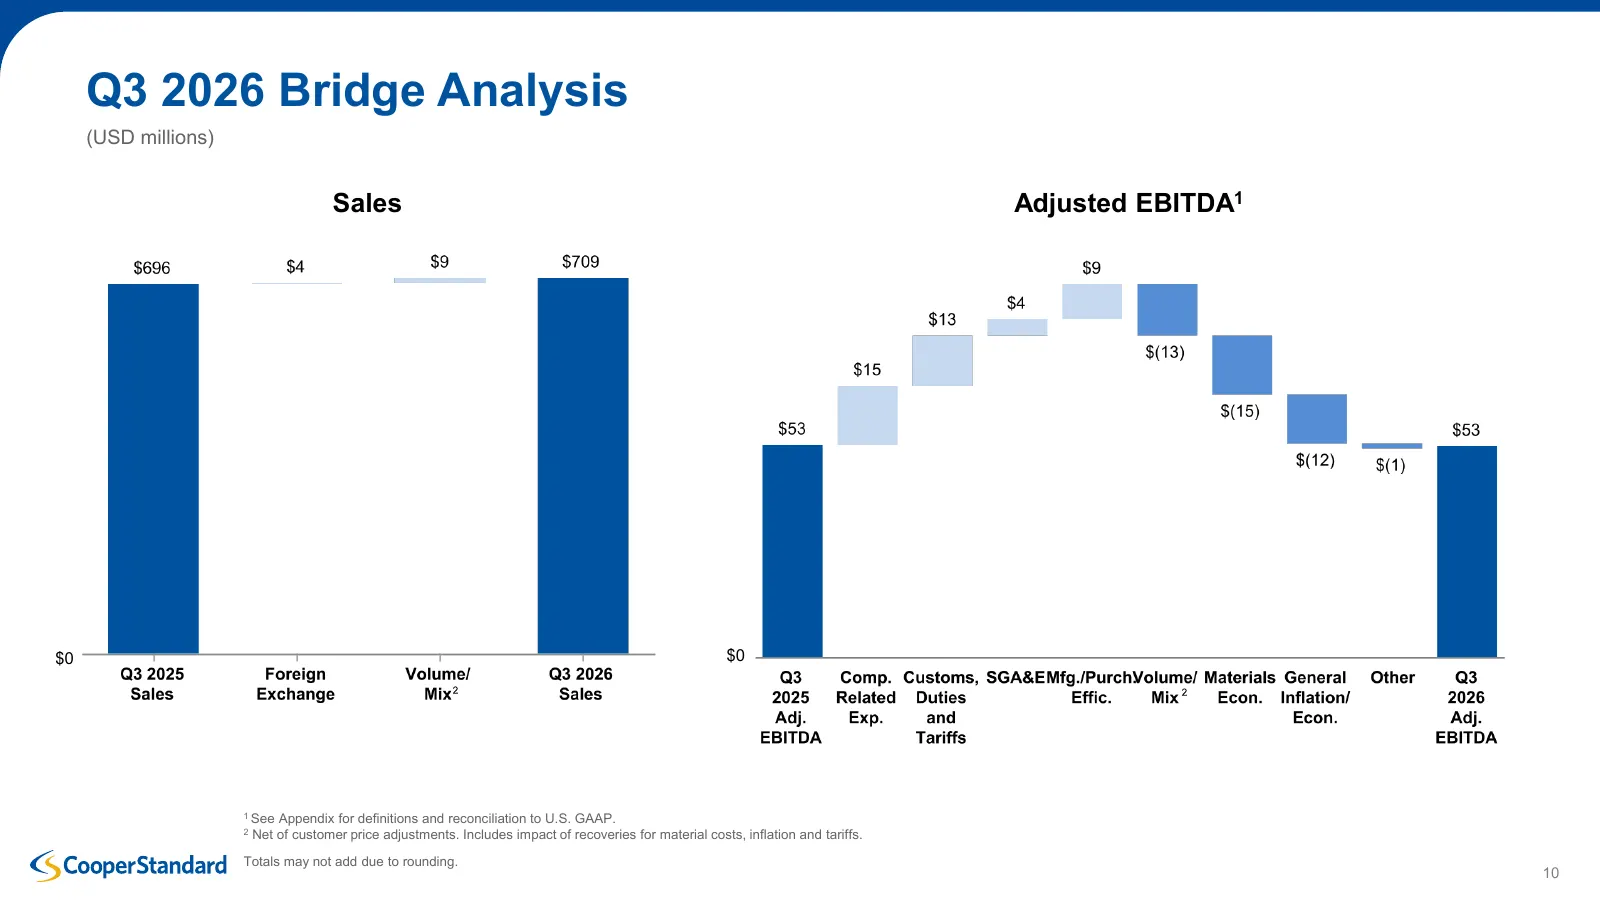
Slide 10: Q3 2026 Bridge Analysis
Q3 2026 Bridge Analysis (USD millions) Sales Adjusted EBITDA1 $0 $0 1 See Appendix for definitions and reconciliation to U.S. GAAP. 2 Net of customer price adjustments. Includes impact of recoveries for material costs, inflation and tariffs. Totals may not add due to rounding. 10
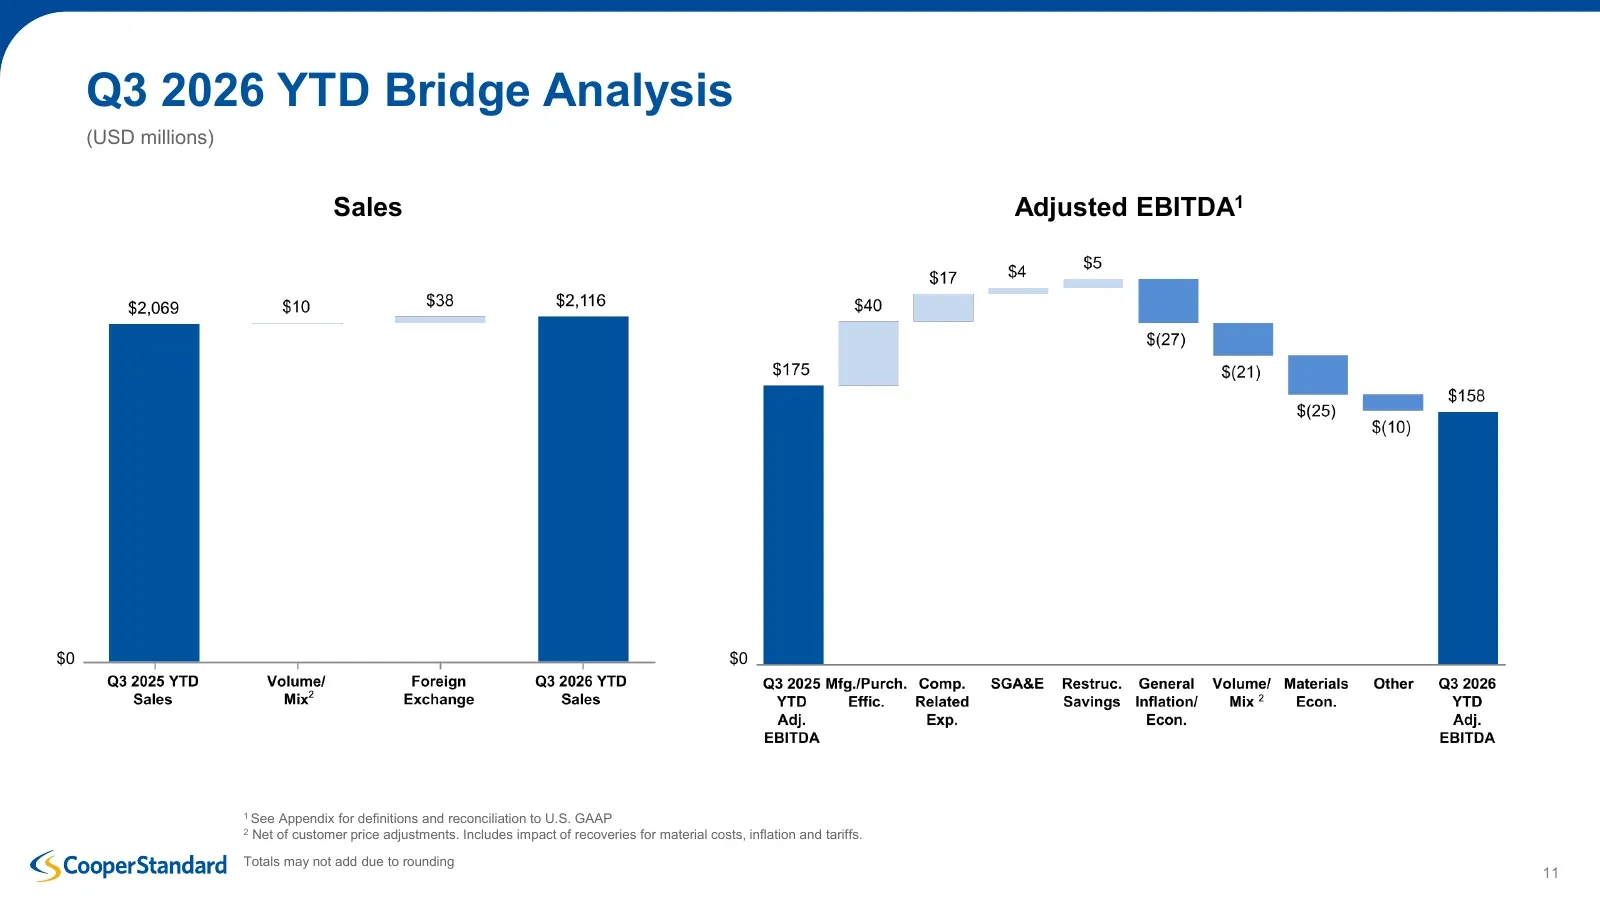
Slide 11: Q3 2026 YTD Bridge Analysis
Q3 2026 YTD Bridge Analysis (USD millions) Sales Adjusted EBITDA1 $0 $0 1 See Appendix for definitions and reconciliation to U.S. GAAP 2 Net of customer price adjustments. Includes impact of recoveries for material costs, inflation and tariffs. Totals may not add due to rounding 11
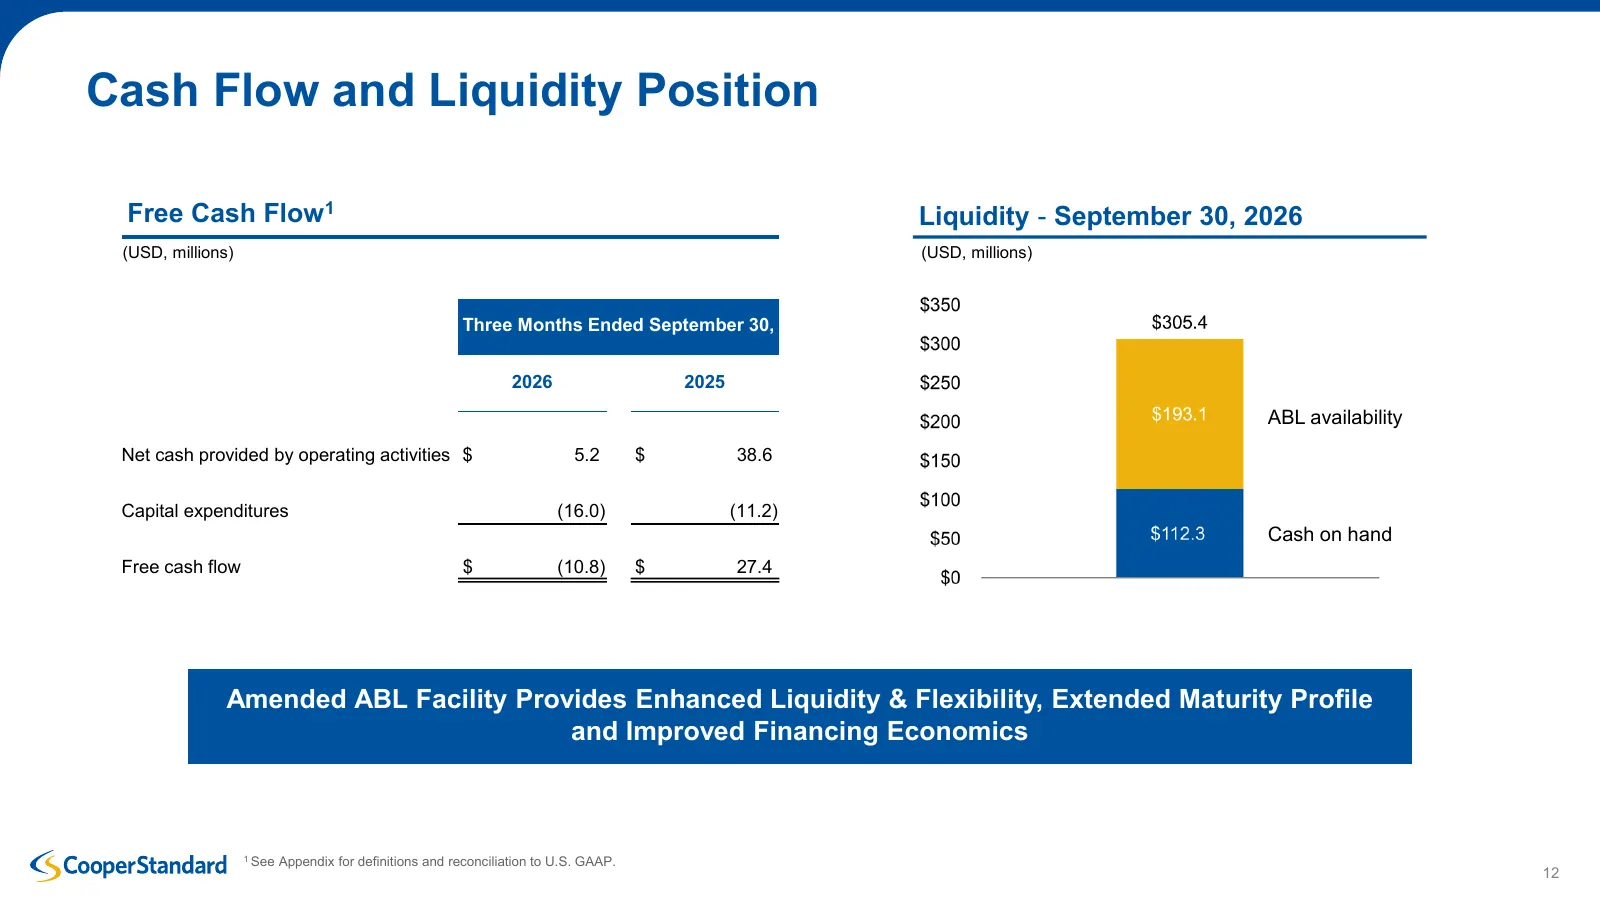
Slide 12: Cash Flow and Liquidity Position
Cash Flow and Liquidity Position Free Cash Flow1 Liquidity - September 30, 2026 (USD, millions) (USD, millions) Three Months Ended September 30, 2026 2025 ABL availability Net cash provided by operating activities $ 5.2 $ 38.6 Capital expenditures (16.0) (11.2) Cash on hand Free cash flow $ (10.8) $
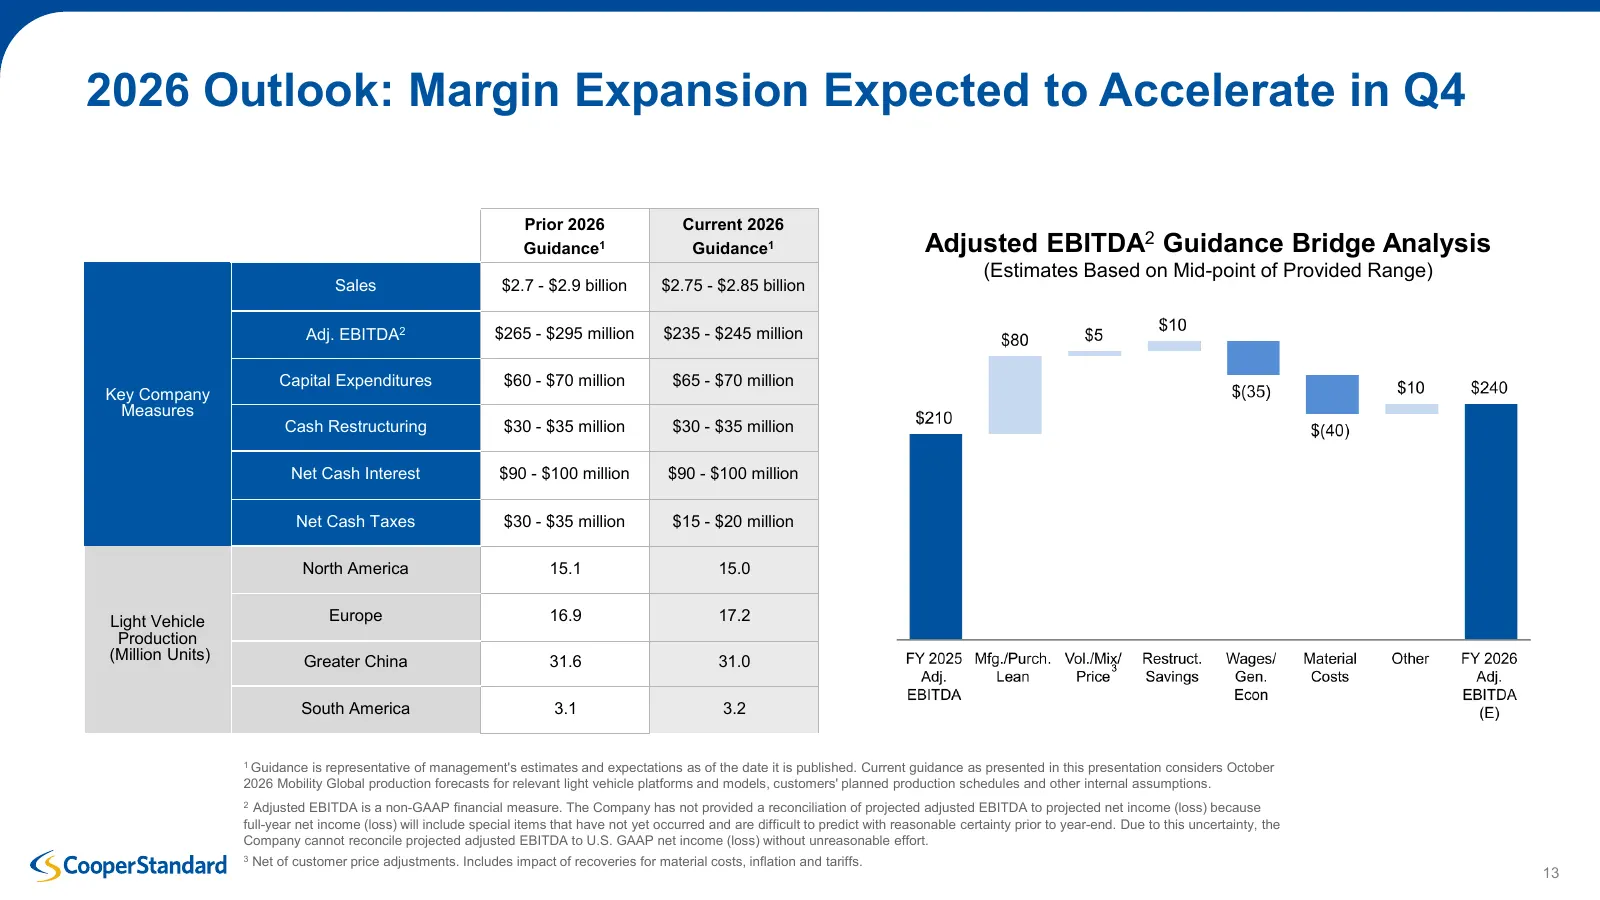
Slide 13: 2026 Outlook: Margin Expansion Expected to Accelerate in Q4
2026 Outlook: Margin Expansion Expected to Accelerate in Q4 Prior 2026 Current 2026 Guidance1 Guidance1 Adjusted EBITDA2 Guidance Bridge Analysis (Estimates Based on Mid-point of Provided Range) Sales $2.7 - $2.9 billion $2.75 - $2.85 billion Adj. EBITDA2 $265 - $295 million $235 - $245 million Capi
Slide 14: Strategic Overview and Outlook
Strategic Overview and Outlook Jeff Edwards, Chairman and CEO
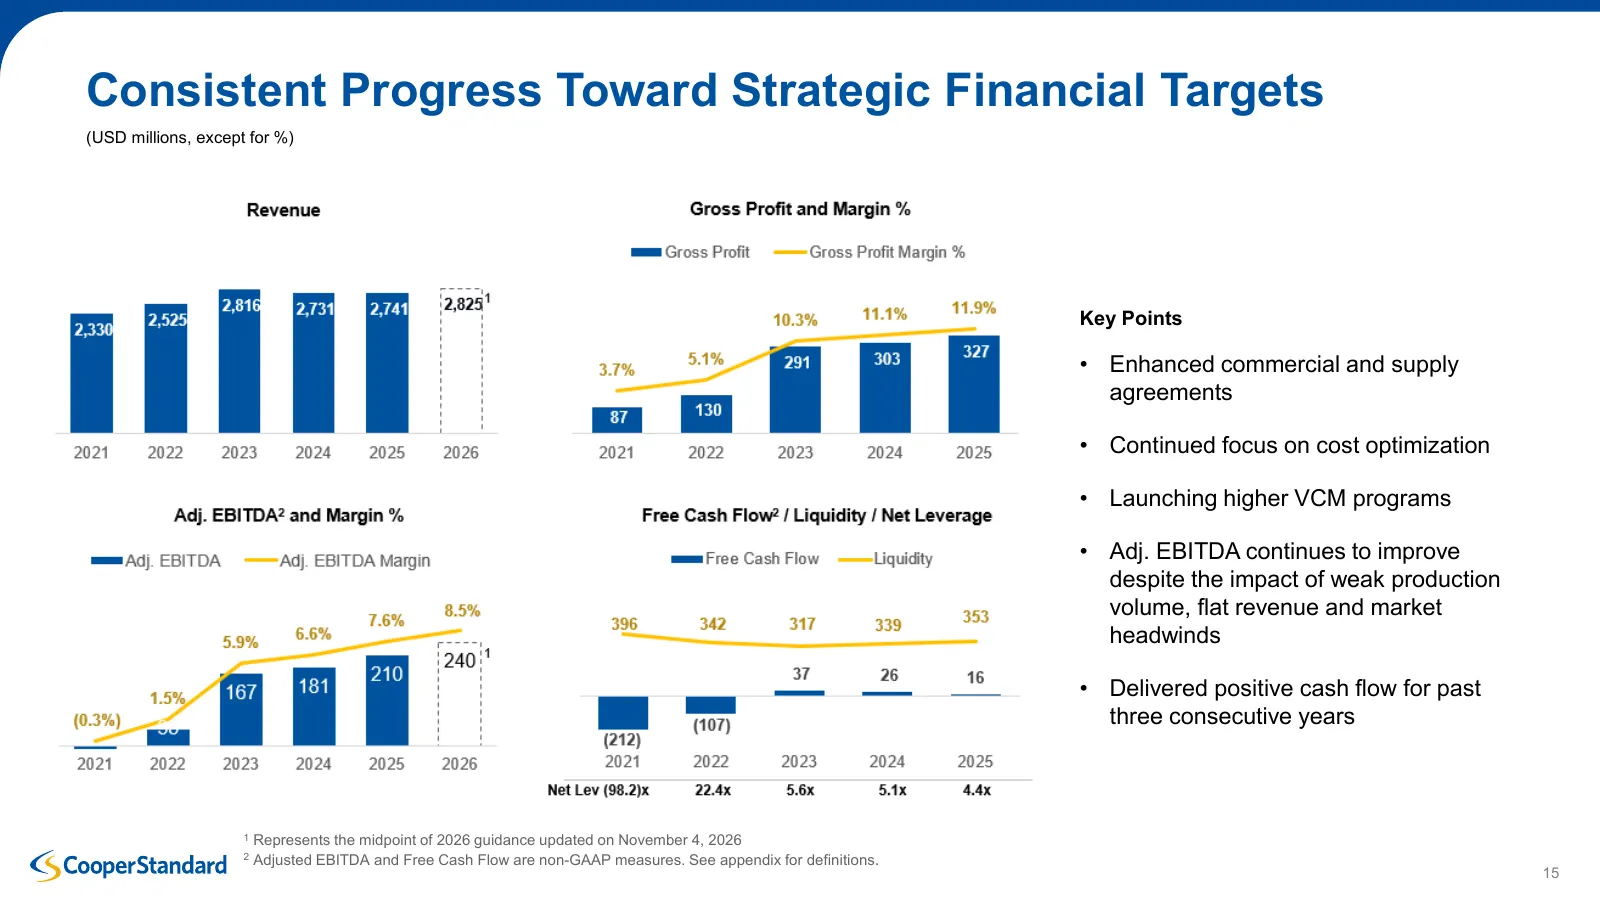
Slide 15: Consistent Progress Toward Strategic Financial Targets
Consistent Progress Toward Strategic Financial Targets (USD millions, except for %) Key Points • Enhanced commercial and supply agreements • Continued focus on cost optimization • Launching higher VCM programs • Adj. EBITDA continues to improve despite the impact of weak production volume, flat reve
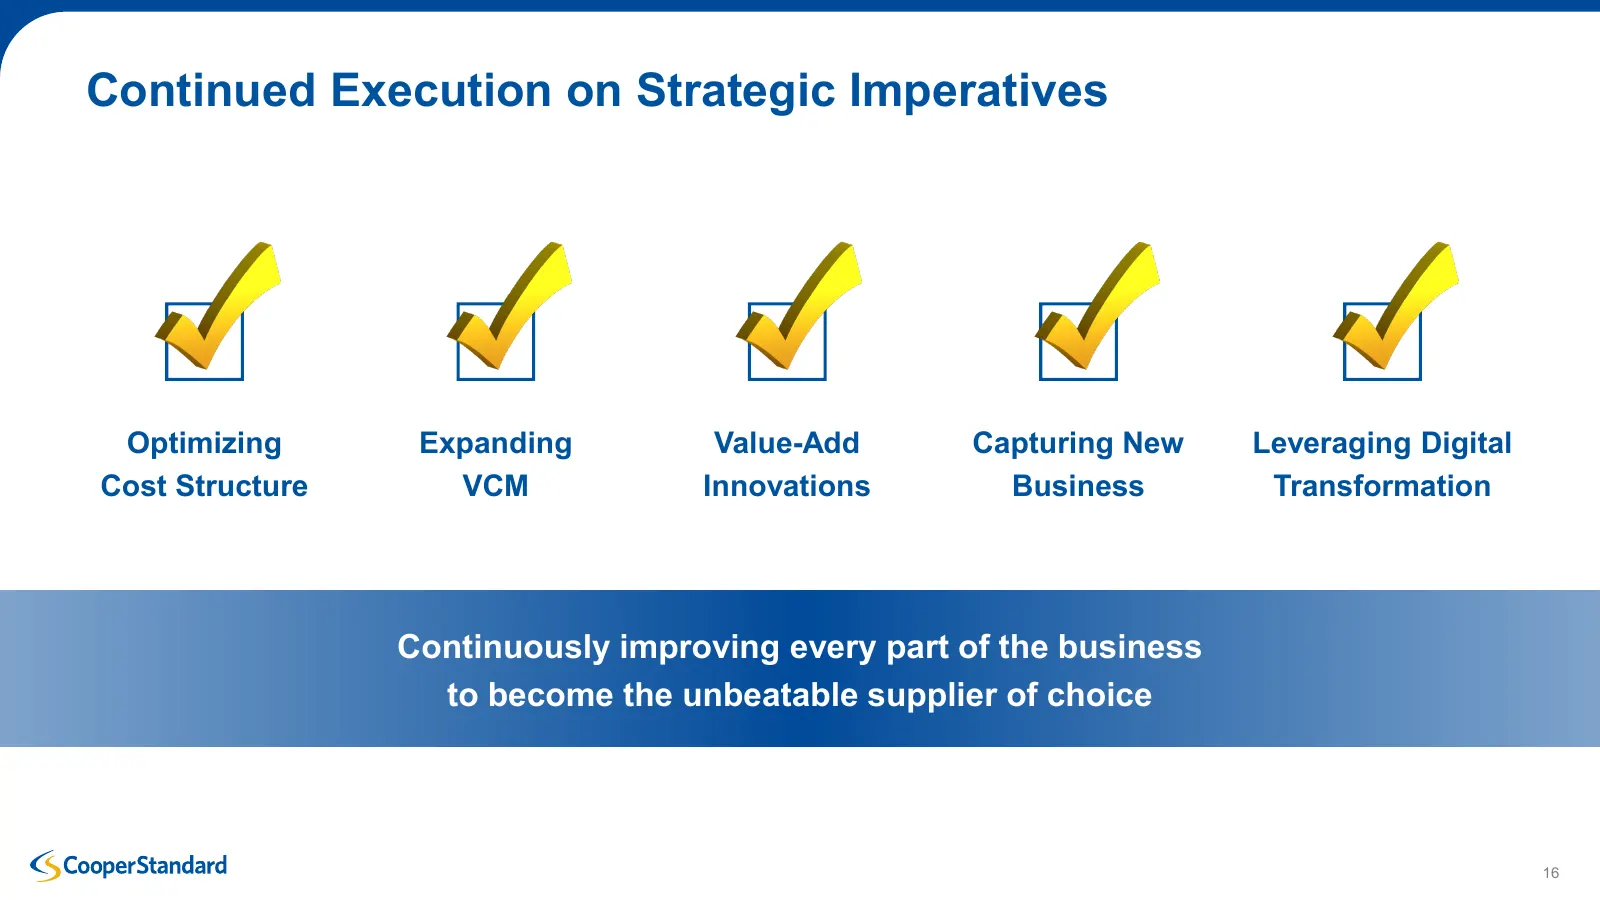
Slide 16: Continued Execution on Strategic Imperatives
Continued Execution on Strategic Imperatives Optimizing Expanding Value-Add Capturing New Leveraging Digital Cost Structure VCM Innovations Business Transformation Continuously improving every part of the business to become the unbeatable supplier of choice 16
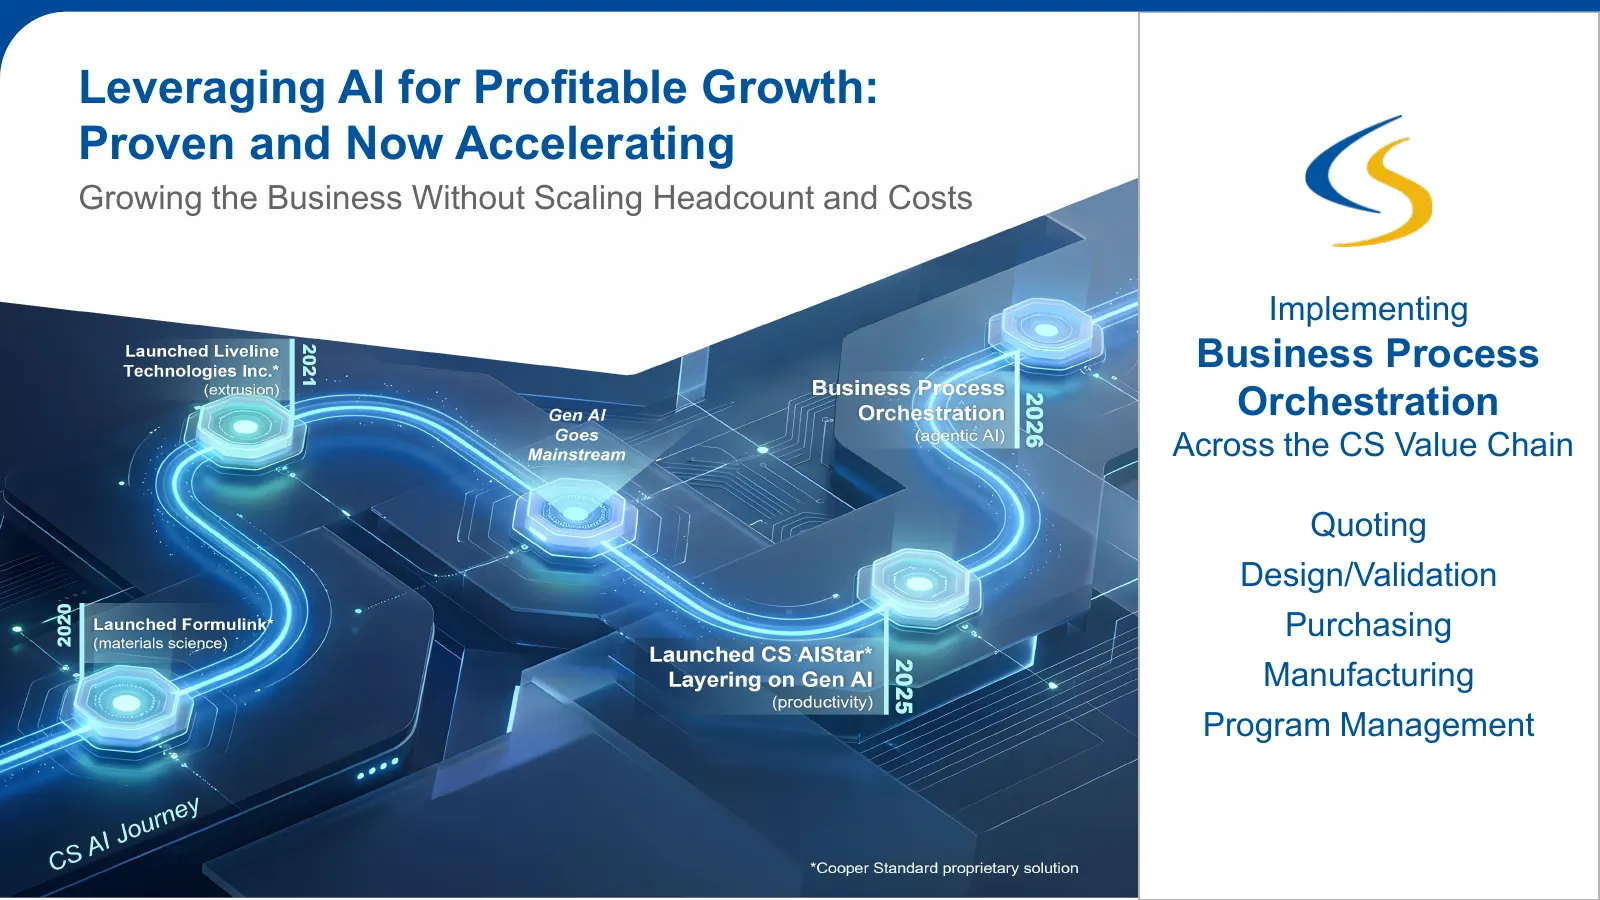
Slide 17: Leveraging AI for Profitable Growth: Proven and Now Accelerating
Leveraging AI for Profitable Growth: Proven and Now Accelerating Growing the Business Without Scaling Headcount and Costs Implementing Business Process Orchestration Across the CS Value Chain Quoting Design/Validation Purchasing Manufacturing Program Management 17
Slide 18: Aggressive Response to Current Commodity/Inflation Crisis
Aggressive Response to Current Commodity/Inflation Crisis Turning Crisis into Opportunity • First time our index-based contracts have been tested • Refining commercial agreements to further de-risk the business • Negotiating for recovery of costs not covered by index-based agreements • Reviewing tra
Slide 19: Strategic Financial Targets: 3-5 Year Outlook Remains on Track
Strategic Financial Targets: 3-5 Year Outlook Remains on Track Sales increasing to $3.8 Billion – Booked business 3 years in advance provides good line of sight – Solid China strategy to grow sales in Asia and globally – Expect to double the fluids business (organic and potentially inorganic growth)

Slide 20: Cooper Standard
G CooperStandard

Slide 21: Appendix
G CooperStandard
Slide 22: Non-GAAP Financial Measures
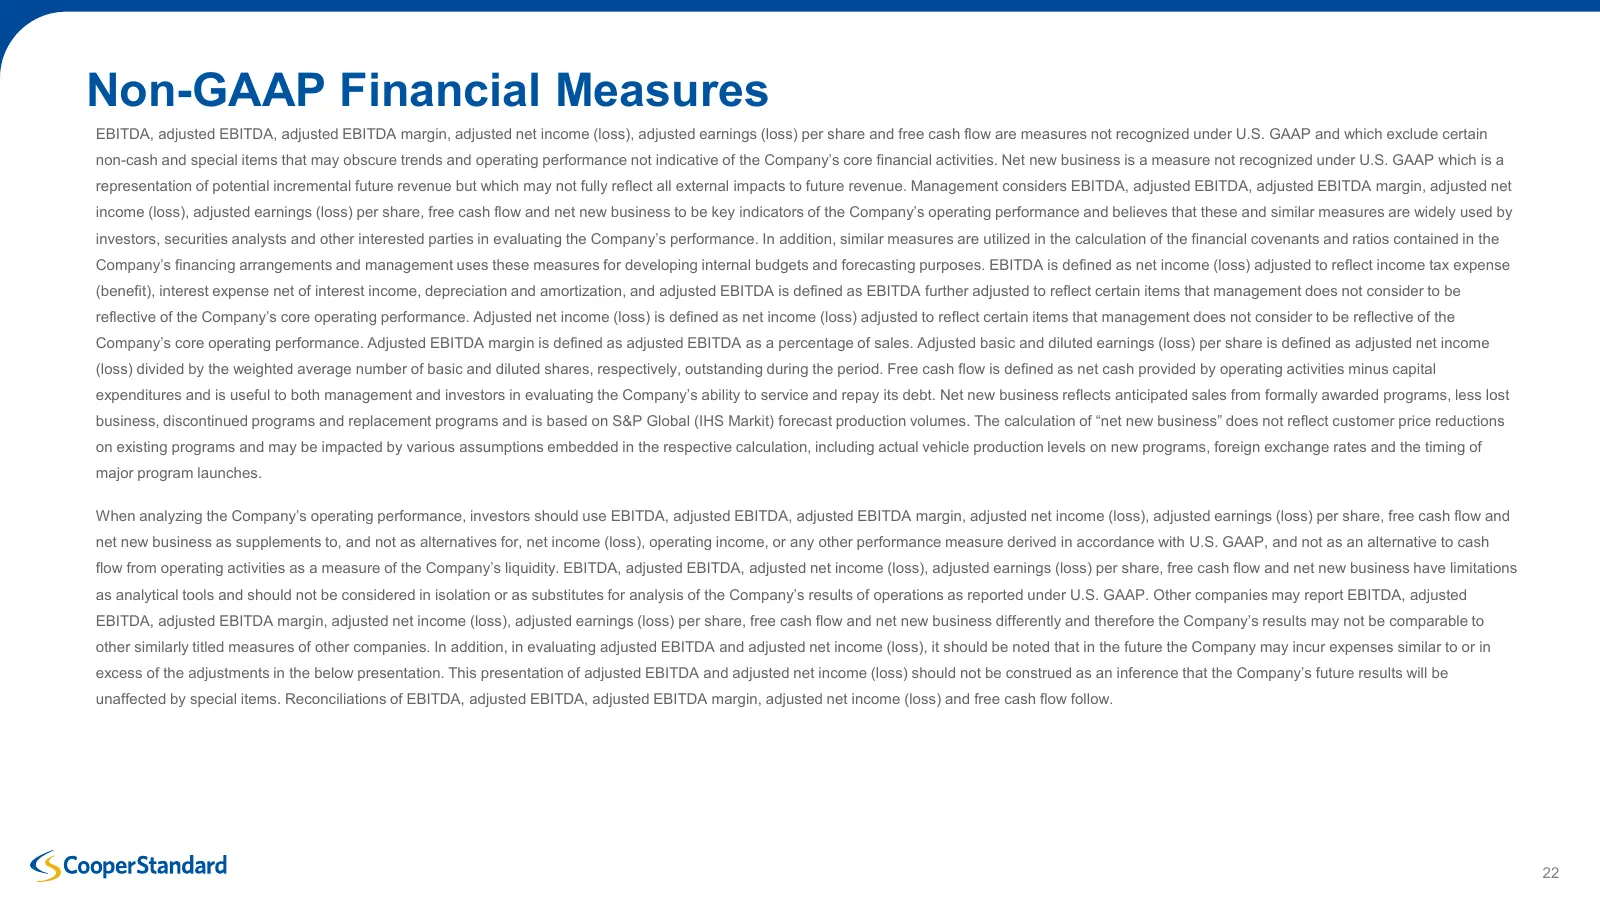
Non-GAAP Financial Measures EBITDA, adjusted EBITDA, adjusted EBITDA margin, adjusted net income (loss), adjusted earnings (loss) per share and free cash flow are measures not recognized under U.S. GAAP and which exclude certain non-cash and special items that may obscure trends and operating perfor
Slide 23: EBITDA and Adjusted EBITDA Reconciliation
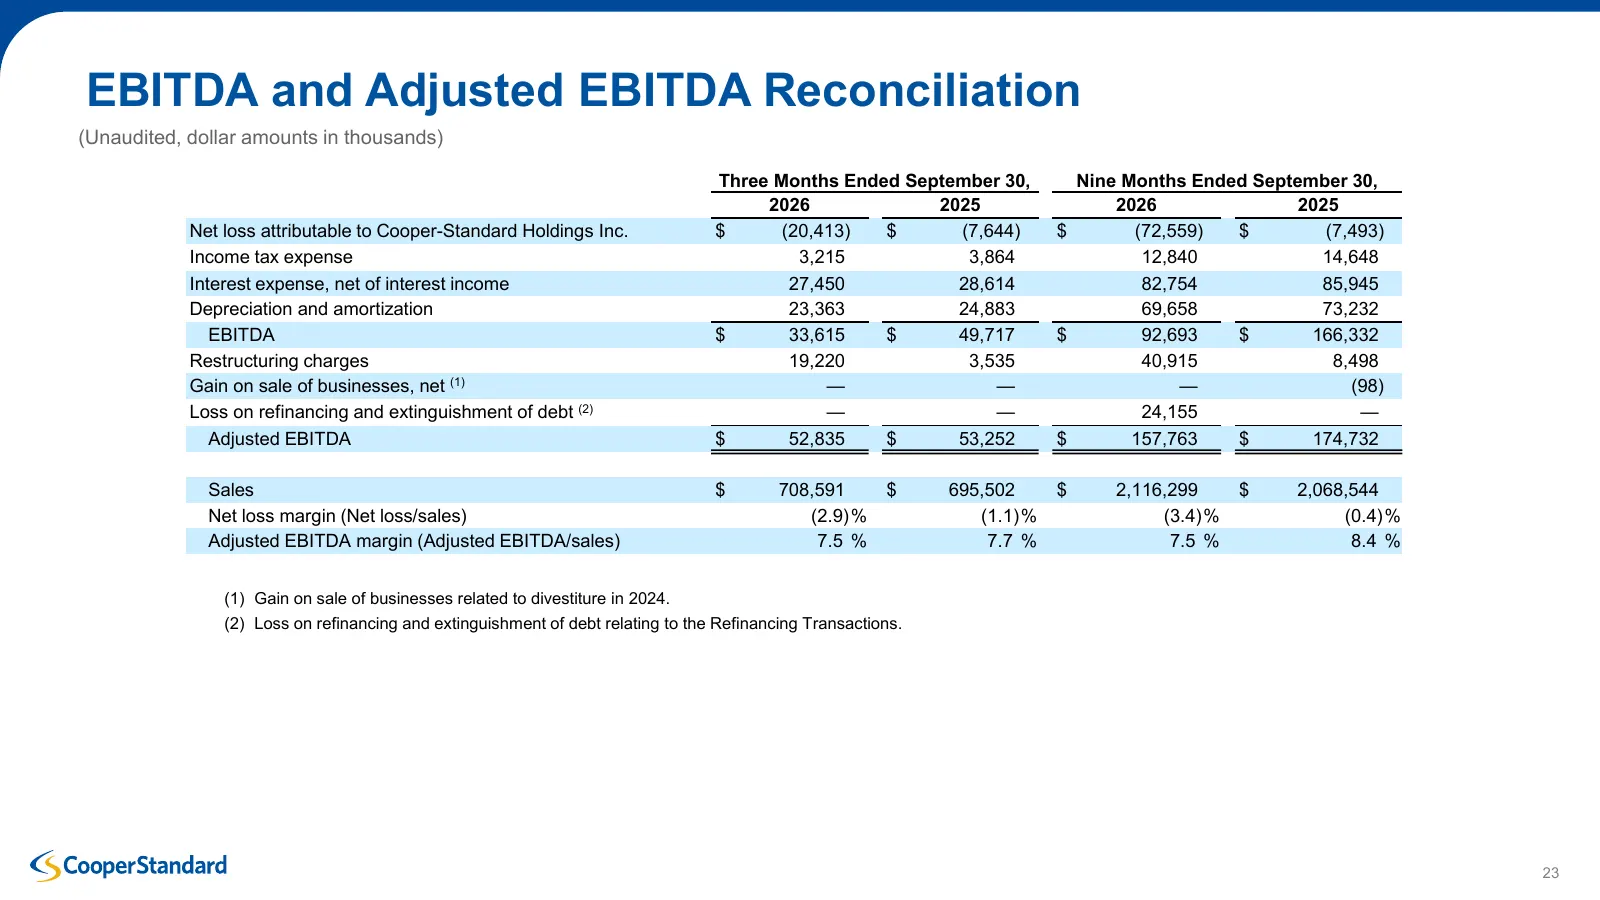
EBITDA and Adjusted EBITDA Reconciliation (Unaudited, dollar amounts in thousands) Three Months Ended September 30, Nine Months Ended September 30, 2026 2025 2026 2025 Net loss attributable to Cooper-Standard Holdings Inc. $ (20,413) $ (7,644) $ (72,559) $ (7,493) Income tax expense 3,215 3,864 12,8
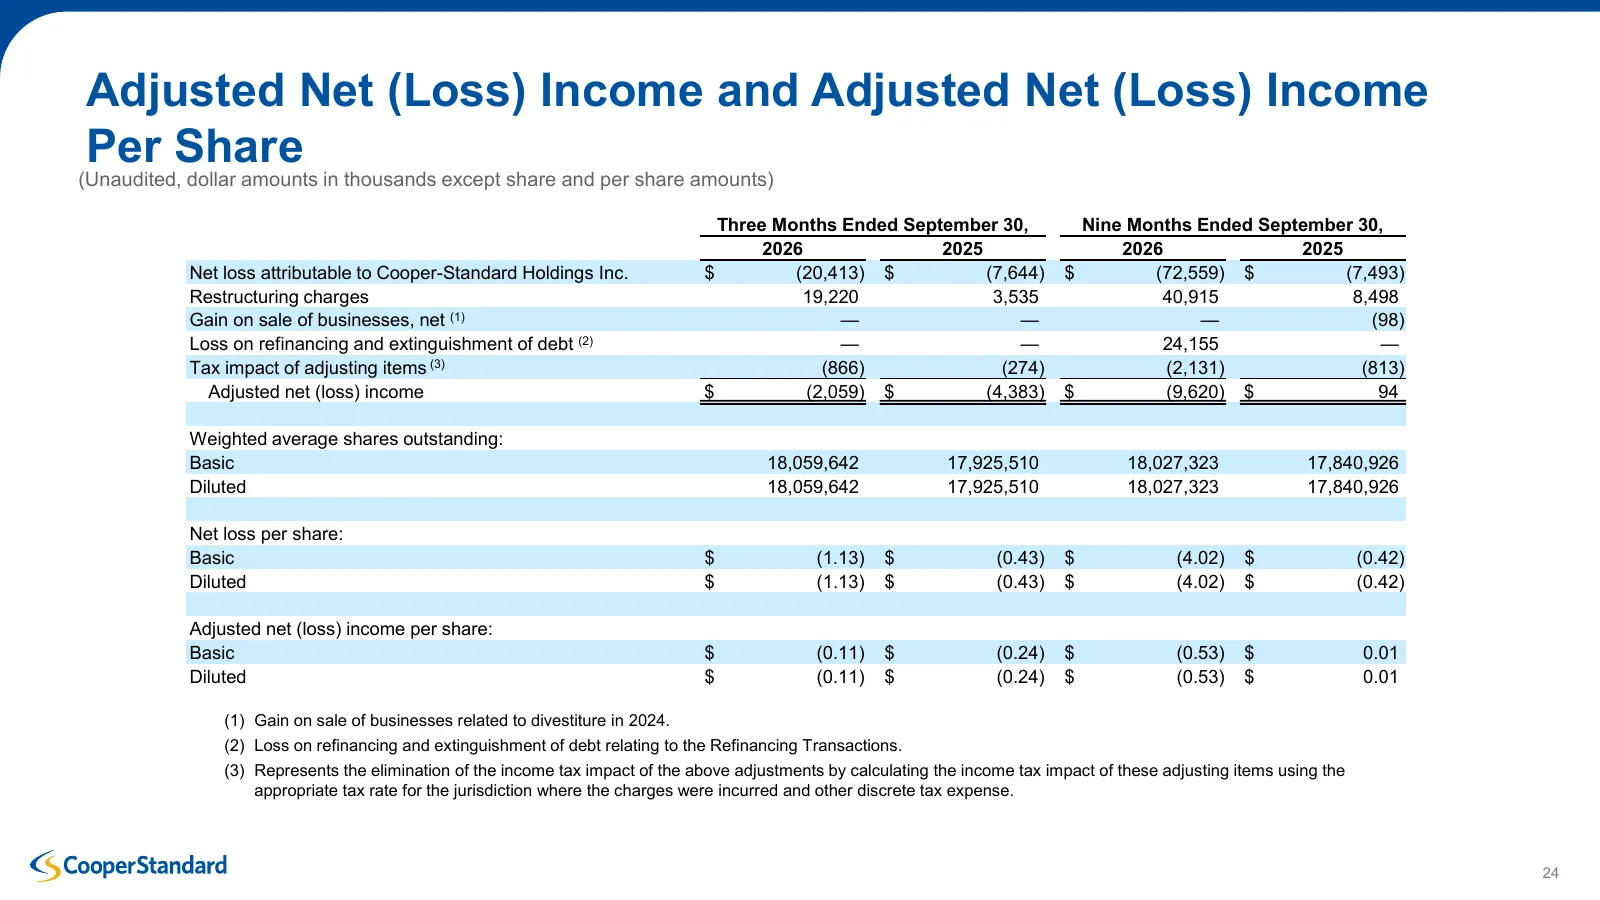
Slide 24: Adjusted Net (Loss) Income and Adjusted Net (Loss) Income Per Share
Adjusted Net (Loss) Income and Adjusted Net (Loss) Income Per Share (Unaudited, dollar amounts in thousands except share and per share amounts) Three Months Ended September 30, Nine Months Ended September 30, 2026 2025 2026 2025 Net loss attributable to Cooper-Standard Holdings Inc. $ (20,413) $ (7,
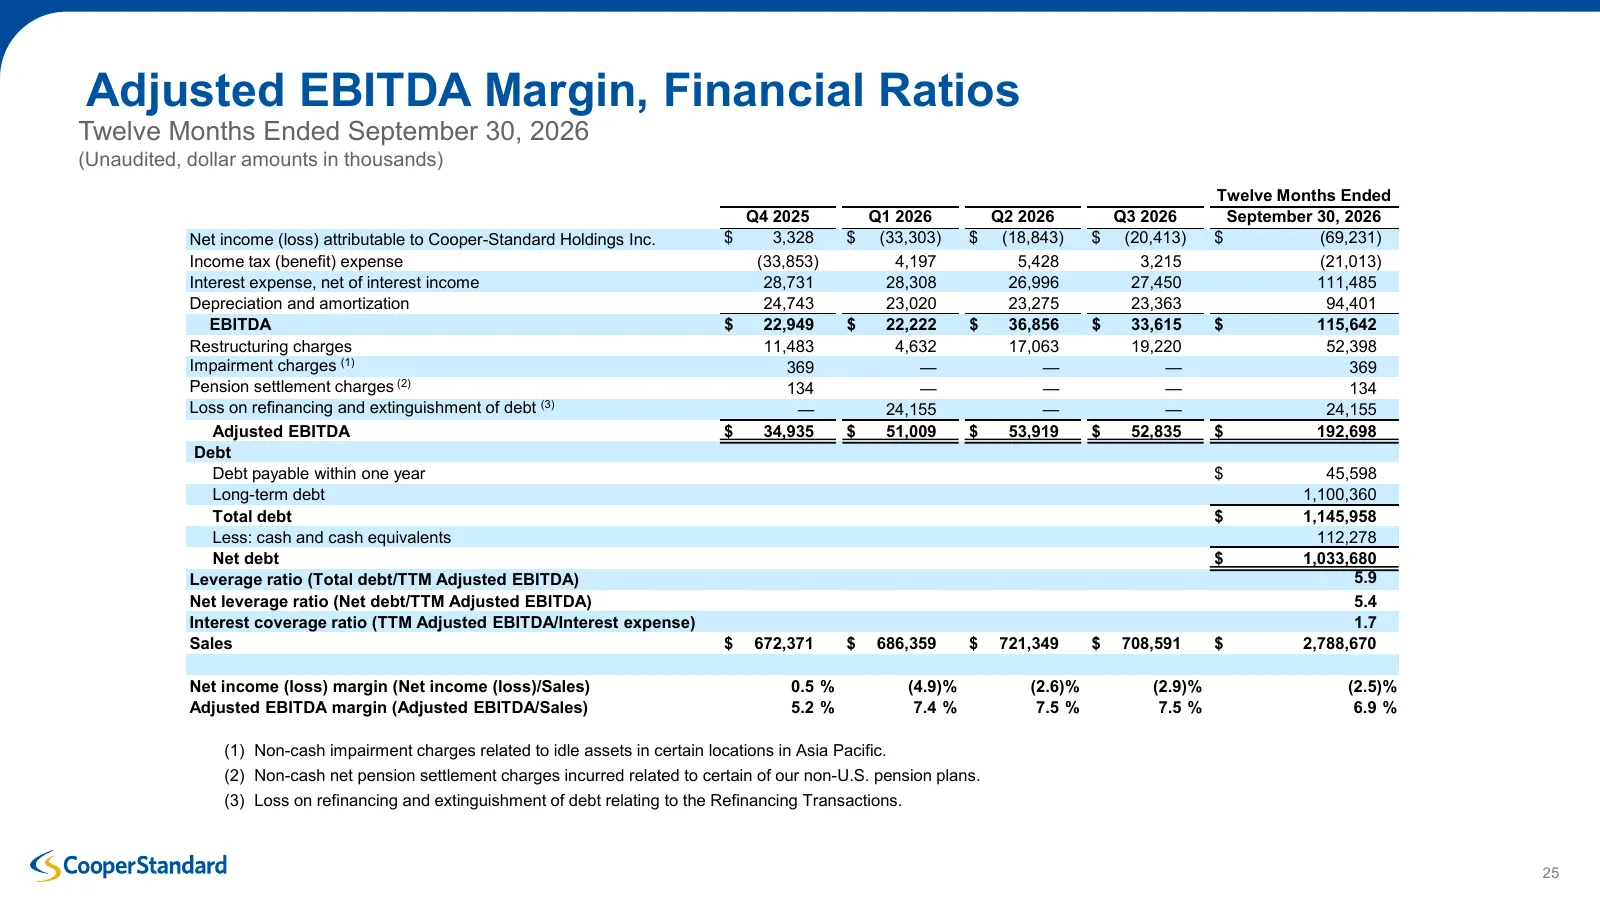
Slide 25: Adjusted EBITDA Margin, Financial Ratios
Adjusted EBITDA Margin, Financial Ratios Twelve Months Ended September 30, 2026 (Unaudited, dollar amounts in thousands) Twelve Months Ended Q4 2025 Q1 2026 Q2 2026 Q3 2026 September 30, 2026 Net income (loss) attributable to Cooper-Standard Holdings Inc. $ 3,328 $ (33,303) $ (18,843) $ (20,413) $ (
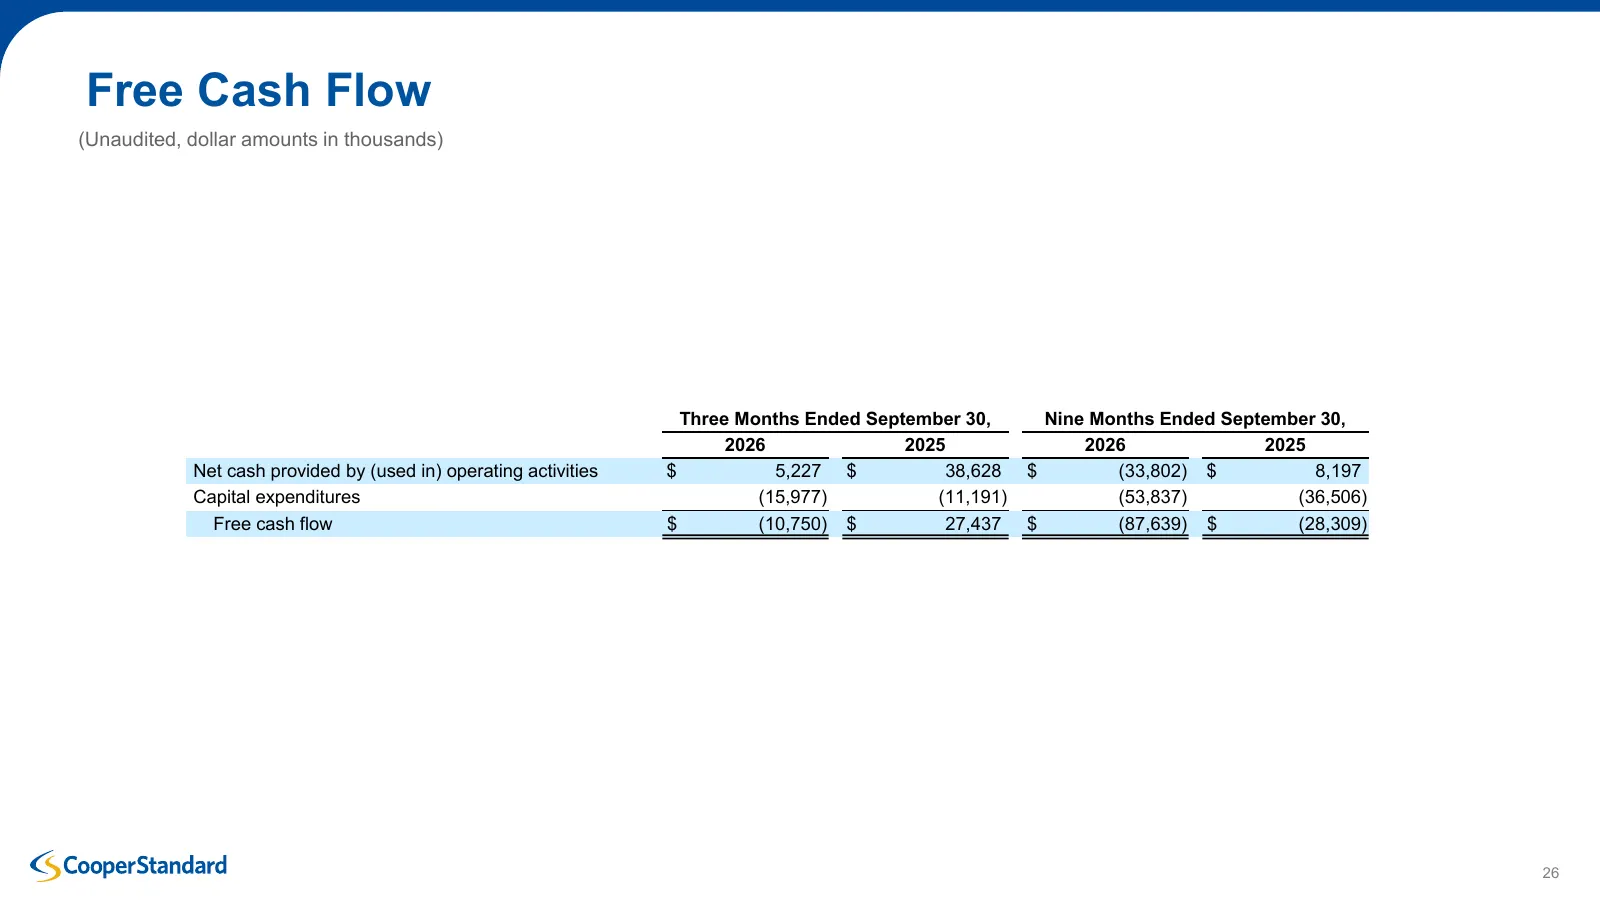
Slide 26: Free Cash Flow
Free Cash Flow (Unaudited, dollar amounts in thousands) Three Months Ended September 30, Nine Months Ended September 30, 2026 2025 2026 2025 Net cash provided by (used in) operating activities $ 5,227 $ 38,628 $ (33,802) $ 8,197 Capital expenditures (15,977) (11,191) (53,837) (36,506) Free cash flow
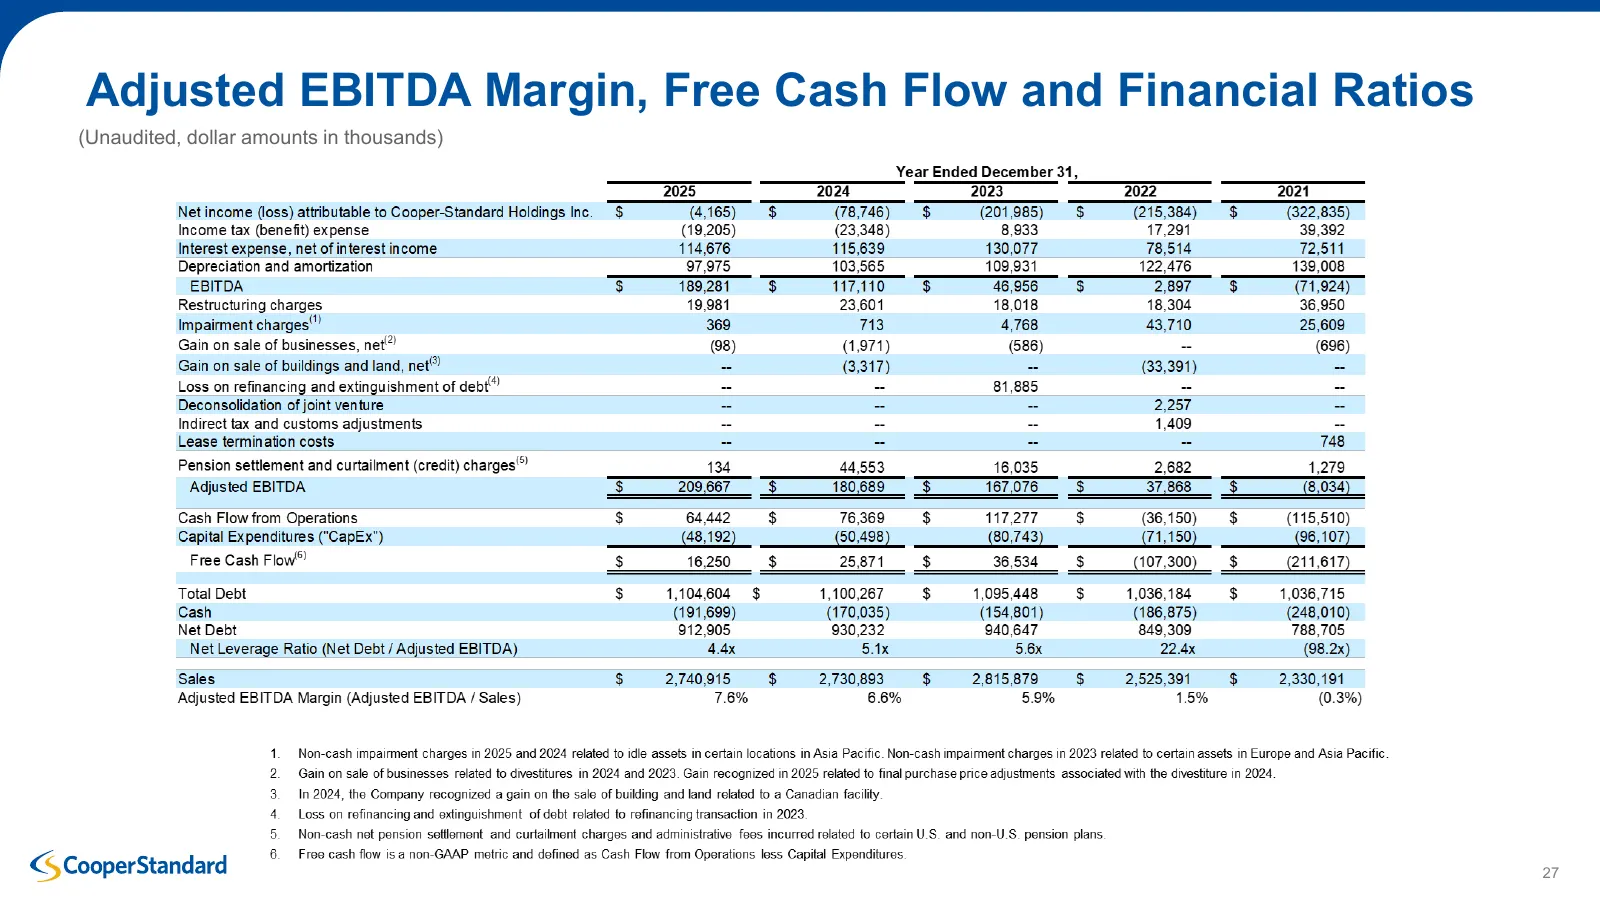
Slide 27: Adjusted EBITDA Margin, Free Cash Flow and Financial Ratios
Adjusted EBITDA Margin, Free Cash Flow and Financial Ratios (Unaudited, dollar amounts in thousands) 27
Source: 6ix earnings call
More decks from Cooper-Standard Holdings Inc.
 Investor Presentation (September 2026)18 slides · September 2026
 JP Morgan 2026 Auto Conference18 slides · Aug 12, 2026
 Q2 2026 Earnings Presentation27 slides · Aug 6, 2026
 Investor Presentation (June 2026)25 slides · June 2026
 Q1 2026 Earnings Presentation24 slides · May 7, 2026
 Investor Presentation (March 2026)24 slides · March 2026