Railamerica — Q3 2006 Earnings Presentation
12 slides from Railamerica's earnings presentation, Oct 31, 2006
Slide 1: RailAmerica, Inc. Third Quarter 2006 Financial Results
RailAmerica, Inc. Third Quarter 2006 Financial Results October 31, 2006
Slide 2: Forward-Looking Statements and Forecasts
Forward-Looking Statements and Forecasts This presentation contains forward-looking statements, forecasts, and information regarding future events and the future performance of RailAmerica, Inc. ("RailAmerica" or the "Company") that involve risks and uncertainties that could cause actual results and
Slide 3: Charles Swinburn, Chief Executive Officer
Charles Swinburn Chief Executive Officer
Slide 4: Third Quarter Results
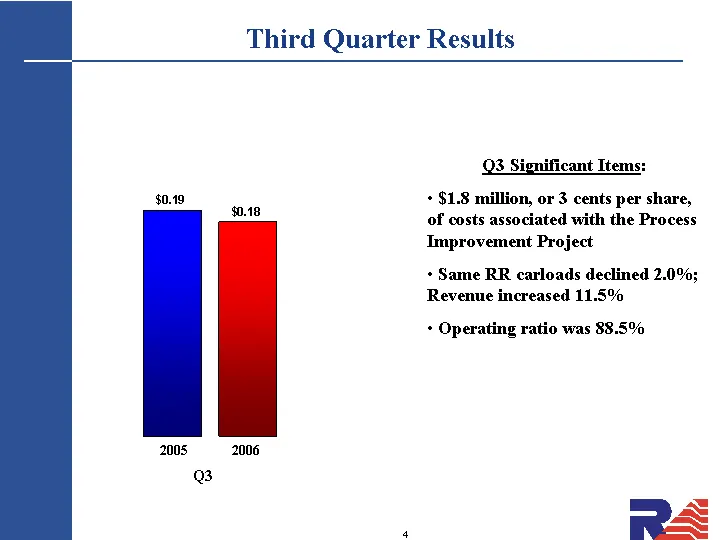
Third Quarter Results Q3 YTD 2005 0.19 Q3 2006 2005 Q3 Significant Items: $1.8 million, or 3 cents per share, of costs associated with the Process Improvement Project Same RR carloads declined 2.0%; Revenue increased 11.5% Operating ratio was 88.5%
Slide 5: Safety Statistics
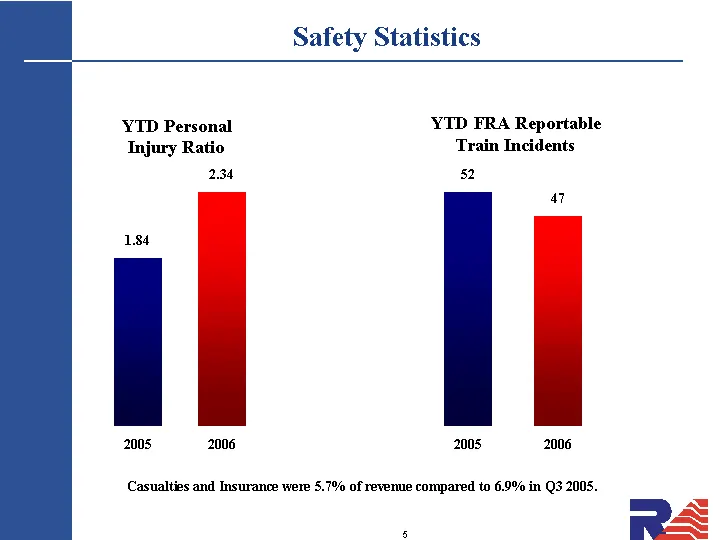
Safety Statistics YTD FRA Reportable Train Incidents 2006 52 47 YTD Personal Injury Ratio 2005 2006 1.84 2.34 2005 Casualties and Insurance were 5.7% of revenue compared to 6.9% in Q3 2005.
Slide 6: Michael Howe, Executive Vice President and Chief Financial Officer
Michael Howe Executive Vice President and Chief Financial Officer
Slide 7: Income Statement
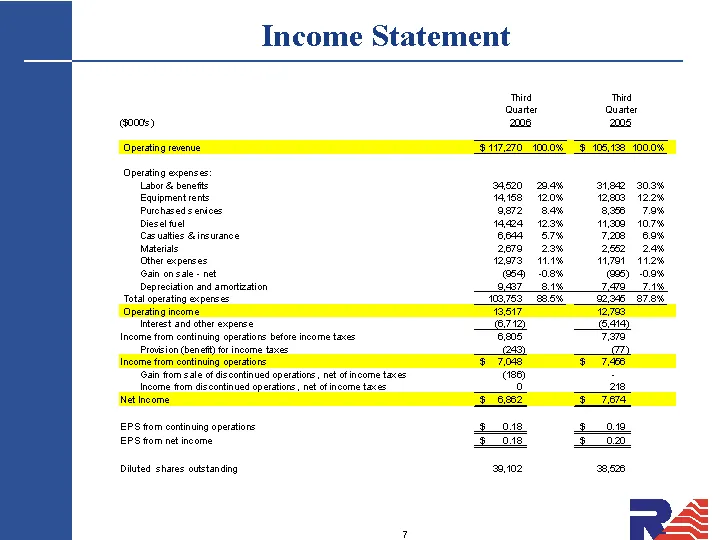
Income Statement ira Third Ouarter Quarter goon) mua 08 Opertingreewe = SFO OOK TS OH TSS OOO Operating expenses: Labor & bene masz may 6 see 209% Equipment rents vate 20% = Zee 122% Purchased enioee Og72 84% 887.0% Diesel uel 1424 23% Ha 10.7% Casuaties &ineurance ea 57% «= TAB 80% Materials 2e7a 2
Slide 8: Expenses as a Percentage of Revenue, Third Quarter 2006 vs. 2005
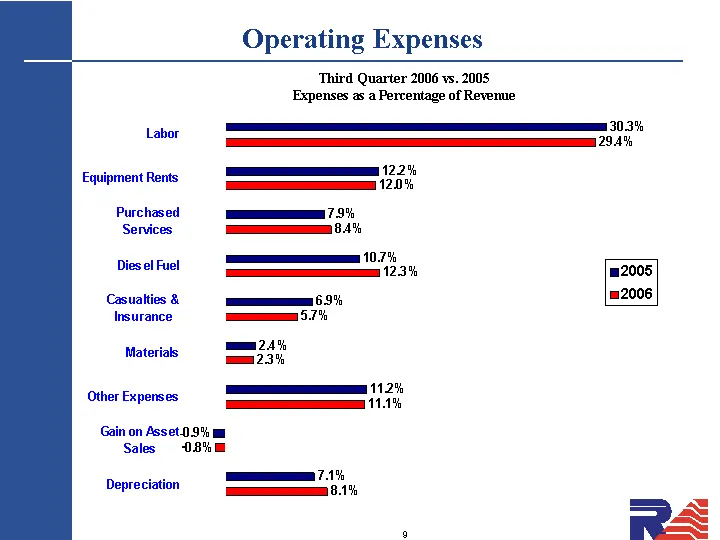
Operating Expenses Depreciation Gain on Asset Sales Other Expenses Materials Casualties & Insurance Diesel Fuel Purchased Services Equipment Rents Labor 2006 0.081 -0.008 0.111 0.023 0.057 0.123 0.084 0.12 0.294 2005 0.071 -0.009 0.112 0.024 0.069 0.107 0.079 0.122 0.303 Third Quarter 2006 vs. 2005
Slide 9: Fuel: Delivered Price per Gallon
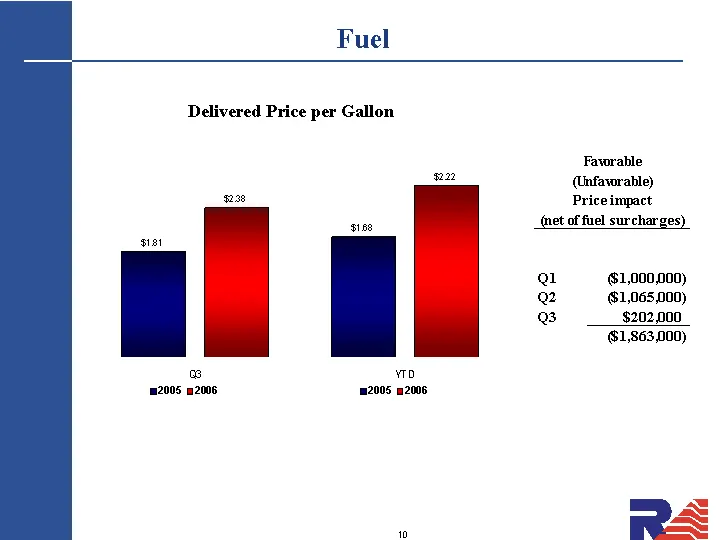
Fuel Q3 2005 1.81 2006 2.38 YTD 2005 1.68 2006 2.22 Delivered Price per Gallon
Slide 10: Balance Sheet Highlights
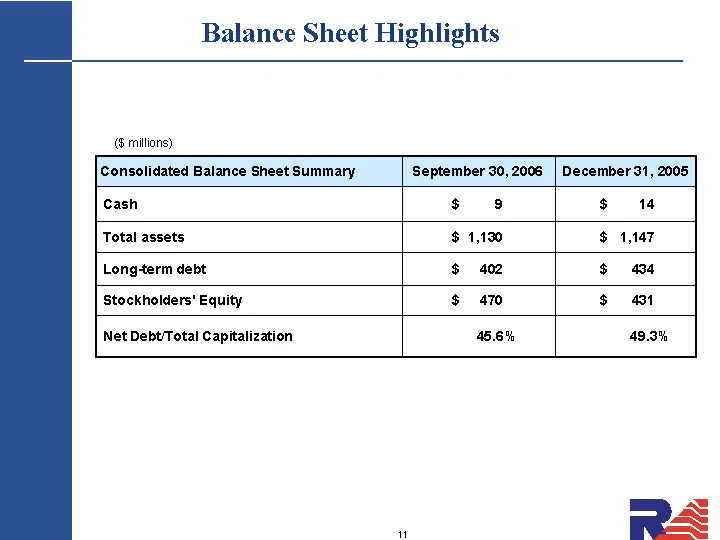
Balance Sheet Highlights ($ millions) Consolidated Balance Sheet Summary September 30, 2006 December 31, 2005 Cash $ 9 $ 14 Total assets $ 1,130 $ 1,147 Long-term debt $ 402 $ 434 Stockholders' Equity $ 470 $ 431 Net Debt/Total Capitalization 45.6% 49.3%
Slide 11: Charles Swinburn, Chief Executive Officer
Charles Swinburn Chief Executive Officer
Slide 12: Closing Comments
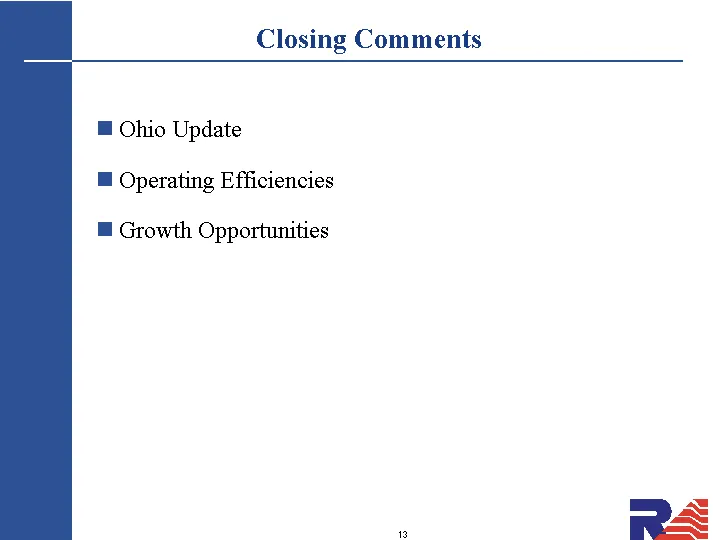
Closing Comments Ohio Update Operating Efficiencies Growth Opportunities
Source: SEC EDGAR · 8-K filed Oct 31, 2006
More decks from Railamerica Inc
 Q2 2012 Earnings Presentation25 slides · Jul 25, 2012
 Q1 2012 Earnings Presentation29 slides · Apr 26, 2012
 Q4 2011 Earnings Presentation33 slides · Feb 9, 2012
 Q3 2011 Earnings Presentation28 slides · Oct 26, 2011
 Q2 2011 Earnings Presentation27 slides · Jul 28, 2011
 Q1 2011 Earnings Presentation28 slides · Apr 28, 2011