Cooper-Standard Holdings Inc. · NYSE:CPS
Cooper-Standard — Q2 2008 Earnings Presentation
27 slides from Cooper-Standard's earnings presentation, Aug 14, 2008
Slide 1: 2Q 2008 Earnings Conference Call
2Q 2008 Earnings Conference Call August g 14,, 2008
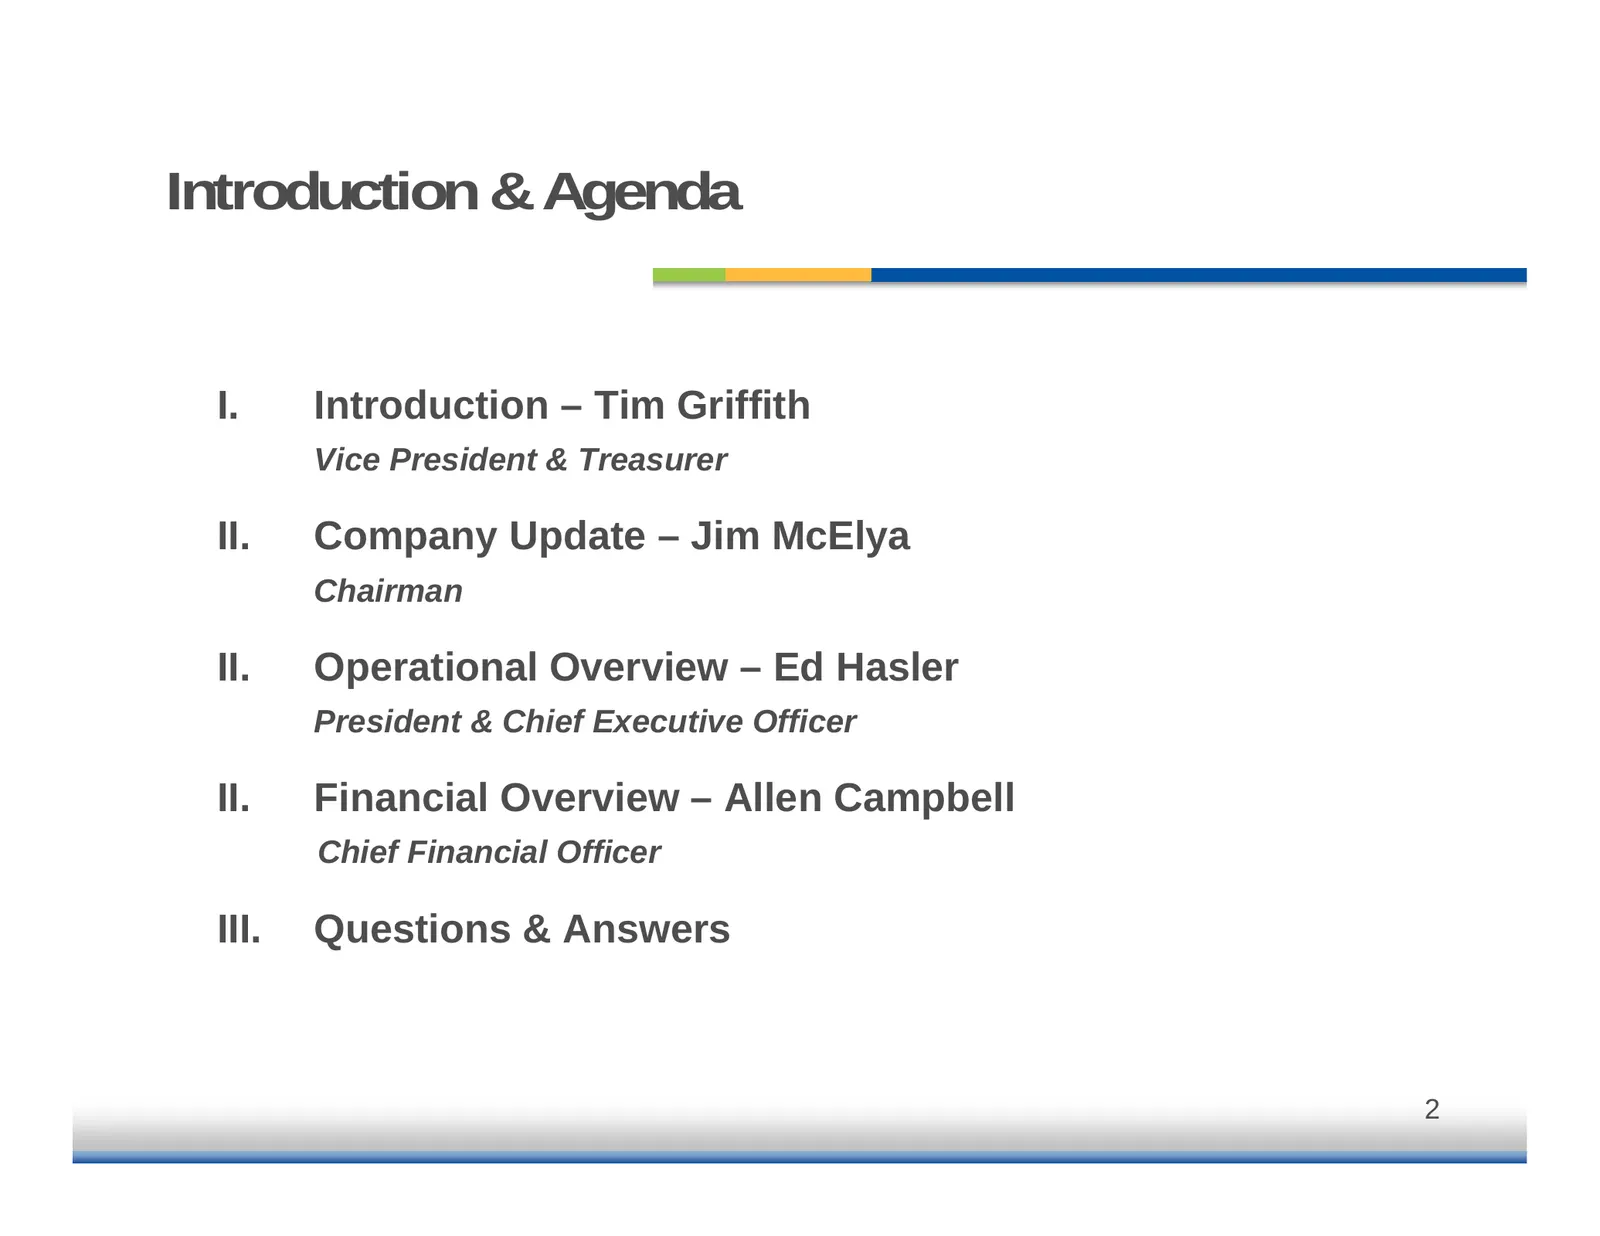
Slide 2: Introduction & Agenda
Introduction & Agenda I. Introduction – Tim Griffith Vice President & Treasurer II II. Company Update – Jim McElya Chairman II. Operational Overview – Ed Hasler President & Chief Executive Officer II. Financial Overview – Allen Campbell Chief Financial Officer III. Questions & Answers 2
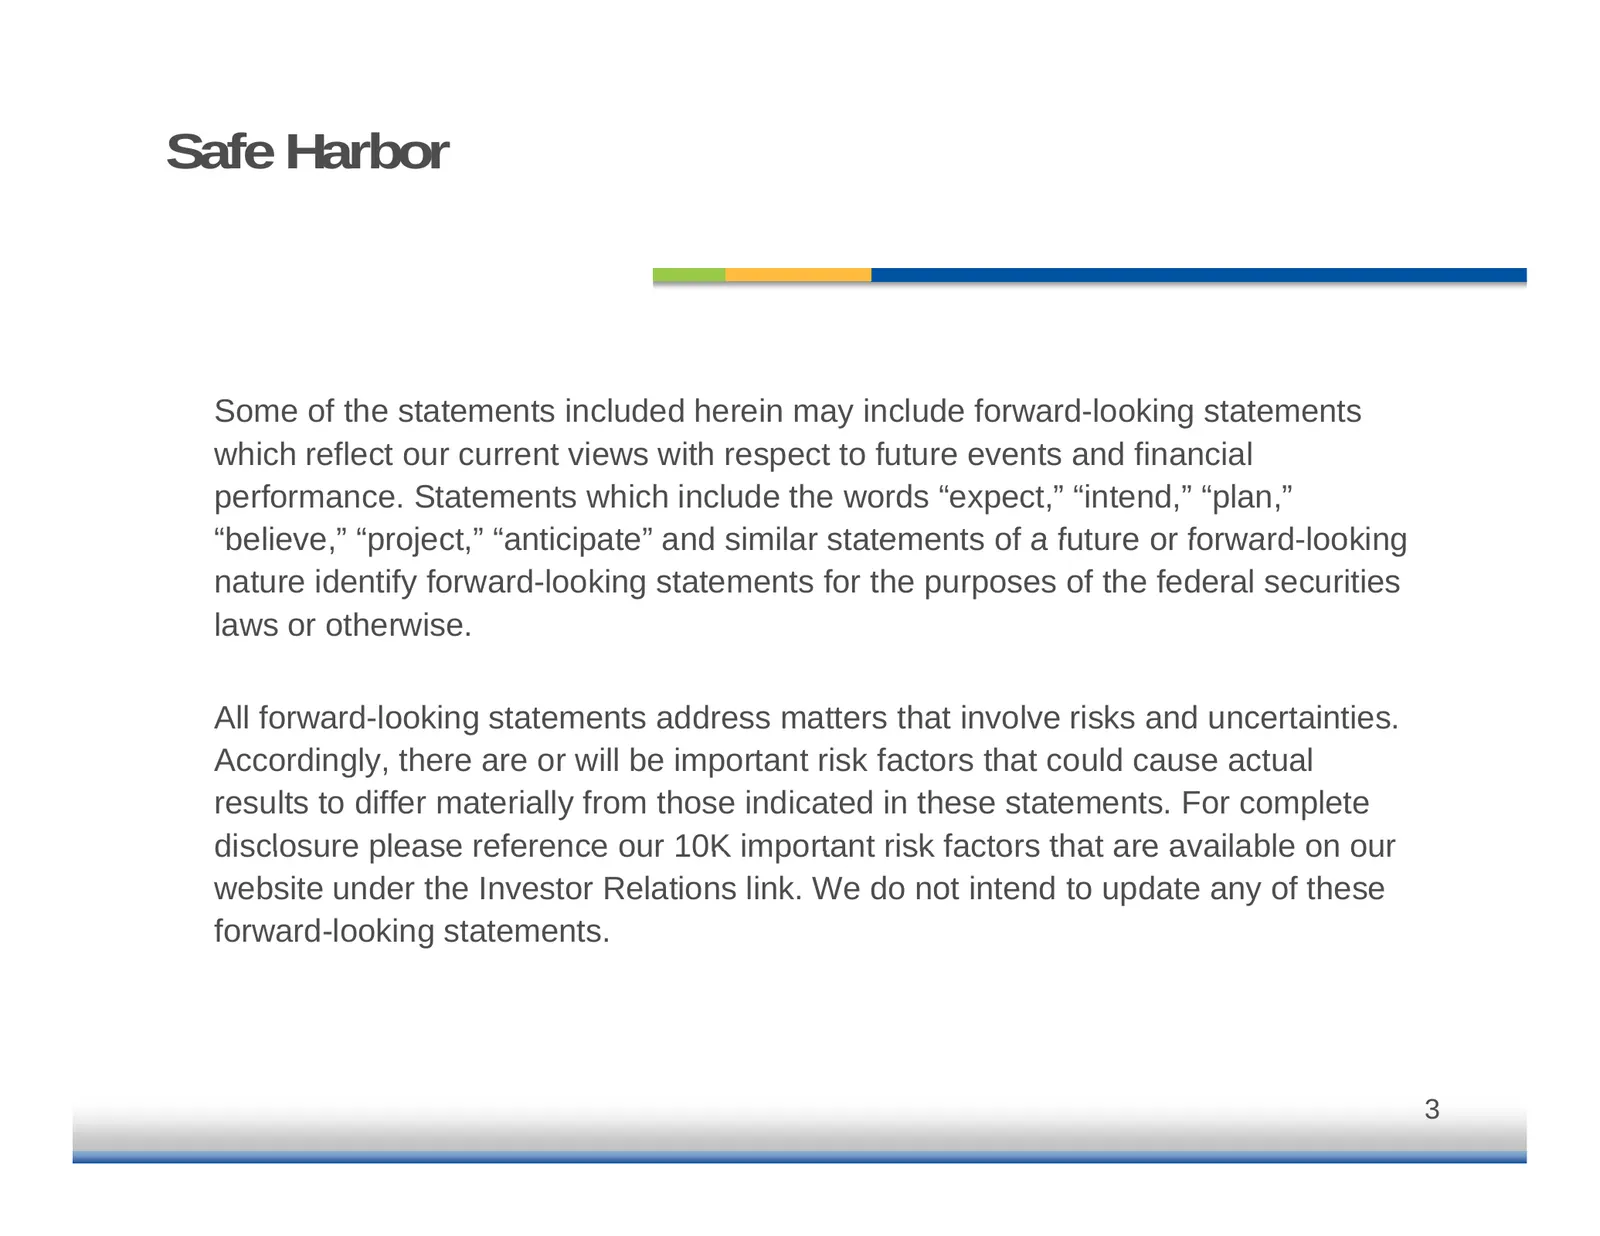
Slide 3: Safe Harbor
Safe Harbor Some of the statements included herein may include forward-looking statements which reflect our current views with respect to future events and financial performance. Statements which include the words “expect,” “intend,” “plan,” believe,” “project “believe project,” “anticipate” anticip
Slide 4: Industry Overview
Industry Overview James McElya Chairman
Slide 5: 2Q 2008 Highlights
2Q 2008 Highlights Challenging economic environment Raw material cost escalation North American auto industry changing structurally 5
Slide 6: 2Q 2008 Highlights (continued)
2Q 2008 Highlights (continued) Global auto industry continues to expand Sales increase $142 million to $766 million Adjusted EBITDA of $77.3 million 6
Slide 7: Company & Operational Overview
Company & Operational Overview Ed Hasler President & Chief Executive Officer
Slide 8: Strategic Focus
Strategic g Focus Leadership in products and technology with breadth and depth of product lines, systems solutions Meet customer needs through g expanded p g geographic g p footprint and global engineering resources Dedication to Operational Excellence with focus on lean initiatives, low cost countr
Slide 9: Automotive Industry Dynamics
Automotive Industry Dynamics p North American sales and production Raw material price increases Changing product mix American Axle strike impact Continue to analyze our structure for footprint optimization 9
Slide 10: Global Production Trends
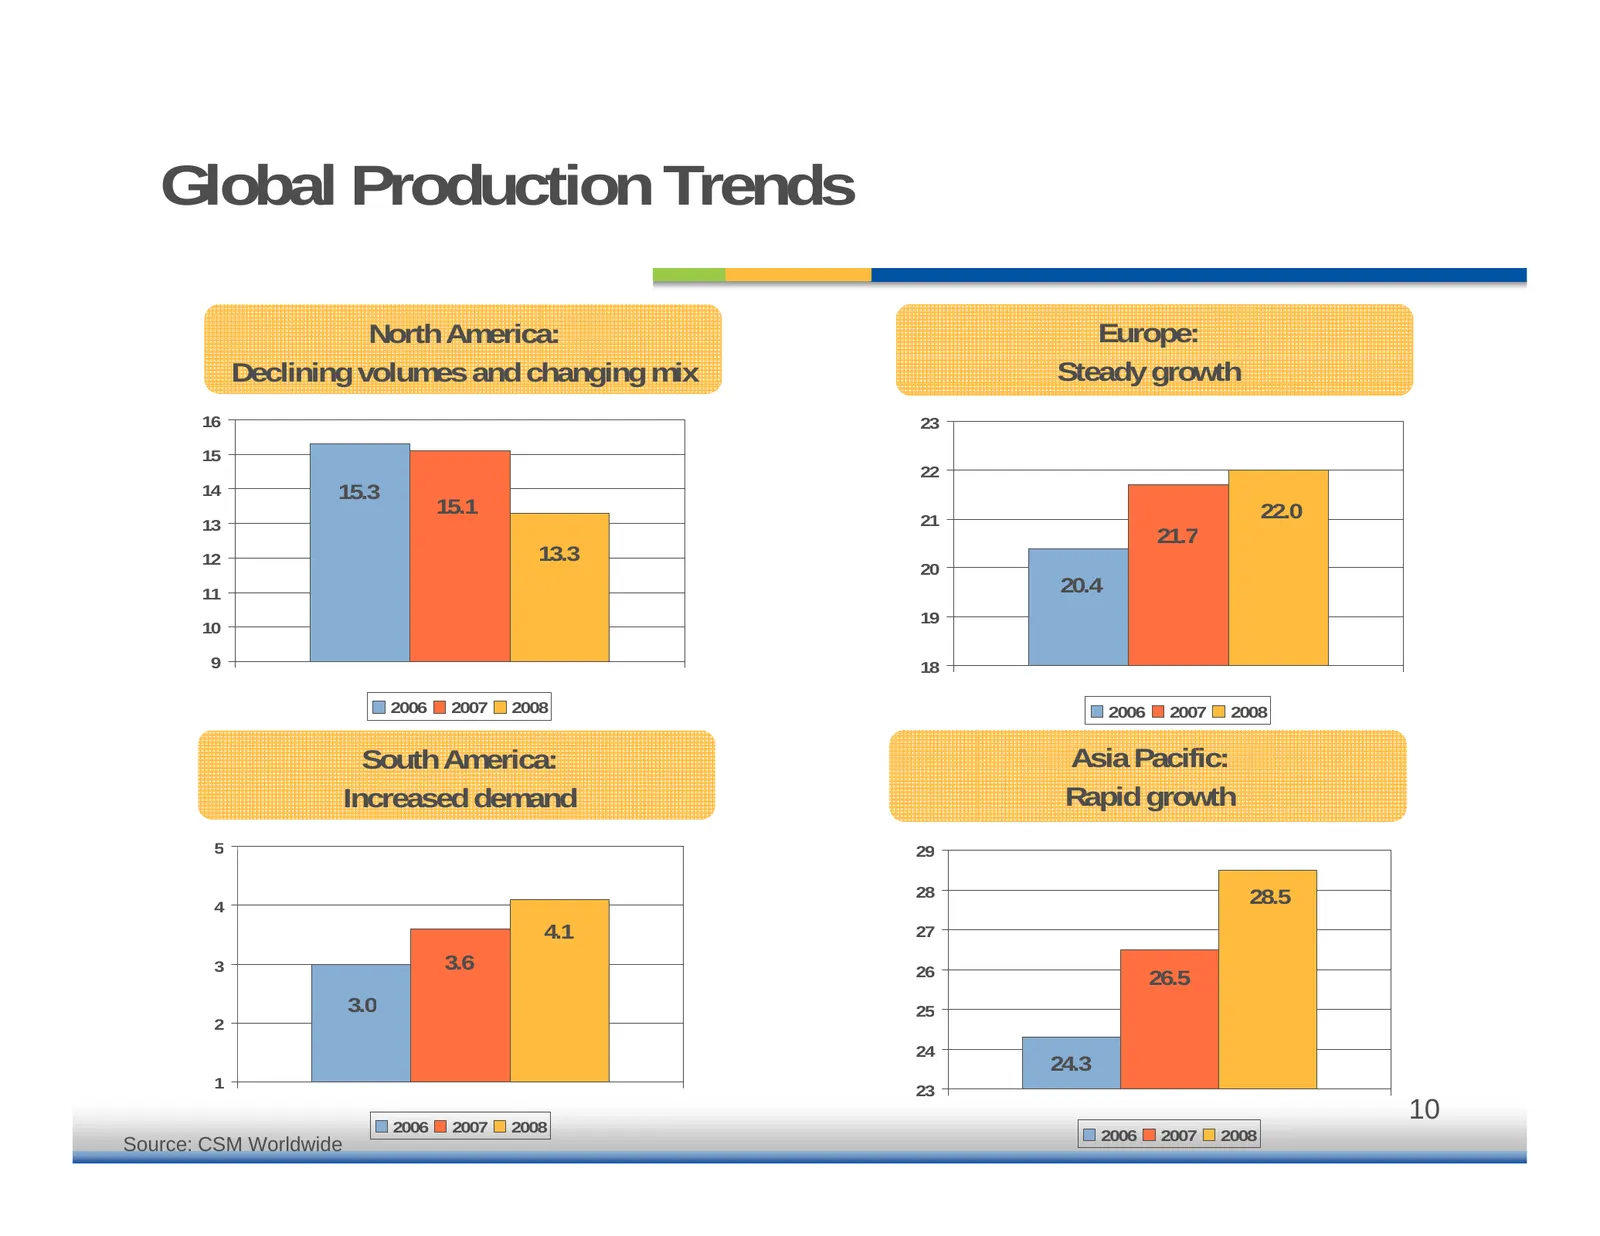
Global Production Trends North America: Europe: Declining g volumes and changing g g mix Steadyy g growth 16 23 15 22 14 15.3 15.1 22.0 13 21 21 7 21.7 12 13.3 20 11 20.4 19 10 9 18 2006 2007 2008 2006 2007 2008 South America: Asia Pacific: Increased demand Rapid growth 5 29 28 28.5 4 4.1 27 3 3.6 2
Slide 11: Top 25 CSA Platforms by Revenue
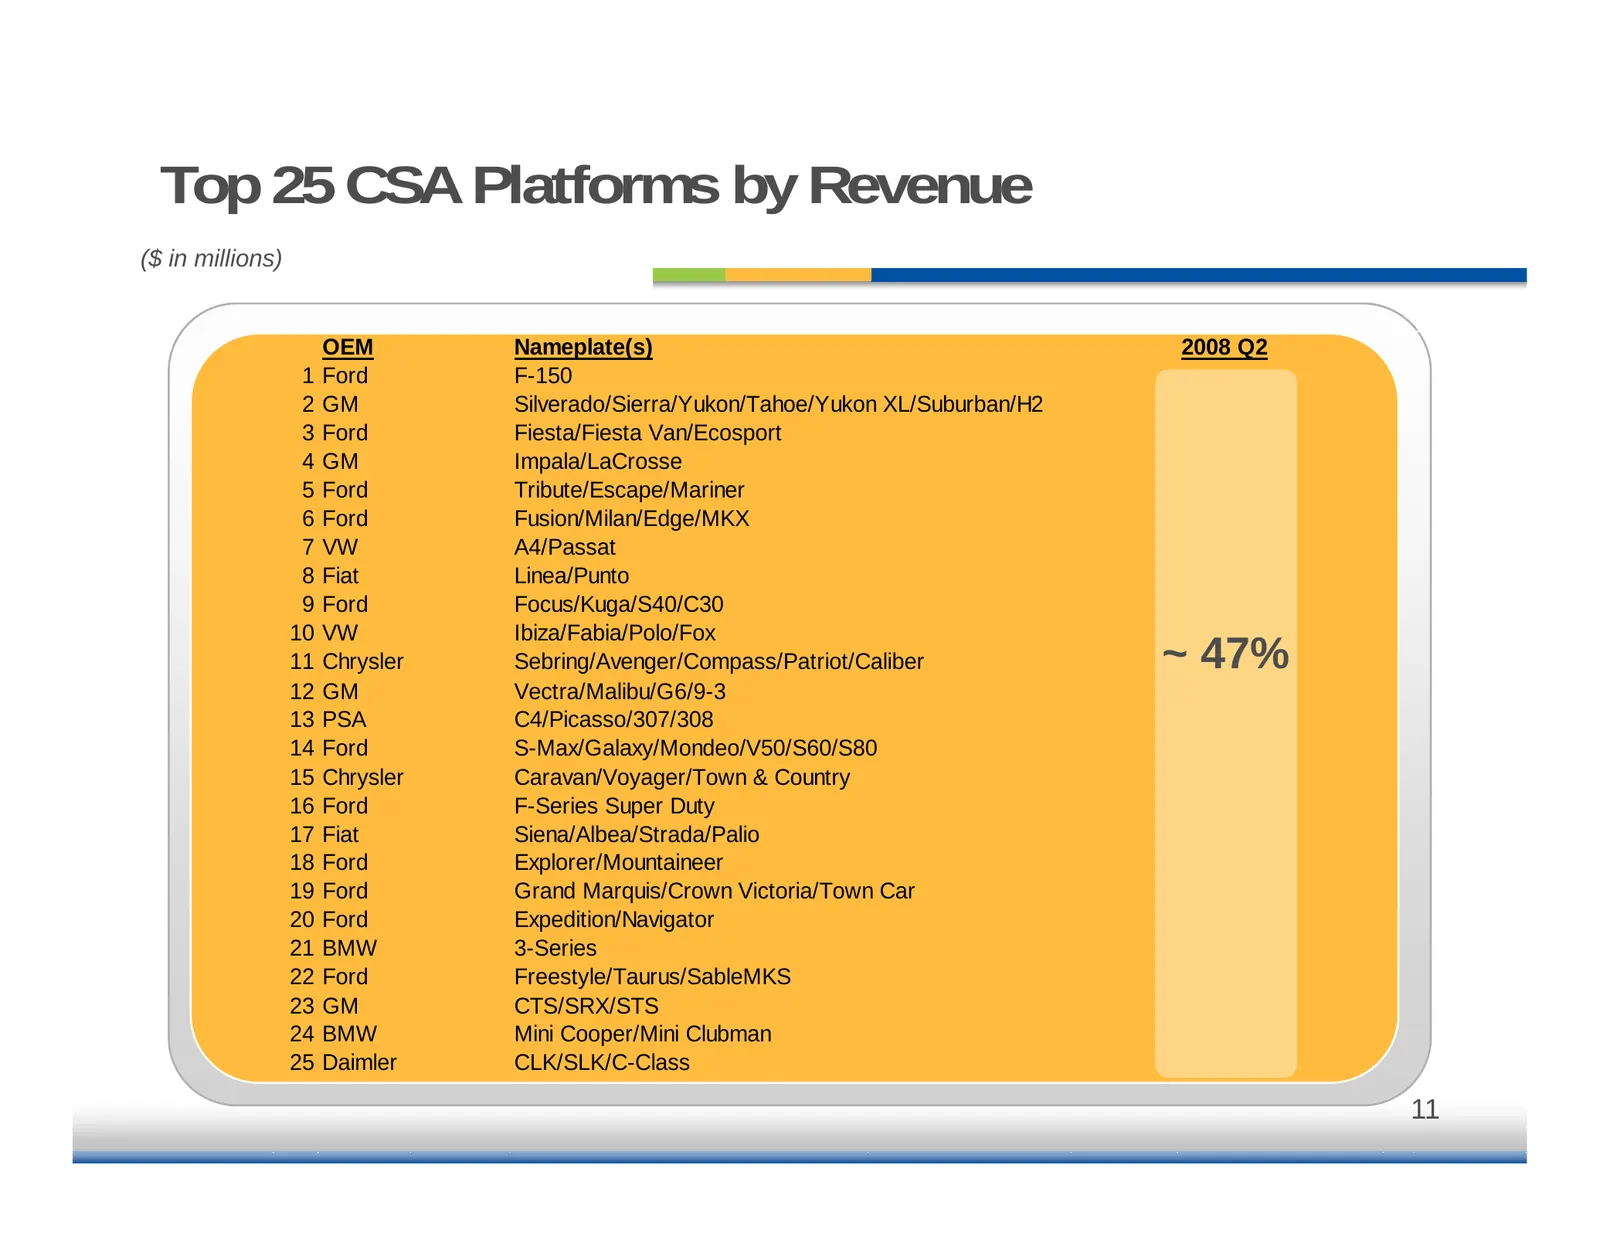
Top 25 CSA Platforms by Revenue ($ in millions) OEM Nameplate(s) 2008 Q2 1 Ford F-150 2 GM Silverado/Sierra/Yukon/Tahoe/Yukon XL/Suburban/H2 3 Ford Fiesta/Fiesta Van/Ecosport 4 GM Impala/LaCrosse 5 Ford Tribute/Escape/Mariner 6 Ford Fusion/Milan/Edge/MKX 7 VW A4/P A4/Passat t 8 Fiat Linea/Punto 9 Fo
Slide 12: Footprint Optimization
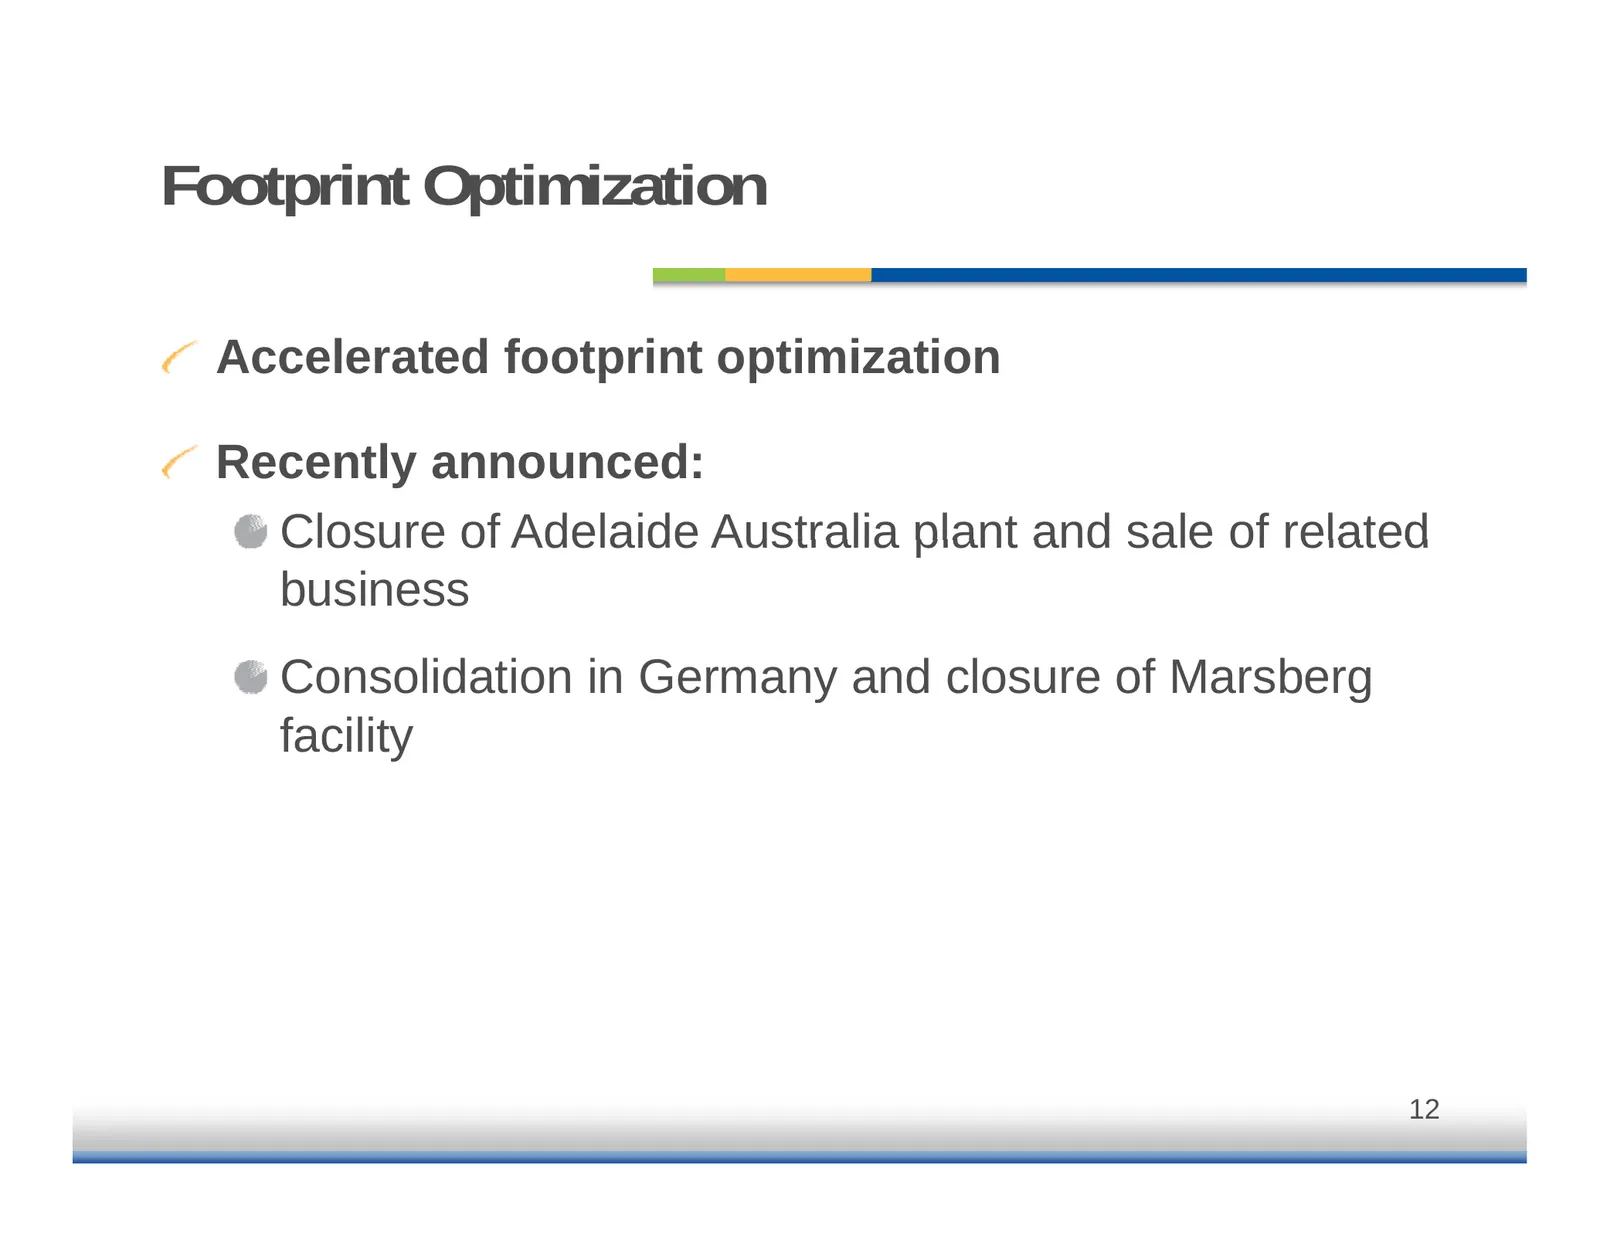
Footprint Optimization Accelerated footprint optimization Recently announced: Closure of Adelaide Australia plant and sale of related business Consolidation in Germanyy and closure of Marsberg g facility 12
Slide 13: Material Price Impact / Response
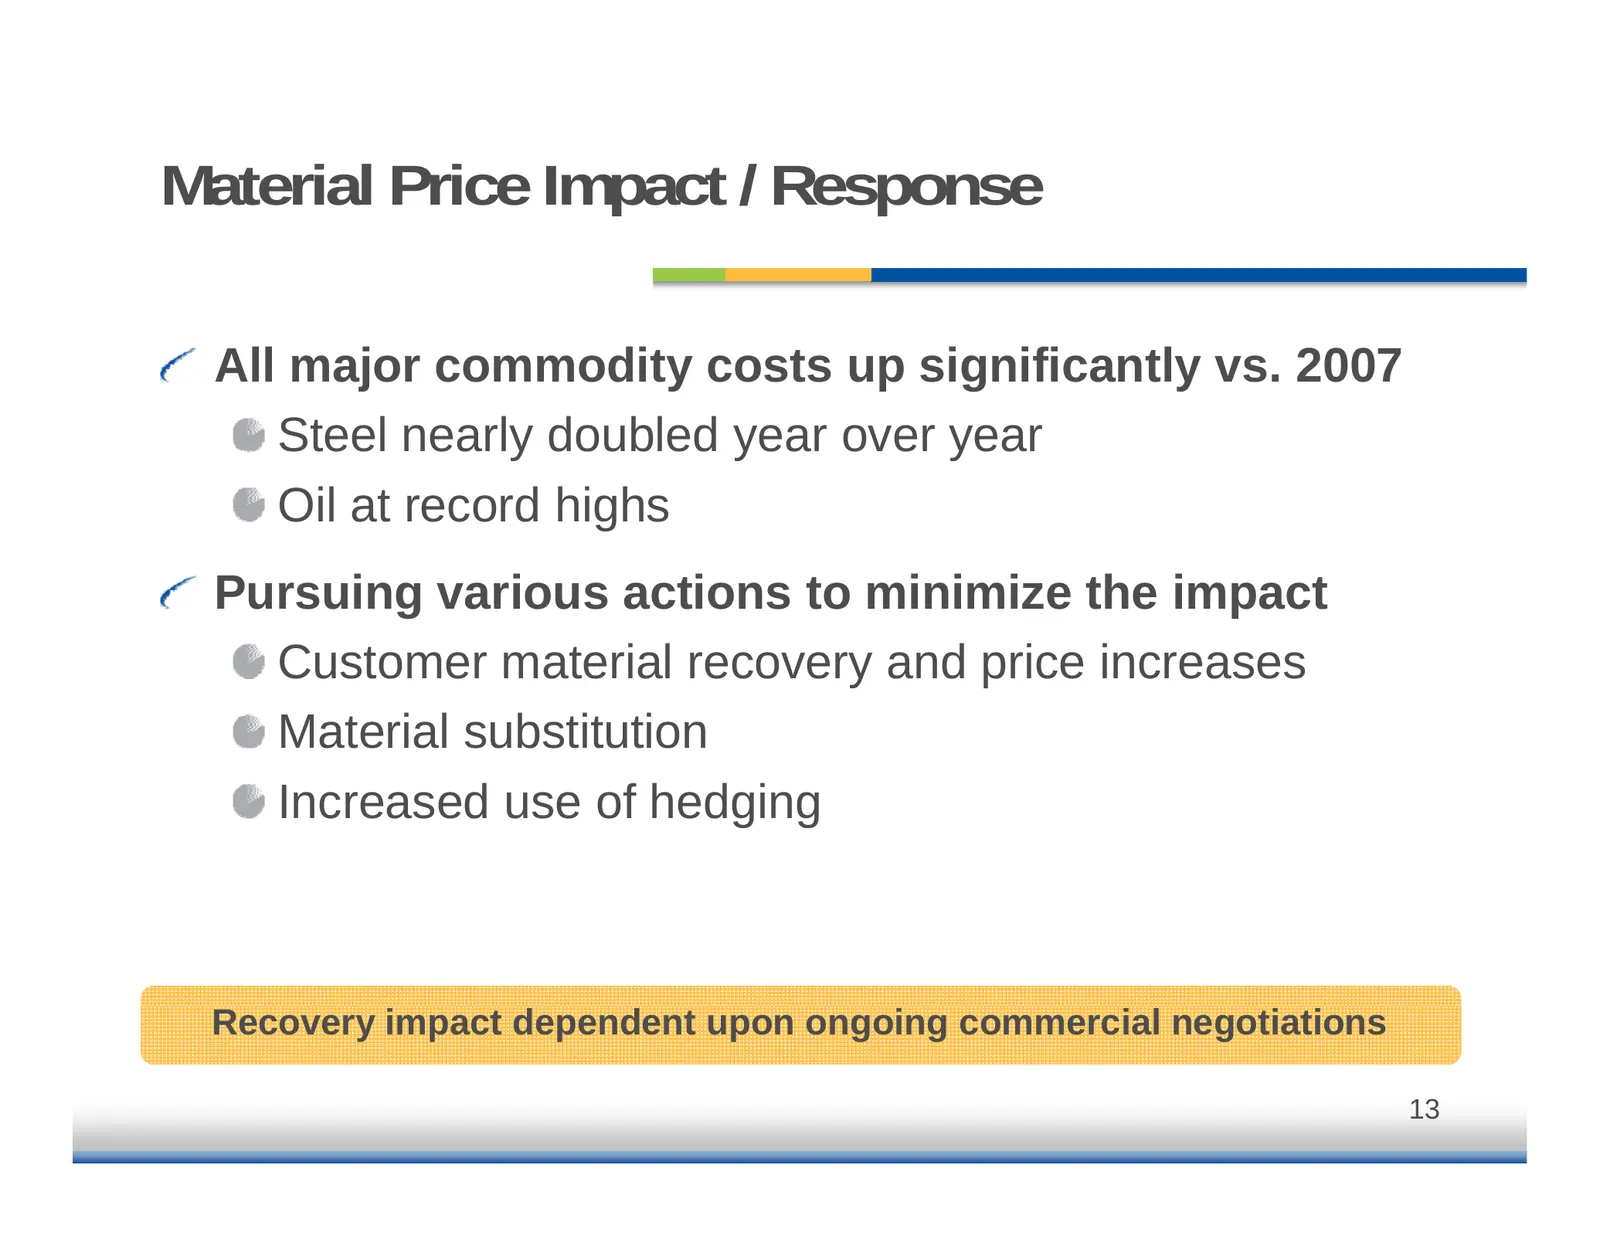
Material Price Impact / Response All major j commodity y costs up p significantly g y vs. 2007 Steel nearly doubled year over year Oil at record highs Pursuing various actions to minimize the impact Customer material recovery and price increases Material substitution Increased use of hedging Recover
Slide 14: New Business Wins
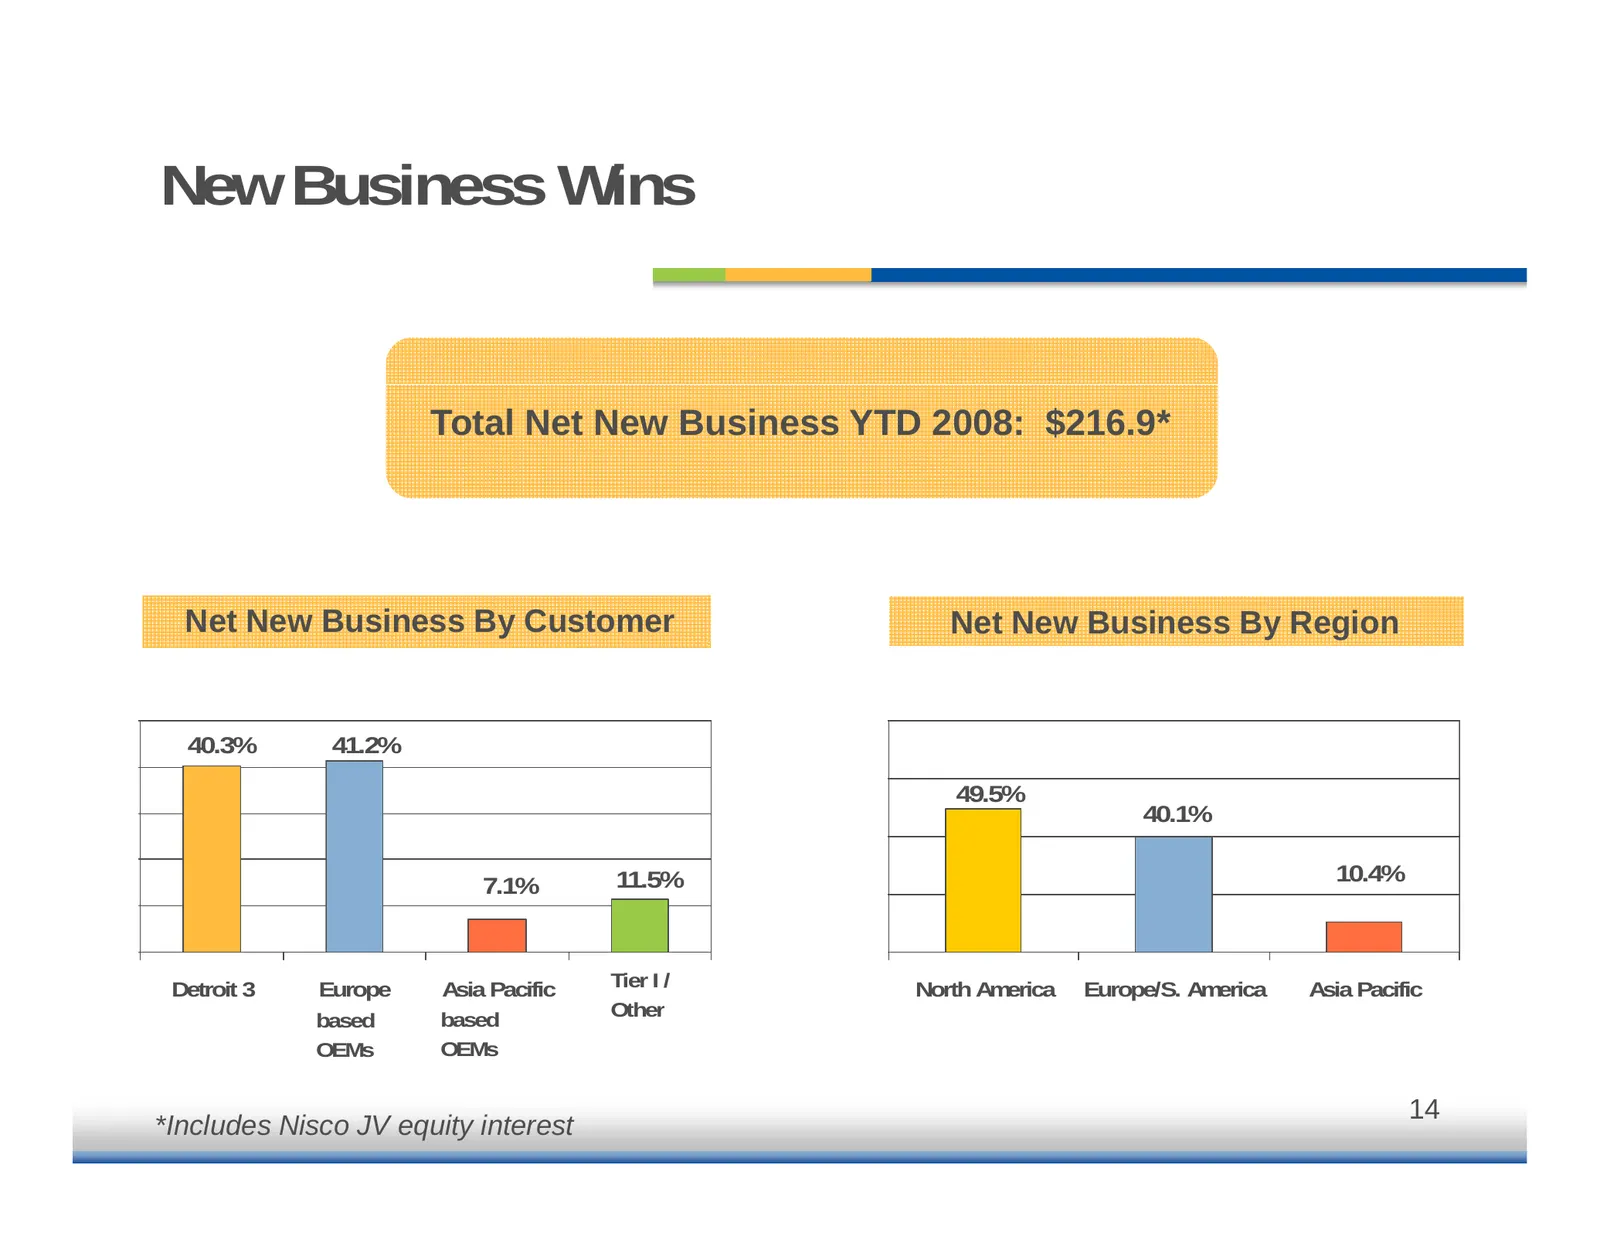
New Business Wins Total Net New Business YTD 2008: $216.9* Net New Business By Customer Net New Business By Region 50 80 40.3% 41.2% 40 60 49.5% 30 40.1% 40 20 10.4% 7.1% 11.5% 10 20 0 0 Detroit 3 Europe Asia Pacific Tier OtherI/ North America Europe/S. America Asia Pacific based based Other OEMs OE
Slide 15: Quarterly Business Highlights
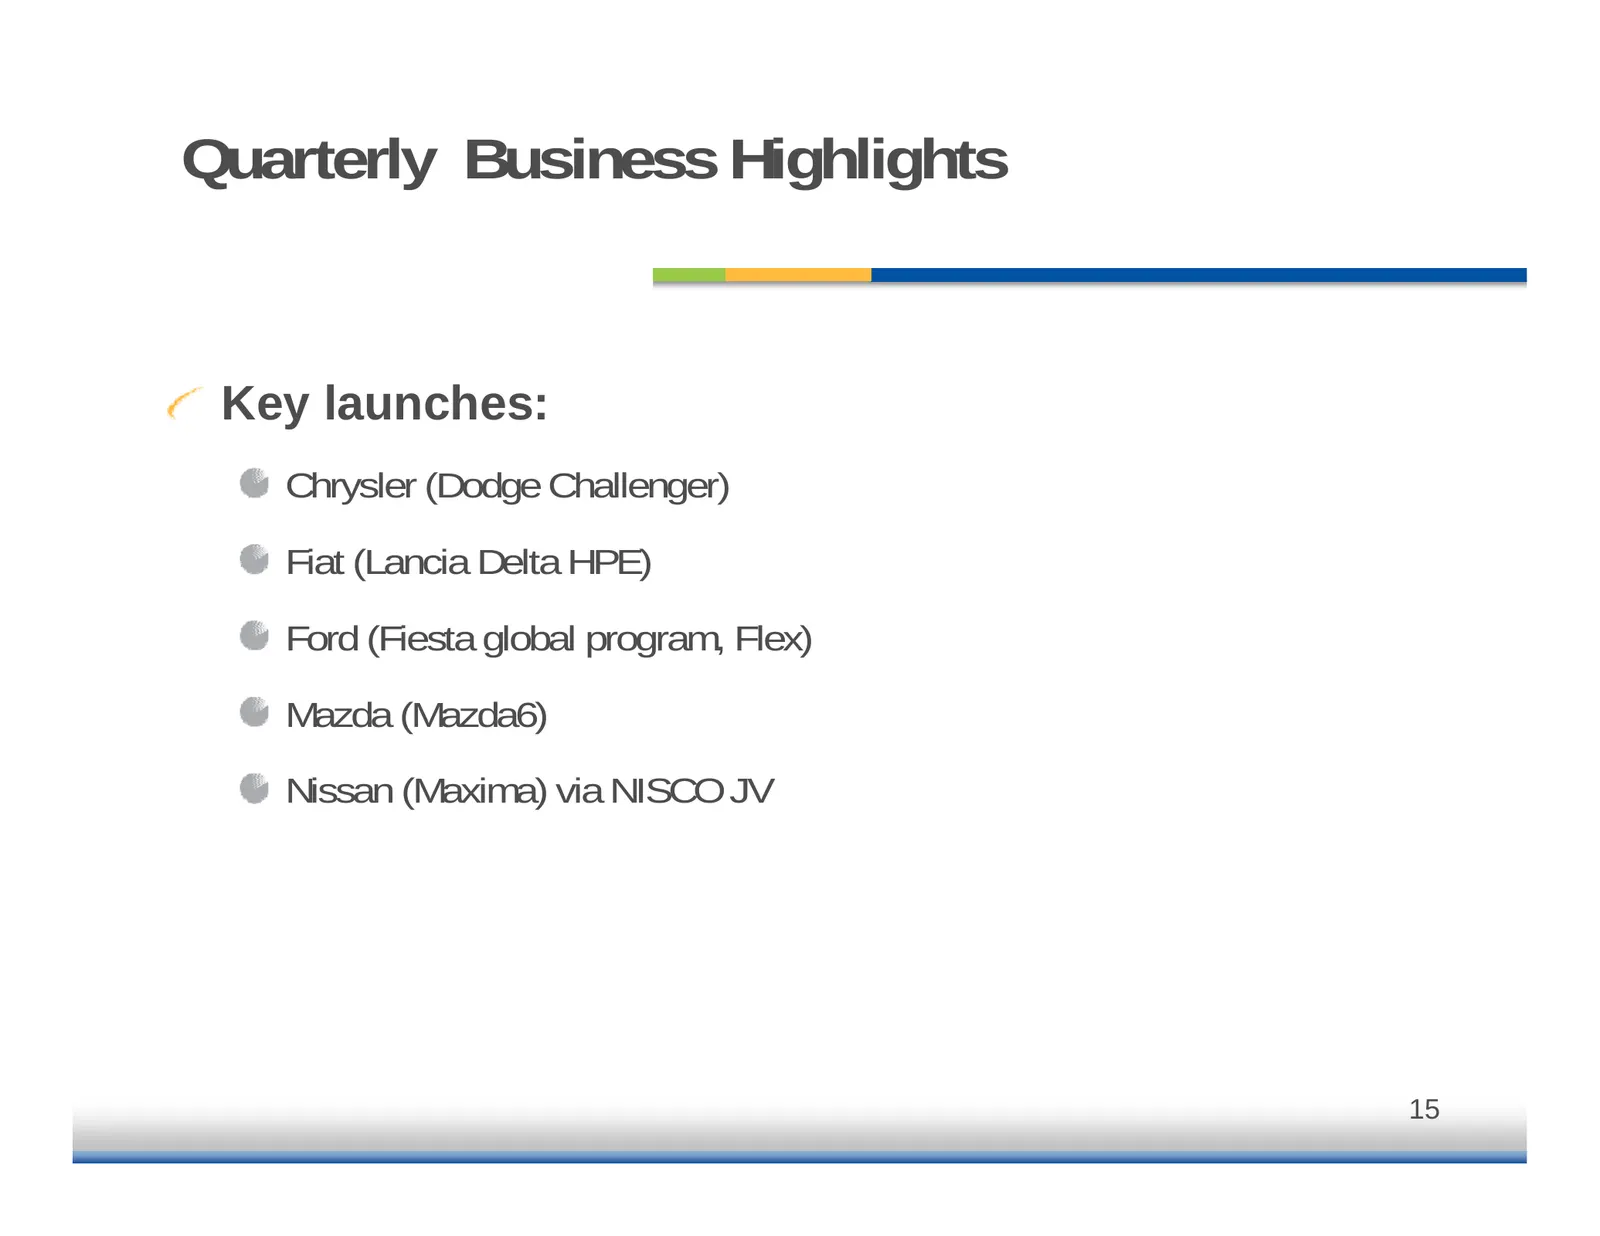
Quarterly Business Highlights Key launches: Chrysler (Dodge Challenger) Fiat (Lancia Delta HPE) Ford (Fiesta global program, Flex) Mazda (Mazda6) Nissan (Maxima) via NISCO JV 15
Slide 16: 2008 Q2 Sales by Customer
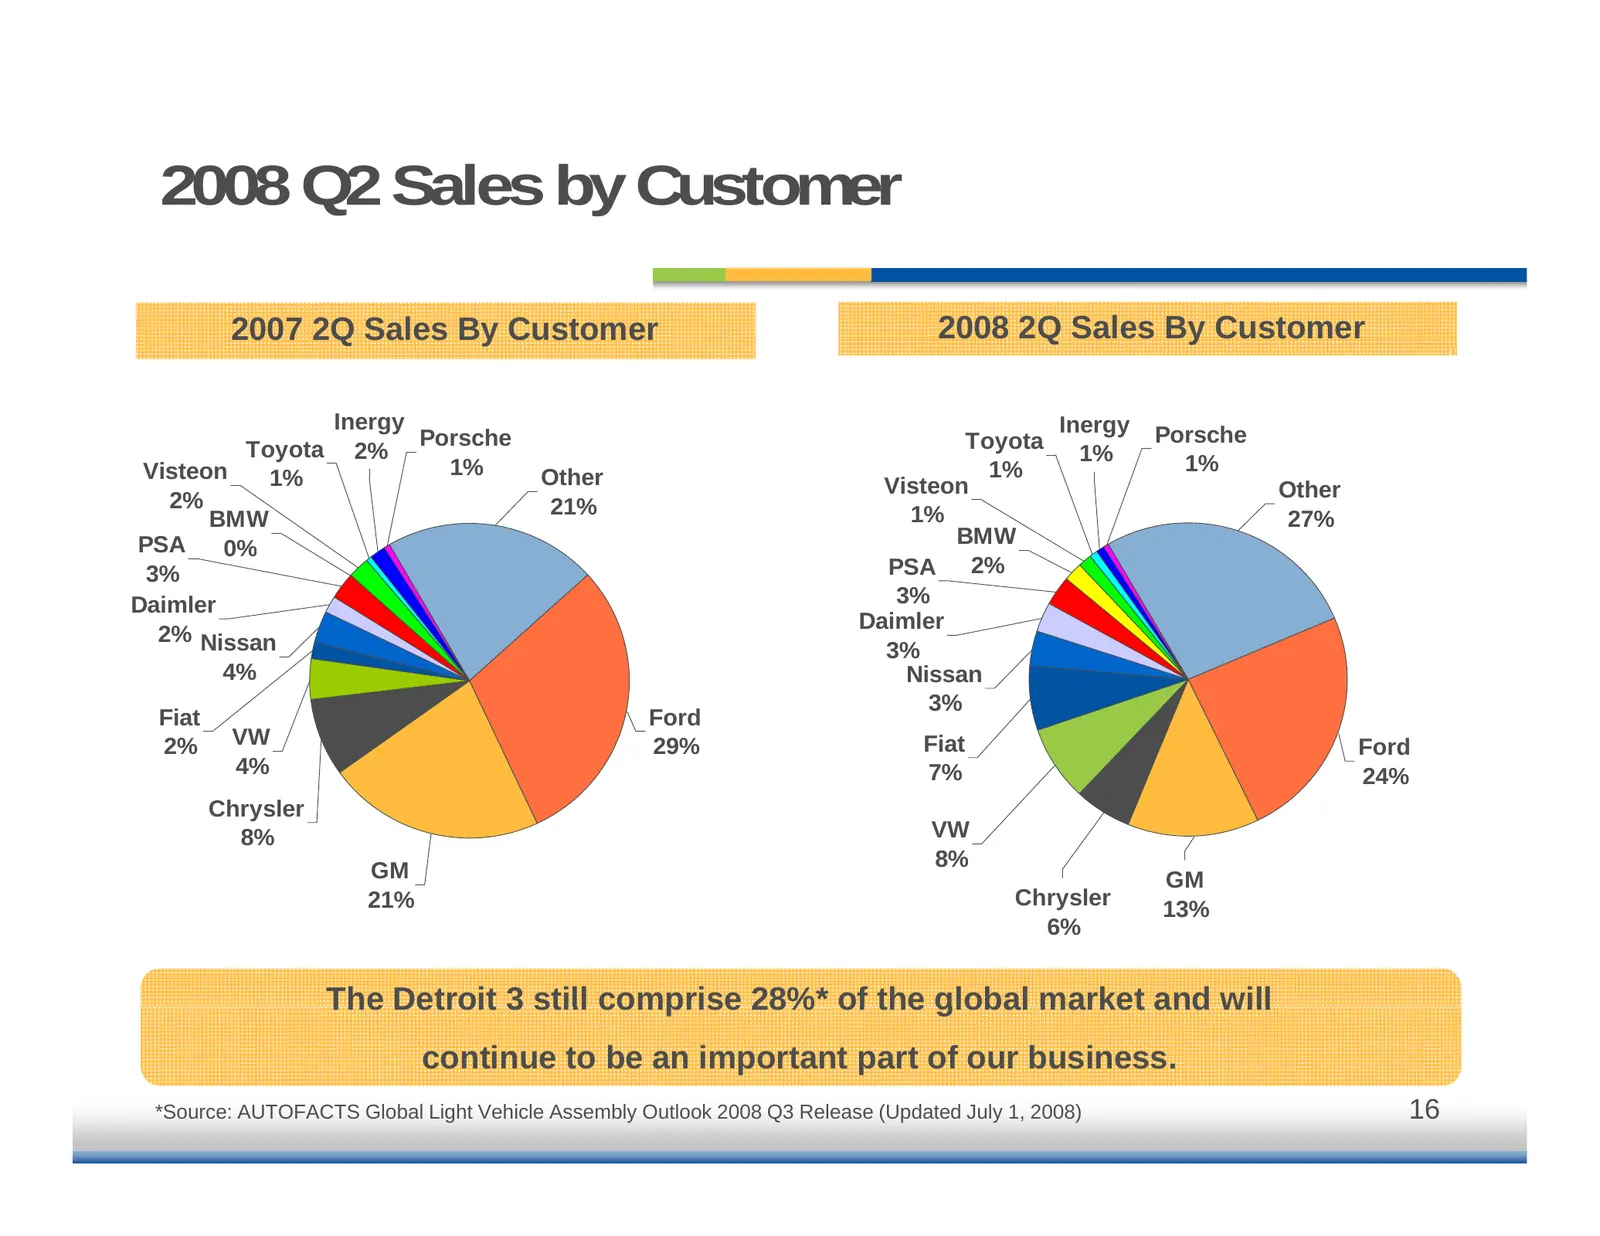
2008 Q2 Sales by Customer 2007 2Q Sales By Customer 2008 2Q Sales By Customer Inergy Inergy Porsche Toyota Porsche Toyota 2% 1% Visteon 1% 1% 1% 1% Other Visteon 2% Other 21% 1% BMW 27% PSA BMW 0% 3% PSA 2% Daimler 3% Daimler 2% Nissan 3% 4% Nissan 3% Fiat Ford 2% VW 29% Fiat Ford 4% 7% 24% Chrysler
Slide 17: Summary
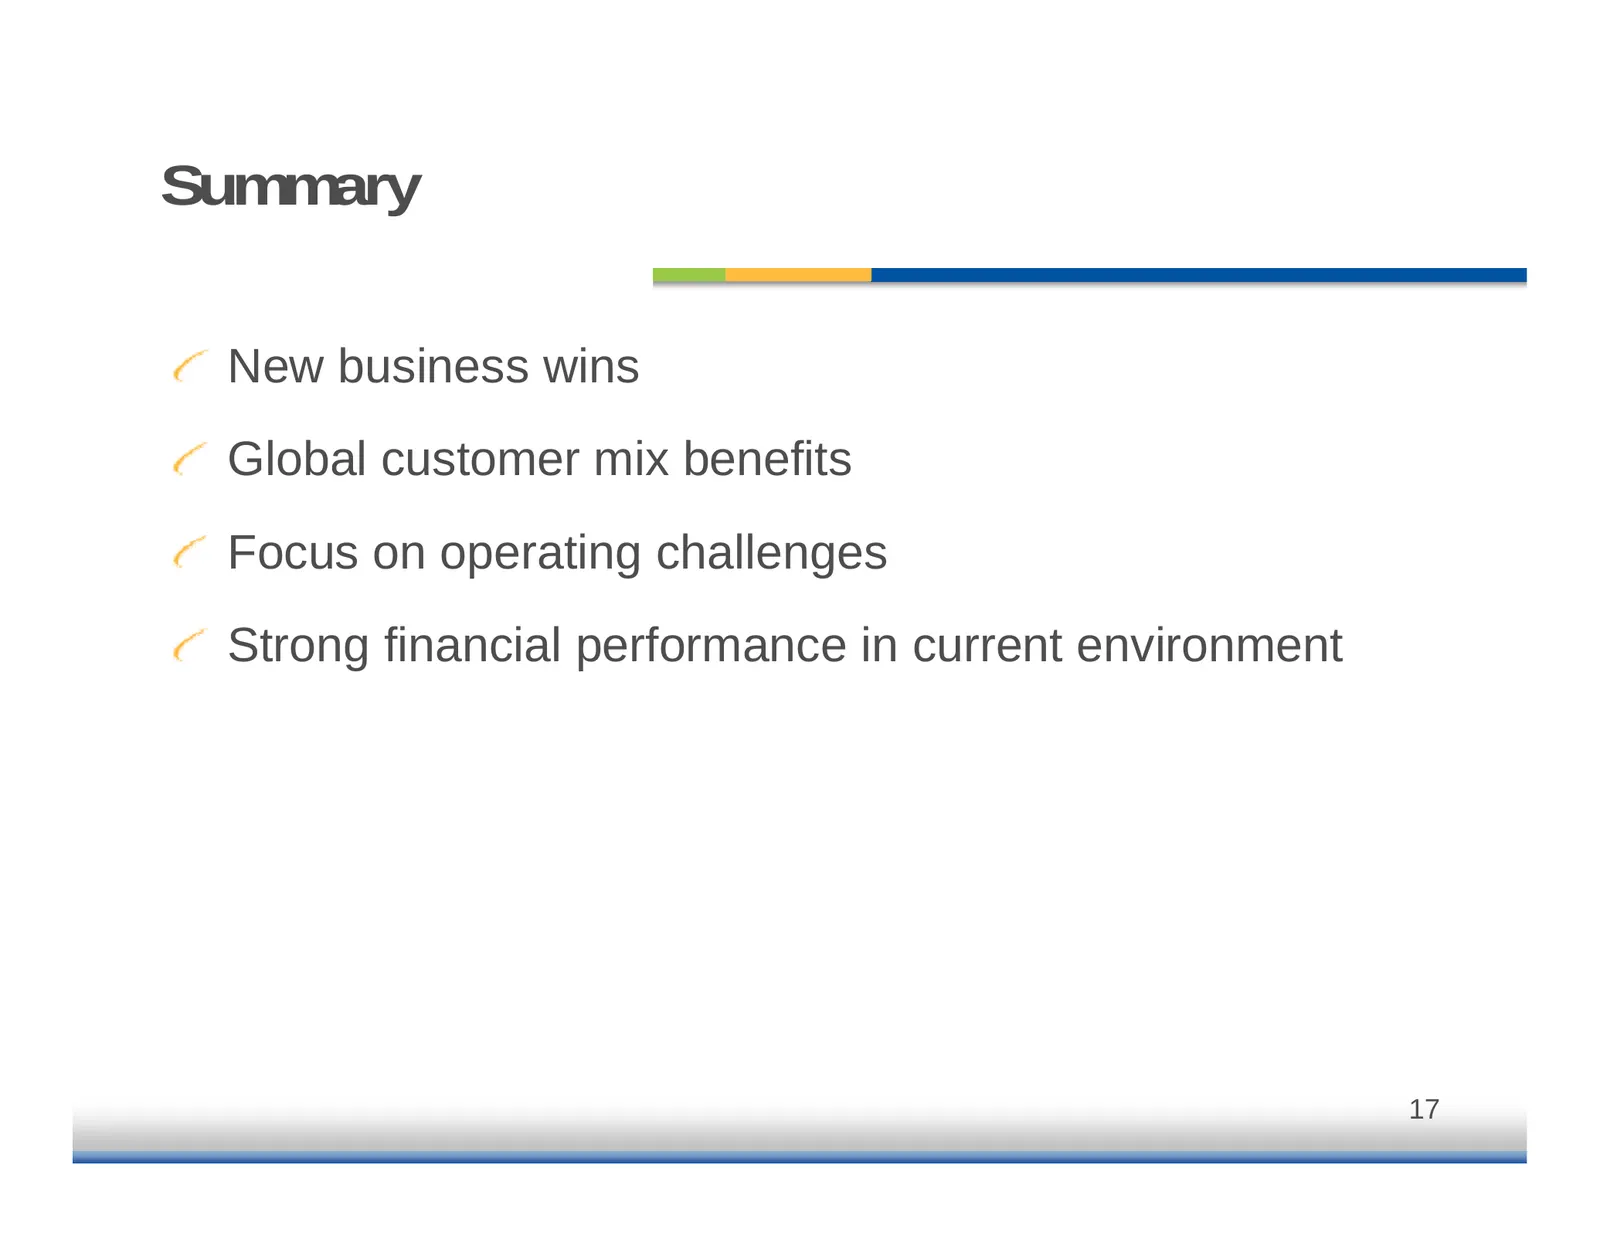
Summary New business wins Global customer mix benefits F Focus on operating ti challenges h ll Strong financial performance in current environment 17
Slide 18: Financial Update
Financial Update Allen Campbell Chief Financial Officer
Slide 19: 2Q 2008 Performance
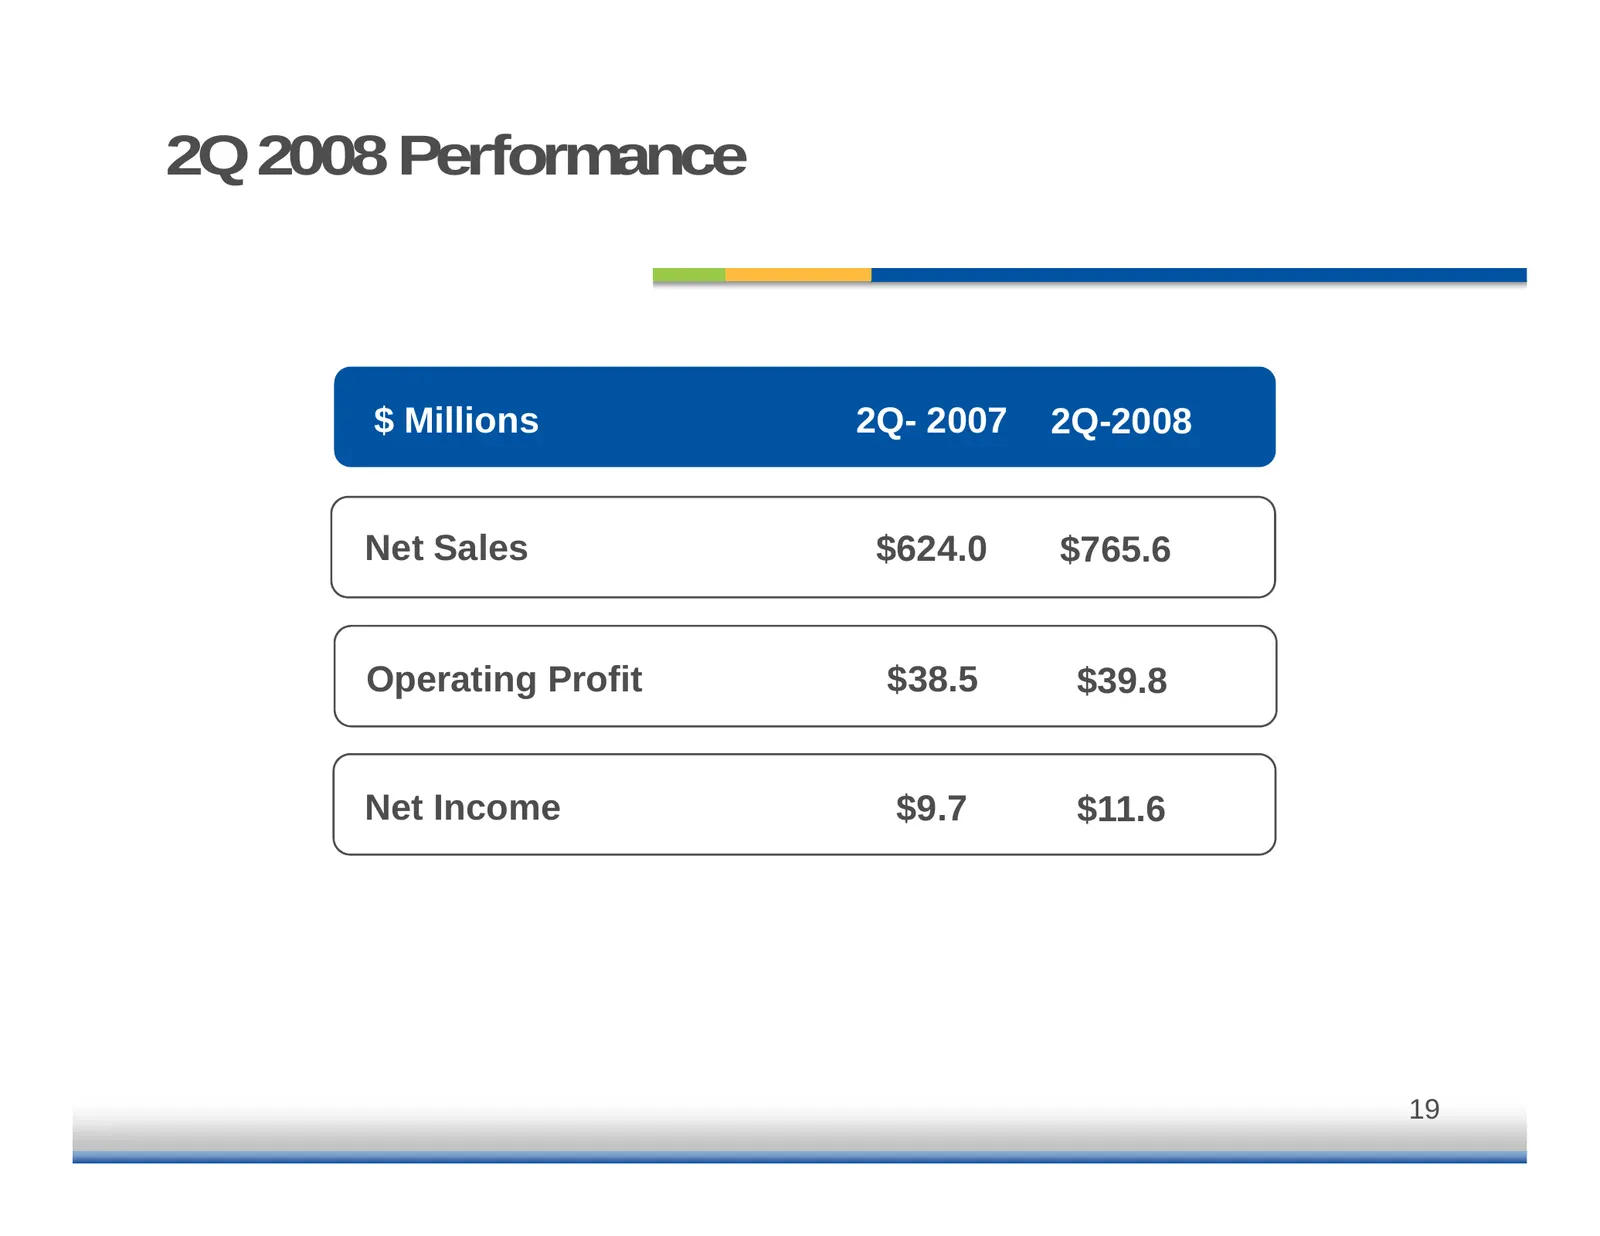
2Q 2008 Performance $ Millions 2Q- 2007 2Q-2008 N tS Net Sales l $624 0 $624.0 $765 6 $765.6 Operating p g Profit $38.5 $ $39.8 $ Net Income $9.7 $11.6 19
Slide 20: Adjusted EBITDA Reconciliation
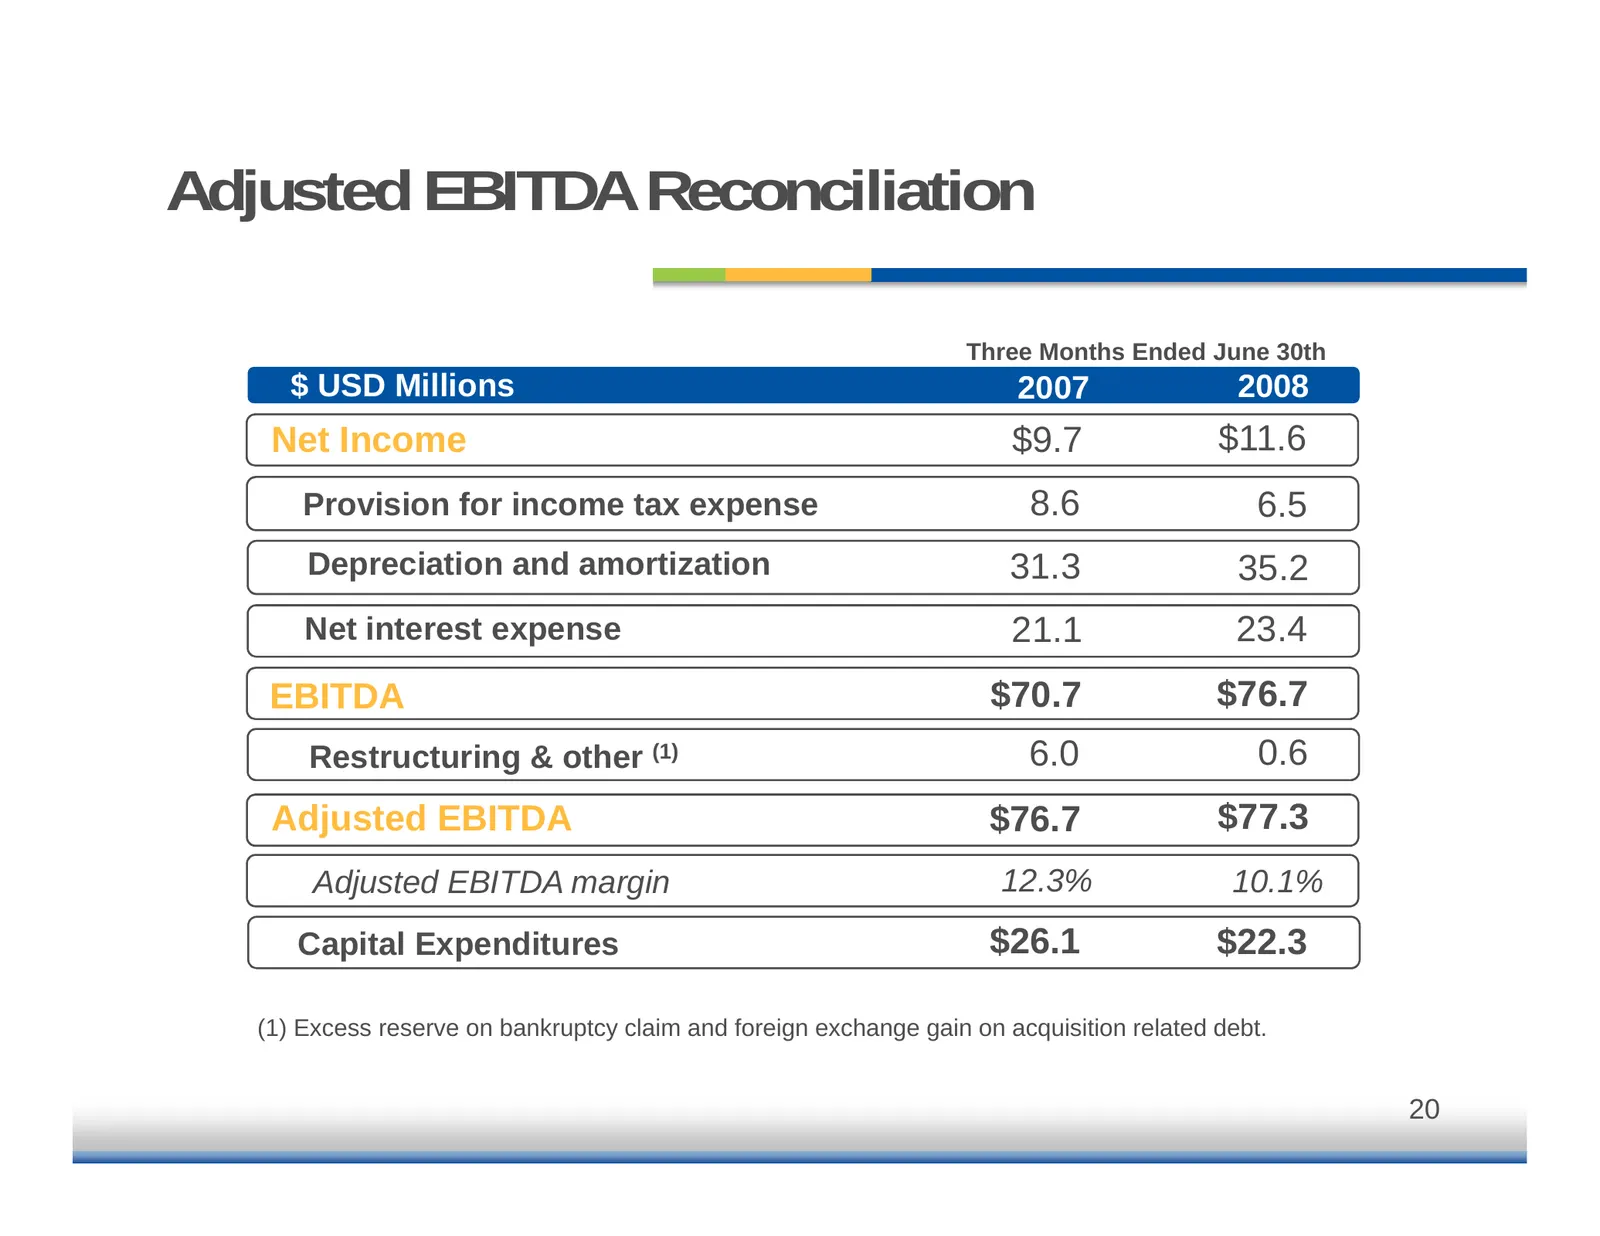
Adjusted EBITDA Reconciliation Three Months Ended June 30th $ USD Millions 2007 2008 Net Income $9.7 $11.6 Provision for income tax expense 8.6 6.5 Depreciation and amortization 31.3 35.2 Net interest expense 21.1 23.4 EBITDA $70 7 $70.7 $76 7 $76.7 Restructuring & other (1) 6.0 0.6 Adjusted EBITDA
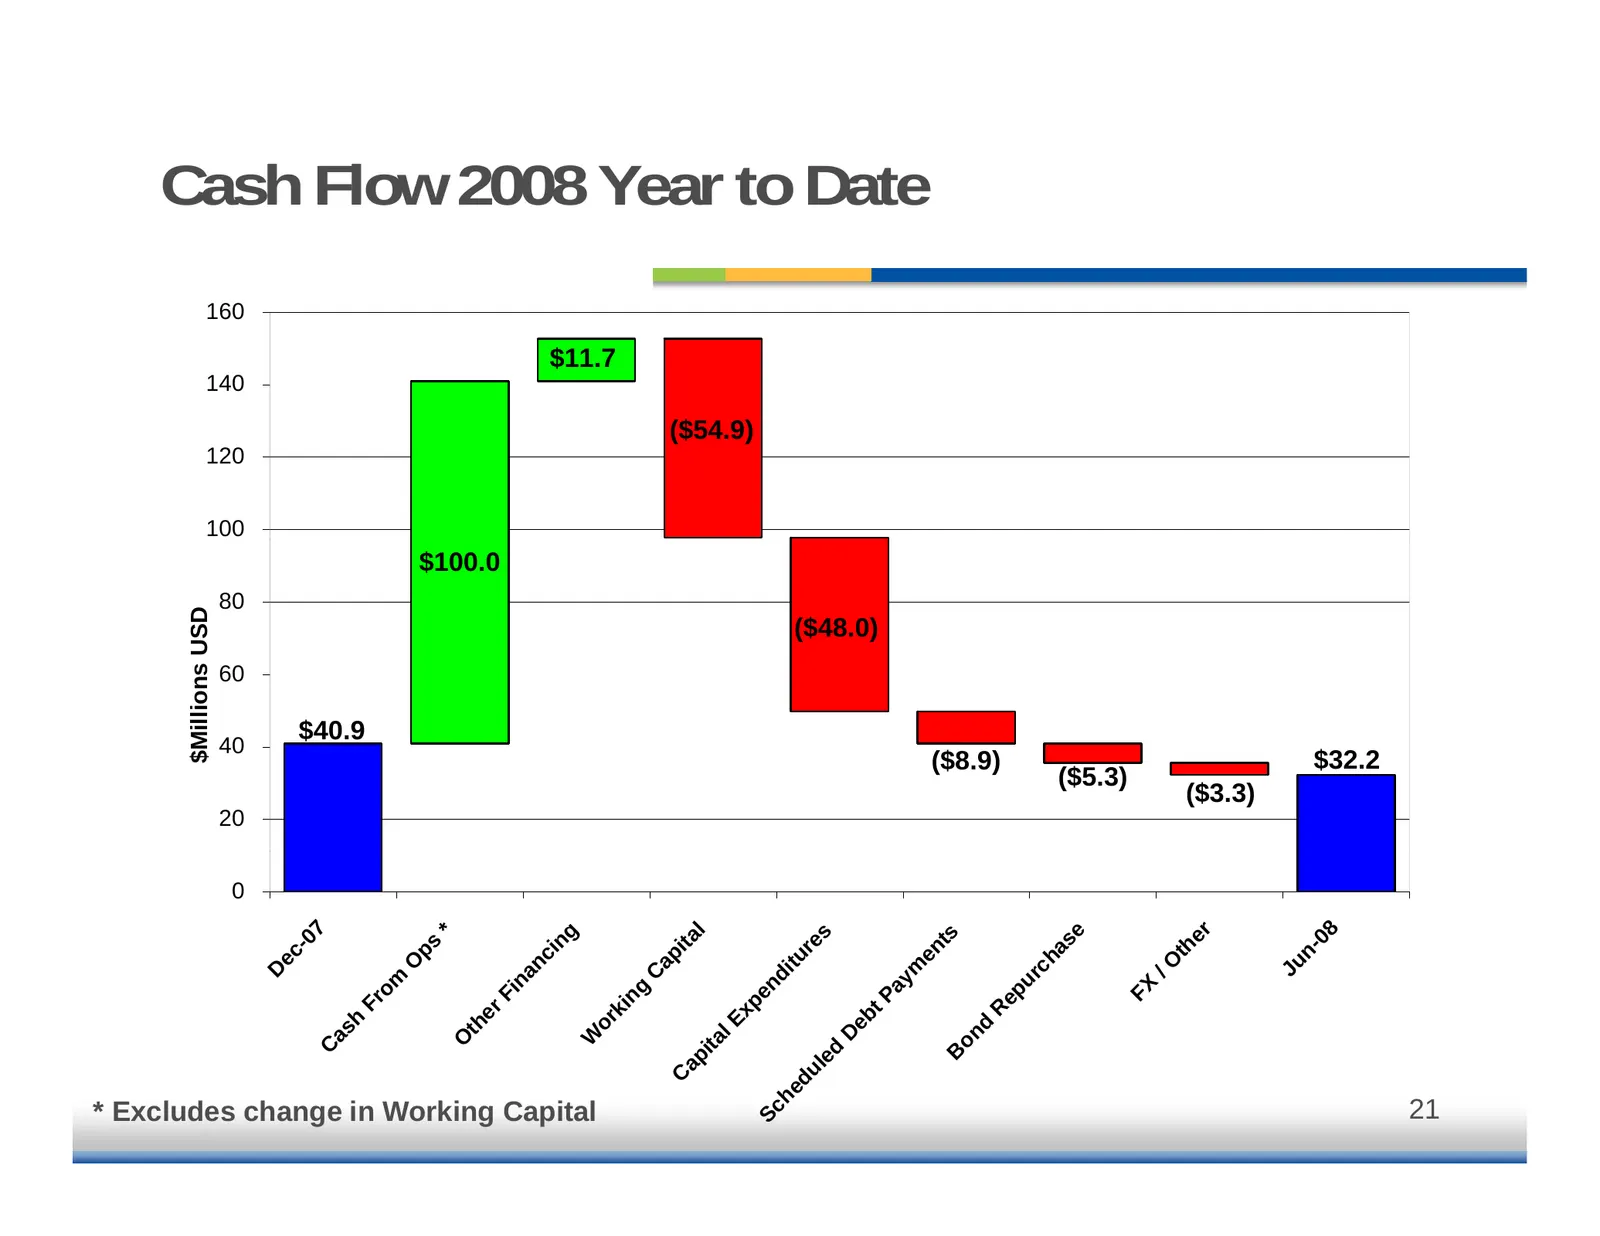
Slide 21: Cash Flow 2008 Year to Date
Cash Flow 2008 Year to Date 160 $11.7 140 ($54.9) 120 100 $100.0 80 ons USD ($48.0) 60 $Millio $40.9 40 ($8.9) $32.2 ($5.3) ($3.3) 20 0 7 08 er se l g * s ts ita -0 in re ps th en n- ha ec ap nc itu /O O Ju ym rc D C na nd om u FX Pa ng ep Fi pe Fr ki R er t Ex eb or h th d as D on W l O ita C d B a
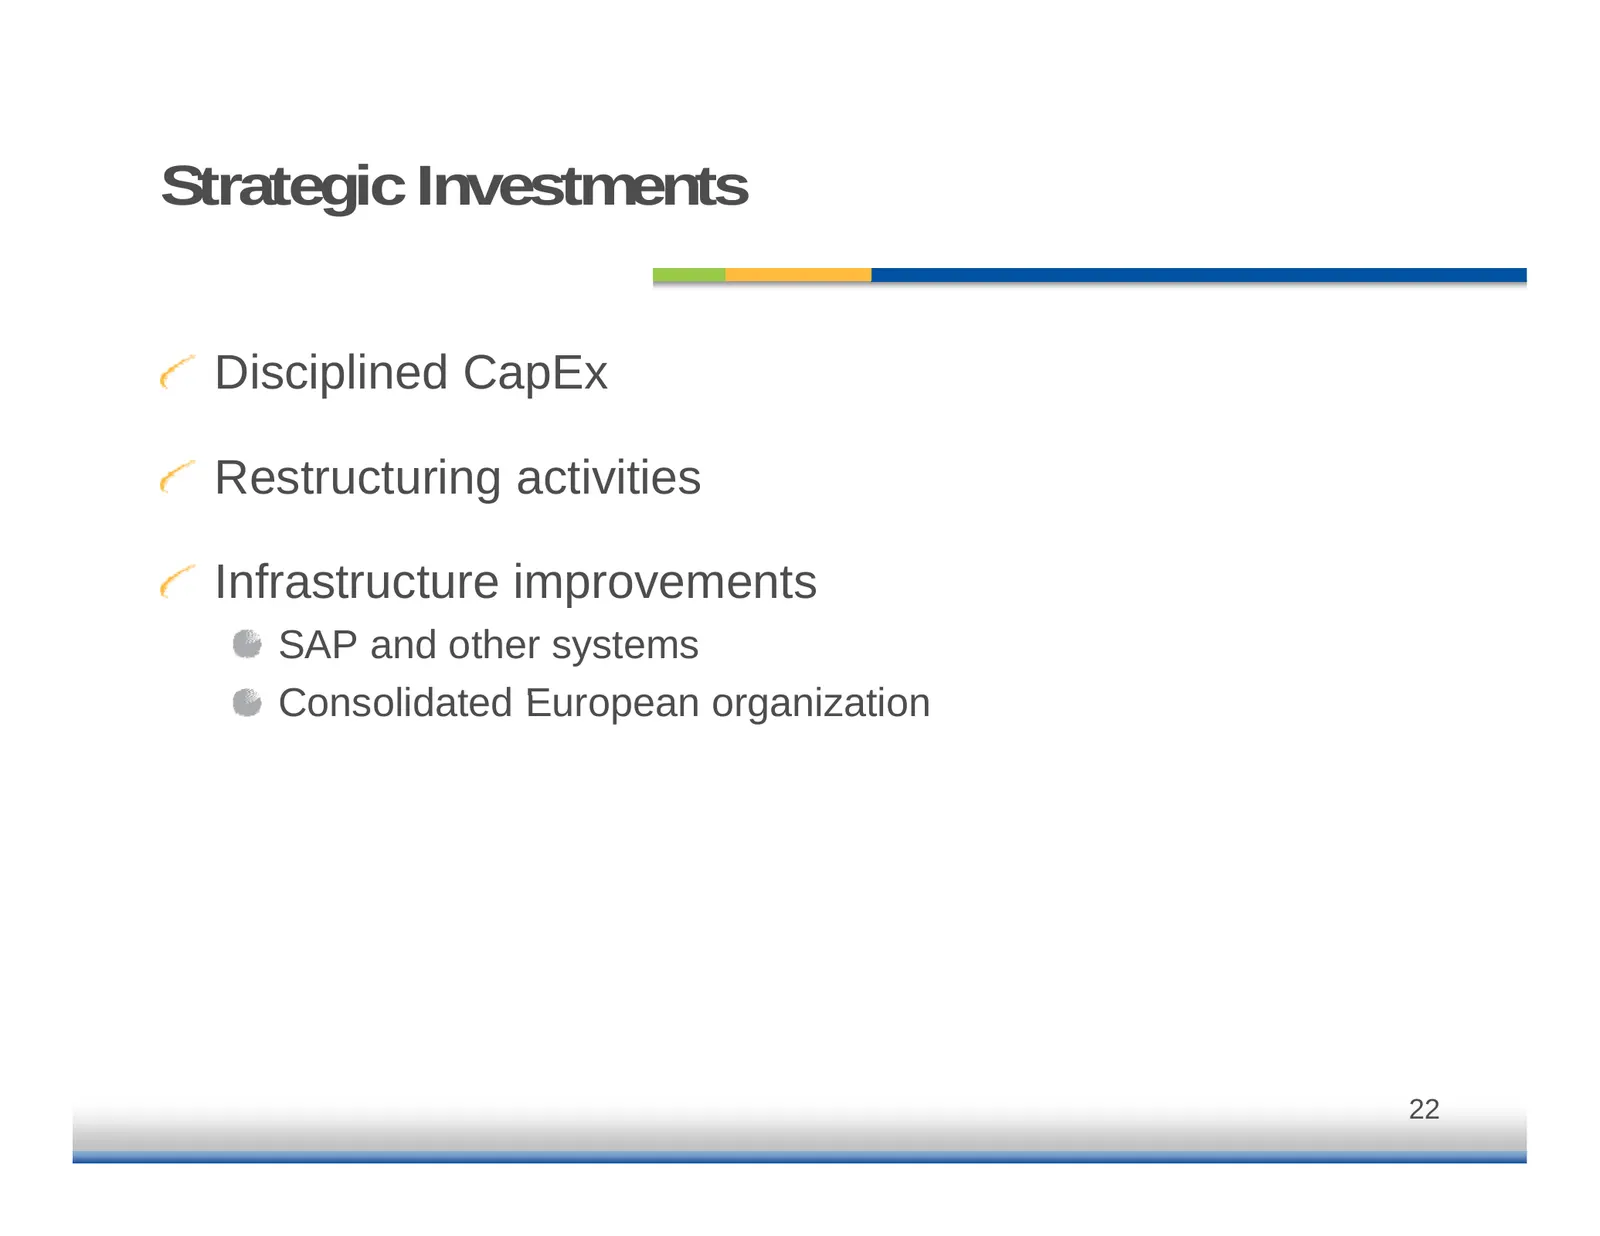
Slide 22: Strategic Investments
Strategic Investments Disciplined CapEx Restructuring activities Infrastructure improvements SAP and other systems Consolidated E European ropean organi organization ation 22
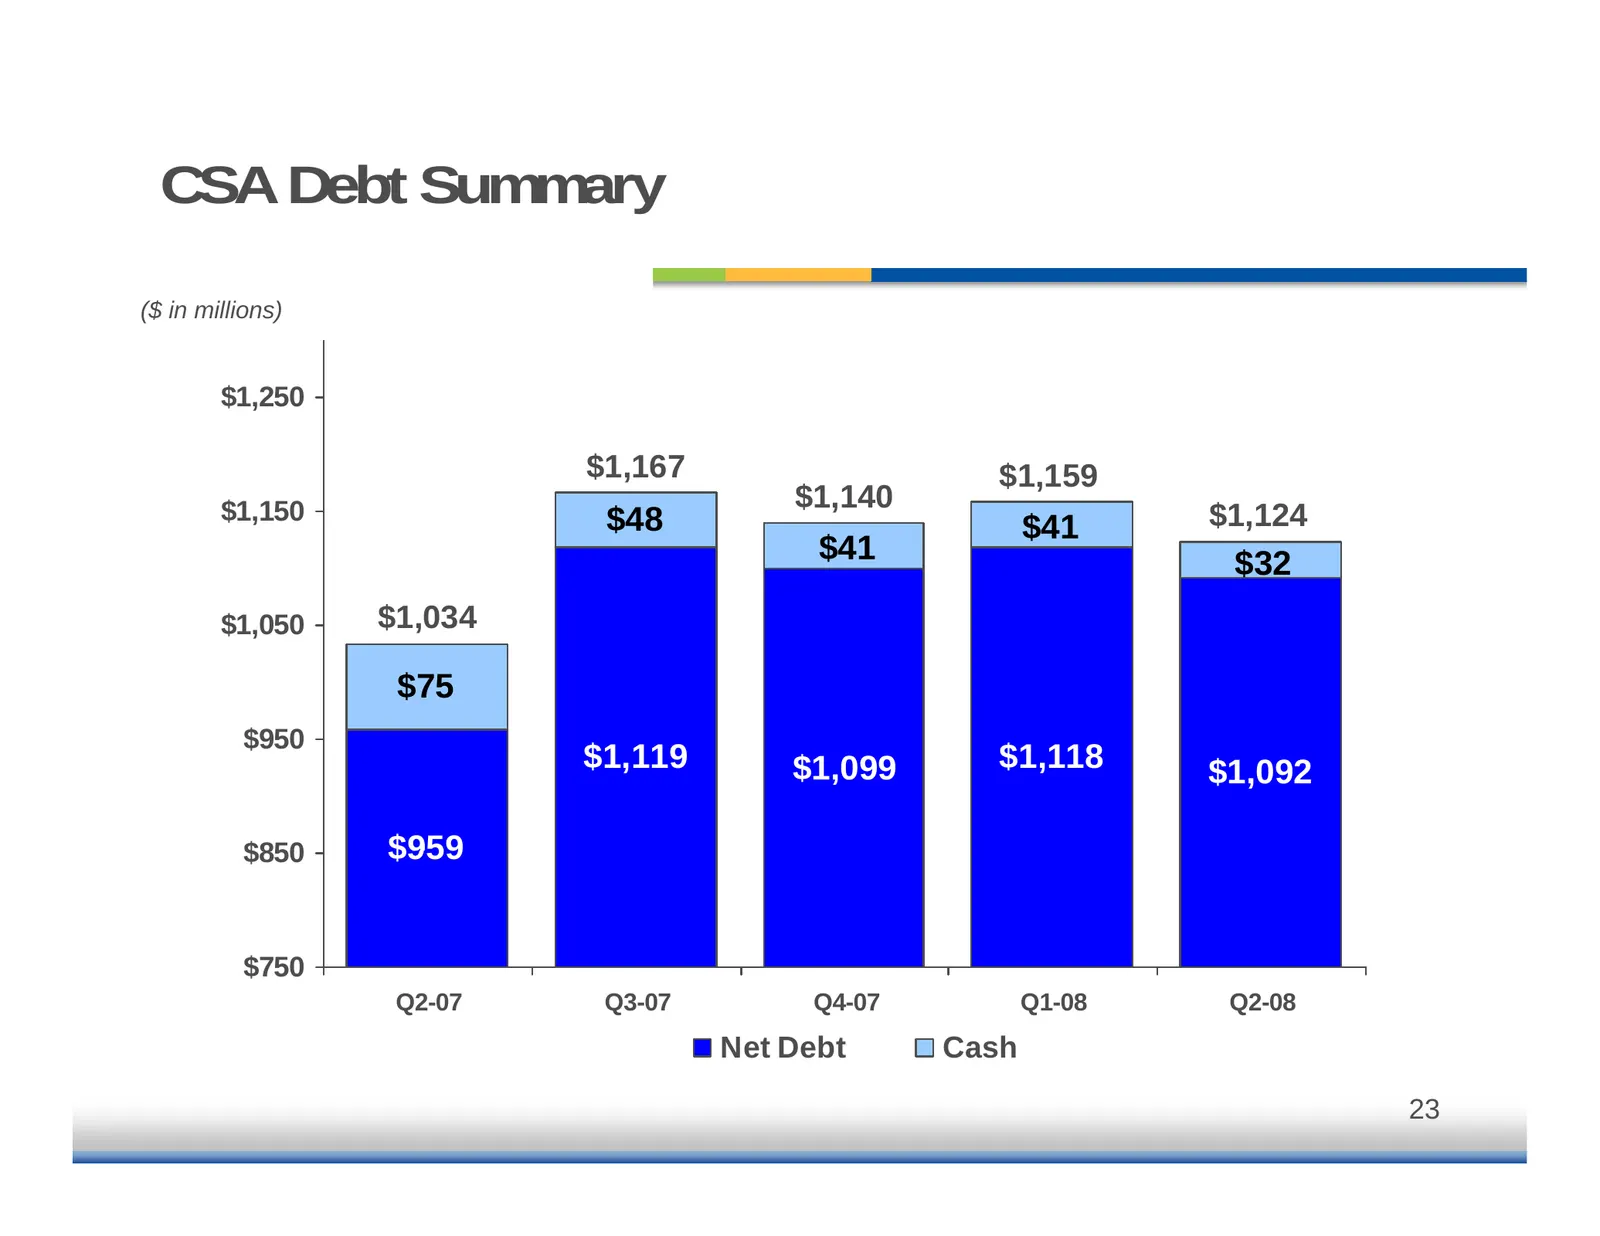
Slide 23: CSA Debt Summary
CSA Debt Summary ($ in millions) $1,250 $1,167 $1,159 $1,150 $1,140 $48 $41 $ $1,124 $41 $32 $1,050 $1,034 $75 $950 $1,119 $1,099 $1,118 $1,092 $850 $959 $750 Q2-07 Q2 07 Q3-07 Q3 07 Q4-07 Q4 07 Q1-08 Q1 08 Q2-08 Q2 08 Net Debt Cash 23
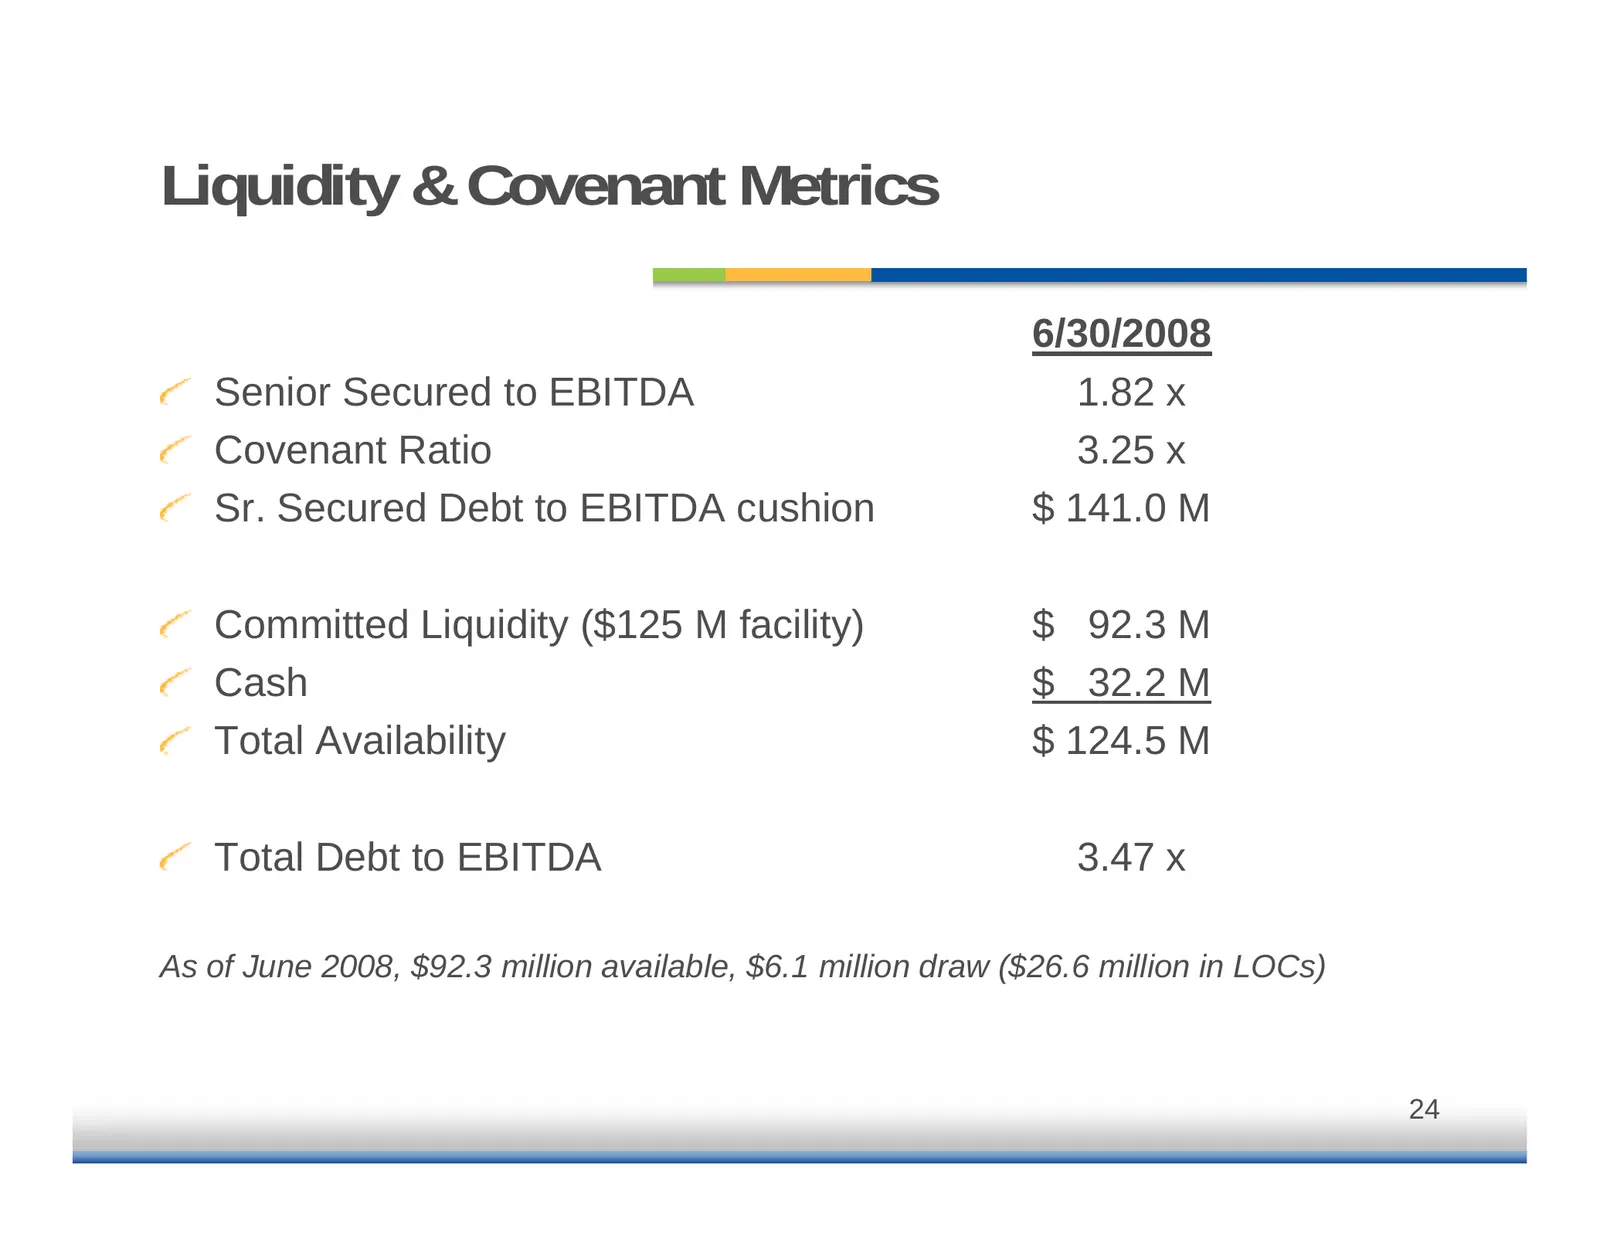
Slide 24: Liquidity & Covenant Metrics
Liquidity & Covenant Metrics 6/30/2008 Senior S i SSecured d tto EBITDA 1 82 x 1.82 Covenant Ratio 3.25 x Sr. Secured Debt to EBITDA cushion $ 141.0 M Committed Liquidity ($125 M facility) $ 92.3 M Cash $ 32.2 M Total Availability $ 124.5 M Total Debt to EBITDA 3 47 x 3.47 As of June 2008, $92.3 mil
Slide 25: Financial Summary
Financial Summary Continued operating profit performance Disciplined investment strategy Stable debt and liquidity position 25
Slide 26: Questions and Answers
Questions and Answers & COOPER STANDARD™ 4yv AUTOMOTIVE
Slide 27: Closing Remarks Summary
Closing Remarks Summary Strong management team Executing long-term strategies Pro-active adjustment to industry dynamics New g global business wins 27
Source: Internet Archive copy of cooperstandard.com
More decks from Cooper-Standard Holdings Inc.
 Q3 2026 Earnings Presentation27 slides · Nov 5, 2026
 Investor Presentation (September 2026)18 slides · September 2026
 JP Morgan 2026 Auto Conference18 slides · Aug 12, 2026
 Q2 2026 Earnings Presentation27 slides · Aug 6, 2026
 Investor Presentation (June 2026)25 slides · June 2026
 Q1 2026 Earnings Presentation24 slides · May 7, 2026