Encore Bancshares — Investor Presentation (February 2008)
26 slides from Encore Bancshares's investor presentation, Feb 21, 2008

Slide 1: Investor Presentation
Exhibit 99.1 NASDAQ: EBTX Investor Presentation February 21, 2008

Slide 2: Forward-Looking Statements
Forward-Looking Statements This presentation may include forward-looking statements. These forward-looking statements include comments with respect to assumptions relating to projected growth, earnings, earnings per share and other financial performance measures, as well as management’s short-term a

Slide 3: Company Overview
Company Overview Company Type: Bank Holding Company and Wealth Management Organization Headquarters: Houston, Texas Total Assets: $1.4 billion Total Loans: $1.1 billion Total Deposits: $1.0 billion Total Equity: $157 million Assets Under Management: $2.8 billion Private Client Offices: 17 (greater H
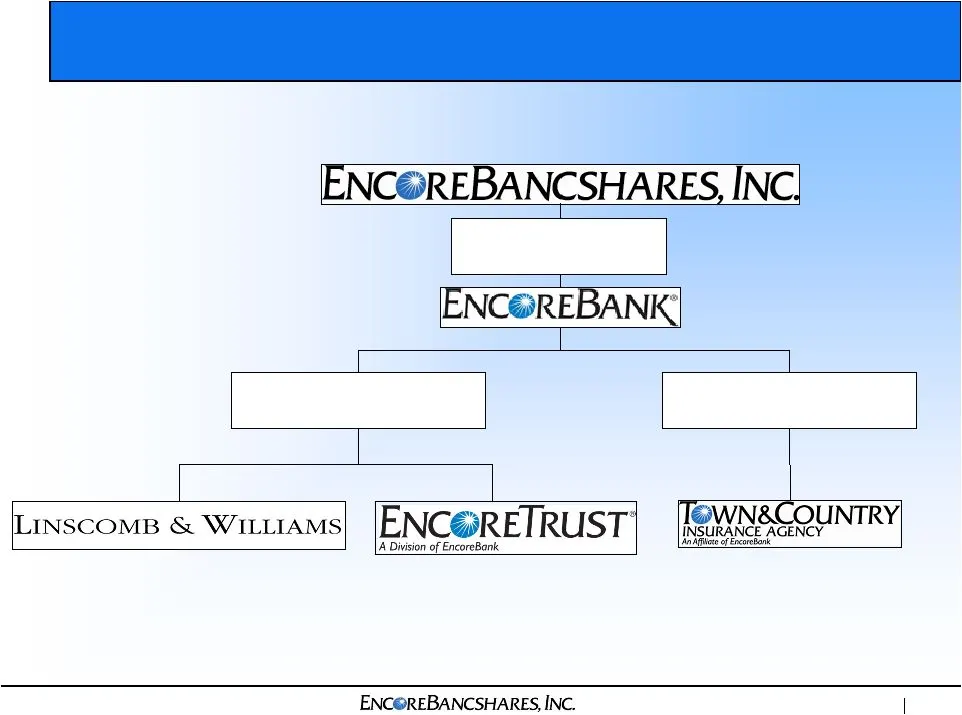
Slide 4: Corporate Structure
Corporate Structure Wealth Management 27% of revenue (1) Insurance 9% of revenue (1) (1) Defined as net interest income plus noninterest income; for the year ended December 31, 2007 Banking 64% of revenue (1)

Slide 5: Investment Highlights
Investment Highlights Encore is poised for an increase in profitability: – Growth in locally originated loans with higher yields – Decreasing low yielding purchased loans – Infrastructure in place to support larger institution with minimal expense growth Fee income contributes greatly to profitabili

Slide 6: Operating Philosophy
Operating Philosophy Focus on professional firms, privately-owned businesses, investors and affluent individuals Individual clients generally have a net worth of between $500,000 and $20 million Highly personalized service through private banker or relationship manager Hire and retain experienced fi
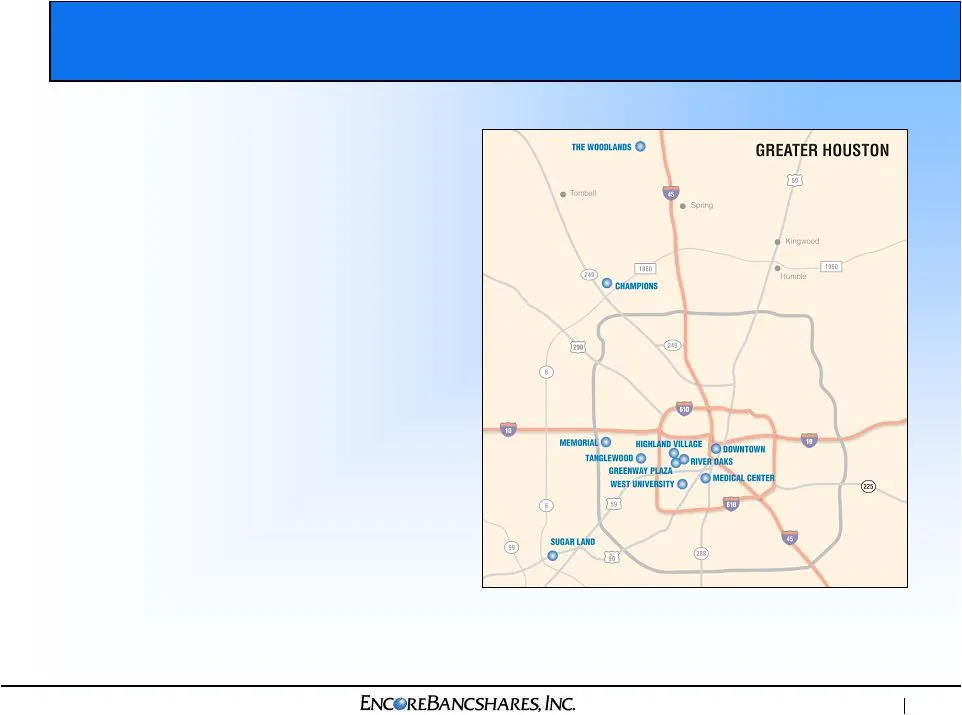
Slide 7: Houston Market
Houston Market 11 private client offices in high income zip codes 5.6 million people $98 billion in deposits Energy capital, healthcare, 24 Fortune 500 companies
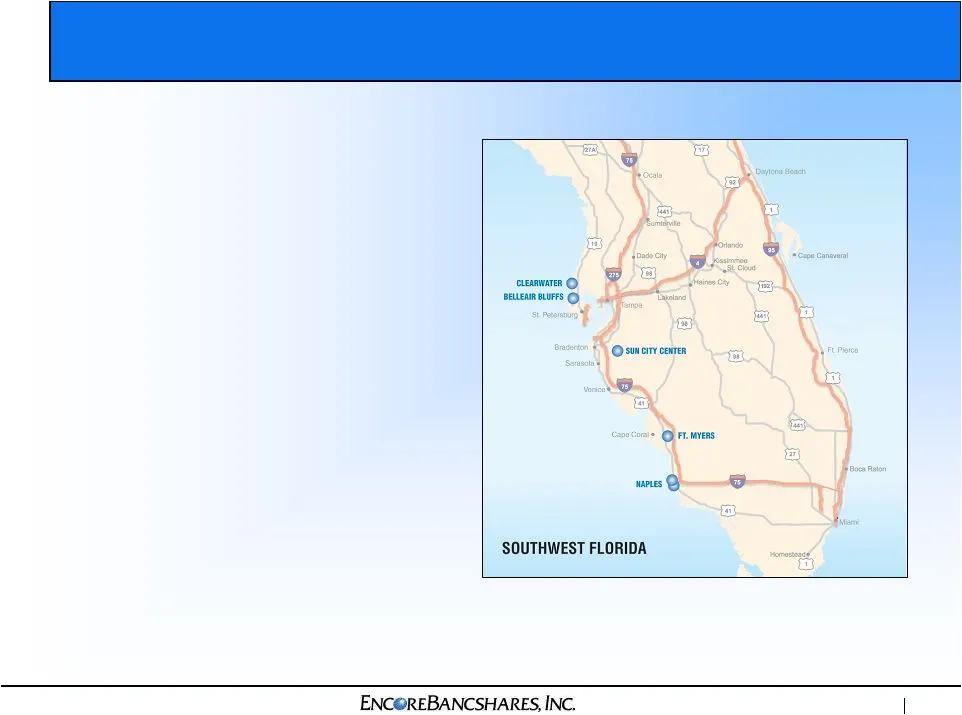
Slide 8: Southwest Florida Market
Southwest Florida Market 6 private client offices in high income zip codes 3.6 million people $77 billion in deposits Naples-Marco Island MSA – one of nation’s wealthiest
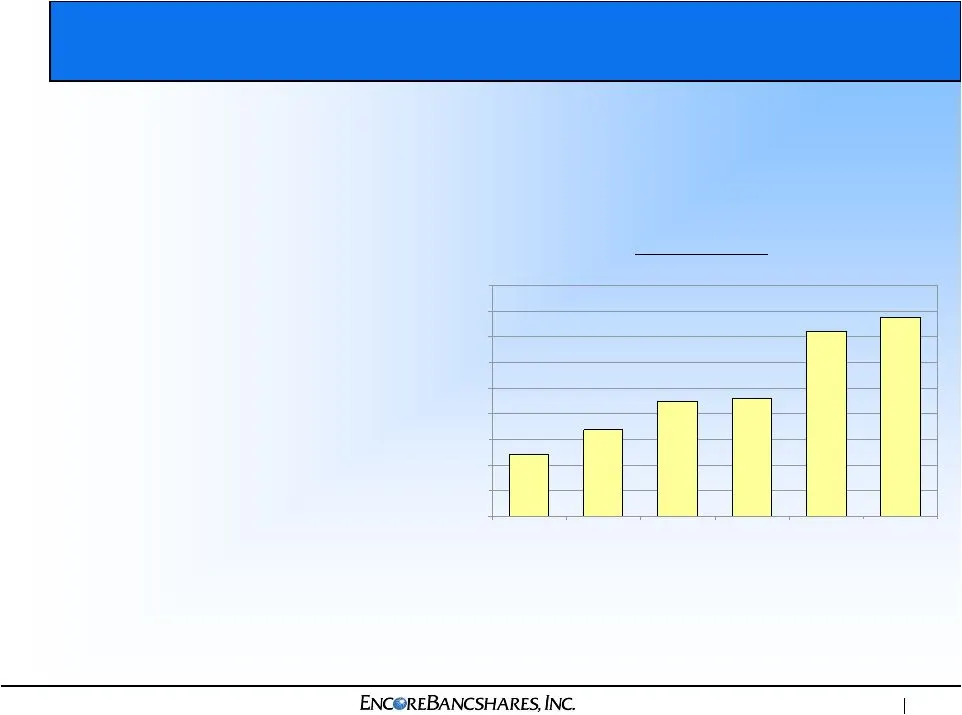
Slide 9: Core Earnings Growth
Core Earnings Growth $7.8 $2.4 $3.4 $4.5 $4.6 $7.2 $0 $1 $2 $3 $4 $5 $6 $7 $8 $9 $ in millions Core Earnings (1) Continue Deposit Growth – Grow demand deposits – Lower cost of funds Continue Loan Growth – Grow originated loans – Replace purchased loans – Maintain asset quality Expand Wealth Manageme
Slide 10: Continue Deposit Growth
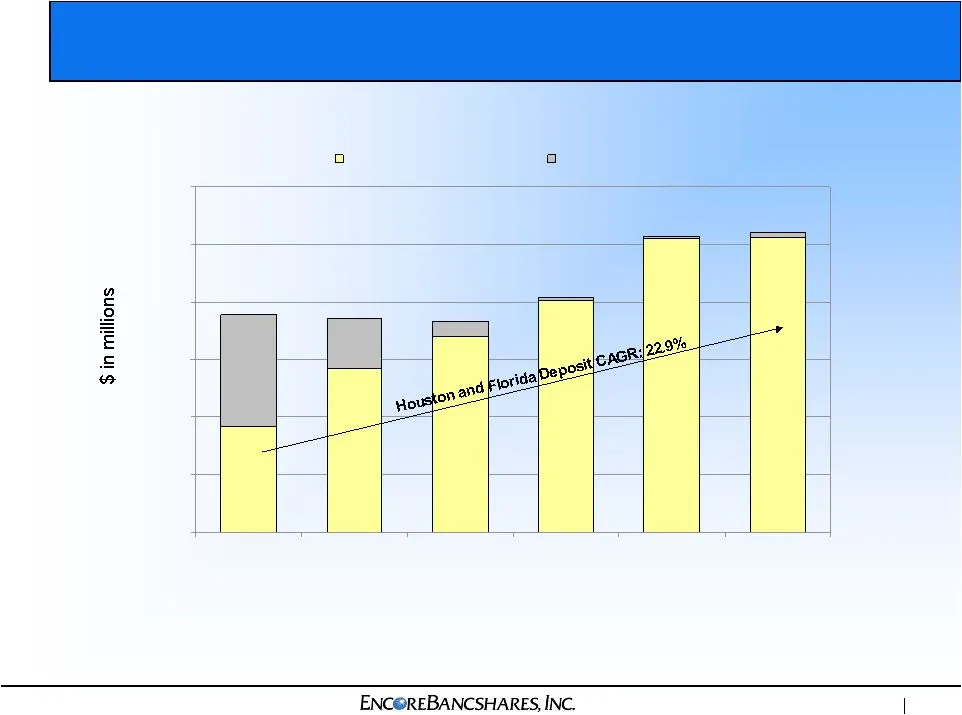
Continue Deposit Growth $1,027 $1,022 $806 $679 $567 $366 $0 $200 $400 $600 $800 $1,000 $1,200 Houston & Florida deposits Other deposits $755 $743 $729 $815 $1,031 $1,041
Slide 11: Optimize Deposit Mix
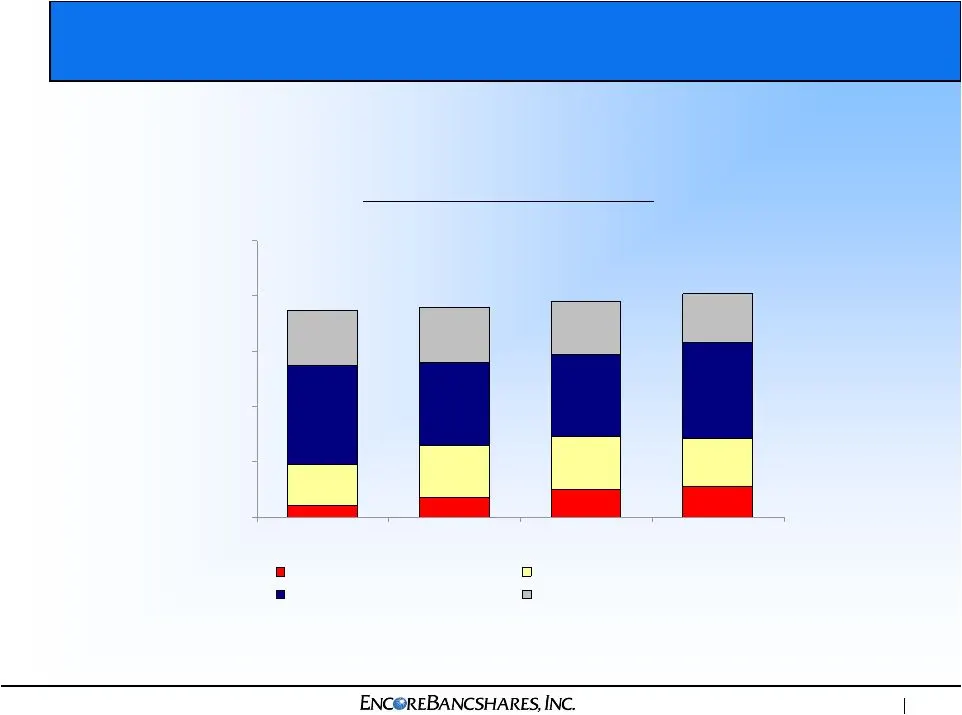
Optimize Deposit Mix 0% 20% 40% 60% 80% 100% Noninterest-bearing deposits Interest checking Money market and savings Time deposits less than $100,000 74.1% 76.8% 78.4% 79.7% Focus on Core Deposit Balances (1) (1) Represents the average balance for the period ended
Slide 12: Continue Originated Loan Growth
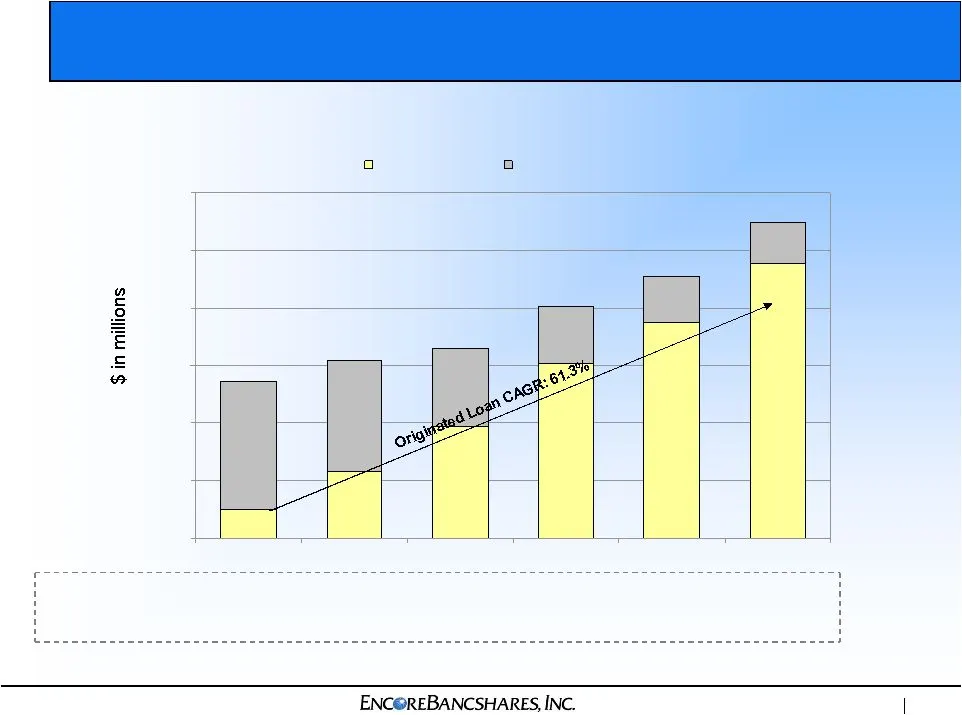
Continue Originated Loan Growth $954 $100 $231 $389 $607 $752 $0 $200 $400 $600 $800 $1,000 $1,200 Originated loans Purchased loans $546 $618 $661 $808 $908 Originated Loans to Total Loans 18.4% 37.5% 58.8% 75.1% 82.8% 87.0% $1,097
Slide 13: Improving Loan Mix
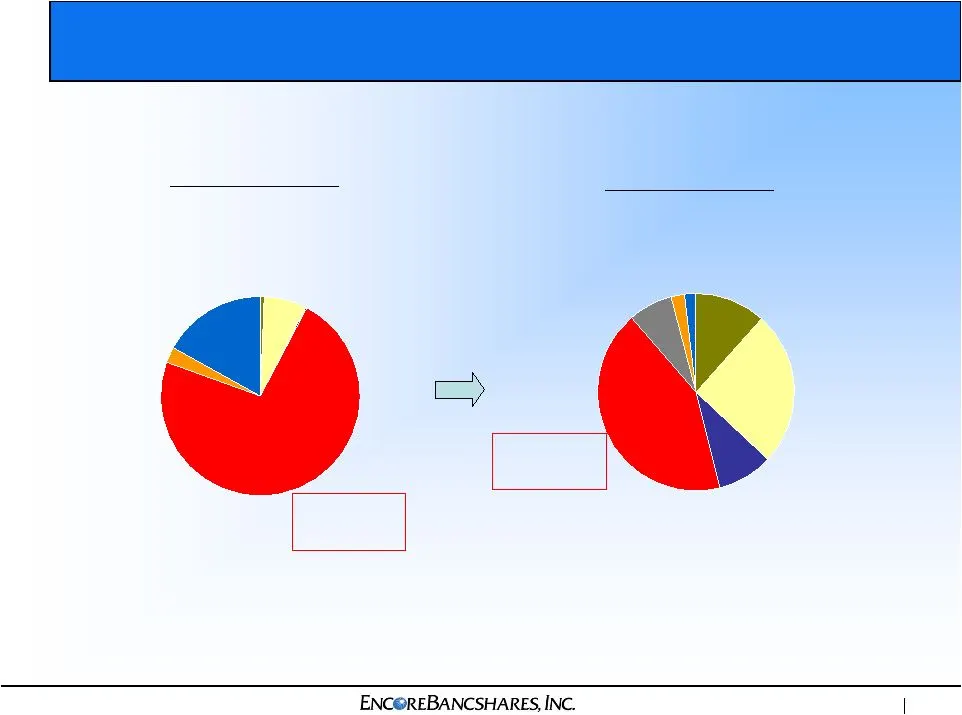
Improving Loan Mix Consumer other 17.0% Commercial real estate 7.0% Real estate construction 0.4% Commercial 0.4% Consumer installment-indirect 2.6% Residential real estate 72.6% Home equity lines 7.2% Consumer other 1.9% Commercial 11.6% Consumer installment--indirect 2.3% Commercial real estate 25
Slide 14: Asset Quality
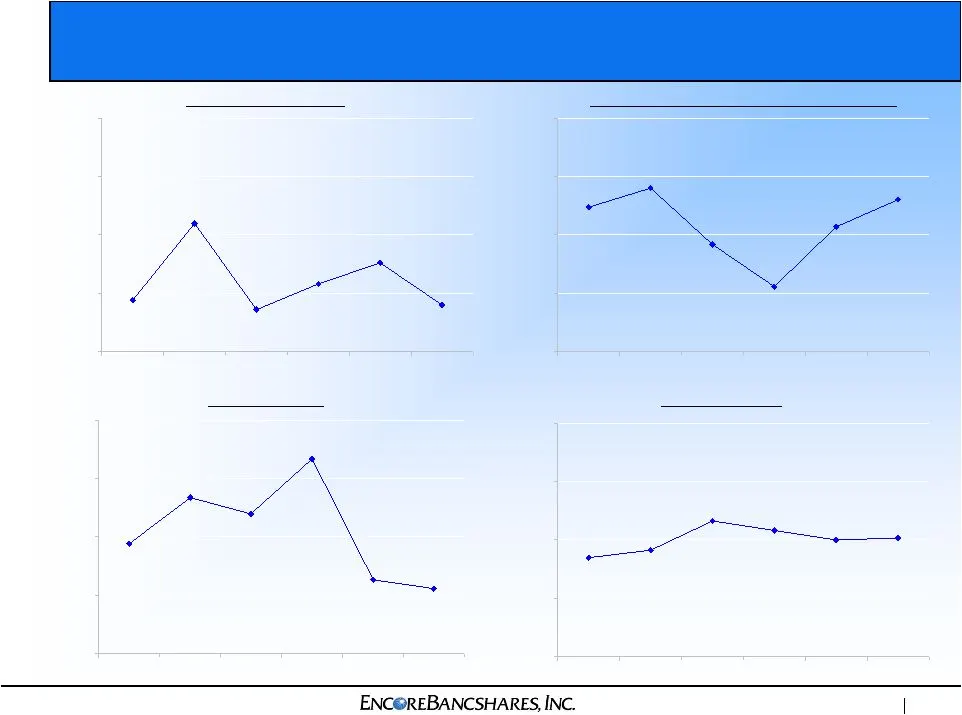
Asset Quality 0.38% 0.20% 0.29% 0.55% 0.22% 0.18% 0.00% 0.25% 0.50% 0.75% 1.00% NCOs / Average Loans 1.30% 1.07% 0.56% 1.40% 1.24% 0.92% 0.00% 0.50% 1.00% 1.50% 2.00% NPAs / Loans and Investment in Real Estate 83.4% 95.3% 250.3% 200.6% 141.4% 179.8% 0.0% 75.0% 150.0% 225.0% 300.0% Reserves / NPLs 1.
Slide 15: Residential Loan Quality
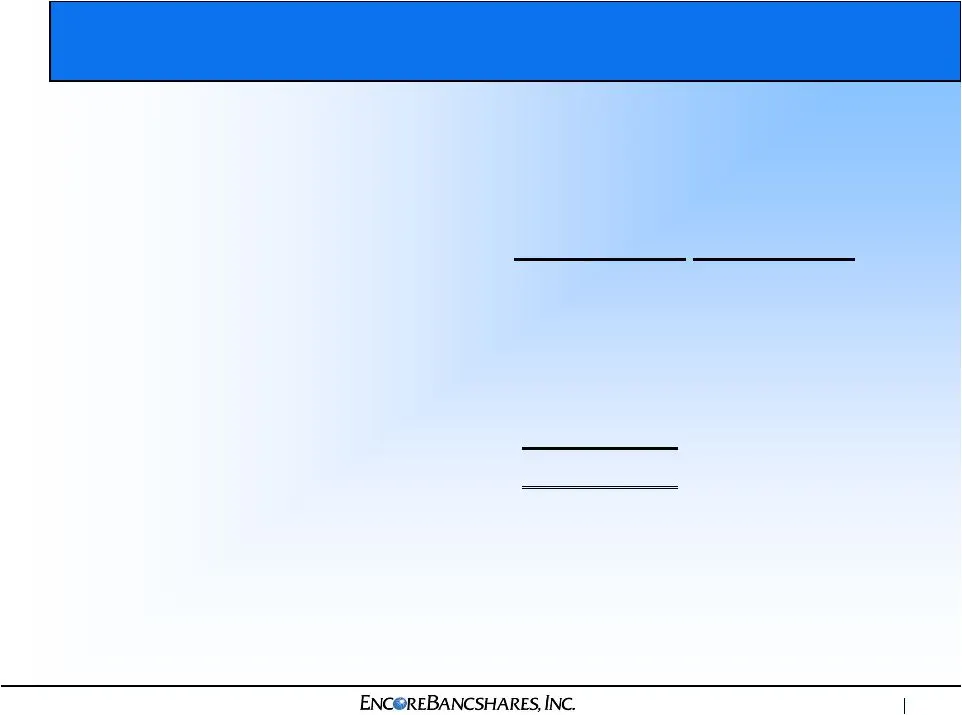
Residential Loan Quality Subprime loans, defined as FICO less than 620 at origination, amounted to $15.5 million Residential Loans by Category December 31, 2007 ($ in thousands) Delinquent Amount 30+ Days First mortgage originated 158,353 $ 1.1% Second mortgage originated 165,309 0.1% First mortgage
Slide 16: Expand Net Interest Margin
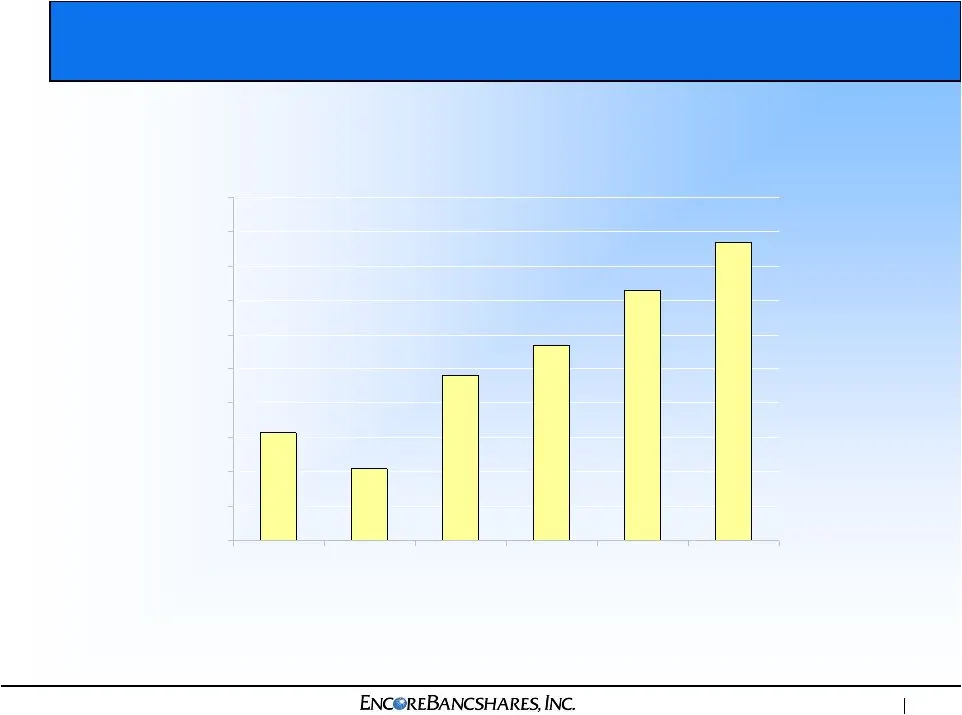
Expand Net Interest Margin 1.63% 1.42% 1.96% 2.14% 2.46% 2.74% 1.00% 1.20% 1.40% 1.60% 1.80% 2.00% 2.20% 2.40% 2.60% 2.80% 3.00%
Slide 17: Leverage Infrastructure
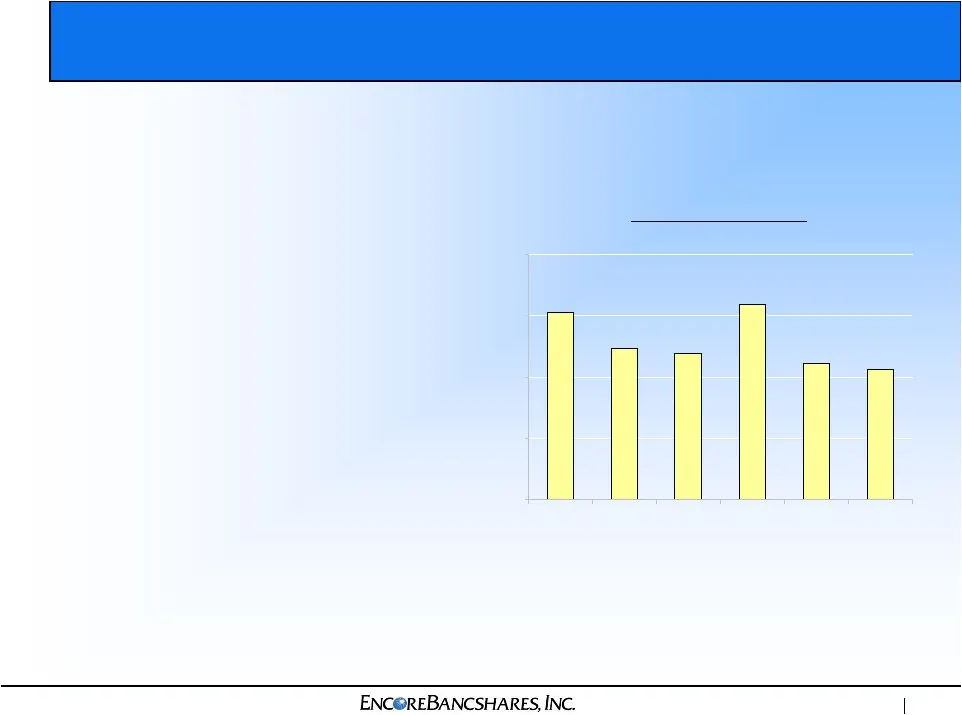
Leverage Infrastructure Infrastructure in place Eight private client offices opened in the last three and a half years Increase deposits per office Increase loans per officer 80.27% 77.32% 76.93% 80.95% 76.11% 75.59% 65.00% 70.00% 75.00% 80.00% 85.00% Core Efficiency Ratio ( 1) (1) Calculated by div
Slide 18: Expand Wealth Management Business
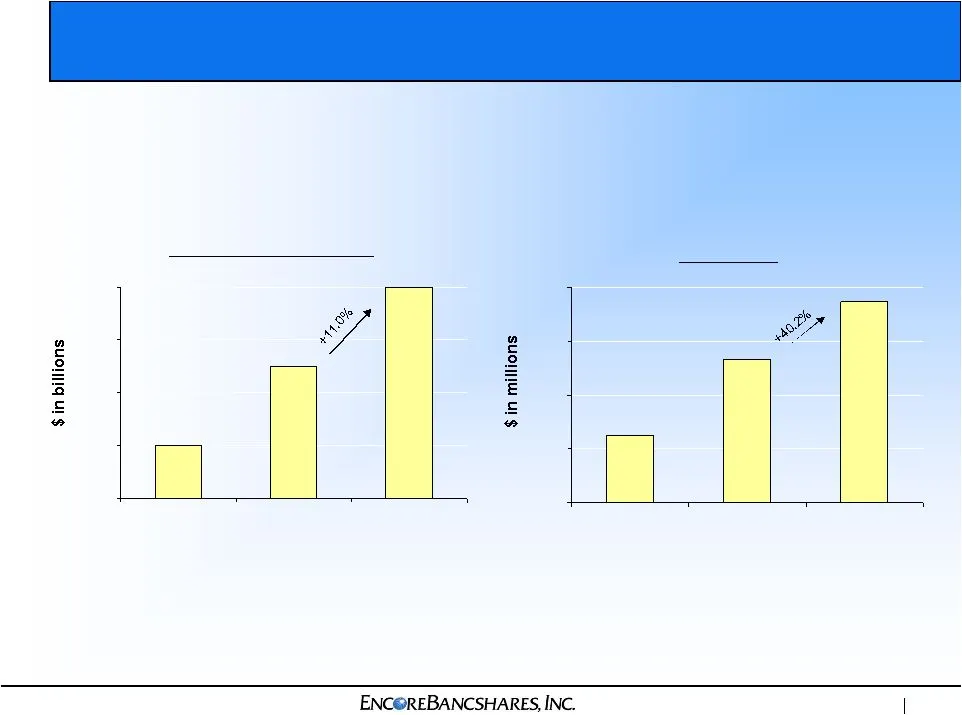
Expand Wealth Management Business $1.2 $2.7 $3.7 $0.0 $1.0 $2.0 $3.0 $4.0 Net Earnings $2.2 $2.5 $2.8 $2.0 $2.2 $2.4 $2.6 $2.8 Assets Under Management Our Wealth Management business contributed 27% of our total revenue (1) for the year ended December 31, 2007 (1) Defined as net interest income plus
Slide 19: Expand Wealth Management Business
Expand Wealth Management Business We believe L&W is one of the largest and most respected investment management and financial planning firms in Texas serving affluent and high net worth families Provides fee-based personal financial planning services and investment management services for a fee base

Slide 20: Expand Wealth Management Business
Expand Wealth Management Business Existing infrastructure can support a higher level of AUM Capitalize on L&W reputation in Texas professional community to enhance Encore Trust’s marketing Add marketing initiative for L&W to support additional sources of client referrals and promote cross-selling by
Slide 21: Attractive Insurance Business
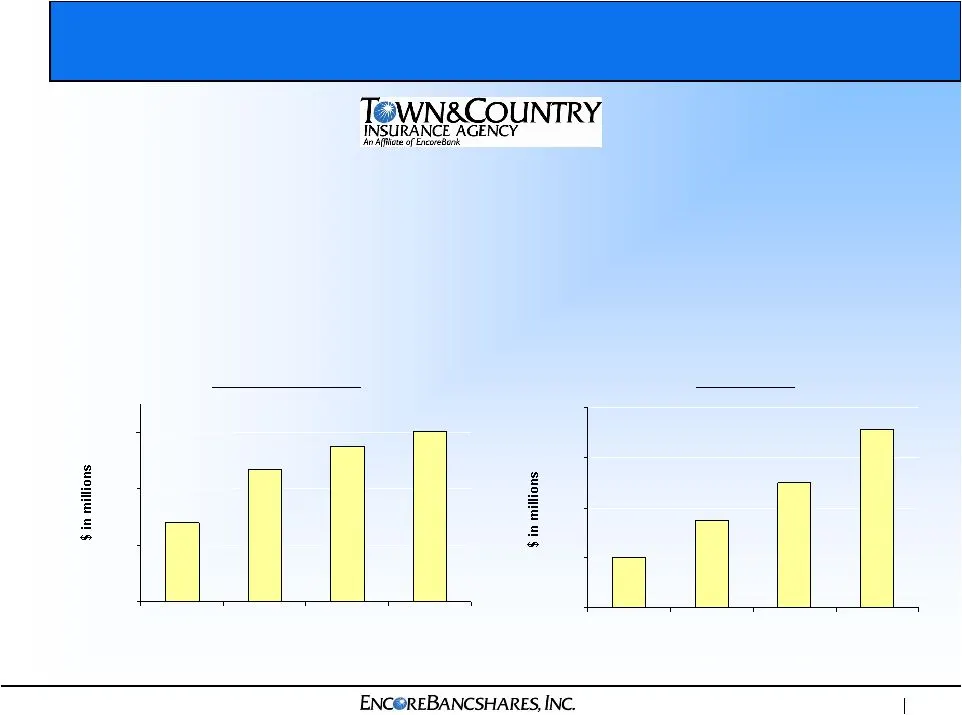
Attractive Insurance Business $2.8 $4.7 $6.0 $5.5 $0.0 $2.0 $4.0 $6.0 Noninterest Income $0.4 $0.7 $1.0 $1.4 $0.0 $0.4 $0.8 $1.2 $1.6 Net Earnings (1) Defined as net interest income plus noninterest income Town & Country Insurance Agency offers a wide variety of personal and commercial property and

Slide 22: Experienced Executive Management Team
Experienced Executive Management Team Average of 29 years of relevant experience Jim D’Agostino, 61, American General and Citibank (5.3% ownership (1) ) Andy Creel, 60, Prime Bancshares (0.4% ownership (1) ) Harold Williams, 55, Linscomb & Williams (1.3% ownership (1) ) (1) Beneficial ownership as o

Slide 23: Capable Board of Directors
Capable Board of Directors All original investors No turnover Added Walter Christopherson and Randa Duncan Williams Backgrounds in investments, private equity, banking, real estate and law Total insider ownership of 28.2% (1) (1) Beneficial ownership after offering; Directors and executive officers

Slide 24: Fourth Quarter 2007 Earnings
Fourth Quarter 2007 Earnings Net earnings grew 46% over fourth quarter of 2006 Net interest margin improved 46 basis points over fourth quarter of 2006 Loans increased 21% compared with the fourth quarter of 2006 Wealth Management earnings grew 60%, with a 11% increase in assets under management com
Slide 25: Summary
Summary Well positioned in Houston Optimizing deposit mix Increasing originated loans Improving net interest margin Expanding wealth management and insurance Leveraging infrastructure Proven acquirer and integrator Experienced banking team, management and board

Slide 26: Encore Bancshares, Inc.
ENC@REBANCSHARES, INC.
Source: SEC EDGAR · 8-K filed Feb 21, 2008
More decks from Encore Bancshares Inc
 Gulf South Bank Conference 201127 slides · May 10, 2011
 Investor Presentation (March 2011)24 slides · Mar 3, 2011
 KBW Texas Field Trip (February 2011)24 slides · Feb 8, 2011
 Macquarie Small & Mid Cap Conference 201021 slides · Jun 16, 2010
 Gulf South Bank Conference (May 2010)21 slides · May 5, 2010
 KBW Texas Field Trip (February 2010)26 slides · Feb 9, 2010