Encore Bancshares — Macquarie Small & Mid Cap Conference 2010
21 slides from Encore Bancshares's conference presentation, Jun 16, 2010

Slide 1: Encore Bancshares, Inc. Macquarie Small & Mid Cap Conference
Encore Bancshares, Inc. Macquarie Small & Mid Cap Conference June 16, 2010 Exhibit 99.1 Encore Bancshares, Inc. Macquarie Small & Mid Cap Conference June 16, 2010

Slide 2: Forward-Looking Statements
Forward-Looking Statements Forward-Looking Statements • This presentation may include forward-looking statements. These forward-looking statements include comments with respect to assumptions relating to projected growth, earnings, earnings per share, capital levels and ratios and other financial pe

Slide 3: Encore Profile
Encore Profile Company Type: Financial Holding Company and Wealth Management Headquarters: Houston, Texas Total Assets: $1.6 billion Total Loans: $1.1 billion Total Deposits: $1.2 billion Total Equity: $190 million Tier 1 Risk-Based Capital: 15.56% Assets Under Management: $2.8 billion Private Clien

Slide 4: Florida Transactions - Strategy
Florida Transactions - Strategy • Florida expected to recover slowly • Houston participating in recovery now • Redeploy capital to Houston franchise • Improves operating metrics • Improves net interest margin Florida Transactions - Strategy

Slide 5: Florida Transactions
Florida Transactions • Sell approximately $242.8 million of deposits - $58.9 million to HomeBanc - $183.9 million to Ovation • Sell approximately $80.0 million of loans to Ovation • Sell 6 offices and $3.0 million of fixed assets • 1Q 10 write down of $4.3 million • Net loss approximately $1.0 milli

Slide 6: Florida Transactions - Status
Florida Transactions - Status • HomeBanc closed May 28th • Ovation regulatory applications filed • Ovation expected to close before end of 3Q 10 Florida Transactions - Status

Slide 7: Florida Legacy Portfolio
Florida Legacy Portfolio Florida Legacy Portfolio Amount % of Loans NPL Commercial Real Estate Retail $ 11.2 1.1% $ 4.7 Office Building 21.9 2.3% 4.6 Industrial & Warehouse 7.9 0.8% 0.7 Other 10.2 1.0% 6.7 Construction and Land Land 16.4 1.7% 8.6 Multi-Family 2.8 0.3% 0.2 C & I 2.7 0.3% 0.2 Total $
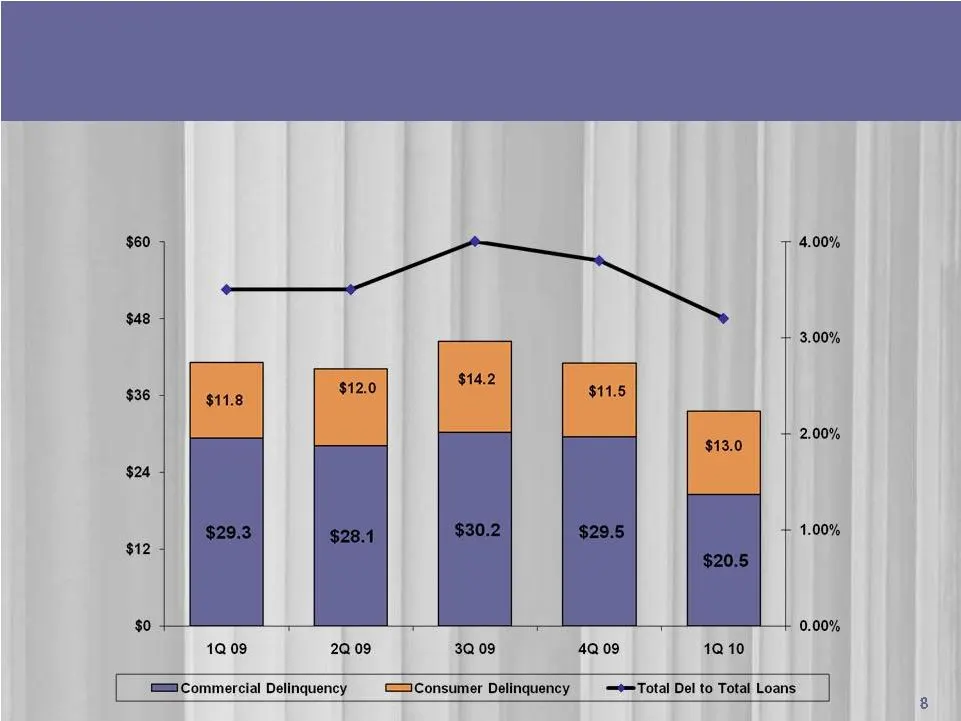
Slide 8: 30+ Day Delinquency
30+ Day Delinquency 30+ Day Delinquency $ in millions Total Delinquency to Total Loans
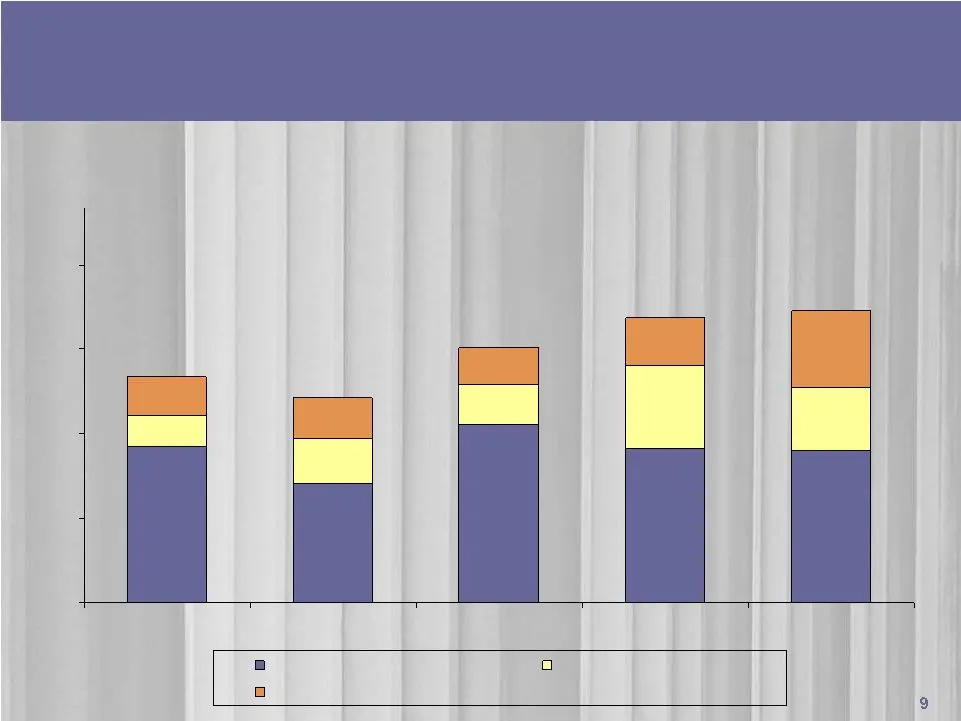
Slide 9: Nonperforming Assets
Nonperforming Assets Nonperforming Assets $ in millions $27.8 $21.2 $31.7 $27.4 $27.0 $5.5 $8.0 $7.0 $14.6 $11.1 $6.9 $7.3 $6.6 $8.5 $13.7 $0 $15 $30 $45 $60 1Q 09 2Q 09 3Q 09 4Q 09 1Q 10 Commercial Nonaccruals Investment in real estate Consumer Nonaccruals

Slide 10: Capital Ratios
Capital Ratios Capital Ratios * Excludes Florida held for sale assets. Actual Pro Forma * TCE/Tangible Assets 7.52% 9.01% Leverage Ratio 10.73% 12.82% Tier 1 RBC 15.56% 16.92% Tier 1 Common RBC 11.05% 12.07% Allowance for Loan Losses 2.56% March 31, 2010

Slide 11: Encore Approach to Capital
Encore Approach to Capital Encore Approach to Capital • Maintain and incrementally improve capital ratios • Florida transaction effectively raises capital • Reduce tan g ible assets (weak loan demand and Florida transactions) • Repayment of TARP • No current plans to repay • Shareholder–friendly app
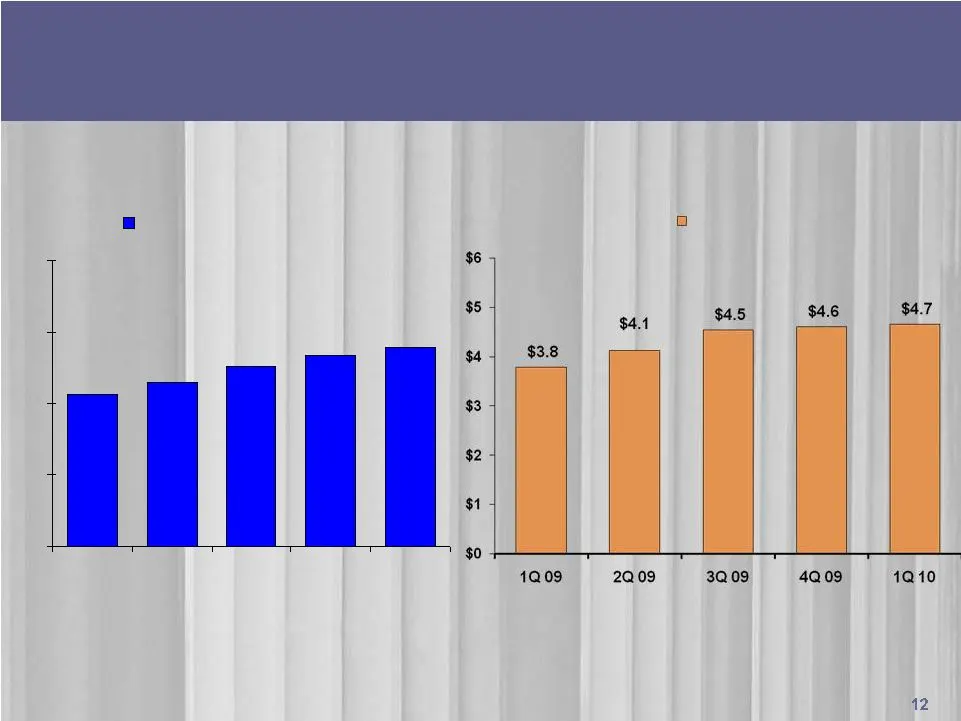
Slide 12: Wealth Management
Wealth Management Wealth Management $2.1 $2.5 $2.7 $2.8 $2.3 $0 $1 $2 $3 $4 1Q 09 2Q 09 3Q 09 4Q 09 1Q 10 Assets Under Management AUM $ in Billions REV $ in Millions Revenues

Slide 13: Houston Market
Houston Market • 4th lar g est city; 6th largest MSA • Job g rowth in January, February, March and April 2010 • Unemployment rate of 8.5% vs. 9.7% for U.S. • Population g rowth of 140,784 or 2.45% • Second lar g est U.S. port based on tonna g e • TX entered recession a year later; exitin g at the sa

Slide 14: Houston Deposit Market Share
Houston Deposit Market Share Houston Deposit Market Share # of Branches $ Millions Market Share % Market Share % 1 JP Mor g an Chase (NY) 38,234 33.40% 35.50% 2 Wells Far g o (CA) 14,176 12.38% 12.43% 3 Bank of America (NC) 10,842 9.47% 9.14% 4 Zions (Ame g y) (UT) 7,878 6.88% 6.04% 5 BBVA (Spain) 7

Slide 15: Commercial Banking Initiative
Commercial Banking Initiative Commercial Banking Initiative • Take advantage of market opportunities • Attract experienced commercial and private bankers • Levera g e local decision makin g and local contacts • Expand mar g in and diversify portfolio
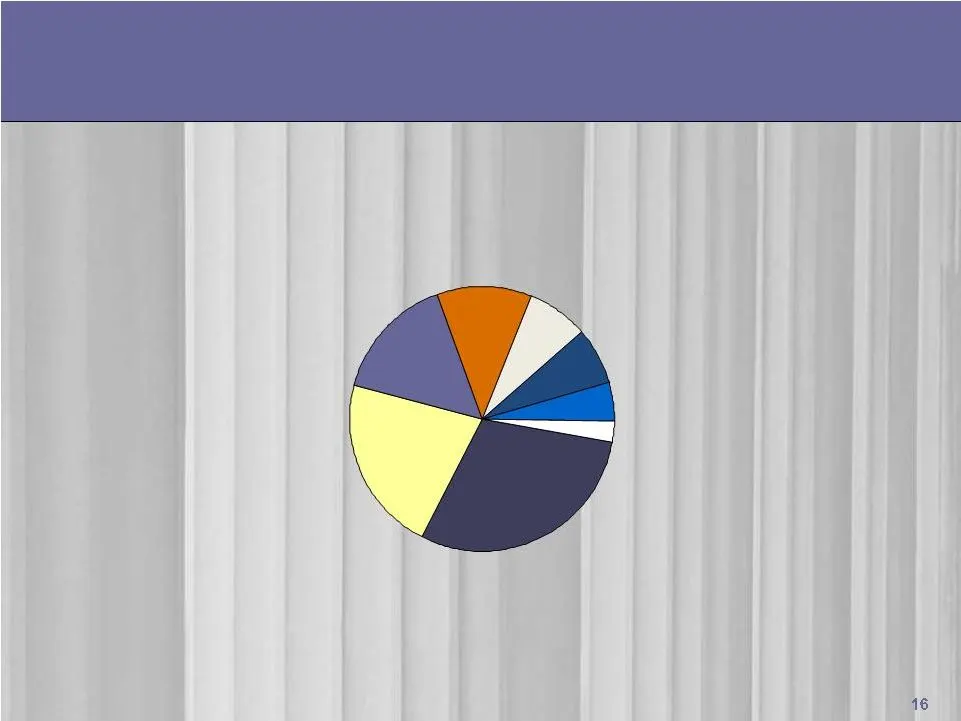
Slide 16: Loan Portfolio (pro forma)
Loan Portfolio (pro forma)* Consumer 2.4% Real estate construction 4.8% Home equity lines 7.1% FL legacy 7.5% Commercial 11.6% Commercial real estate 15.2% Residential 1st lien 21.7% Residential 2nd lien 29.7% * Excludes Florida Held - for - Sale of $80.0 million Total Loans: $974.3 million March 31
Slide 17: Deposits (pro forma)
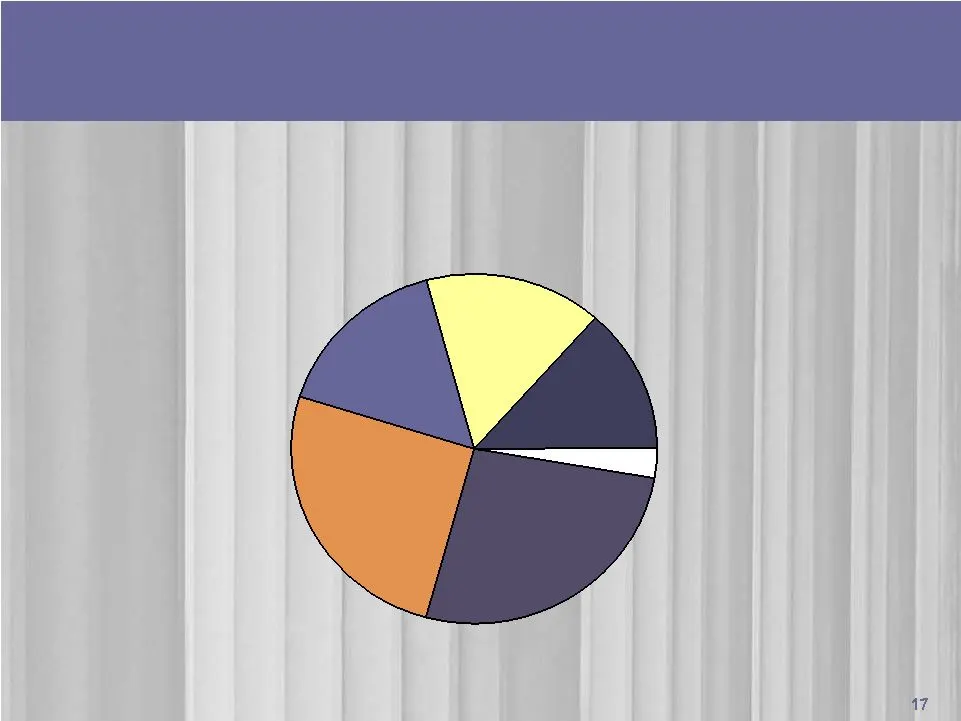
Deposits (pro forma)* Brokered deposits 2.7% CDs under $100,000 13.6% Money market and savings 25.5% Interest checking 16.3% Noninterest- bearing deposits 15.6% CDs over $100,000 26.3% * Excludes Florida Held for Sale Total Average Deposits: $940.5 million First quarter 2010

Slide 18: Expenses (pro forma)
Expenses (pro forma) Expenses (pro forma) $ in thousands * Excludes write down of Held for Sale Assets of $2.5 million Q1 2010 Actual Florida Pro Forma Compensation $ 8,551 $ 571 $ 7,980 Occupancy $ 1,478 $ 261 $ 1,217 FDIC $ 655 $ 127 $ 528 Other $ 5,045 $ 330 $ 4,715 Total $ 15,729 $ 1,289 $ 14,44
Slide 19: Net Interest Margin
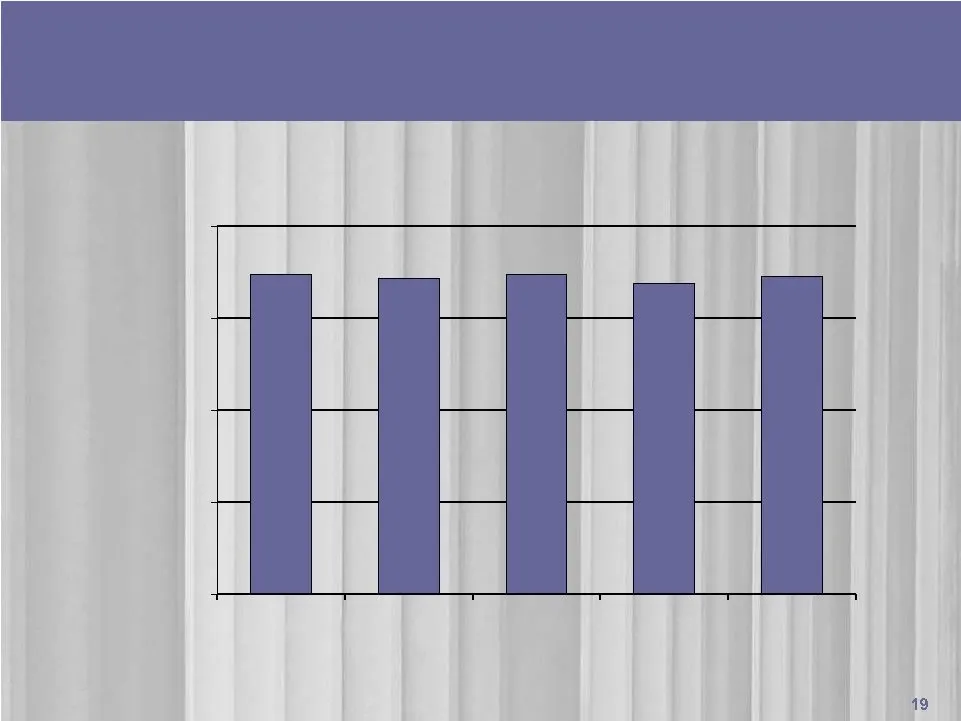
Net Interest Margin* Net Interest Margin* * Tax Equivalent 3.09% 3.13% 3.04% 3.11% 3.13% 0.00% 0.90% 1.80% 2.70% 3.60% 1Q 09 2Q 09 3Q 09 4Q 09 1Q 10

Slide 20: Investment Considerations
Investment Considerations Investment Considerations • Low market valuation relative to peers • Strong capital position • Significant revenue from wealth management and insurance • Growing franchise in Houston • Capacity for margin improvement • Commercial banking initiative

Slide 21: Non-GAAP Financial Measures
Non-GAAP Financial Measures Non-GAAP Financial Measures $ in Thousands March 31, 2010 Shareholders' equity (GAAP) 190,210 $ Less: Preferred stock 29,107 Goodwill and other intangible assets, net 40,991 Tangible common equity (1) 120,112 $ Total assets (GAAP) 1,637,916 $ Less: Goodwill and other inta
Source: SEC EDGAR · 8-K filed Jun 16, 2010
More decks from Encore Bancshares Inc
 Gulf South Bank Conference 201127 slides · May 10, 2011
 Investor Presentation (March 2011)24 slides · Mar 3, 2011
 KBW Texas Field Trip (February 2011)24 slides · Feb 8, 2011
 Gulf South Bank Conference (May 2010)21 slides · May 5, 2010
 KBW Texas Field Trip (February 2010)26 slides · Feb 9, 2010
 Investor Presentation (November 2009)25 slides · Nov 4, 2009