Encore Bancshares — KBW Texas Field Trip (February 2011)
24 slides from Encore Bancshares's conference presentation, Feb 8, 2011

Slide 1: EBTX Investor Presentation - KBW Texas Field Trip
EBTX Investor Presentation February 8, 2011 KBW Texas Field Trip Exhibit 99.1
Slide 2: Forward-Looking Statements
Forward-Looking Statements This presentation may include forward-looking statements. These forward-looking statements include comments with respect to assumptions relating to projected growth, earnings, earnings per share, capital levels and ratios and other financial performance measures, as well a
Slide 3: Encore Profile
Encore Profile Businesses: Community Bank, Wealth Management and Insurance Headquarters: Houston, Texas Total Assets: $1.5 billion Total Loans: $0.9 billion Total Deposits: $1.1 billion Assets Under Management: $2.9 billion Total Equity: $168 million Tier 1 Risk-Based Capital: 15.06% Private Client
Slide 4: Current Position
Current Position • Florida exit completed • Improving asset quality • Building Houston franchise • Growing fee based businesses • Solid capital • Improving net interest margin
Slide 5: Florida Exit Completed
Florida Exit Completed • Ovation transaction - December 31, 2010 • $180.8 million of deposits • $61.5 million of loans • 4 branches • On October 29, sold $25.3 million in loans, including $19.8 million in non-performing loans
Slide 6: Non-performing Assets - Florida
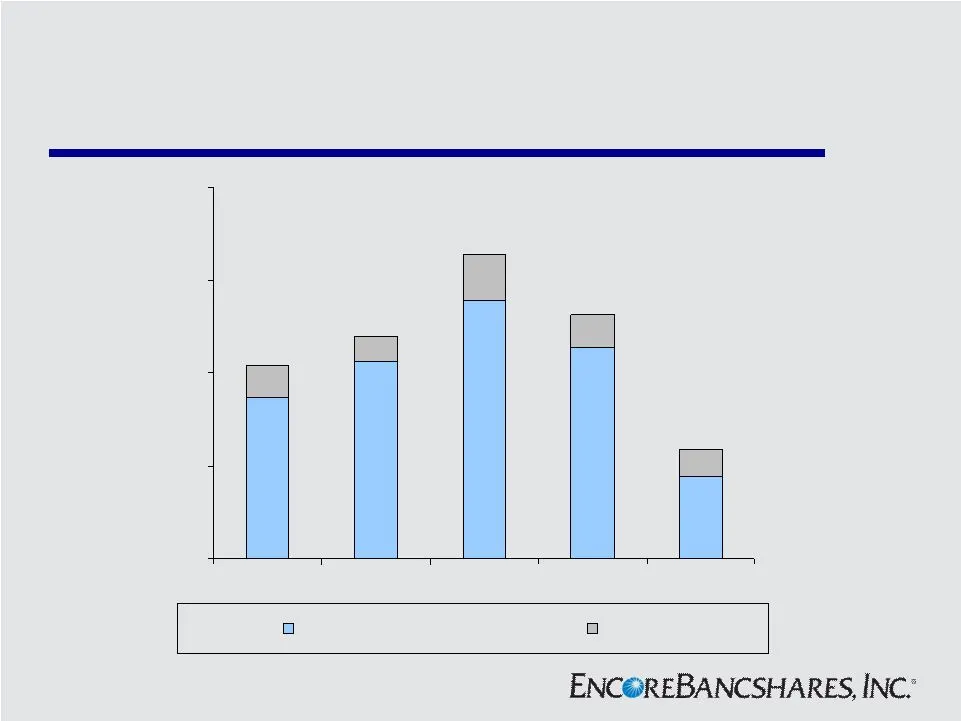
Non-performing Assets - Florida 5.1 4.1 7.4 5.1 4.5 13.2 41.8 34.2 31.9 26.1 $0 $15 $30 $45 $60 4Q 09 1Q 10 2Q 10 3Q 10 4Q 10 FL Loans FL REO Total $31.2 Total $36.0 Total $49.2 Total $39.3 Total $17.7 $ in millions
Slide 7: Non-performing Assets - Texas
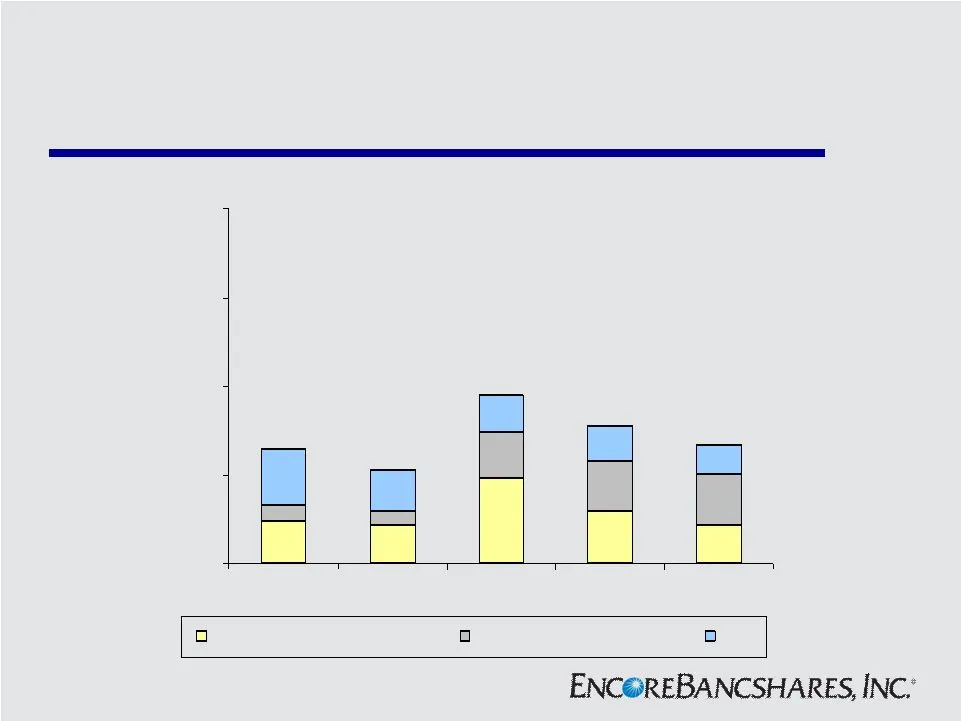
Non-performing Assets - Texas 8.9 2.4 7.9 8.5 8.7 14.5 6.4 7.2 6.5 2.7 4.8 5.8 6.2 7.0 9.5 $0 $15 $30 $45 $60 4Q 09 1Q 10 2Q 10 3Q 10 4Q 10 Commercial Nonaccruals Consumer Nonaccruals REO Total $19.4 Total $15.8 Total $28.6 Total $23.2 Total $20.0 $ in millions
Slide 8: Building Houston Franchise
Building Houston Franchise • Take advantage of market disruptions • Utilize strong team of experienced commercial and private bankers • Leverage local decision making and local contacts • Continue to grow DDA deposits and commercial loan portfolio
Slide 9: Houston Market
Houston Market • th largest city; 6 th largest MSA • Unemployment rate of 8.3% vs. 9.4% for U.S.* • Population growth ranked 2 nd in the nation between 2000 and 2009 • Second largest U.S. port based on tonnage • Texas entered recession a year later; exiting at the same time *Houston MSA rate is not
Slide 10: Houston Deposit Market Share
Houston Deposit Market Share # of Branches $ in Millions Market Share % JP Morgan Chase (NY) 41,181 $ 30.01% Wells Fargo (CA) 14,798 10.78% Bank of America (NC) 9,755 7.11% Zions (Amegy) (UT) 8,577 6.25% BBVA (Spain) 7,831 5.71% Comerica * 4,658 3.39% Prosperity 3,039 2.21% Capital One (VA) 2,365 1.
Slide 11: Houston Market
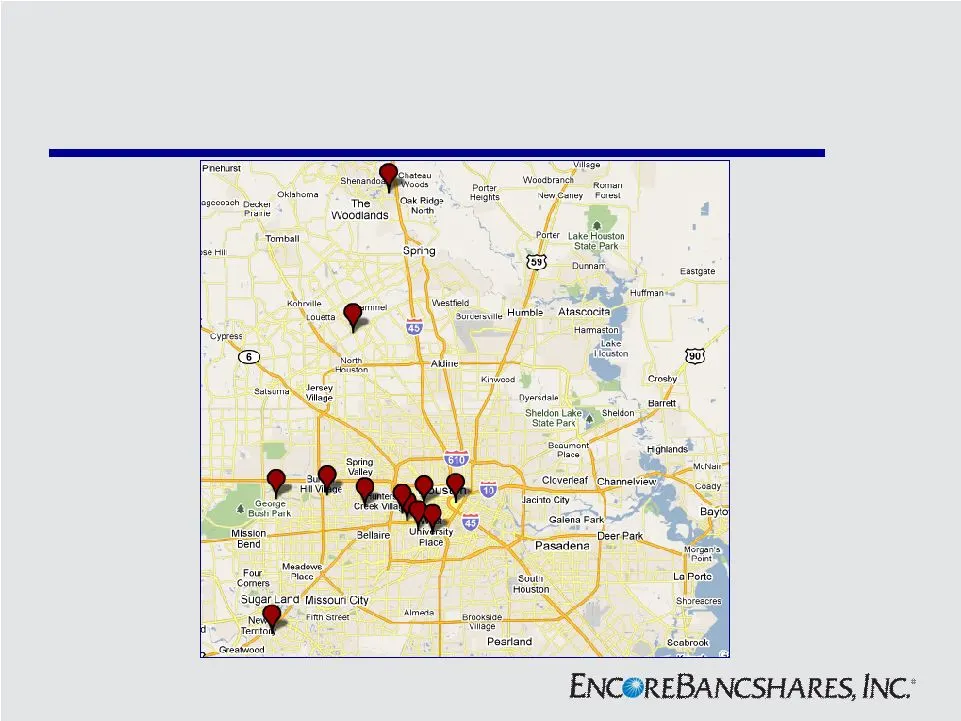
Houston Market Includes additional private client office expected to be opened Q2 2011.
Slide 12: Houston Loans
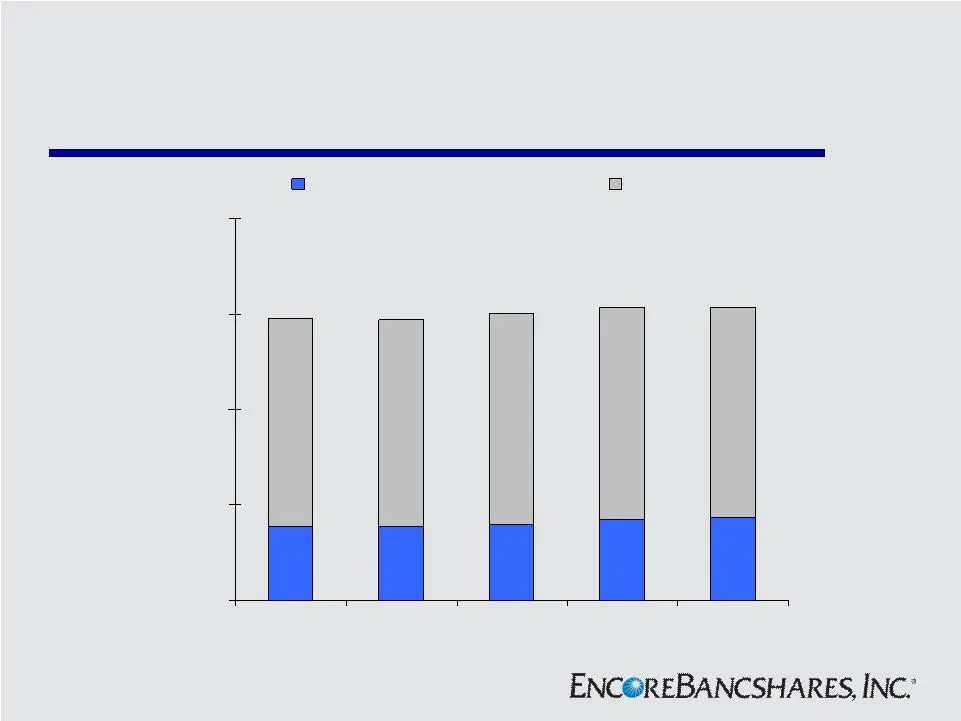
Houston Loans $335 $320 $308 $308 $345 $882 $892 $886 $868 $873 $0 $400 $800 $1,200 $1,600 4Q 09 1Q 10 2Q 10 3Q 10 4Q 10 Commercial Loans Total Loans $ in millions
Slide 13: Loan Portfolio
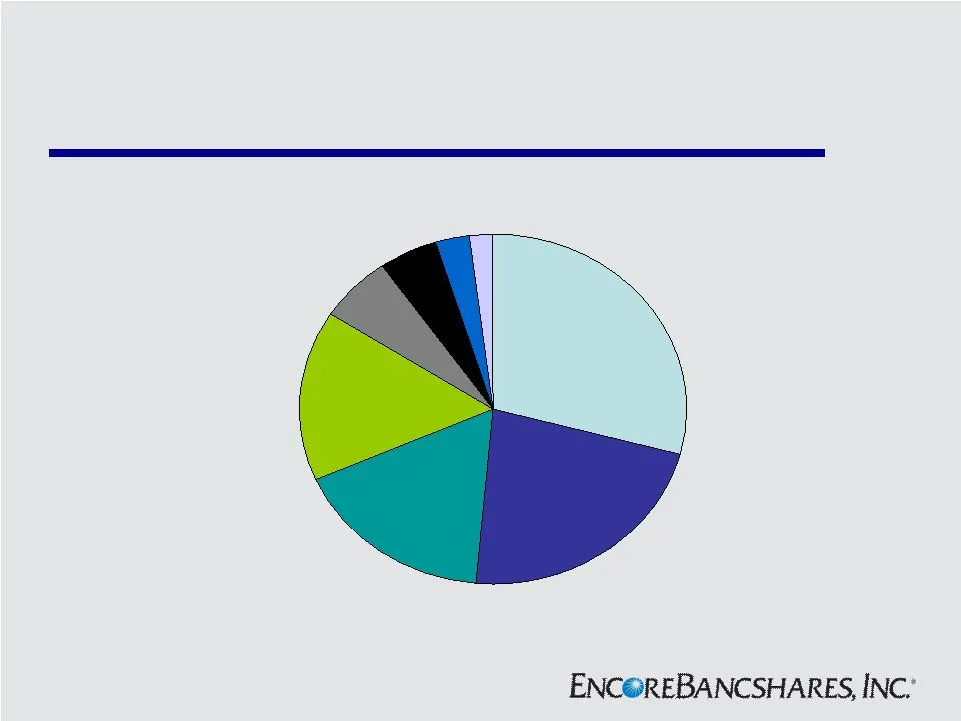
Loan Portfolio * Residential 1st lien 22.3% Commercial 15.7% Residential 2nd lien 29.2% Commercial real estate 16.8% FL Retain 2.1% Consumer 2.7% Construction 4.9% Home equity lines 6.3% *As of December 31, 2010 Excludes held-for-sale of $12.8 million.
Slide 14: Residential Loan Portfolio
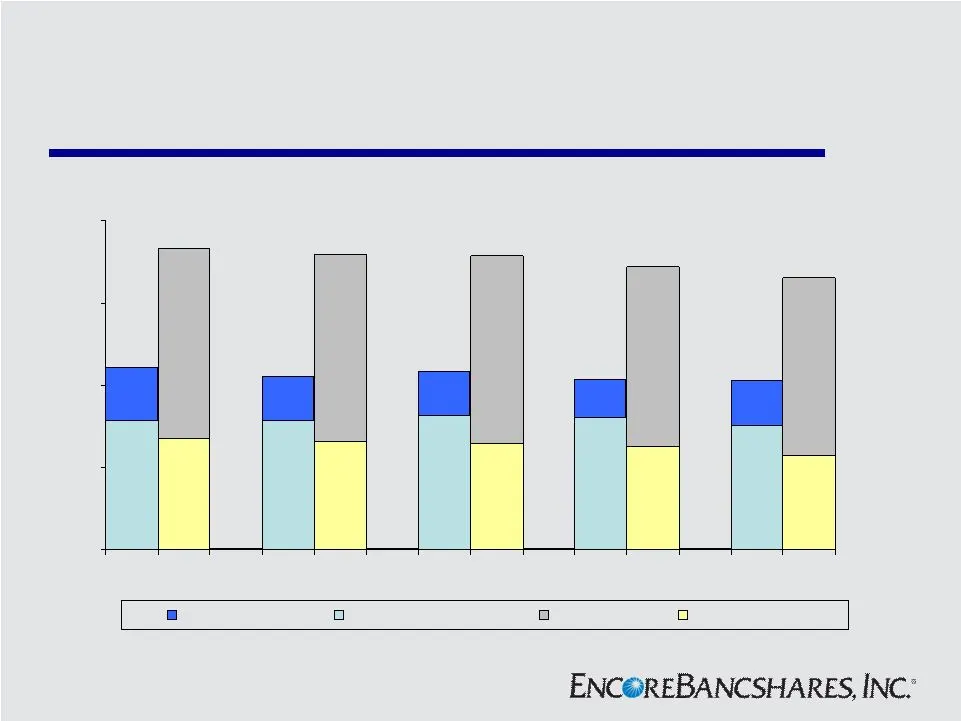
Residential Loan Portfolio $0 $100 $200 $300 $400 4Q 09 1Q 10 2Q 10 3Q 10 4Q 10 1st SBO 1st Mortgage PMT HELOC/Others $222 $366 $211 $358 $216 $357 $207 $344 $206 $330 $ in millions
Slide 15: Residential Loan Delinquency
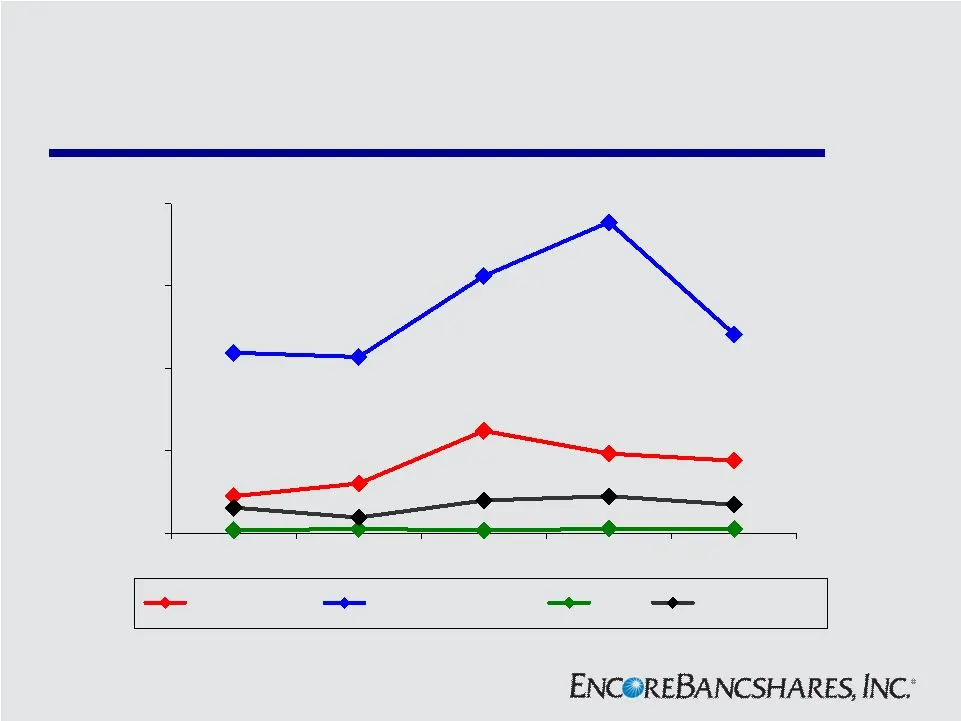
Residential Loan Delinquency 0% 4% 8% 12% 16% 4Q 09 1Q 10 2Q 10 3Q 10 4Q 10 1st Mortgage 1st Mortgage SBO PMT HELOC/Others
Slide 16: Houston Deposits
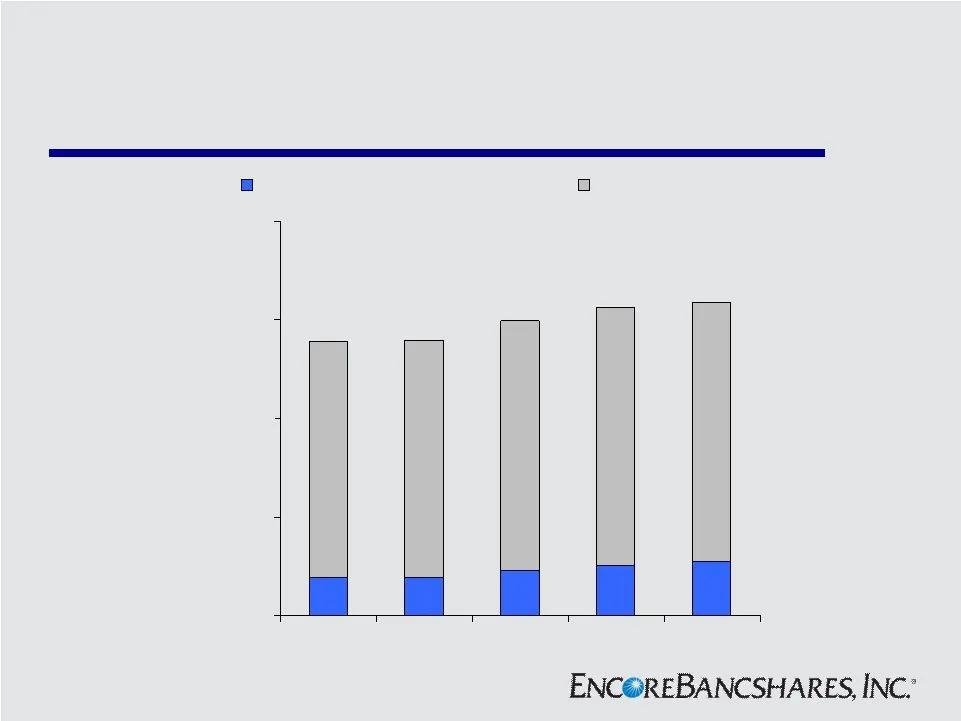
Houston Deposits $ in millions $183 $220 $206 $155 $156 $955 $959 $1,016 $1,044 $1,050 $0 $400 $800 $1,200 $1,600 4Q 09 1Q 10 2Q 10 3Q 10 4Q 10 Noninterest-bearing Deposits Total Deposits
Slide 17: Deposit Mix
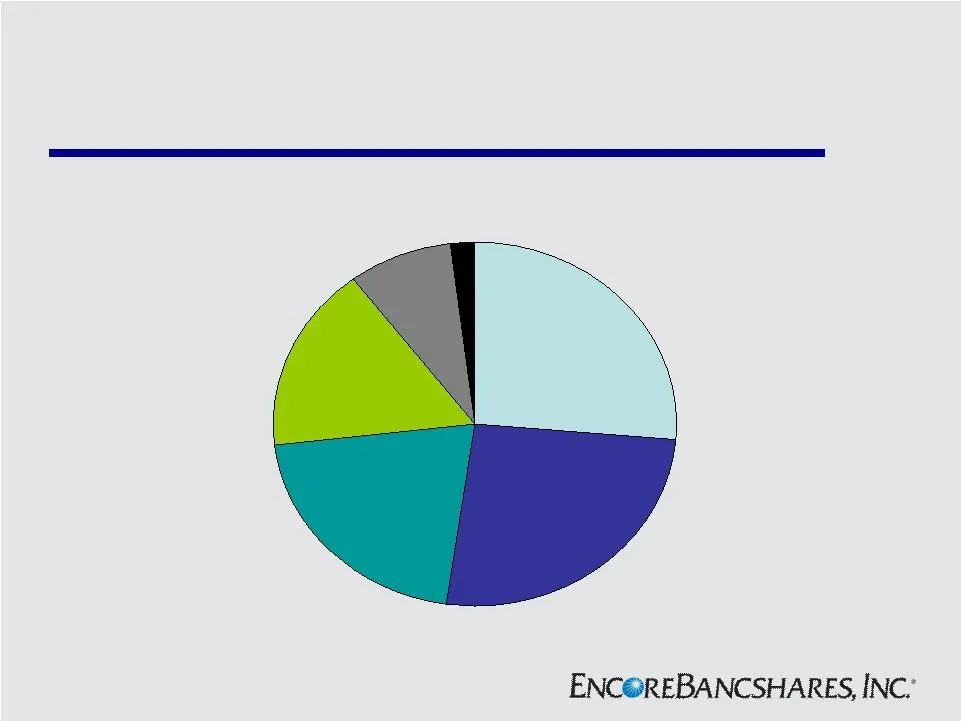
Deposit Mix Money market and savings 26.5% Noninterest- bearing deposits 20.9% Interest checking 16.6% CDs under $250,000 25.7% CDs over $250,000 8.3% Brokered deposits 2.0% As of December 31, 2010
Slide 18: Margin Improvement
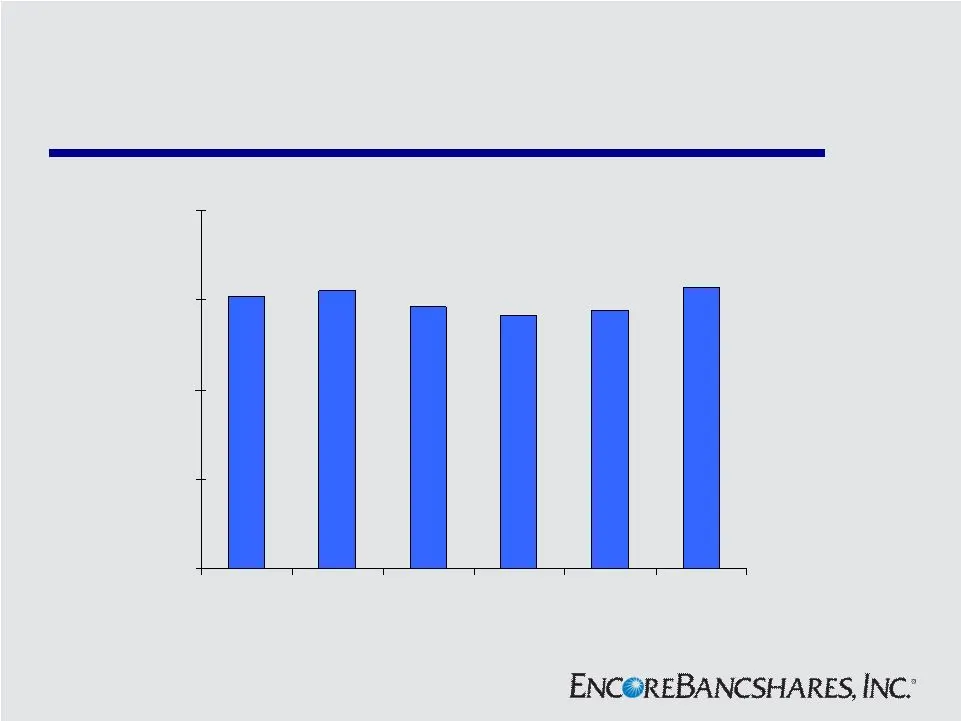
Margin Improvement * 3.14% 2.89% 2.83% 2.92% 3.04% 3.11% 0.00% 1.00% 2.00% 3.00% 4.00% 4Q 09 1Q 10 2Q 10 3Q 10 4Q 10 4Q 10 Proforma * Tax Equivalent
Slide 19: Wealth Management
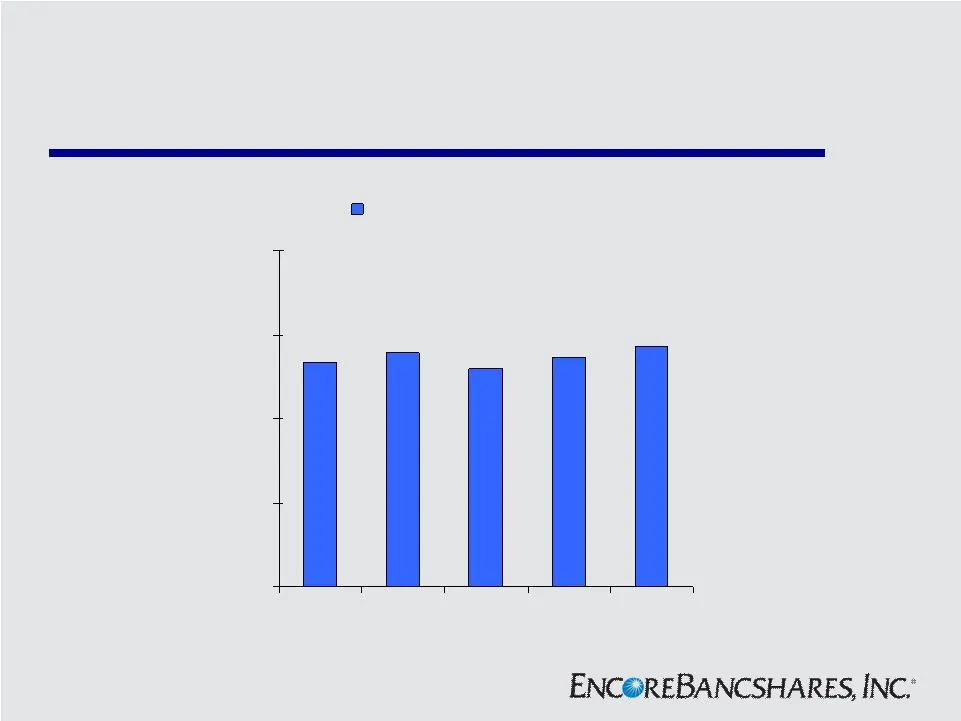
Wealth Management $2.7 $2.6 $2.7 $2.9 $2.8 $0 $1 $2 $3 $4 4Q 09 1Q 10 2Q 10 3Q 10 4Q 10 Assets Under Management $ in Billions
Slide 20: Wealth Management
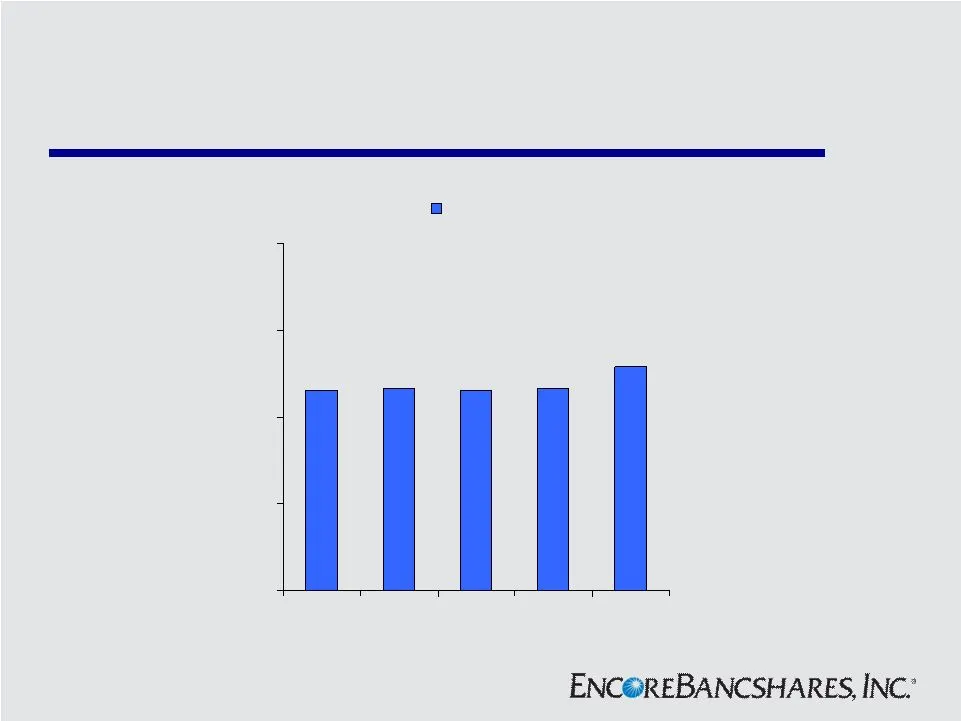
Wealth Management $4.6 $4.6 $4.7 $5.2 $4.7 $0 $2 $4 $6 $8 4Q 09 1Q 10 2Q 10 3Q 10 4Q 10 Revenues $ in Millions
Slide 21: Insurance
Insurance • Property and casualty insurance agency • Revenues of $5.9 million • Return on invested capital of 20% • Over 8,000 customers
Slide 22: Solid Capital
Solid Capital 12/31/2010 TCE/ Tangible Assets 6.86% Leverage Ratio 9.06% Tier 1 RBC 15.06% Tier 1 Common RBC 10.28% Allowance for Loan Losses/ Total Loans * 2.02% * Excluding held for sale
Slide 23: Investment Considerations
Investment Considerations • Solid capital position • Improving asset quality • Capacity for margin improvement • Attractive market valuation relative to peers • High margin fee-based businesses • Desirable Houston franchise
Slide 24: Non-GAAP Financial Measures
Non-GAAP Financial Measures (1) Tangible common equity, a non-GAAP financial measure, includes total equity, less preferred equity, goodwill and other intangible assets. Management reviews tangible common equity along with other measures of capital as part of its financial analyses and has included
Source: SEC EDGAR · 8-K filed Feb 8, 2011
More decks from Encore Bancshares Inc
 Gulf South Bank Conference 201127 slides · May 10, 2011
 Investor Presentation (March 2011)24 slides · Mar 3, 2011
 Macquarie Small & Mid Cap Conference 201021 slides · Jun 16, 2010
 Gulf South Bank Conference (May 2010)21 slides · May 5, 2010
 KBW Texas Field Trip (February 2010)26 slides · Feb 9, 2010
 Investor Presentation (November 2009)25 slides · Nov 4, 2009