Strabag SE · VIE:STR
Strabag — FY2009 Earnings Presentation
18 slides from Strabag's earnings presentation, Apr 30, 2010

Slide 1: STRABAG SE – FY 2009 results
STRABAG SE – FY 2009 results 30 April 2010
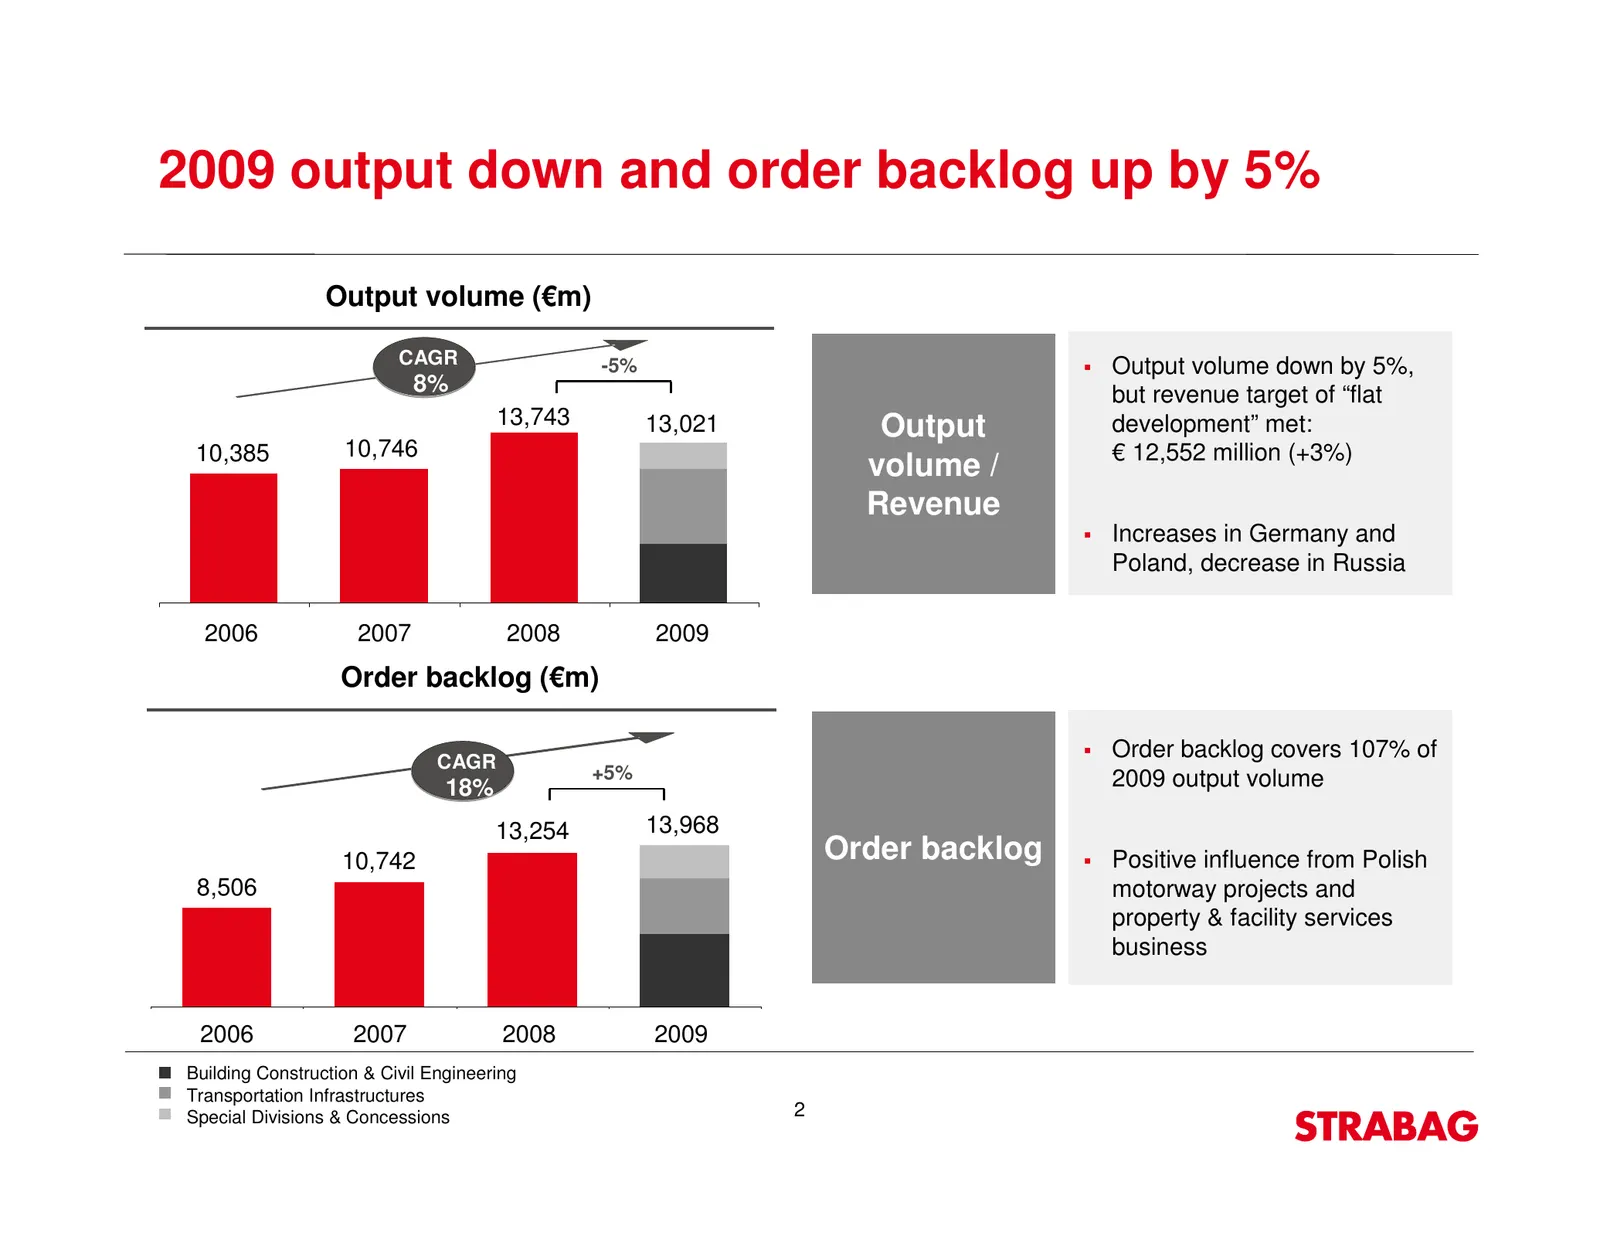
Slide 2: 2009 output down and order backlog up by 5%
2009 output down and order backlog up by 5% Output volume (€m) CAGR -5% Output volume down by 5%, 8% but revenue target of “flat 13,743 13,021 Output development” met: 10,385 10,746 € 12,552 million (+3%) volume / Revenue Increases in Germany and Poland, decrease in Russia 2006 2007 2008 2009 Order
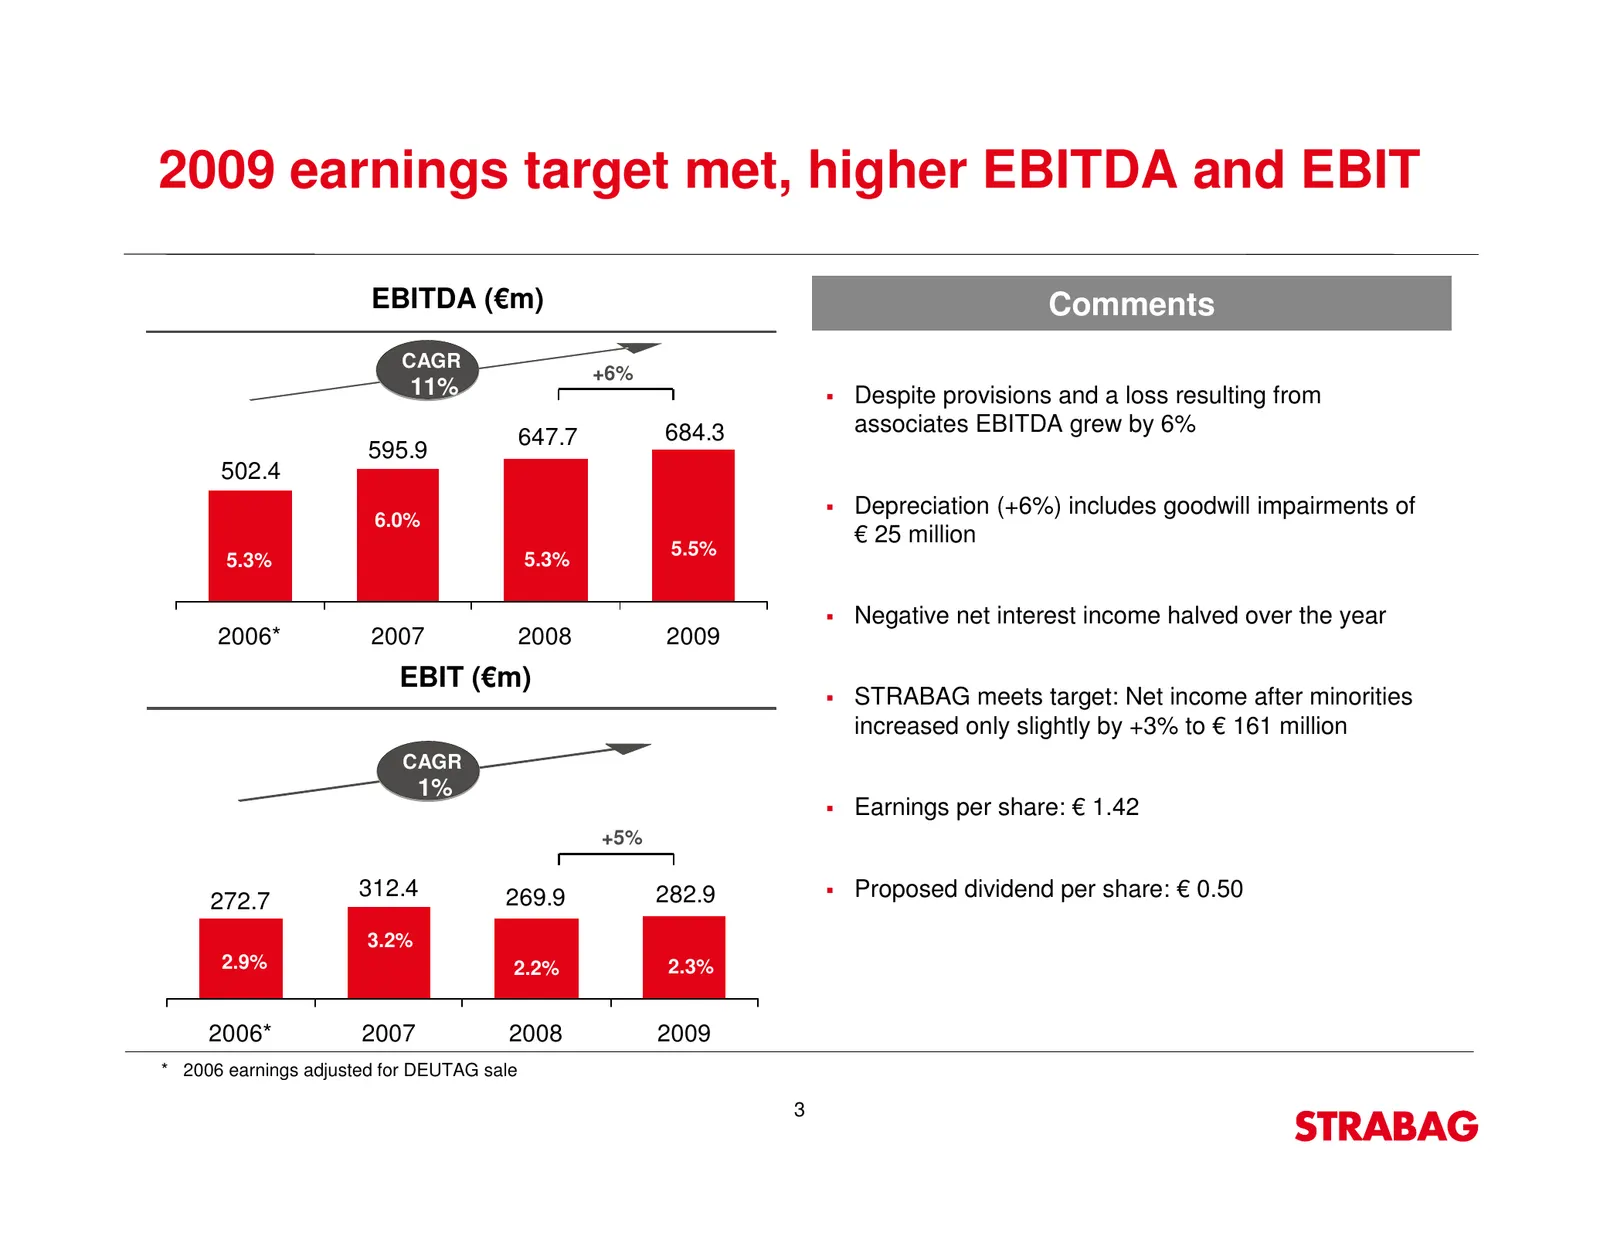
Slide 3: 2009 earnings target met, higher EBITDA and EBIT
2009 earnings target met, higher EBITDA and EBIT EBITDA (€m) Comments CAGR +6% 11% Despite provisions and a loss resulting from 684.3 associates EBITDA grew by 6% 647.7 595.9 502.4 Depreciation (+6%) includes goodwill impairments of 6.0% € 25 million 5.5% 5.3% 5.3% Negative net interest income halve
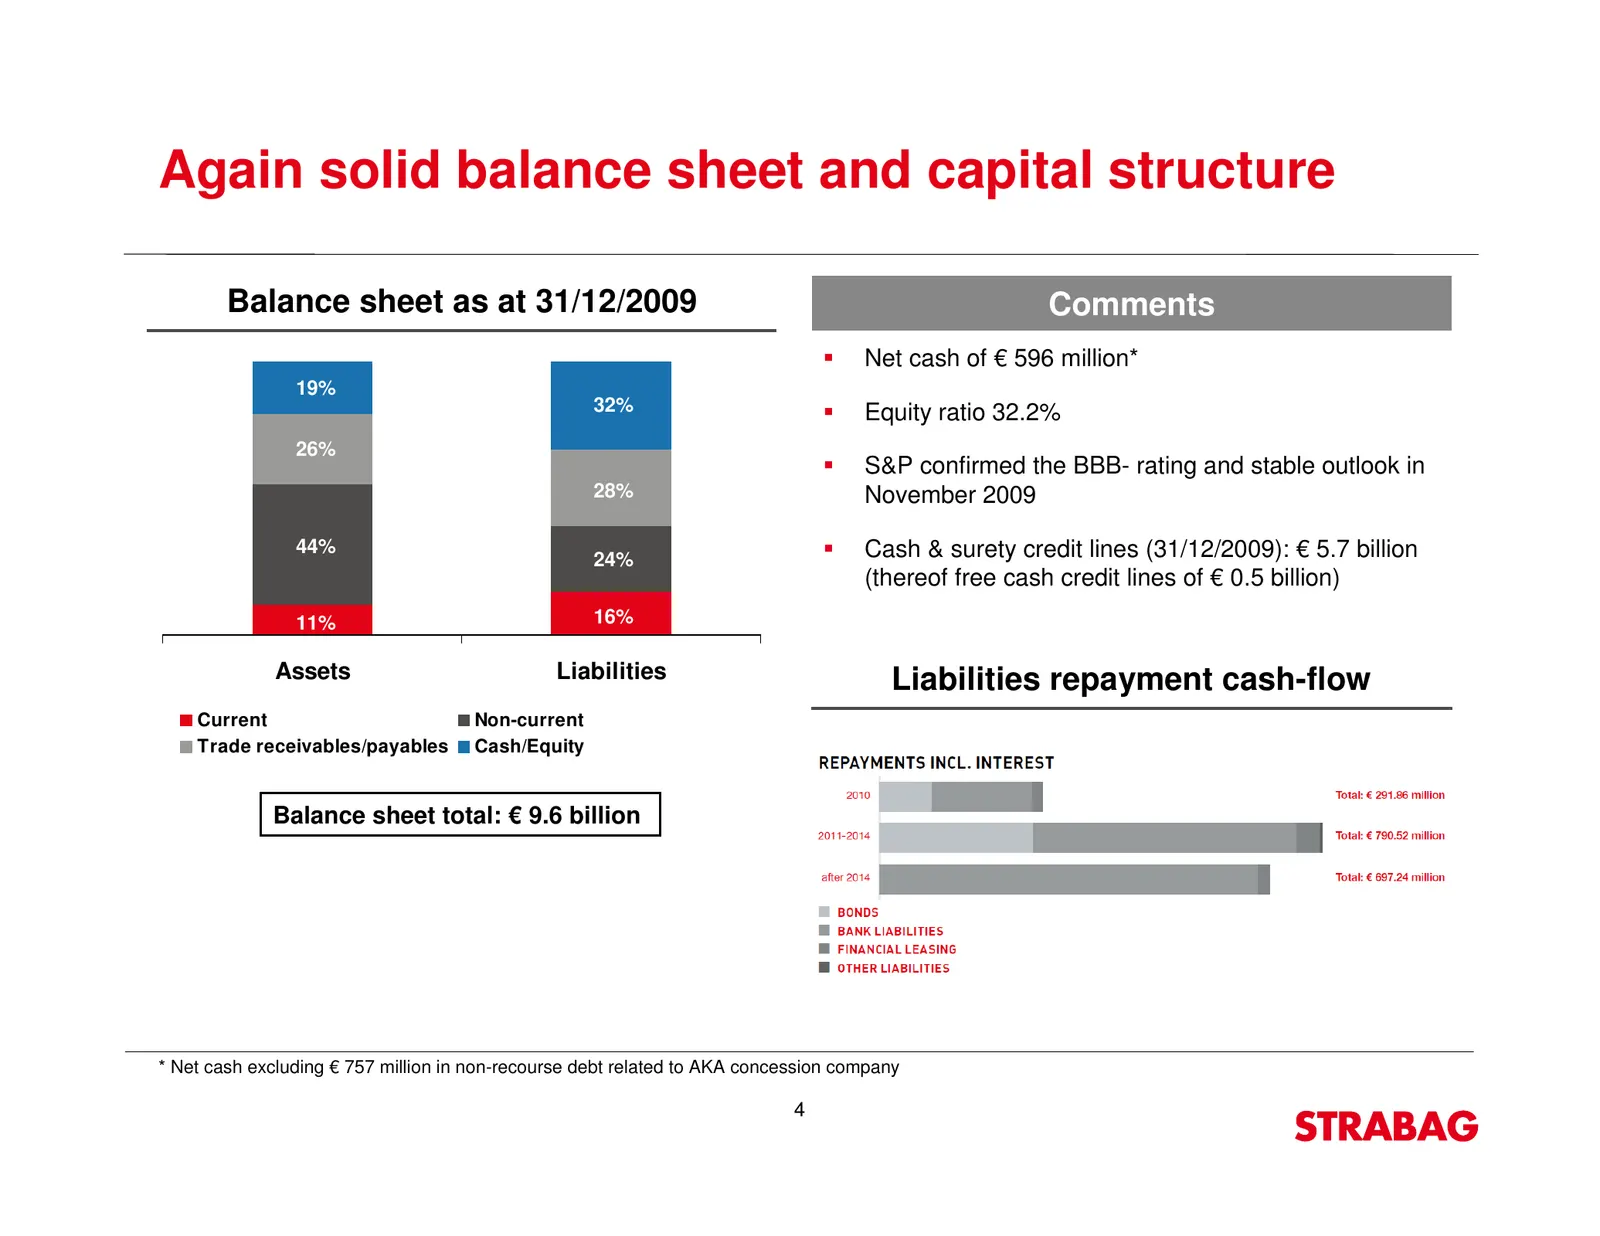
Slide 4: Again solid balance sheet and capital structure
Again solid balance sheet and capital structure Balance sheet as at 31/12/2009 Comments Net cash of € 596 million* 19% 32% Equity ratio 32.2% 26% S&P confirmed the BBB- rating and stable outlook in 28% November 2009 44% Cash & surety credit lines (31/12/2009): € 5.7 billion 24% (thereof free cash cr
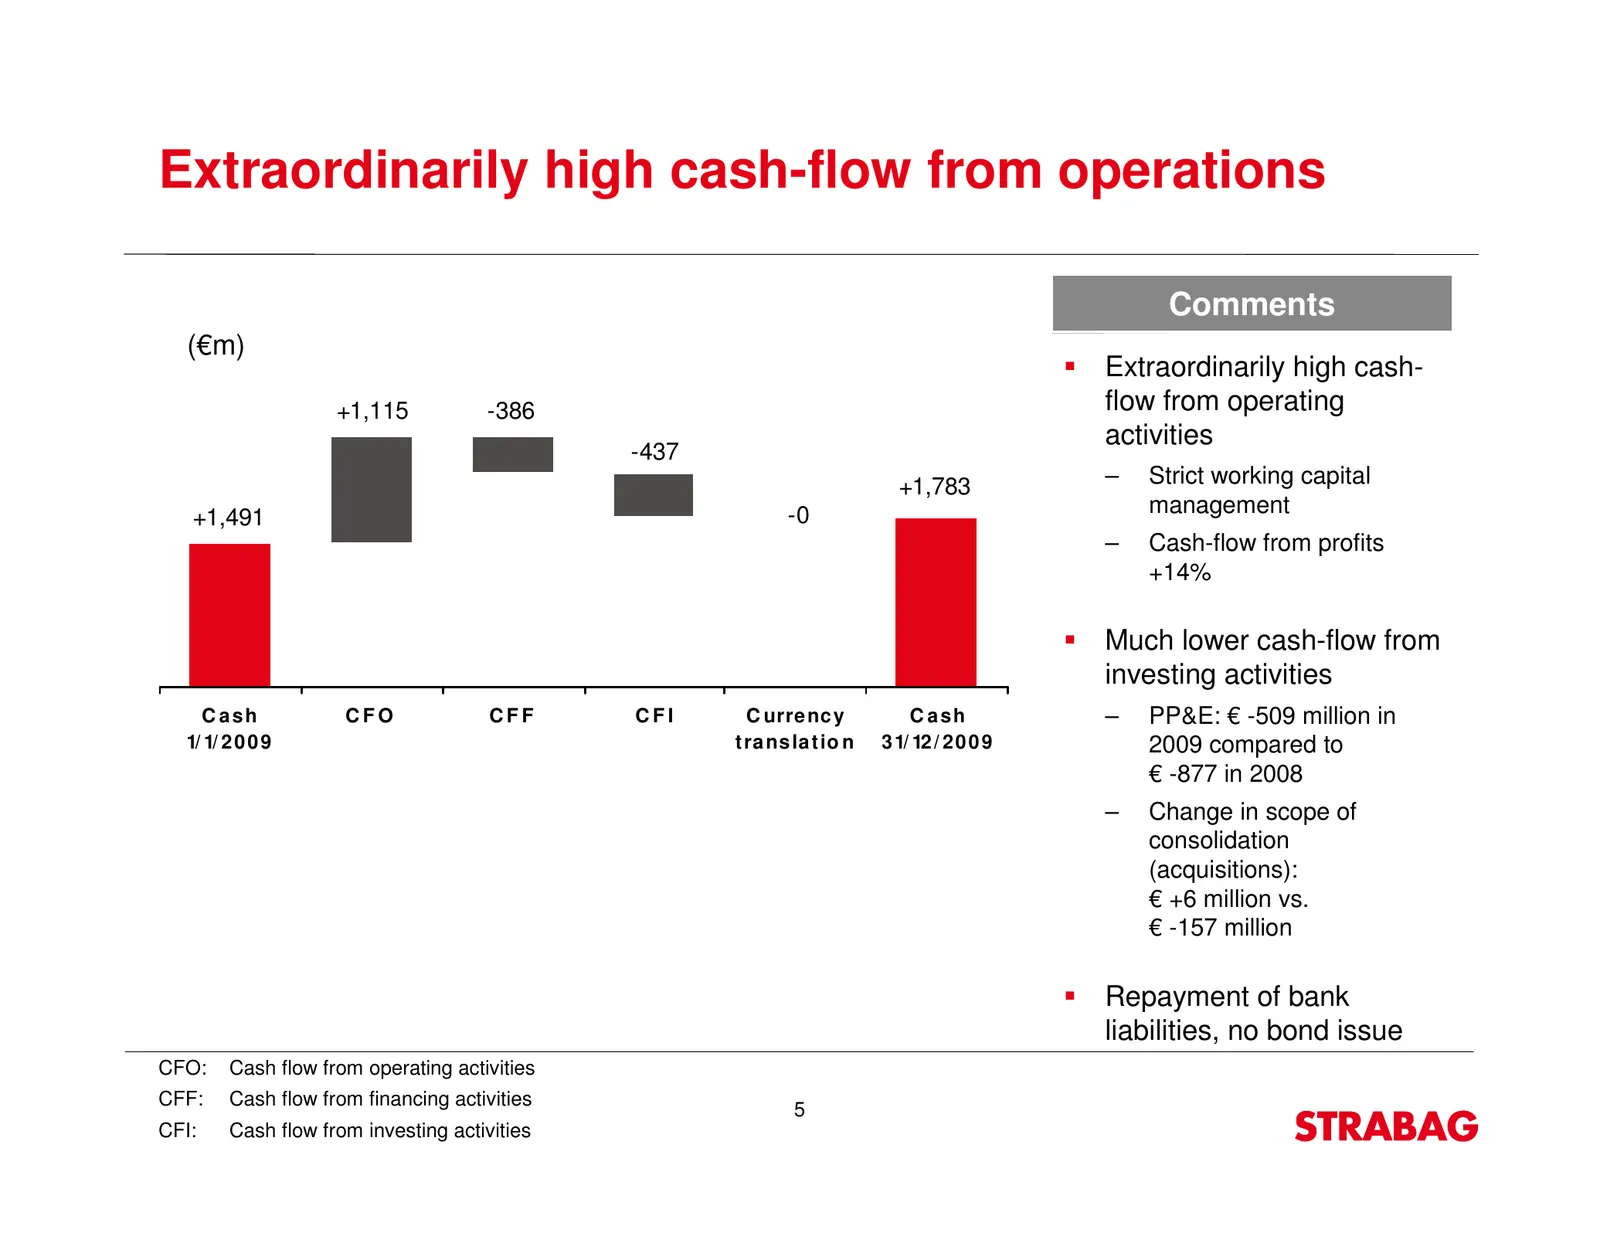
Slide 5: Extraordinarily high cash-flow from operations
Extraordinarily high cash-flow from operations Comments (€m) Extraordinarily high cash- +1,115 -386 flow from operating activities -437 +1,783 – Strict working capital +1,491 -0 management – Cash-flow from profits +14% Much lower cash-flow from investing activities C ash CFO CFF CFI C urre nc y C a
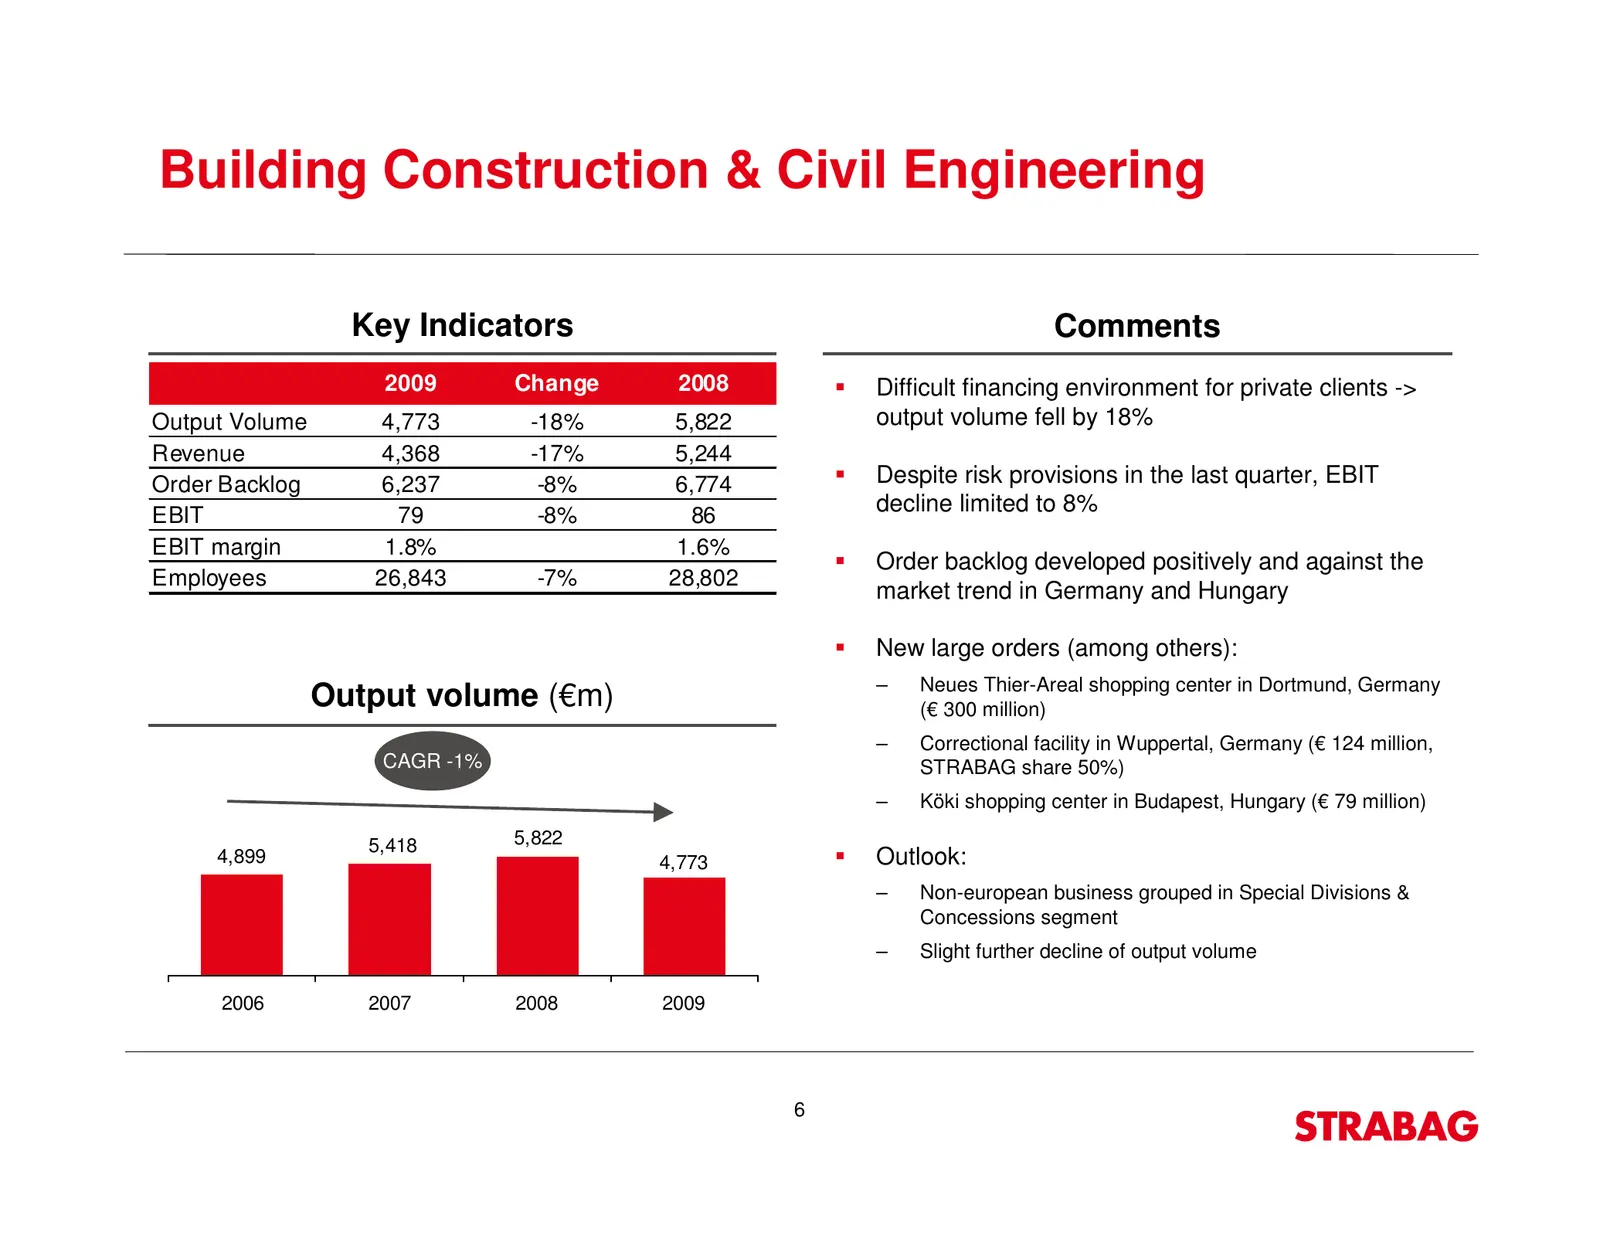
Slide 6: Building Construction & Civil Engineering
Building Construction & Civil Engineering Key Indicators Comments 2009 Change 2008 Difficult financing environment for private clients -> Output Volume 4,773 -18% 5,822 output volume fell by 18% Revenue 4,368 -17% 5,244 Order Backlog 6,237 -8% 6,774 Despite risk provisions in the last quarter, EBIT
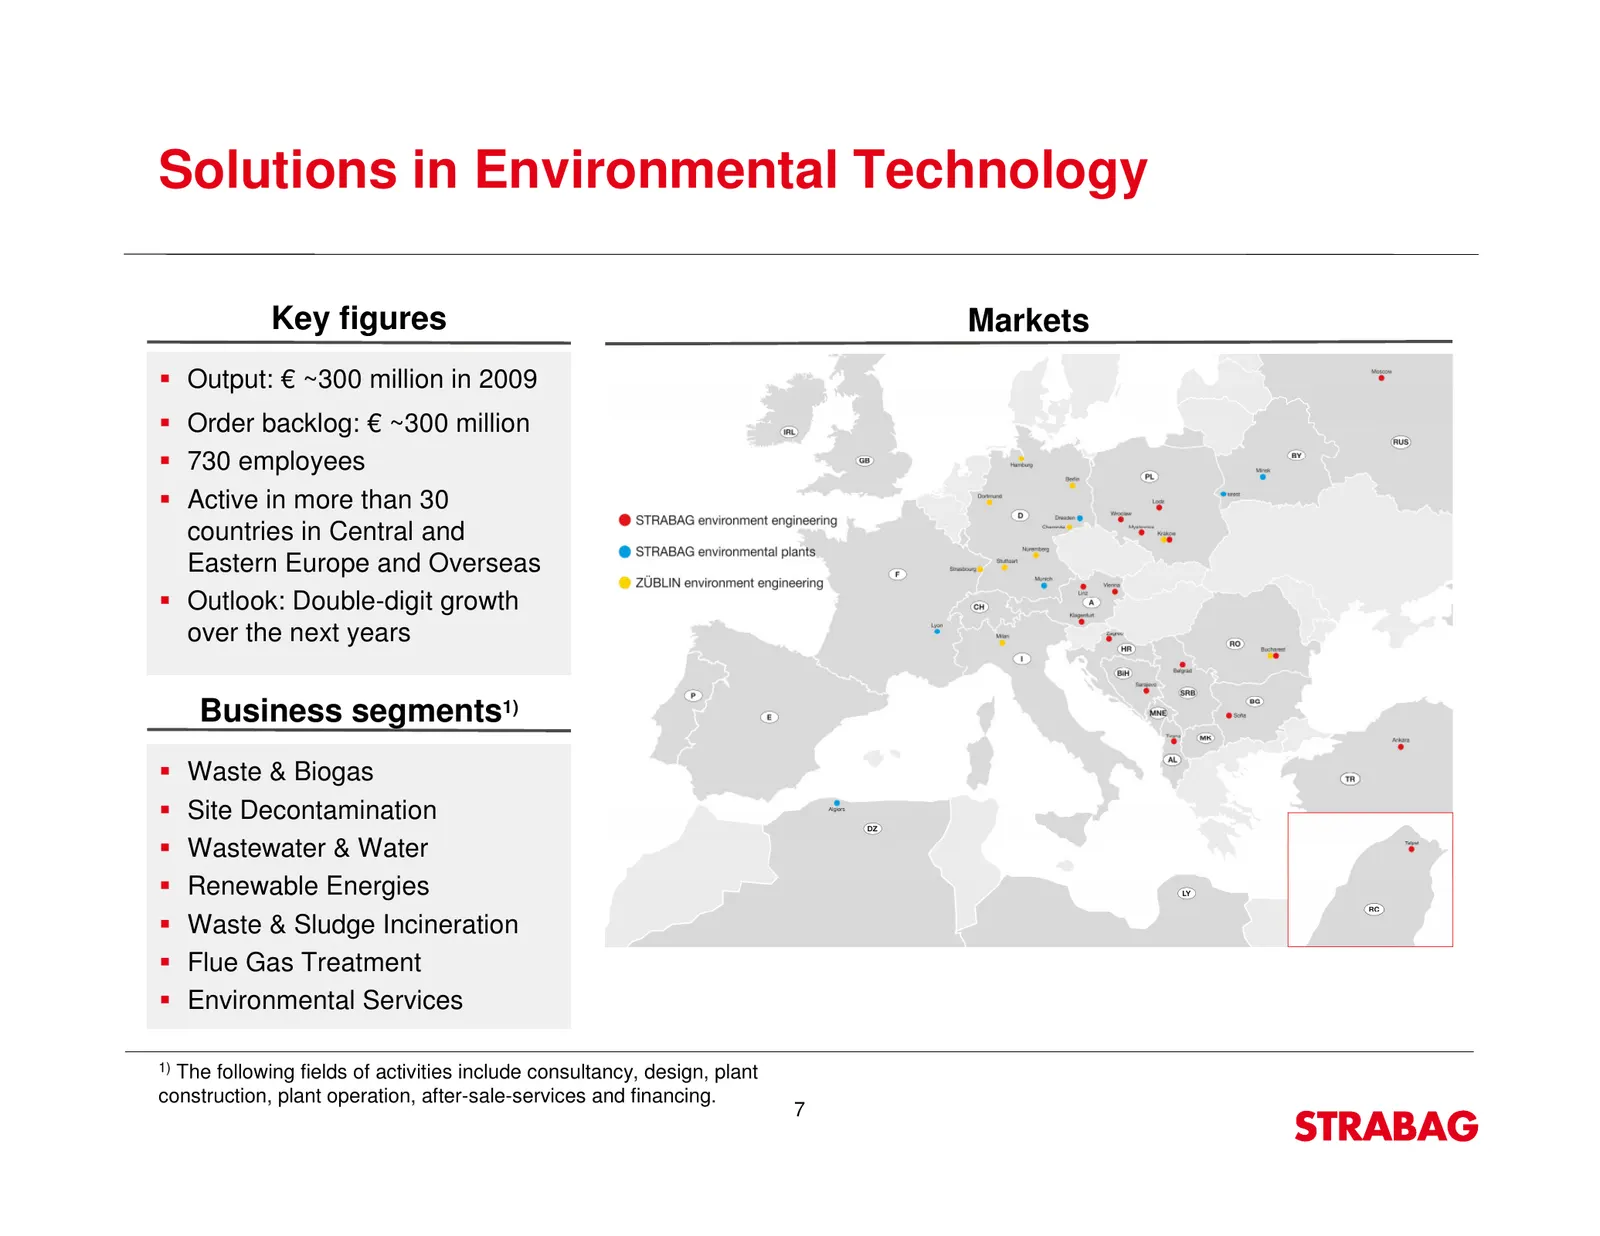
Slide 7: Solutions in Environmental Technology
Solutions in Environmental Technology Key figures Markets Output: € ~300 million in 2009 Order backlog: € ~300 million 730 employees Active in more than 30 countries in Central and Eastern Europe and Overseas Outlook: Double-digit growth over the next years Business segments1) Waste & Biogas Site De
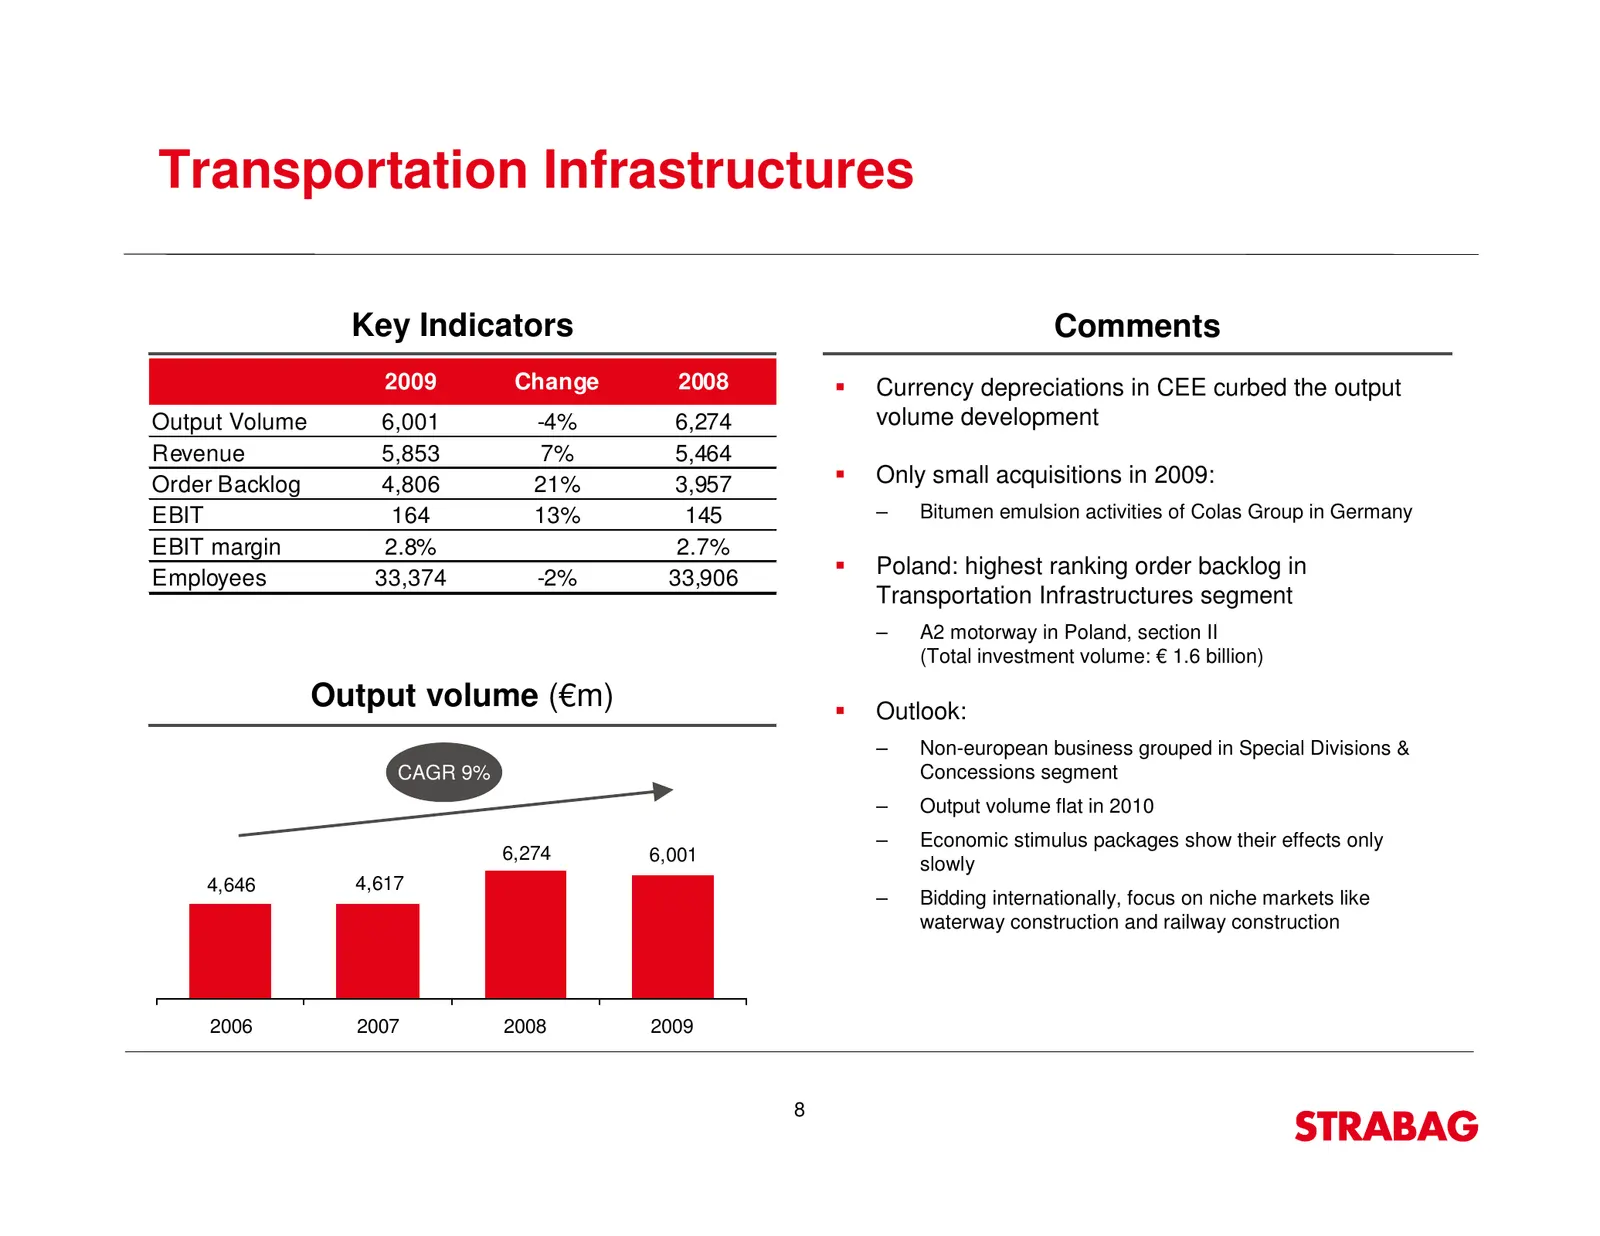
Slide 8: Transportation Infrastructures
Transportation Infrastructures Key Indicators Comments 2009 Change 2008 Currency depreciations in CEE curbed the output Output Volume 6,001 -4% 6,274 volume development Revenue 5,853 7% 5,464 Order Backlog 4,806 21% 3,957 Only small acquisitions in 2009: EBIT 164 13% 145 – Bitumen emulsion activitie
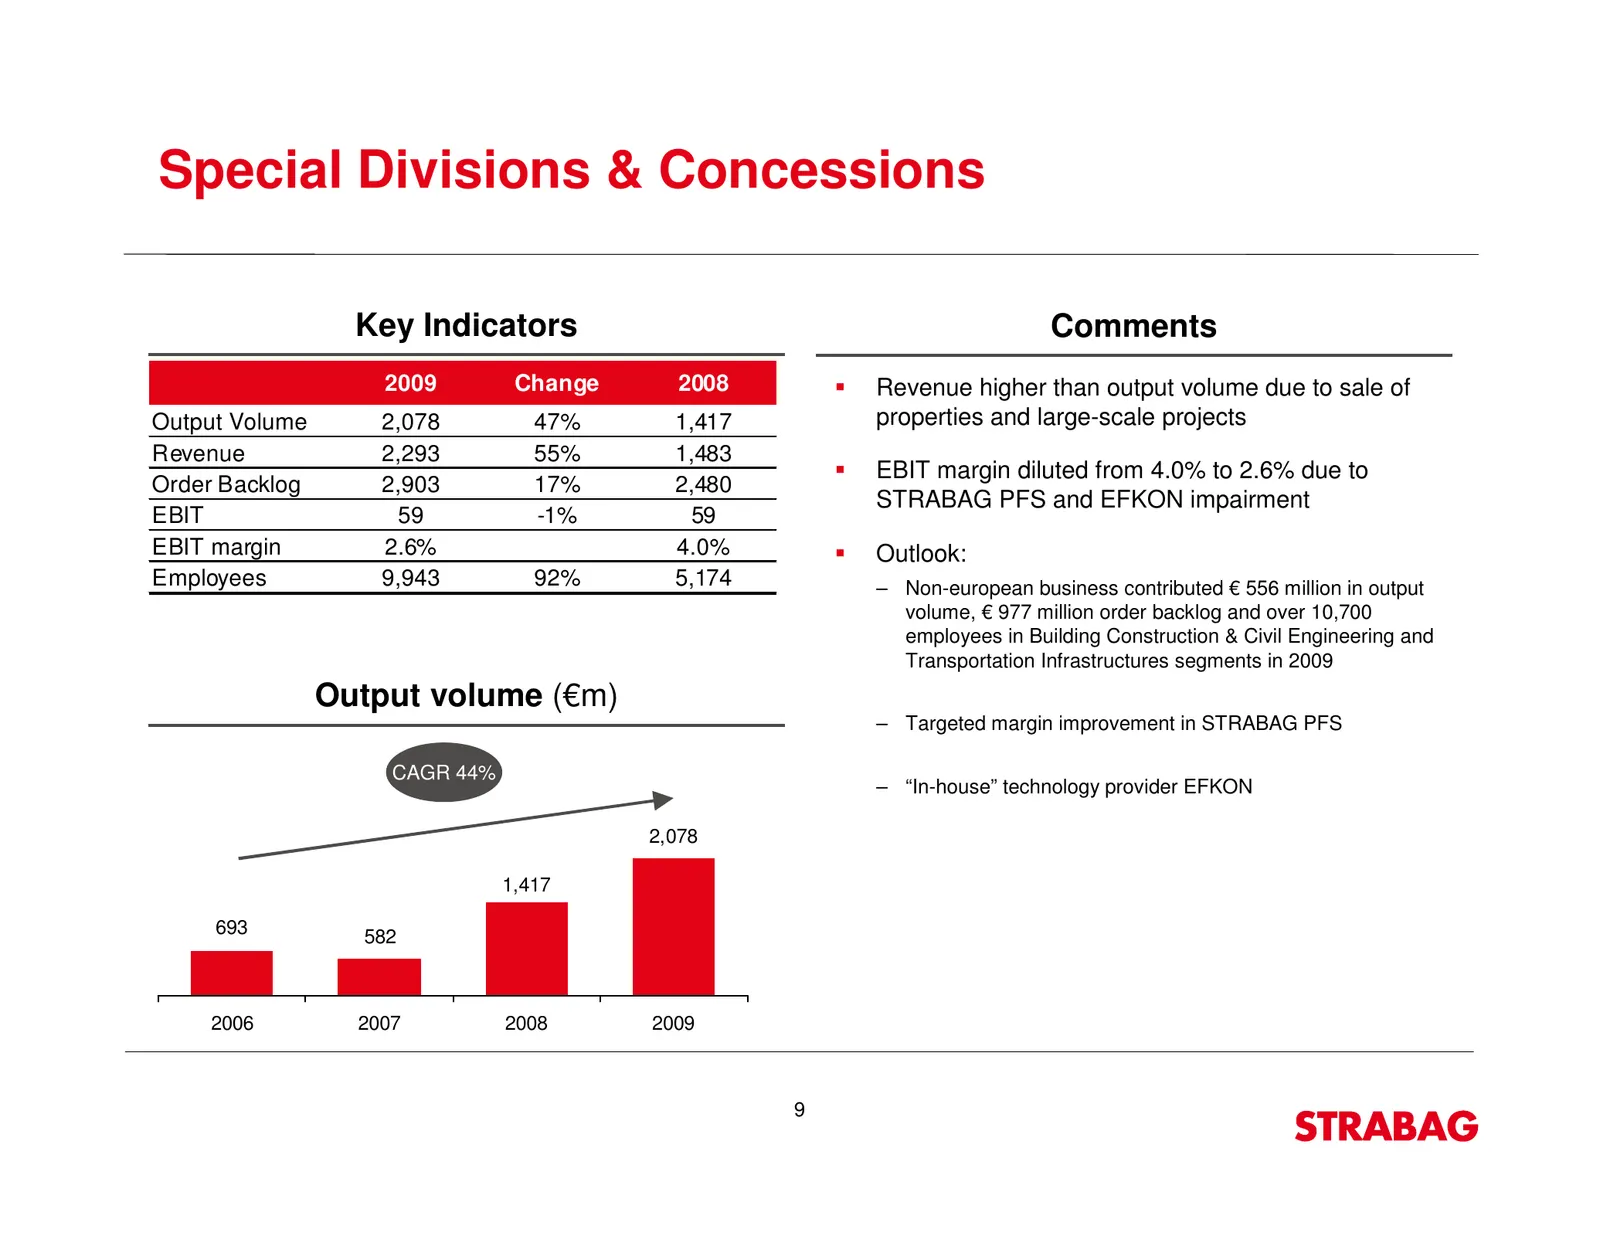
Slide 9: Special Divisions & Concessions
Special Divisions & Concessions Key Indicators Comments 2009 Change 2008 Revenue higher than output volume due to sale of Output Volume 2,078 47% 1,417 properties and large-scale projects Revenue 2,293 55% 1,483 EBIT margin diluted from 4.0% to 2.6% due to Order Backlog 2,903 17% 2,480 STRABAG PFS a
Slide 10: Extending the value chain: Activities in Property & Facility Services
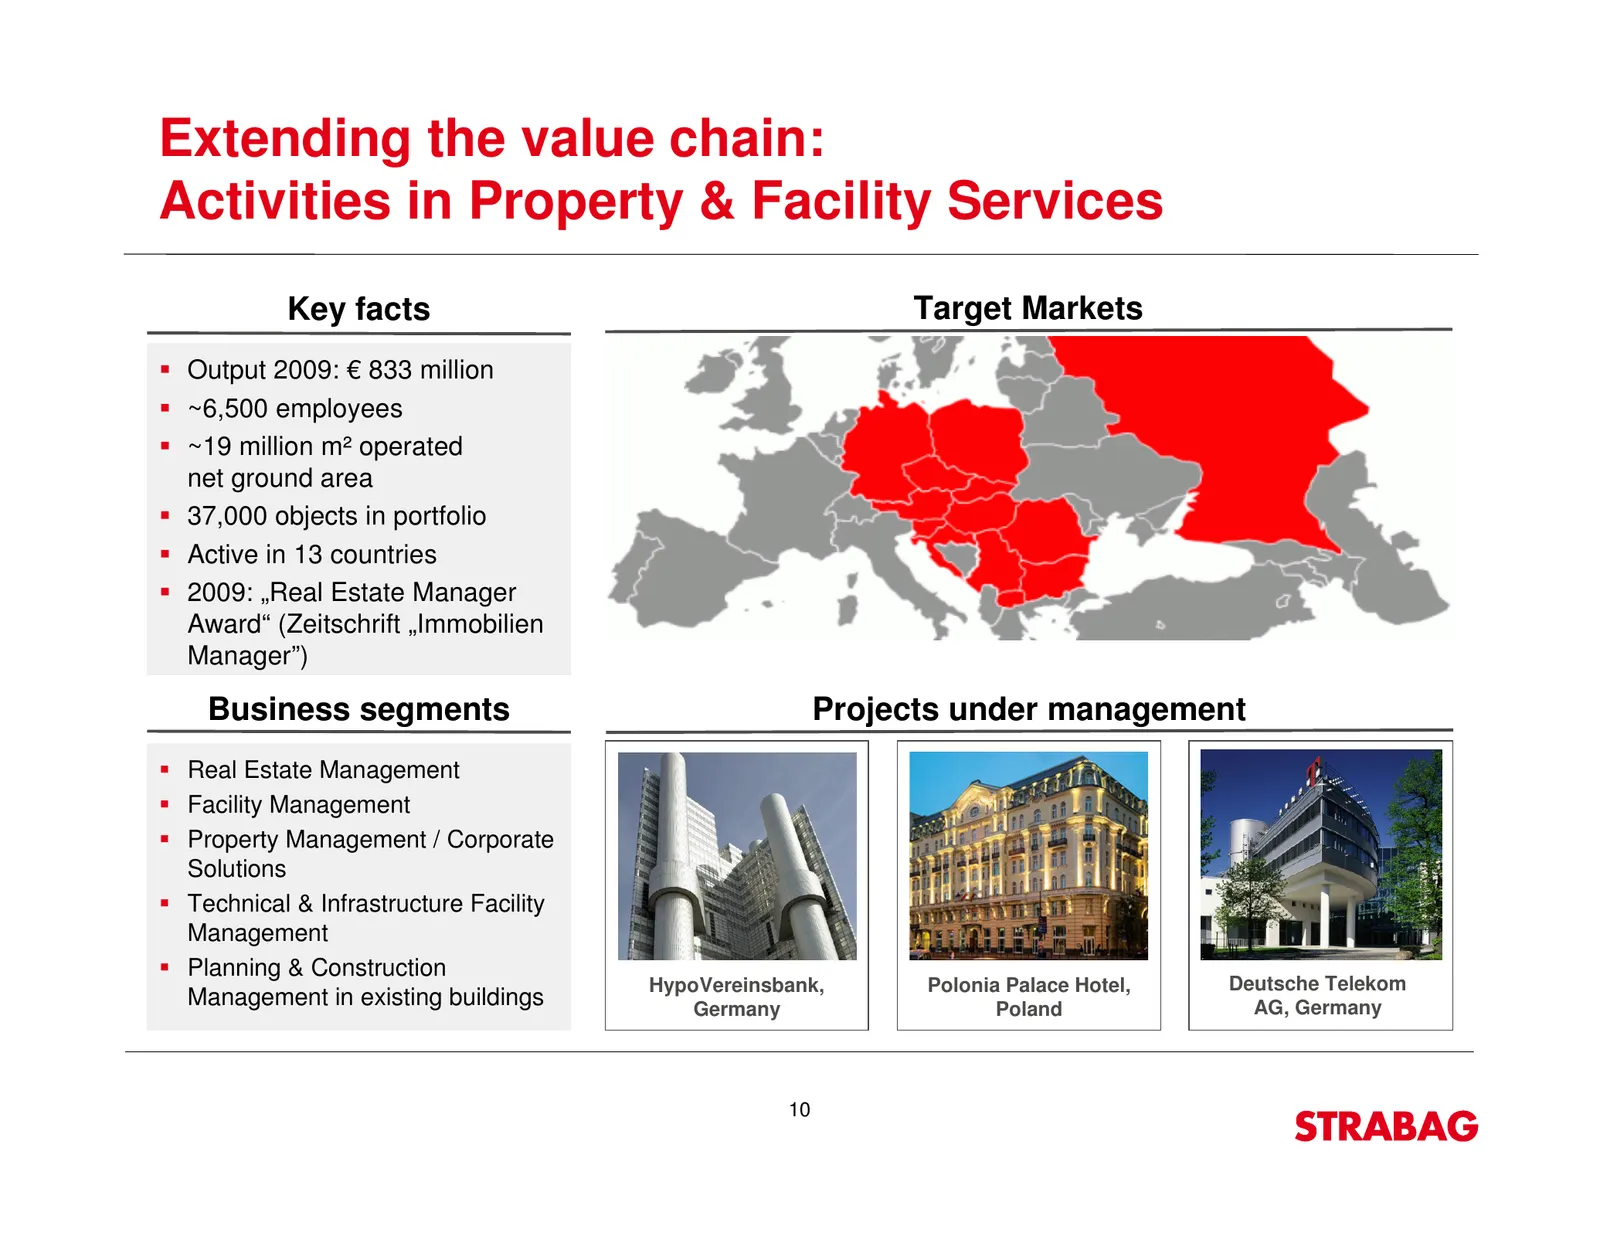
Extending the value chain: Activities in Property & Facility Services Key facts Target Markets Output 2009: € 833 million ~6,500 employees ~19 million m² operated net ground area 37,000 objects in portfolio Active in 13 countries 2009: „Real Estate Manager Award“ (Zeitschrift „Immobilien Manager”) B
Slide 11: Steady income through concession business
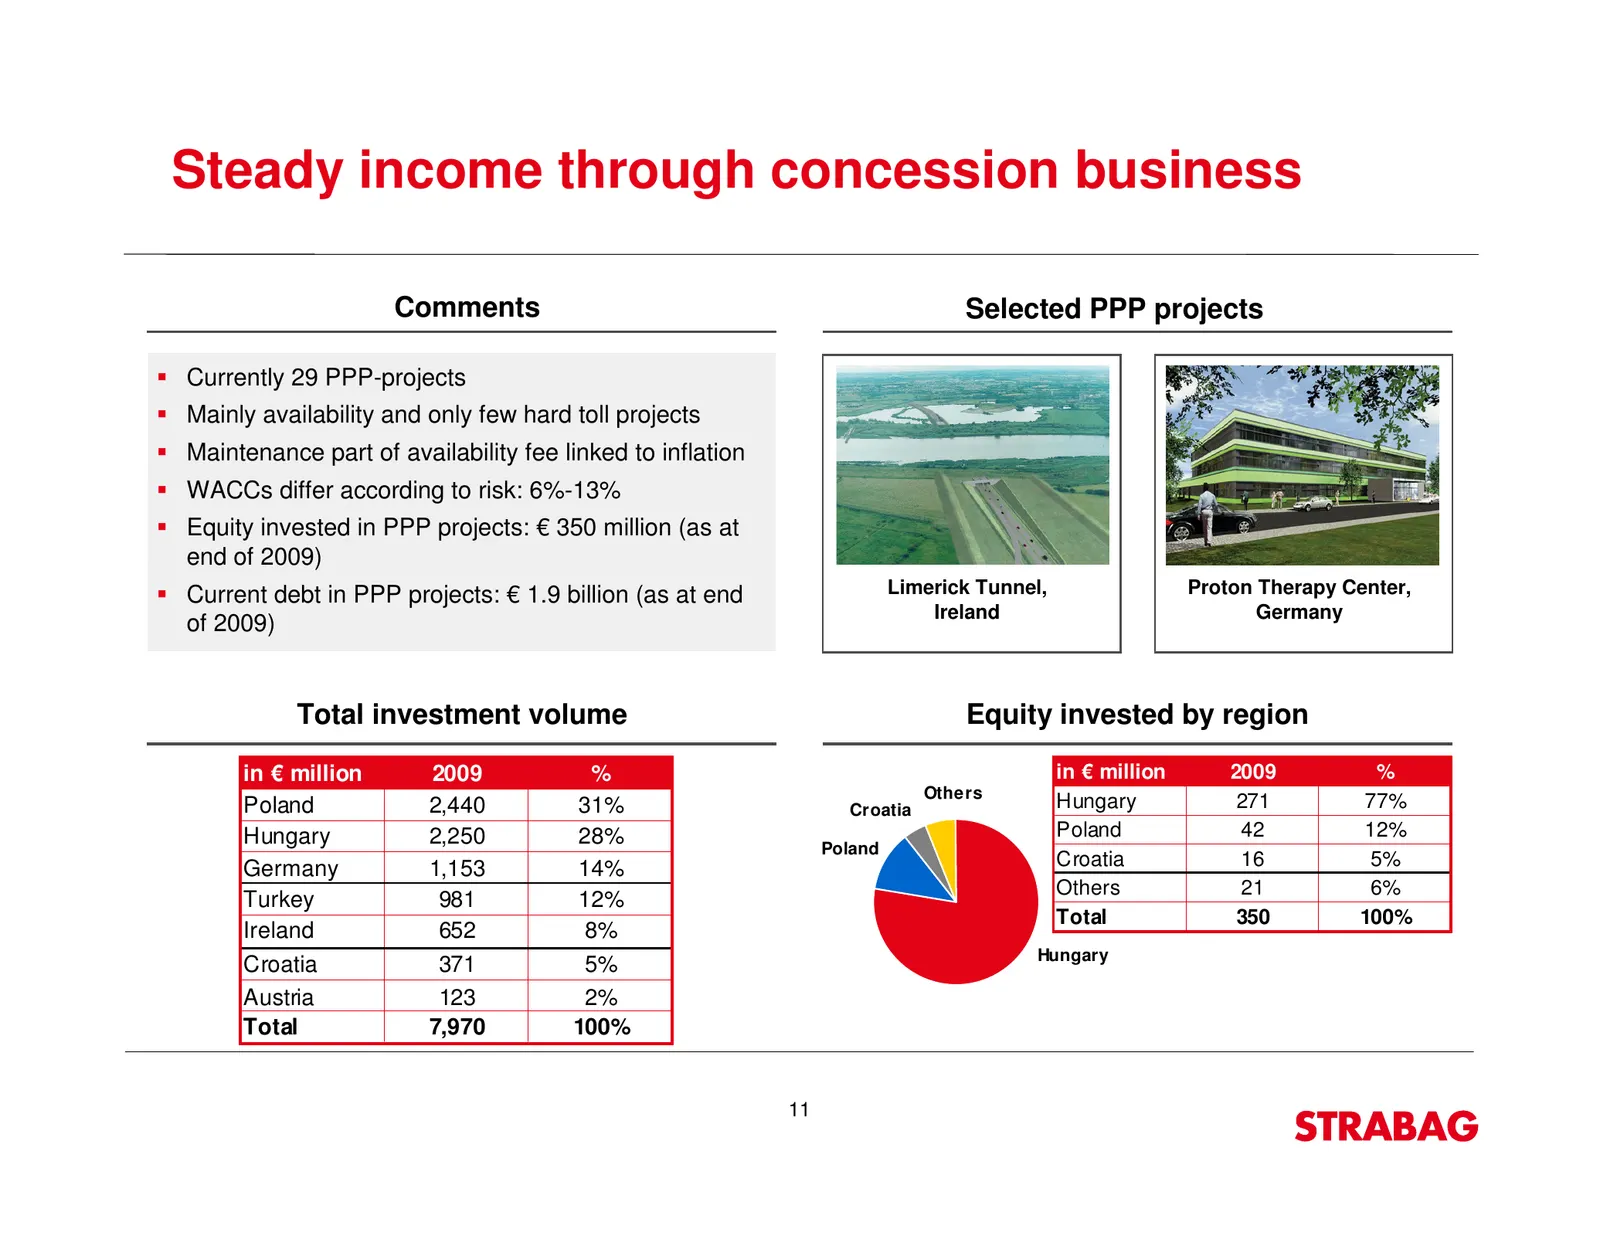
Steady income through concession business Comments Selected PPP projects Currently 29 PPP-projects Mainly availability and only few hard toll projects Maintenance part of availability fee linked to inflation WACCs differ according to risk: 6%-13% Equity invested in PPP projects: € 350 million (as at
Slide 12: STRABAG SE share underperformed indices
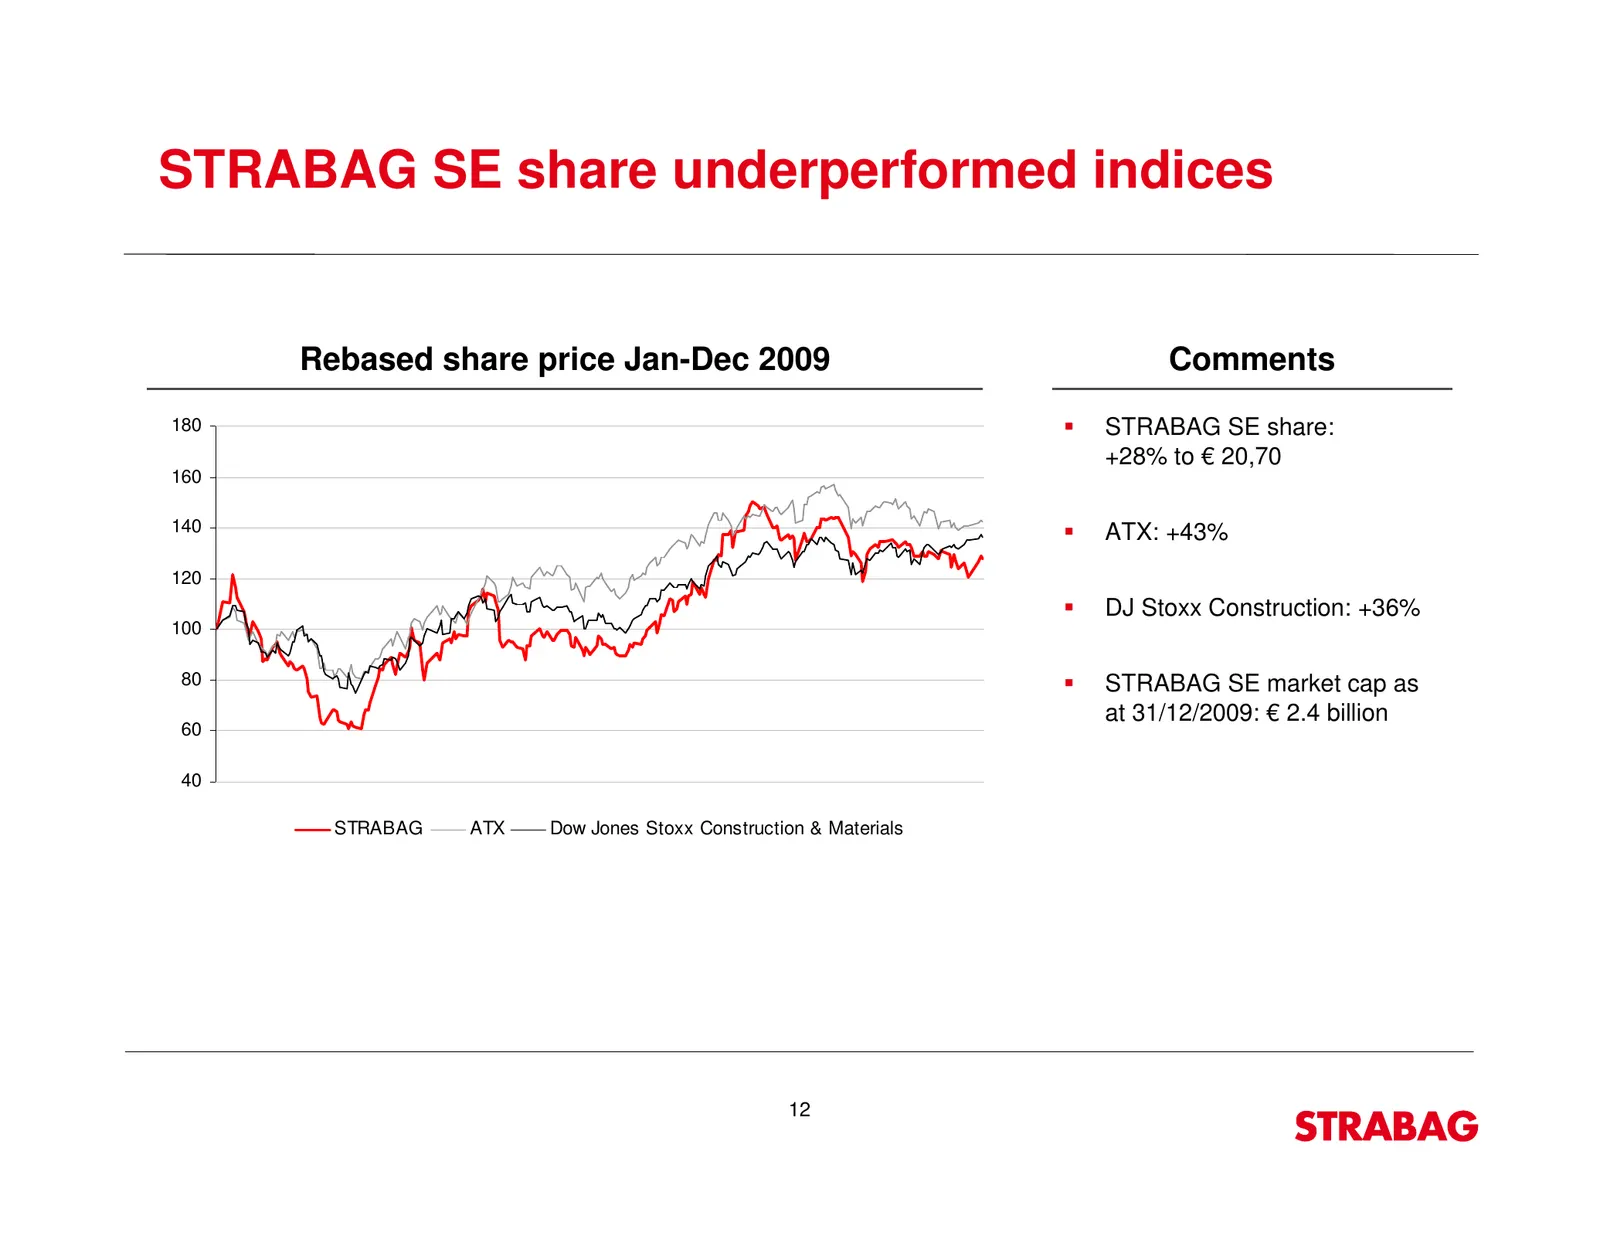
STRABAG SE share underperformed indices Rebased share price Jan-Dec 2009 Comments 180 STRABAG SE share: +28% to € 20,70 160 140 ATX: +43% 120 DJ Stoxx Construction: +36% 100 80 STRABAG SE market cap as at 31/12/2009: € 2.4 billion 60 40 STRABAG ATX Dow Jones Stoxx Construction & Materials 12
Slide 13: Outlook 2010
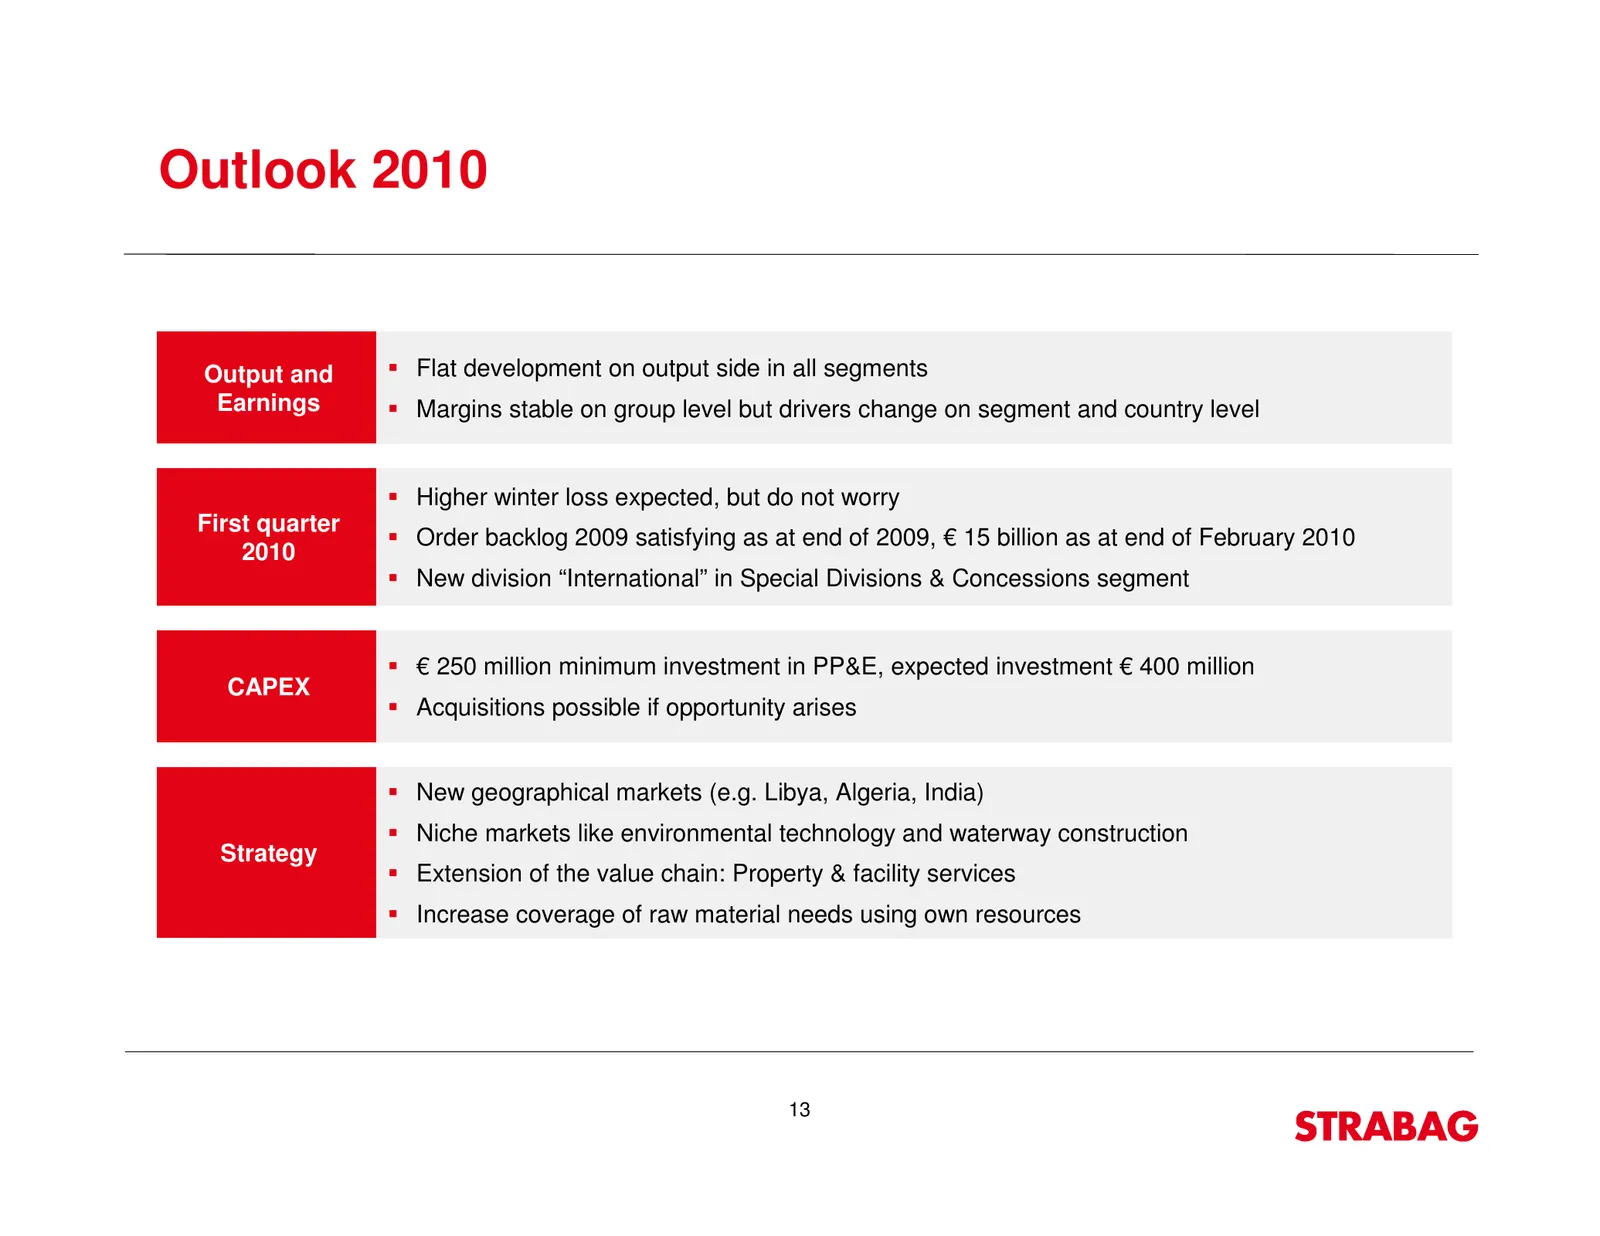
Outlook 2010 Output and Flat development on output side in all segments Earnings Margins stable on group level but drivers change on segment and country level Higher winter loss expected, but do not worry First quarter Order backlog 2009 satisfying as at end of 2009, € 15 billion as at end of Februa
Slide 14: Appendix
Appendix STRABAG
Slide 15: Group P&L 2009
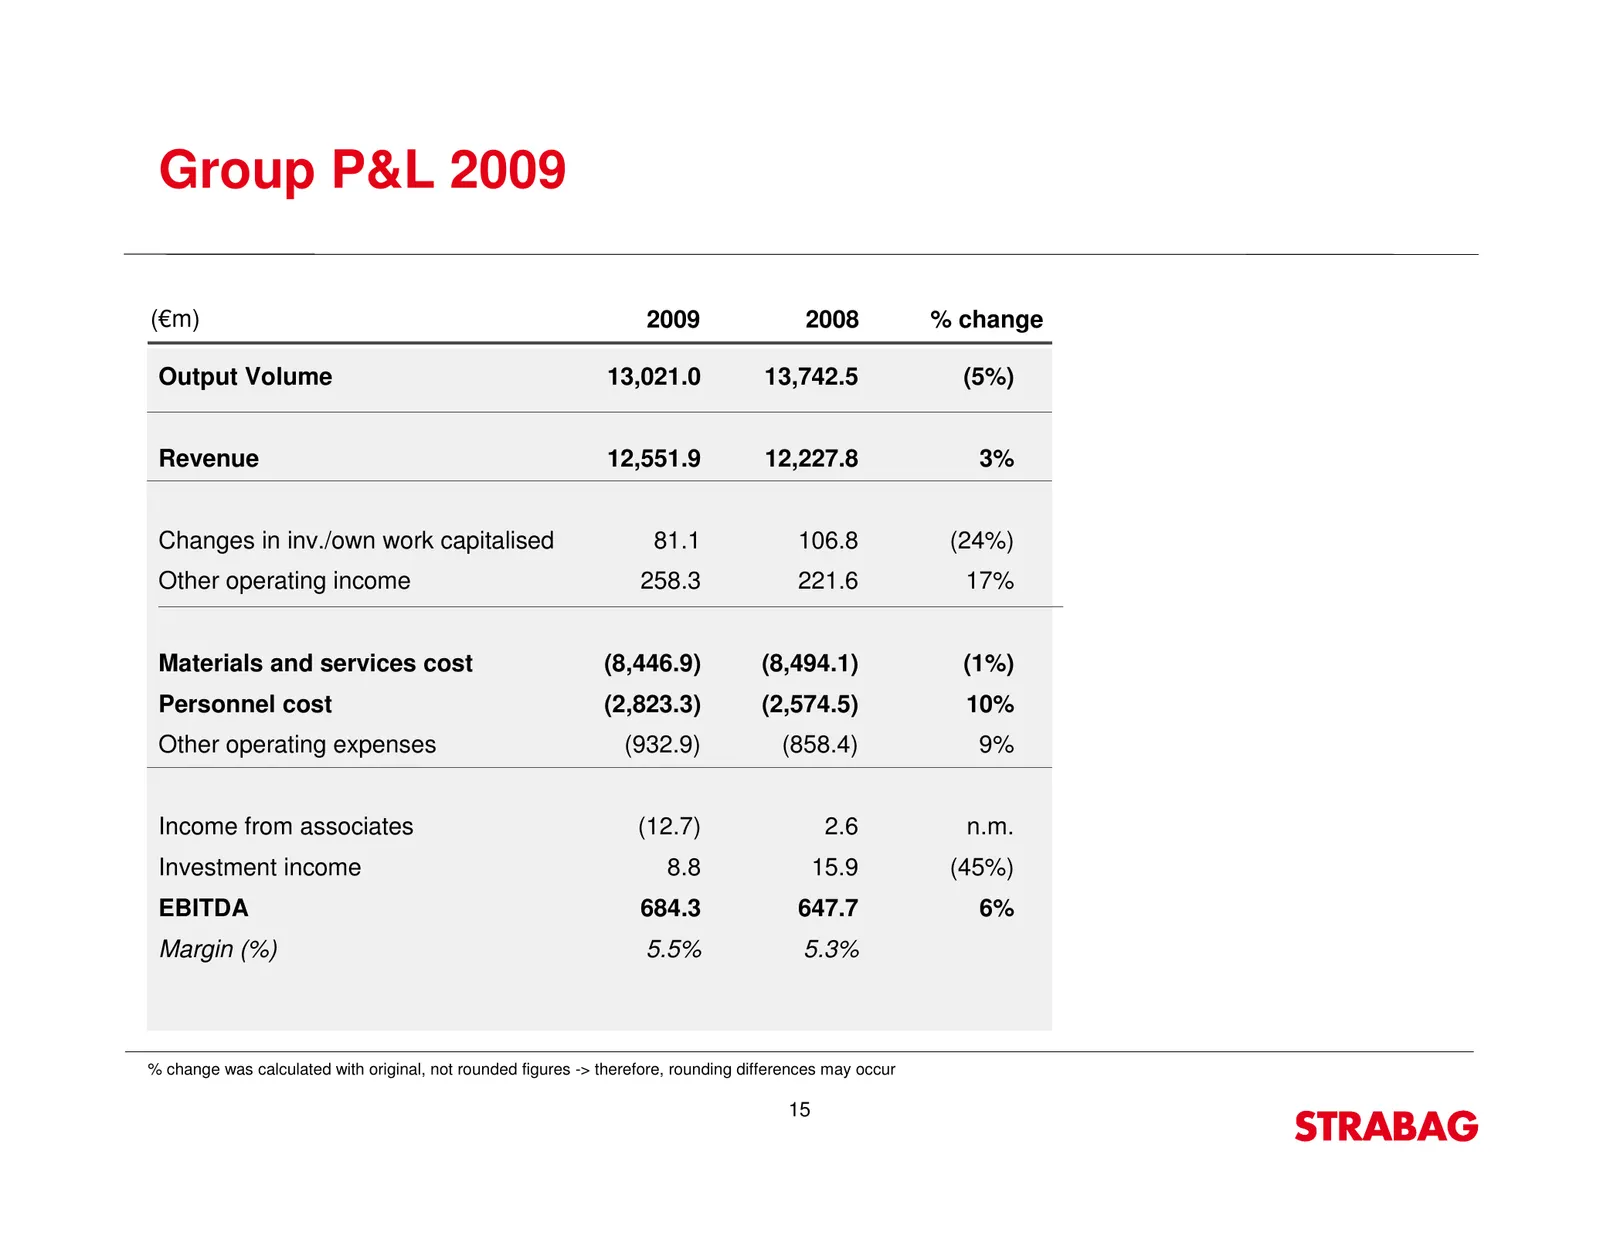
Group P&L 2009 (€m) 2009 2008 % change Output Volume 13,021.0 13,742.5 (5%) Revenue 12,551.9 12,227.8 3% Changes in inv./own work capitalised 81.1 106.8 (24%) Other operating income 258.3 221.6 17% Materials and services cost (8,446.9) (8,494.1) (1%) Personnel cost (2,823.3) (2,574.5) 10% Other oper
Slide 16: Group P&L 2009 (continued)
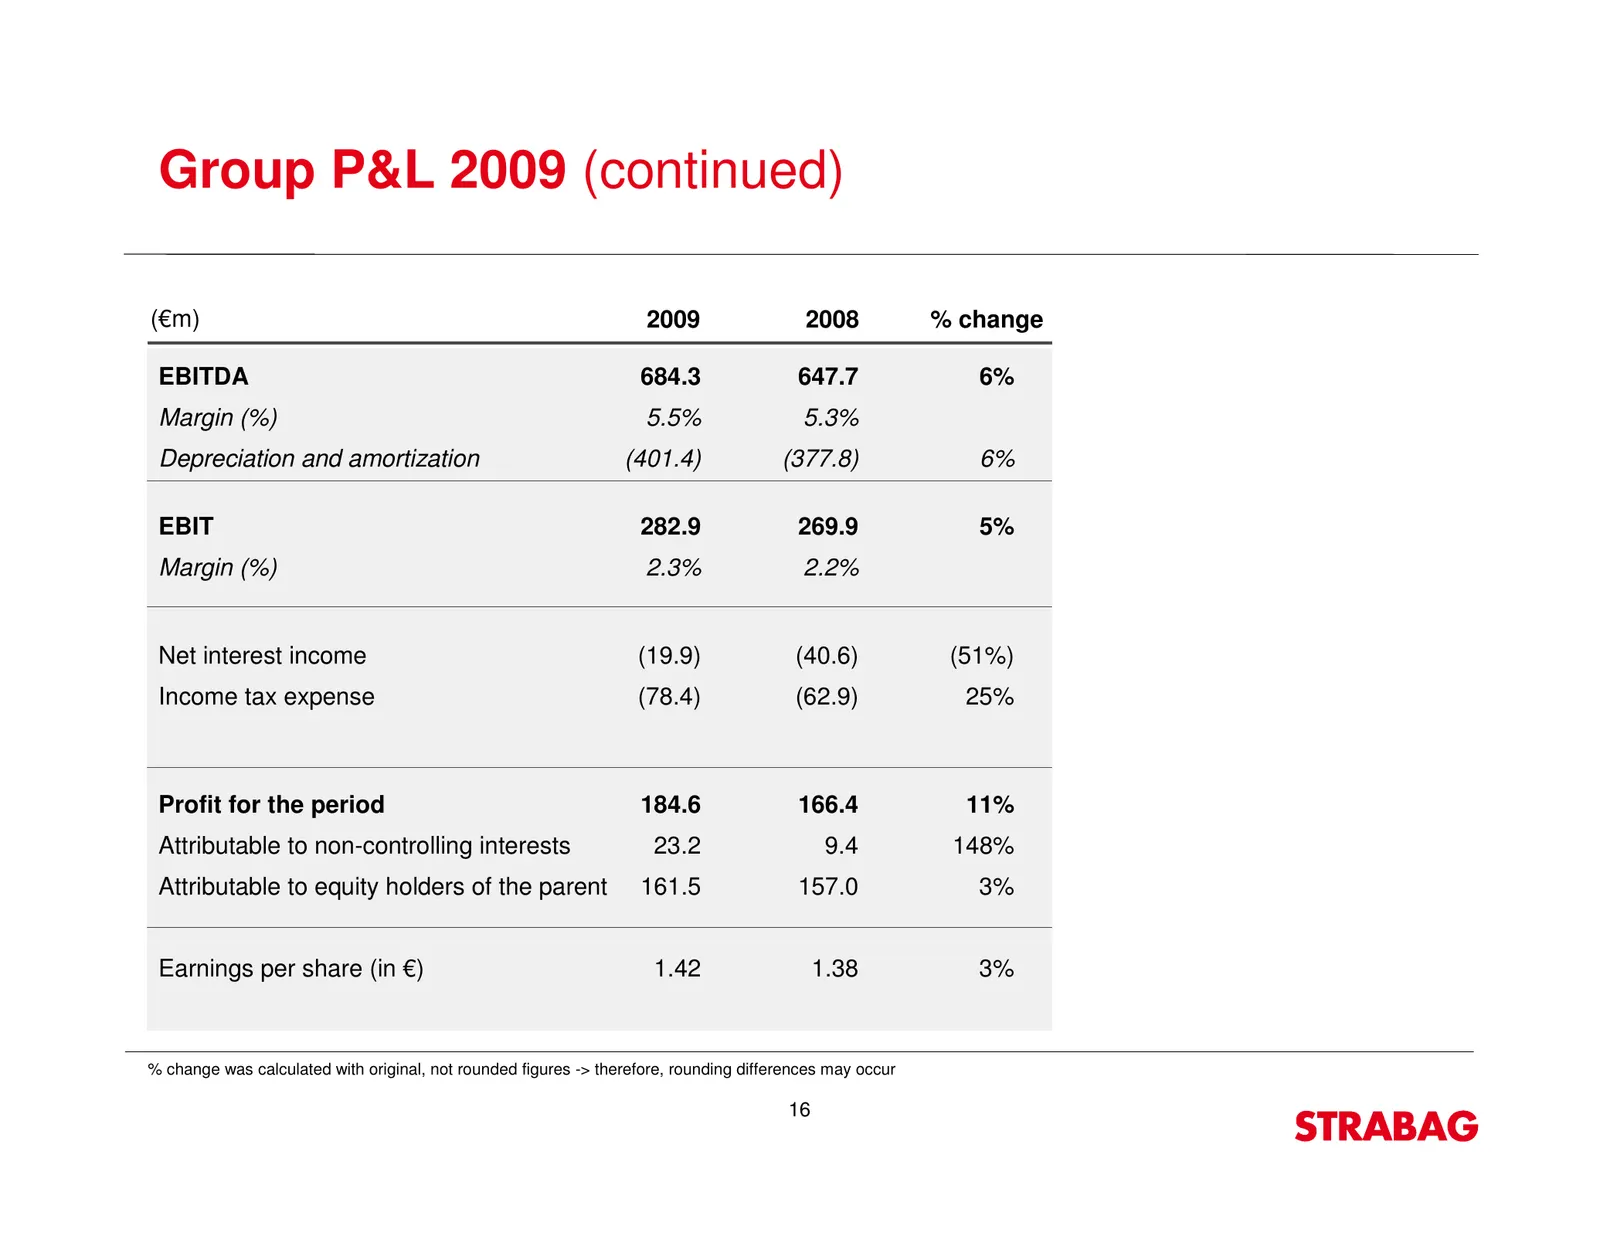
Group P&L 2009 (continued) (€m) 2009 2008 % change EBITDA 684.3 647.7 6% Margin (%) 5.5% 5.3% Depreciation and amortization (401.4) (377.8) 6% EBIT 282.9 269.9 5% Margin (%) 2.3% 2.2% Net interest income (19.9) (40.6) (51%) Income tax expense (78.4) (62.9) 25% Profit for the period 184.6 166.4 11% A
Slide 17: Balance sheet 31 December 2009
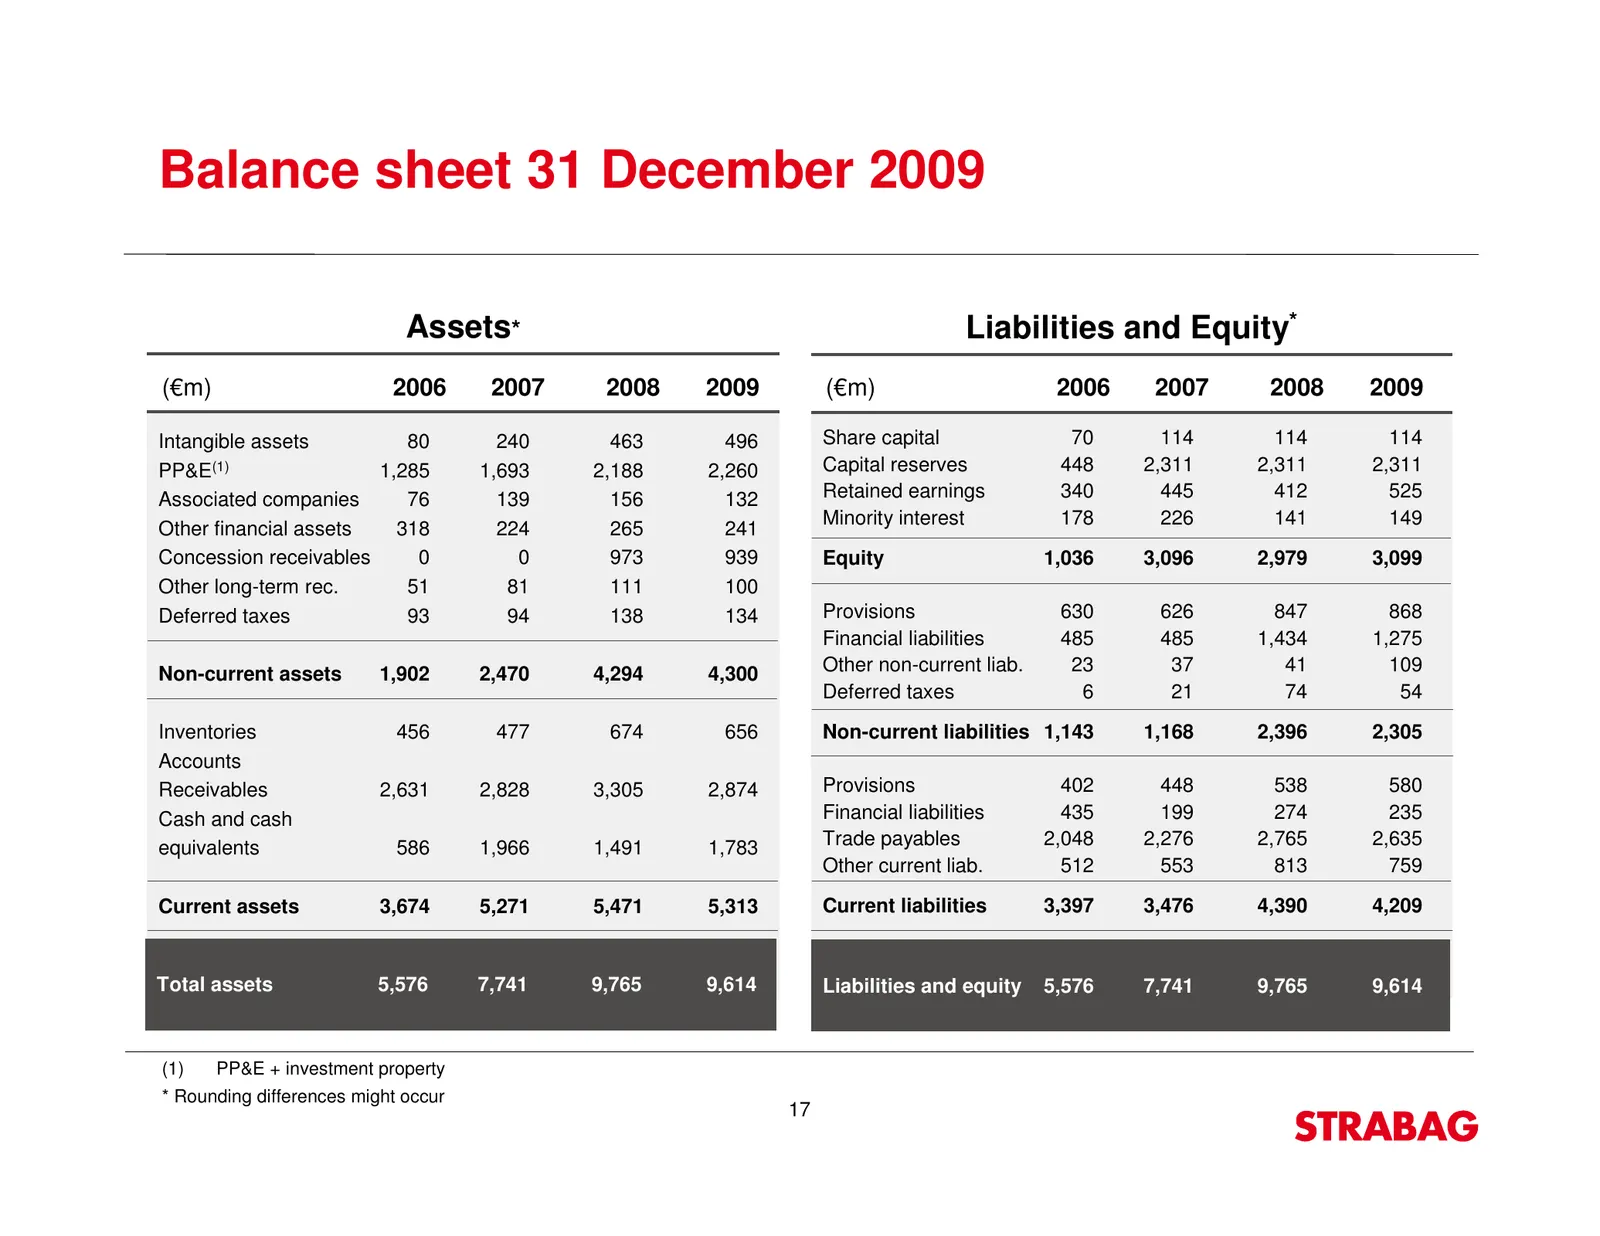
Balance sheet 31 December 2009 Assets* Liabilities and Equity* (€m) 2006 2007 2008 2009 (€m) 2006 2007 2008 2009 Intangible assets 80 240 463 496 Share capital 70 114 114 114 PP&E (1) 1,285 1,693 2,188 2,260 Capital reserves 448 2,311 2,311 2,311 Associated companies 76 139 156 132 Retained earnings

Slide 18: Flexibility is the measure of all things
FLEXIBILITY IS THE MEASURE OF ALL THINGS STRABAG Building Visions. Building Values. Building Europe.
Source: Internet Archive copy of strabag.com
More decks from Strabag SE
 Investor Presentation (November 2026)57 slides · November 2026
 9M 2026 Earnings Presentation18 slides · November 2026
 Investor Presentation (September 2026)40 slides · September 2026
 Investor Presentation (September 2026)40 slides · September 2026
 Investor Day (September 2026)104 slides · Sep 1, 2026
 Investor Presentation (September 2026)55 slides · September 2026