STORE Capital — Q3 2018 Earnings Presentation
57 slides from STORE Capital's earnings presentation, Nov 1, 2018
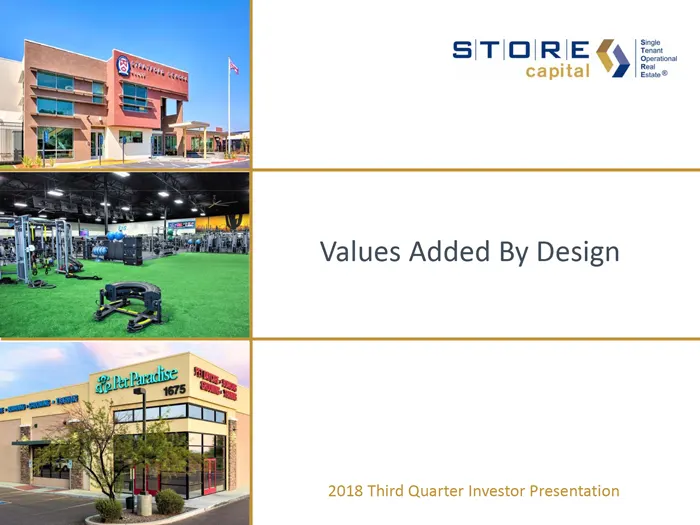
Slide 1: Values Added By Design
S|TIO\RIE & Values Added By Design
Slide 2: Disclaimer
STO EE DISCLAIMER SLL ‘THIS PRESENTATION CONTAINS FORWARD-LOOKING STATEMENTS WITHIN THE MEANING OF SECTION 27A OF THE SECURITIES ACT OF 1933, AS AMENDED, OR THE SECURITIES ACT, AND SECTION 21€ OF THE SECURITIES EXCHANGE ACT OF 1934, AS AMENDED, OR THE EXCHANGE ACT. SUCH INVESTMENT, FINANCING ANO LEA
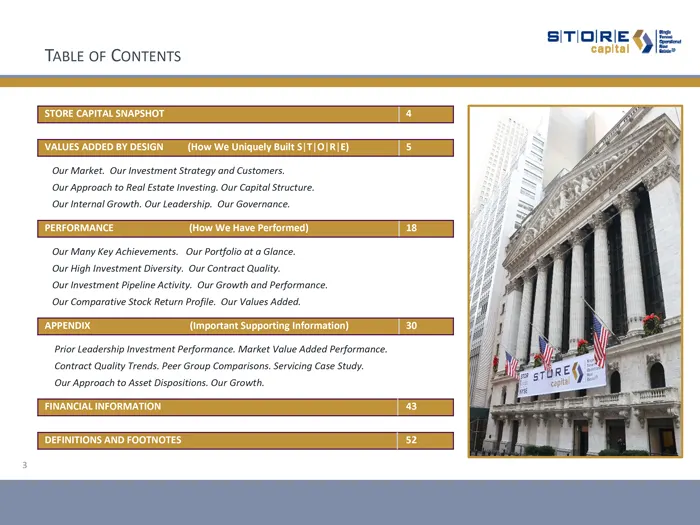
Slide 3: Table of Contents
SITIOIRIE |=. TaBLe OF CONTENTS IRIE Cyl ‘STORE CAPITAL SNAPSHOT VALUES ADDED BY DESIGN (How We Uniquely Built S[TIO1RIE) [5 (Our Market. Our Investment Strategy and Customers. (ur Approach to RealEstate Investing. Our Copital Structure. (Our internal Growth. Our Leadership. Our Governance. PERFORMA
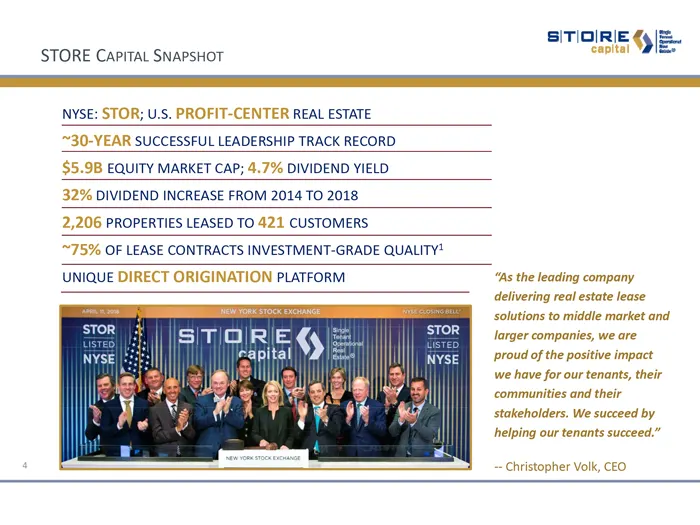
Slide 4: STORE Capital Snapshot
SITIOIRIE ‘capital iu STORE CAPITAL SNAPSHOT SLL NYSE: STOR; U.S. PROFIT-CENTER REAL ESTATE ~30-YEAR SUCCESSFUL LEADERSHIP TRACK RECORD. $5.9B EQUITY MARKET CAP; 4.7% DIVIDEND YIELD 32% DIVIDEND INCREASE FROM 2014 TO 2018 2,206 PROPERTIES LEASED TO 421 CUSTOMERS ~75% OF LEASE CONTRACTS INVESTMENT-GR
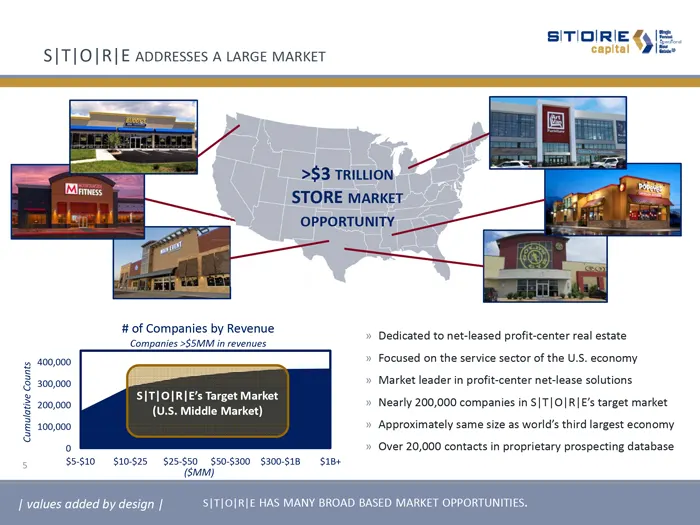
Slide 5: STORE Addresses a Large Market
SITIOIRIE {4 |= capital YD S|TIO|RIE ADDRESSES A LARGE MARKET >$3 TRILLION STORE MARKET OPPORTUNITY # of Companies by Revenue Companies >$5MM in revenues Dedicated to net-leased profit-center real estate 400,000 Focused on the service sector of the U.S. economy 300,000 Market leader in profit-center
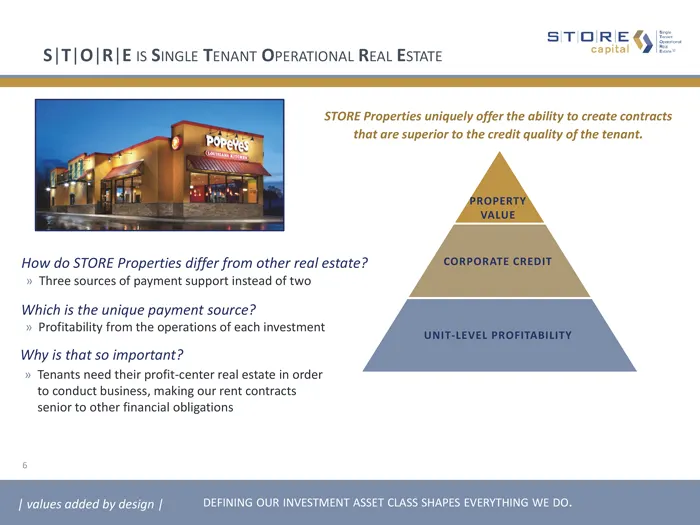
Slide 6: STORE Is Single Tenant Operational Real Estate
STORE): S|T|O|RJE Is SINGLE TENANT OPERATIONAL REAL ESTATE STORE Properties uniquely offer the ability to create contracts that are superior to the credit quality of the tenant. PROPERTY ‘VALUE How do STORE Properties differ from other real estate? » Three sources of payment support instead of two W
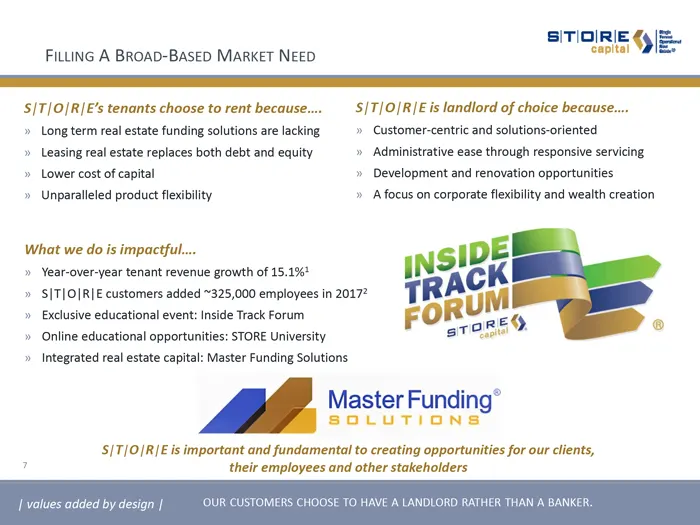
Slide 7: Filling a Broad-Based Market Need
SITIOIRIE €4 |= FILLING A BROAD-BASED MARKET NEED Us SE S|T/O/R|E’s tenants choose to rent becaus $/T/O/RIE is landlord of choice because. » Long term real estate funding solutions are lacking» Customer-centric and solutions-oriented » Leasing real estate replaces both debt and equity » Administrati
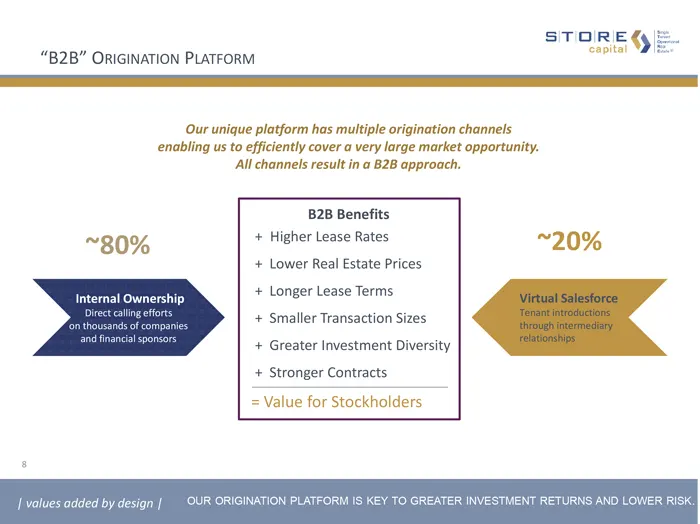
Slide 8: B2B Origination Platform
STORE (= capital “B2B” ORIGINATION PLATFORM Our unique platform has multiple origination channels enabling us to efficiently cover a very large market opportunity. All channels result in a 828 approach. B2B Benefits ~80% Higher Lease Rates ~20% Lower Real Estate Prices Longer Lease Terms Internal Ow
Slide 9: STORE's Diverse Customer Profile
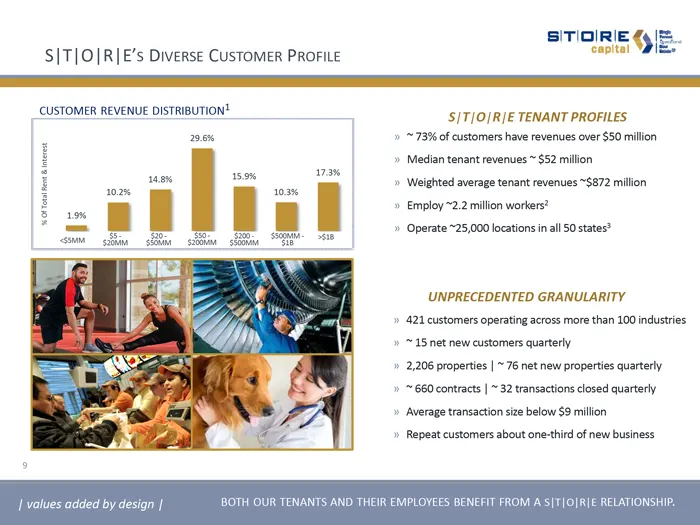
SITIOIRIE YE S|T|O|RIE’s Diverse Customer PROFILE capital: a ites CUSTOMER REVENUE DISTRIBUTION? 5/T|O[R/E TENANT PROFILES 296% » 73% of customers have revenues over $50 milion » Median tenant revenues ~ $52 milion 13% » Weighted average tenant revenues ~$872 milion | | all © moy"2.2 mln worn? =e |
Slide 10: Evidence-Based Real Estate Investing
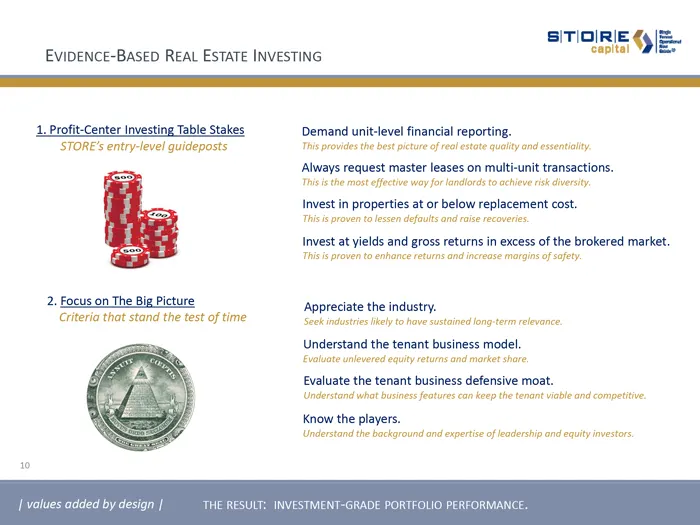
EVIDENCE-BASED REAL ESTATE INVESTING SITs OE 1, Profit-Center Investing Table Stakes STORE'S entry-level guideposts 2. Focus on The Big Picture Criteria that stand the test of time added by d Demand unit-level financial reporting. This provides the best picture of realestate quality end essentaity.
Slide 11: Evidence-Based Real Estate Investing
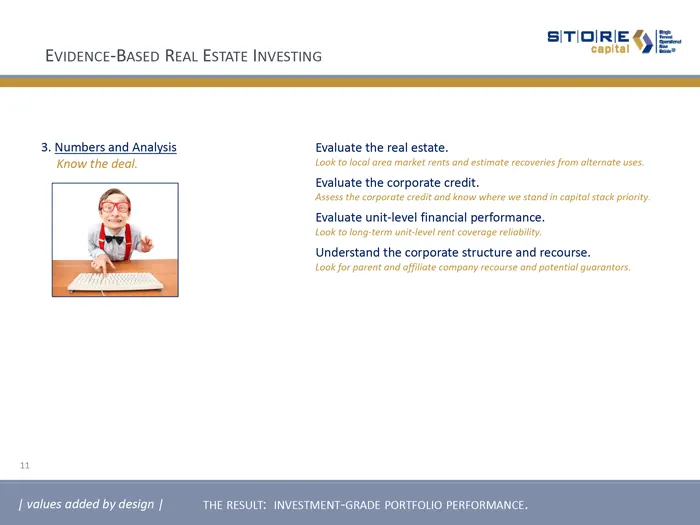
SITIOIRIE ¢) |=. EVIDENCE-BASED REAL ESTATE INVESTING IRIE SpE 3. Numbers and Analysis Evaluate the real estate. Know the deal. ook to loco area market rents ond estimate recoveries from alternate uses Evaluate the corporate credit. ‘Asses the corporate credit and know where we stand in capital stac
Slide 12: Capital Structure Leadership
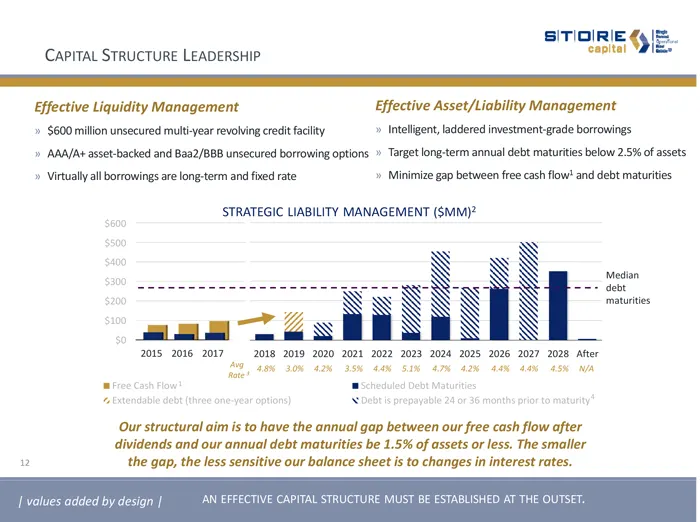
SITIOIRIE (y= CAPITAL STRUCTURE LEADERSHIP Sapttal aT Effective Liquidity Management Effective Asset/Liability Management » $600 milion unsecured multi-year revolving credit facility » Intelligent, laddered investment-grade borrowings » AAA/AC asset-backed and Baa2/B8B unsecured borrowing options »»
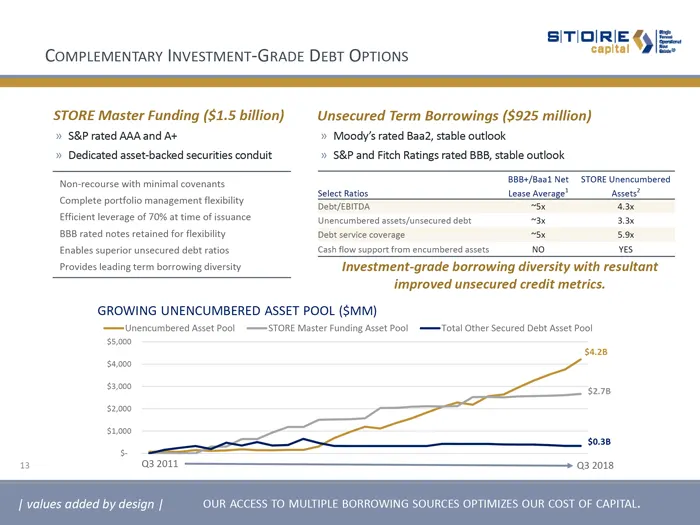
Slide 13: Complementary Investment-Grade Debt Options
CoMmPLeMENTARY INVESTMENT-GRADE Dest OPTIONS SITs OE STORE Master Funding ($1.5 billion) » S&P rated AAA and A+ » Dedicated asset-backed securities conduit Unsecured Term Borrowings ($925 million) » Moody's rated Baa2, stable outlook » S&P and Fitch Ratings rated 888, stable outlook ‘Non-recourse wi
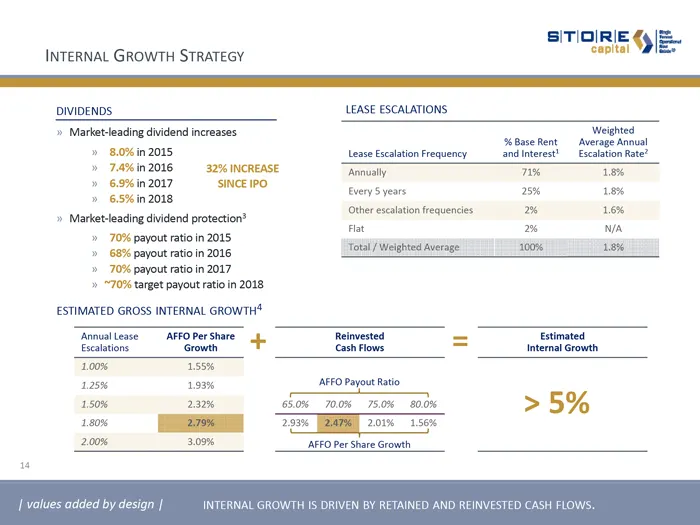
Slide 14: Internal Growth Strategy
SITIOIRIE (9 |=. INTERNAL GROWTH STRATEGY capital SE DIVIDENDS LEASE ESCALATIONS » Market-leading dividend increases Weighted Base Rent Average Annual > 80%in 2015, Lease scalation Frequency __andinterest!_ Escalation Rate" » 74%in2016 3236 INCREASE Ta 71% 7% » 69%in2017 SINCE IPO ened Every 5 years
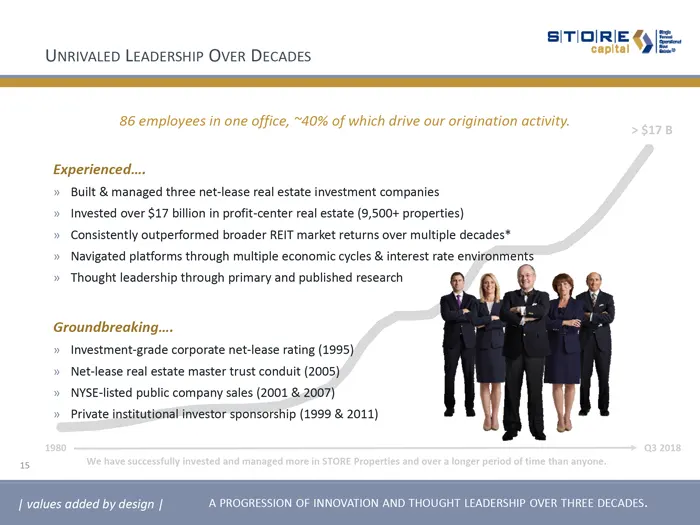
Slide 15: Unrivaled Leadership Over Decades
SITIOIRIE ‘capital ie UNRIVALED LEADERSHIP OVER DECADES | values added by design | 86 employees in one office, ~40% of which drive our origination activity. Experienced. » Built & managed three net-lease real estate investment companies » Invested over $17 billion in profit-center real estate (9,500
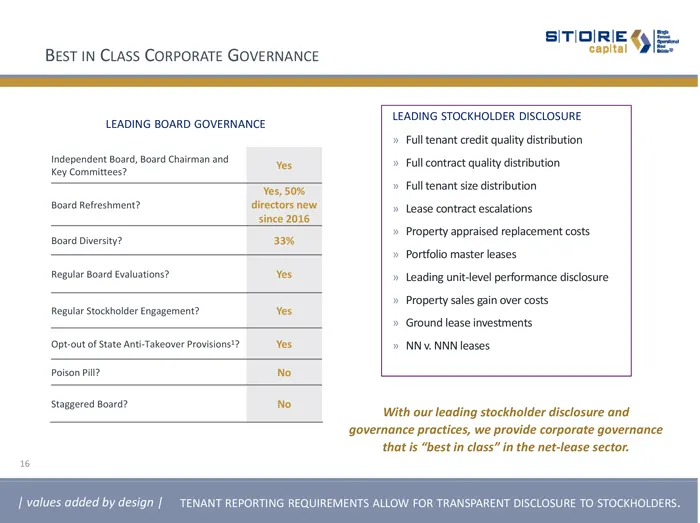
Slide 16: Best in Class Corporate Governance
SITIOIRIE |=. BEST IN CLASS CORPORATE GOVERNANCE tie OLE LeaoING soaRo GoveRNANCE LEADING STOCKHOLDER DISCLOSURE » Fulltenant credit quality dstrbution Independent Bo, oard Chairman and » Full contract quality dstibution Key Committees? = walty —— » Fulltenant size distribution oar Refreshment? rect
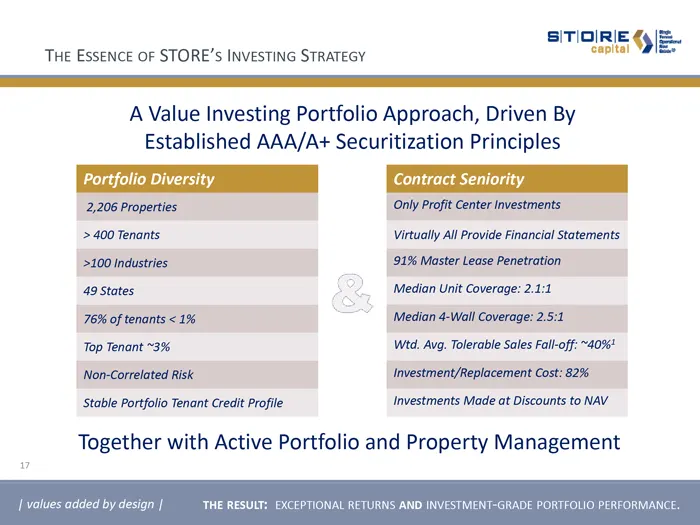
Slide 17: The Essence of STORE's Investing Strategy
SITIOIRIE THE ESSENCE OF STORE'S INVESTING STRATEGY lai A Value Investing Portfolio Approach, Driven By Established AAA/A+ Securitization Principles Portfolio Diversity Contract Seniority 2,206 Properties Only Profit Center Investments > 400 Tenants Virtually All Provide Financial Statements 100 ind
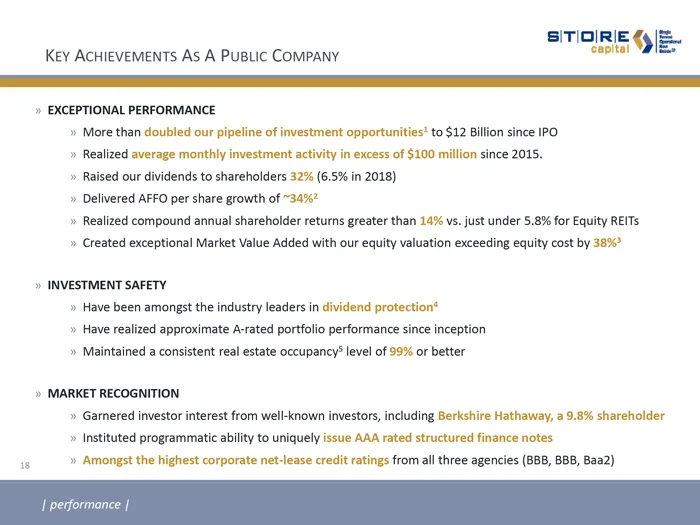
Slide 18: Key Achievements as a Public Company
SITIOIRIE ‘capital i Key ACHIEVEMENTS As A PuBLic COMPANY SLL » EXCEPTIONAL PERFORMANCE » More than doubled our pipeline of investment opportunities? to $12 Billion since IPO » Realized average monthly investment activity in excess of $100 million since 2015, » Raised our dividends to shareholders 3
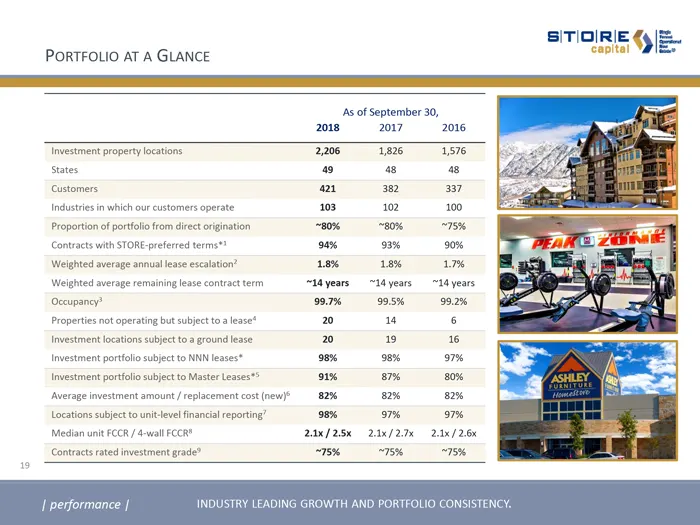
Slide 19: Portfolio at a Glance
SITIOIRIE & PORTFOLIO AT A GLANCE ‘sof September 30, 2018 2017 2016 Tavestment property locations 2206 ~~ ~—~=« STS states 0 48 4 Customers a ae 37 Industries in which our customers operate 103 100 Proportion of portfolio from direct exgination “0% 19% Contracts with STORE-preferred terms? 9% 90% We
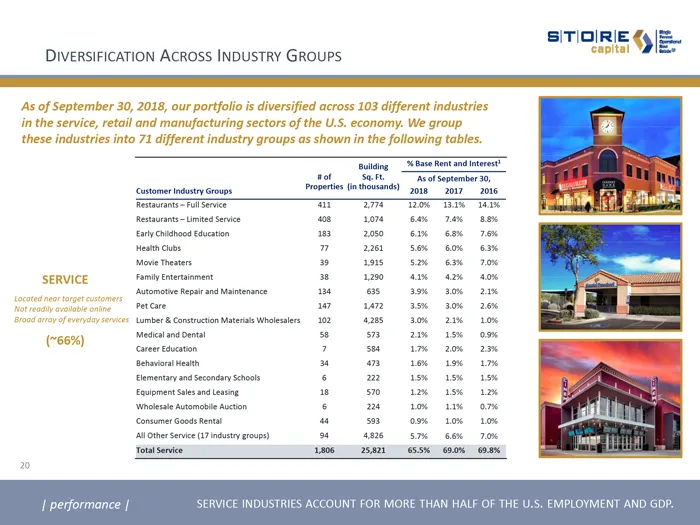
Slide 20: Diversification Across Industry Groups
SITIOIRIE i DIVERSIFICATION ACROSS INDUSTRY GROUPS Gahang base Reta tere fot Sa Ft asotseptenber30, Properties Gimthowsang) org sony 2016 Aesturants— Ute Seve ee ee ed tthe See (1 nut rs) 4826 57K GeK 20% otal sence 19062541655 GOK woaK | performance |
Slide 21: Diversification Across Industry Groups (Continued)
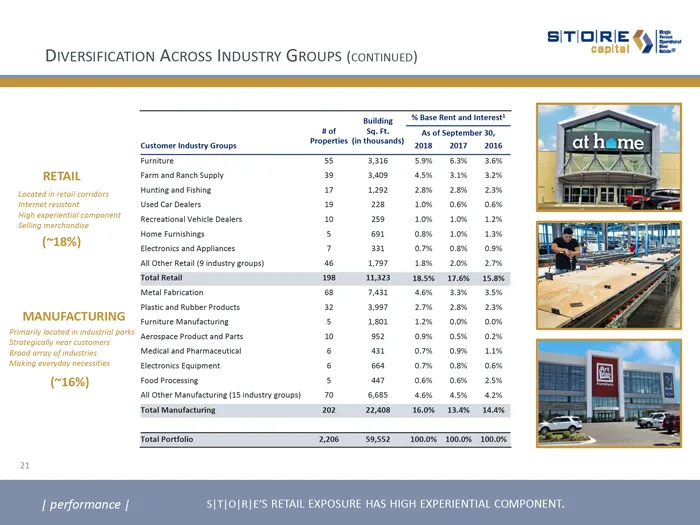
SITIOIRIE & DIVERSIFICATION ACROSS INDUSTRY GROUPS (conTINUED) sot Saft prof September, atom industry Groupe Properties (inthovsinds) gous 2017 2016 eros nd Appences > BL om 0mm om ‘omer Reta (inde rouge) 177 1B 20K 2% Totatreta 1983 ase ee as Lote Manutacuine(isindstyerouss) 708K aa Total Manicurin
Slide 22: Retail Portfolio Vitality in the Age of E-Commerce
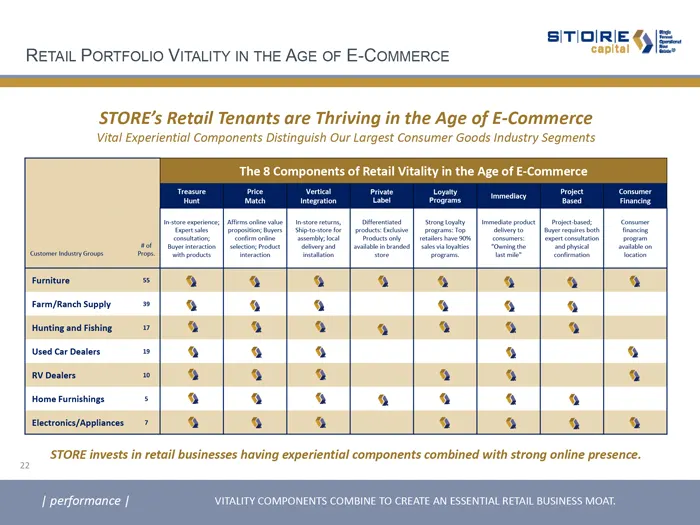
SITIOIRIE QE RETAIL PORTFOLIO VITALITY IN THE AGE OF E-COMMERCE Sapital aril STORE’s Retail Tenants are Thriving in the Age of E-Commerce Vital Experiential Components Distinguish Our Largest Consumer Goods Industry Segments The 8 Components of Retail Vitality in the Age of E-Commerce Frntare s[ a r
Slide 23: Top Customers
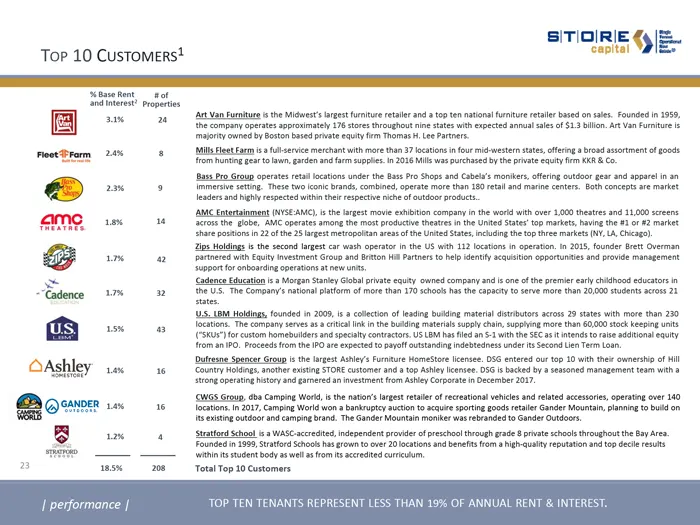
SITIOIRIE 9 |= Top 10 Customers* IRIE Cy E- Sedinerest popes die an. Att Van sures the Micwess target untueretaler ad top ten atonal future retarted on ale. Founded in 95, {he company operates sproumatey 176 stares trouphou rine tats wth expected aa ses f $1.3 bllon. rt Van furtare e mao owned ty Bo
Slide 24: Diversification Across Geographies
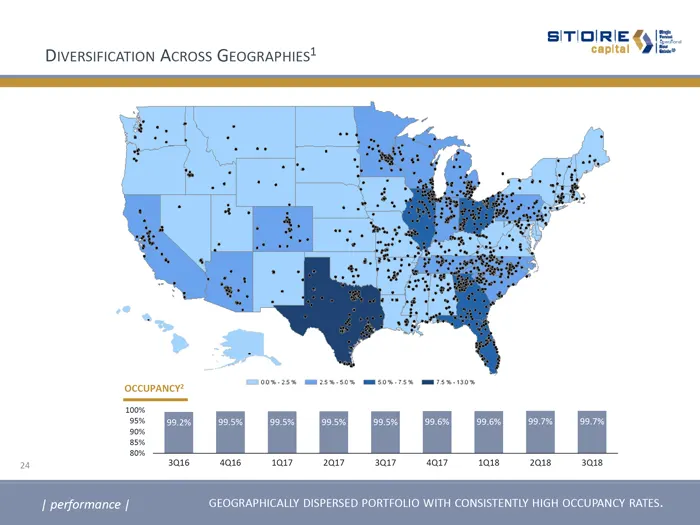
STORE OIE DiversiFICATION Across GEOGRAPHIES? ‘occuPANcY? 2 sae 40i6 =n? ayant 38 | performance | GeoGR
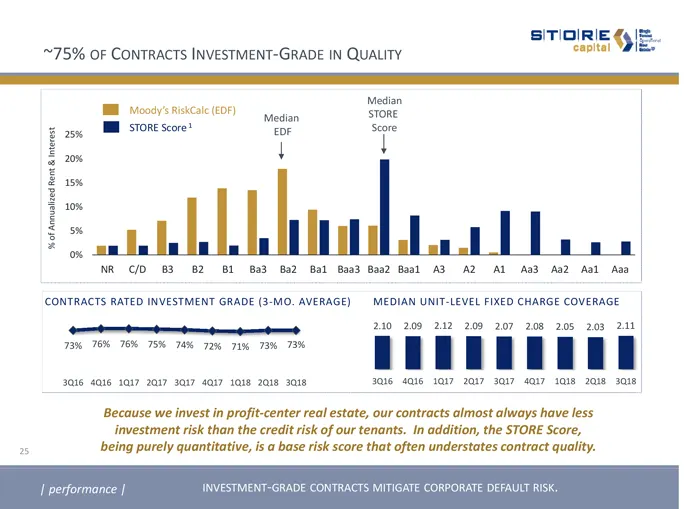
Slide 25: ~75% of Contracts Investment-Grade in Quality
SITIOIRIE (|=. “75% OF CONTRACTS INVESTMENT-GRADE IN QUALITY seal Median WE Moody's RSKCAICLEDA) bagi STORE asx BE STORE Score? EOF tT ‘of Annalzed Ret & interest # | | | | | | | | a hat tt ol Gs) fat fel tu Gad Om M2 Mat Ad Mat om | CONTRACTS RATED INVESTMENT GRADE (-MO. AVERAGE) MEDIAN UNIT.LEVEL
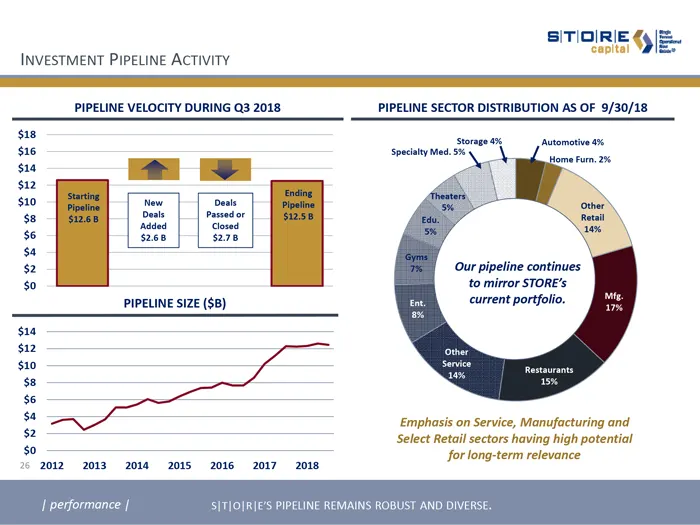
Slide 26: Investment Pipeline Activity
SIT) = rte OE INVESTMENT PIPELINE ACTIVITY PIPELINE VELOCITY DURING Q3 2018 PIPELINE SECTOR DISTRIBUTION AS OF 9/30/18 sia Storage 4% automotive 4% $16 Specialty Med. 5% sia $10 $s nasea || "Cone $6 $268 $278 $4 82 $0 Deal ur pipeline continues to mirror STORE’s PIPELINE SIZE ($B) current portfolio.
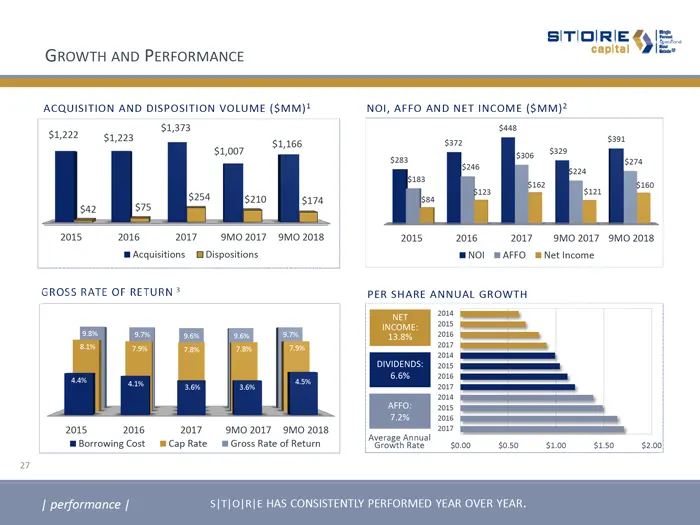
Slide 27: Growth and Performance
GROWTH AND PERFORMANCE SITIDIRIE 9 E- ACQUISITION AND DISPOSITION VOLUME ($MM)! $1373 $122 7 $1223 — 20820162017 Acquisitions MOiepositions 9M0 2017 902018 GROSS RATE OF RETURN? 2015-2016 -——«2017--9MO2017 9MO 2018 ‘Borrowing Cost m Cap Rate Mm Gross Rate of Return | performance | NOI, AFFO AND NET
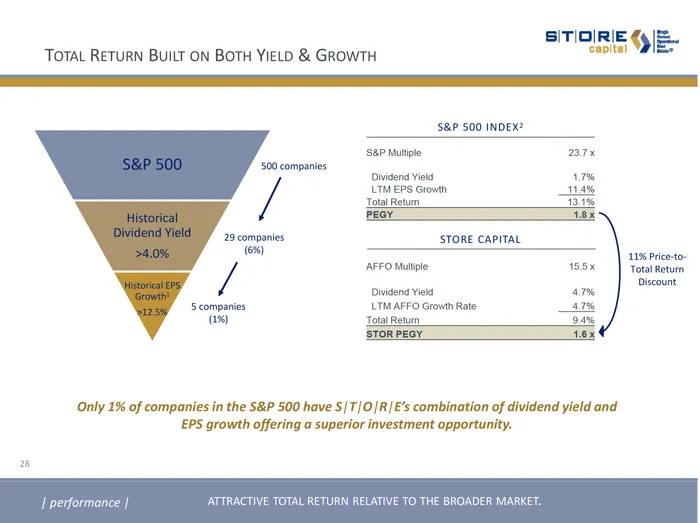
Slide 28: Total Return Built on Both Yield & Growth
SITIOIRIE ¢y |=. TOTAL RETURN BUILT ON BOTH YIELD & GROWTH septal S&P 500 INDEX? SAP Muttple 2arx 500 companies Dividend Vets 17% LIM EPS Growth 11.4% 73.1% 1B 28 companies STORE CAPITAL (a FD are riceto- / AFEO Mutiple 155x | TotatRewn Discount hvidend Vets 47% Scompanies LIM AFFO Growth Rate 47% (
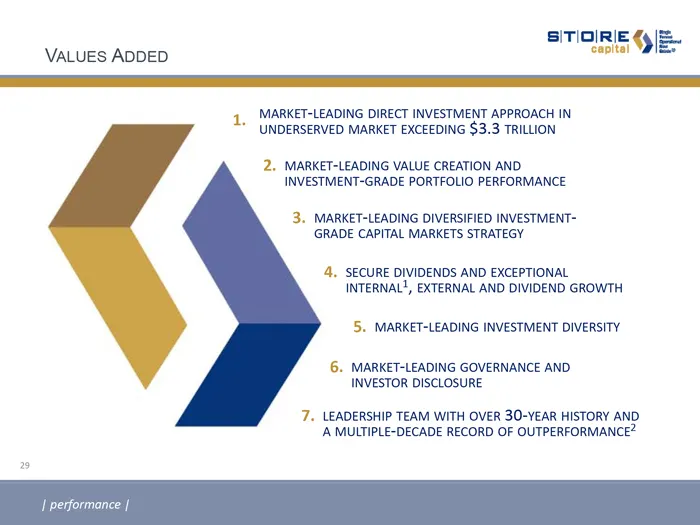
Slide 29: Values Added
SITIOIRIE ¢ |= VALUES ADDED TORE OE 41, MARKET-LEADING DIRECT INVESTMENT APPROACH IN * UNDERSERVED MARKET EXCEEDING $3.3 TRILLION 2. MARKET-LEADING VALUE CREATION AND INVESTMENT-GRADE PORTFOLIO PERFORMANCE 3. MARKET-LEADING DIVERSIFIED INVESTMENT- GRADE CAPITAL MARKETS STRATEGY 4, SECURE DIVIDENDS A
Slide 30: Appendix
S|TIO\RIE & Appendix
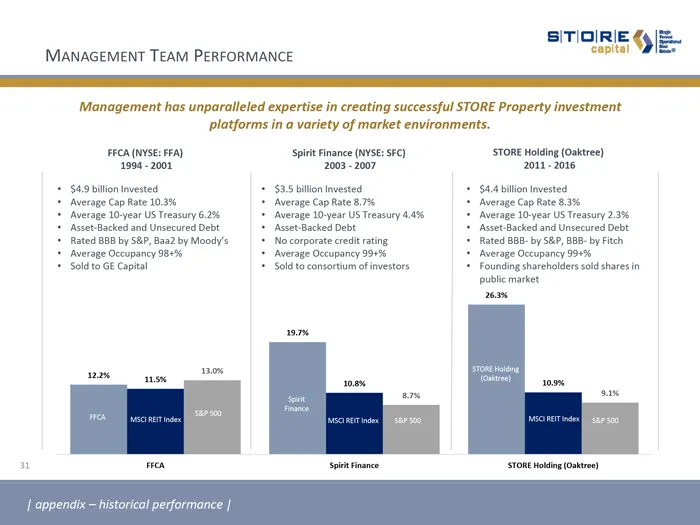
Slide 31: Management Team Performance
SITIOIRIE & MANAGEMENT TEAM PERFORMANCE Management has unparalleled expertise in creating successful STORE Property investment platforms in a variety of market environments. FCA (NYSE: FFA) Spirit Finance (NYSE: Sc) STORE Holding (Oaktree) 13994-2001 2003-2007 2011-2016 + $43 billion invested + $35
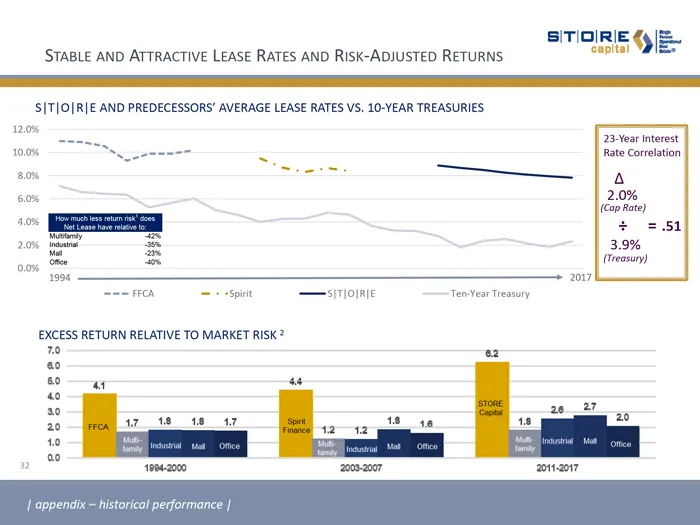
Slide 32: Stable and Attractive Lease Rates and Risk-Adjusted Returns
SITIOIRIE ¢) |. STABLE AND ATTRACTIVE LEASE RATES AND RISK-ADJUSTED RETURNS cape) ie S|T|O|R|E AND PREDECESSORS’ AVERAGE LEASE RATES VS. 10-YEAR TREASURIES 12.0% 23:-Year Interest - a al = ‘ a Treas oom (Treasury) = wo PACES RETURN REATVETO MARKET IK? < : 5 & a0 208? 18 20 S 2 1904-2000 2008-2007 11
Slide 33: Marginal Equity Returns on Net Lease Real Estate Investments
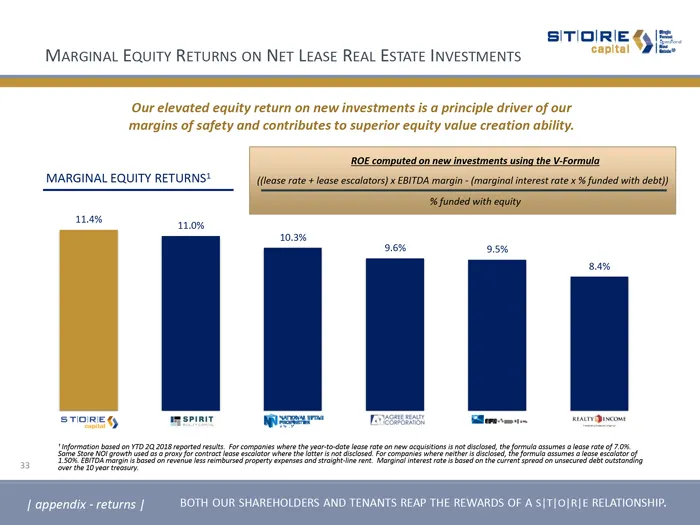
SITIDIRIE & MARGINAL EQuity RETURNS ON NeT LEASE REAL ESTATE INVESTMENTS = eee Pa TE MARGINALEQUITY RETURNS! | (lease rate las scletors)x EBITDA margin marging interest rate x3 funded with debt) Sefunded with eaity 4% nae 103% STORE om Toren ANDO [appendix-returns | __ BOTH OUR SHAREHOLDERS AND TENA
Slide 34: Comparative Value Creation STORE vs. Peers
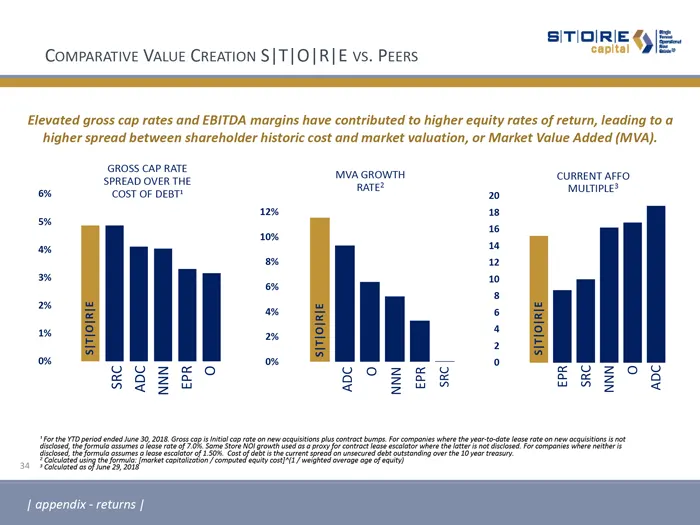
SITIOIRIE ‘capital iu Comparative VALUE CREATION S|T|O|RIE vs. PEERS Elevated gross cap rates and EBITDA margins have contributed to higher equity rates of return, leading to a higher spread between shareholder historic cost and market valuation, or Market Value Added (MVA). Spread oven tHe Men crgw
Slide 35: Consistent Contract Quality
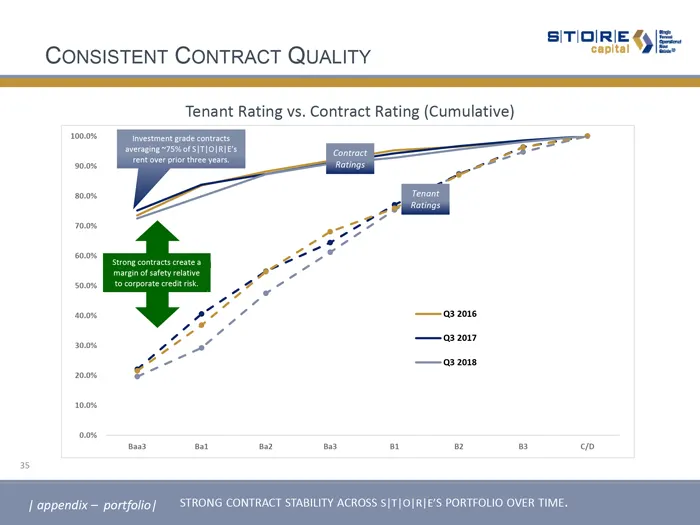
SITIOIRIE €y|E- CONSISTENT CONTRACT QUALITY seas Tenant Rating vs. Contract Rating (Cumulative) os on en os eo a = co TABILITY ACROSS
Slide 36: High Quality Portfolio
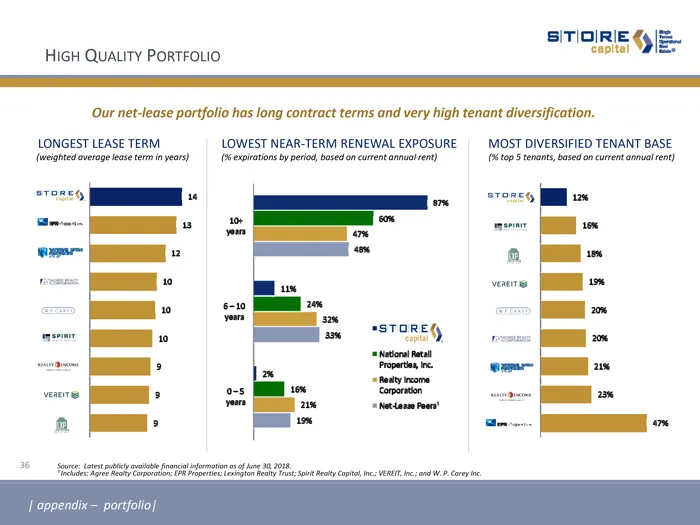
SITIOIRIE ¢9 |=. HIGH QUALITY PORTFOLIO IRIE SE ‘Our net-lease portfolio has long contract terms and very high tenant diversification. LONGEST LEASE TERM LOWEST NEAR-TERM RENEWAL EXPOSURE (weighted averoge los term in years) MOST DIVERSIFIED TENANT BASE. (;exprations by peri, bosed on current onnual
Slide 37: Strong Protected Dividend Growth
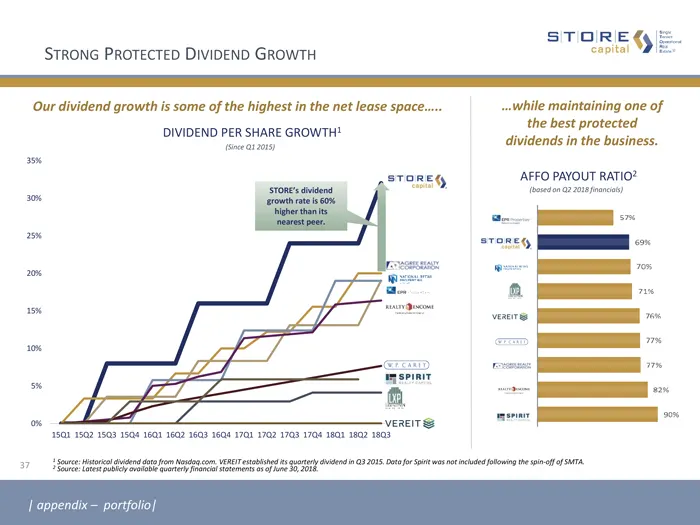
STRONG PROTECTED DIVIDEND GROWTH aaa /hile maintaining one of the best protected dividends in the business. Our dividend growth is some of the highest in the net lease spac DIVIDEND PER SHARE GROWTH? (sea 2015) om storey ‘AFFO PAYOUT RATIO? = fh VEREITS. 17 Serangoon rio com, end ae tr 8 05 oS ot to
Slide 38: Case Study: National Restaurant Chain Bankruptcy
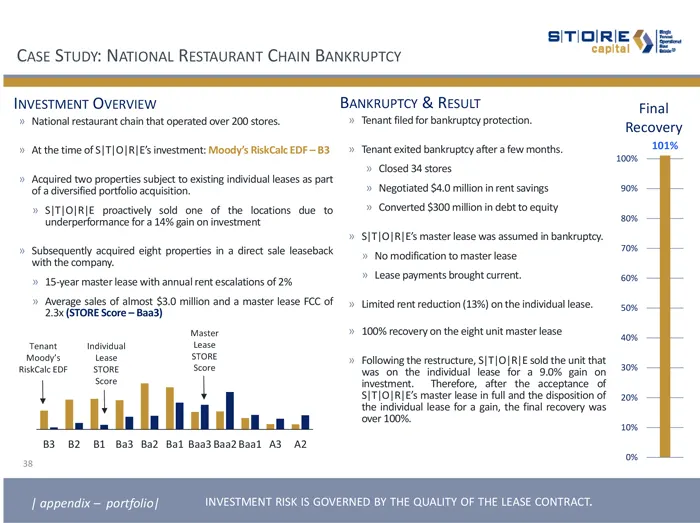
sirielgts OE CASE STUDY: NATIONAL RESTAURANT CHAIN BANKRUPTCY ee INVESTMENT Overview BANKRUPTCY & RESULT fil » National restaurant chan that operated over 200 tres > Tenant fled for bankrupt protection. Eon > Atthetime of TIOIRIESimestment: Mood RisKCacEDF~83_» Tenantextedbanrupty after afew months
Slide 39: Value Added Through Portfolio Management
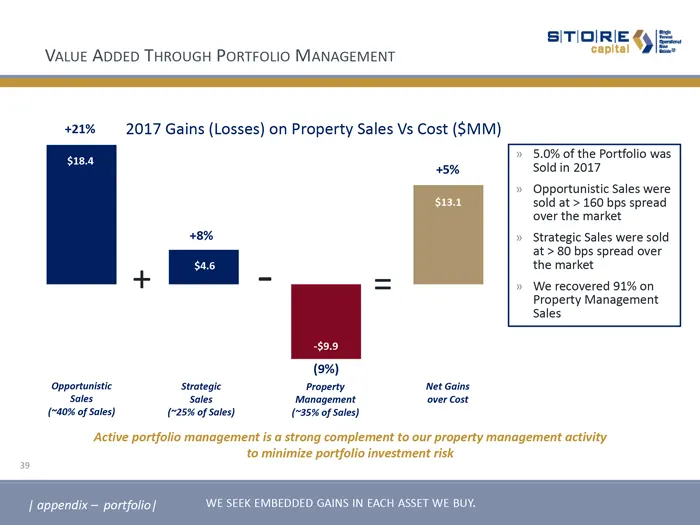
SITIOIRIE ¢) |. VALUE ADDED THROUGH PORTFOLIO MANAGEMENT caplel ee 421% 2017 Gains (Losses) on Property Sales Vs Cost ($MM) > 5.0% of the Portfolio was ssa 45% Sold in 2017 >» Opportunistic Sales were sia sold at > 160 bps spread over the market 19% » Strategic Sales were sold at > 80 bps spread ove
Slide 40: Internal Growth in Perspective
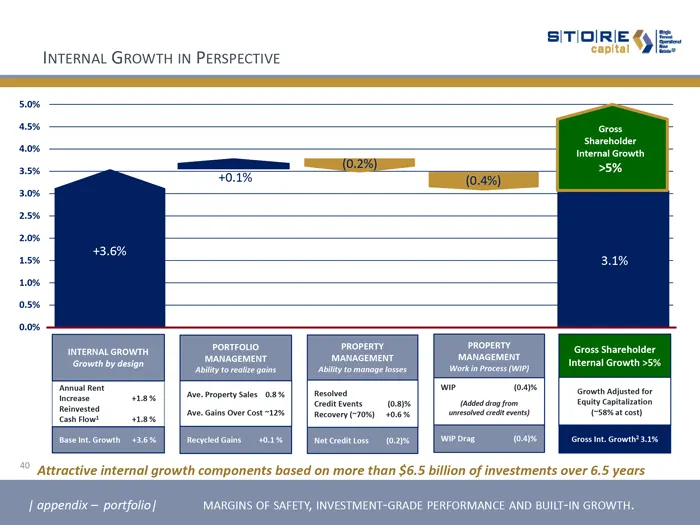
SITIOIRIE & INTERNAL GROWTH IN PERSPECTIVE eed (0.2%) INTERNAL GROWTH FORTFOUO. aw Gross Sharehold ‘Growth by design ees Peay Internal Growth >5 ‘Abity to rele as (oar ase com 13.6% [I eyed ais Net creat toss (0.274 Attractive internal growth components based on mo [appendix — portfolio| MARGINS OF
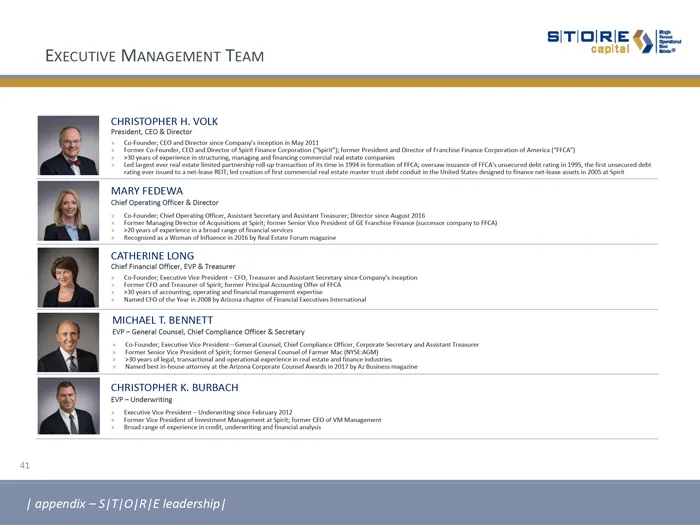
Slide 41: Executive Management Team
EXECUTIVE MANAGEMENT TEAM te V CHRISTOPHER H. VOLK ‘abe cfasezincnthtsoentonctorememncuesoan treme stesso ae Soper eae MARY FEDEWA. het pet ter Over ‘CATHERINE LONG. [MICHAEL T. BENNETT {= Gann Cl Conlaes Oe Saray CHRISTOPHER K. BURBACH ESfngeelown ca ntgatanssasns mem | appendix - S|T/O/RJE leaders
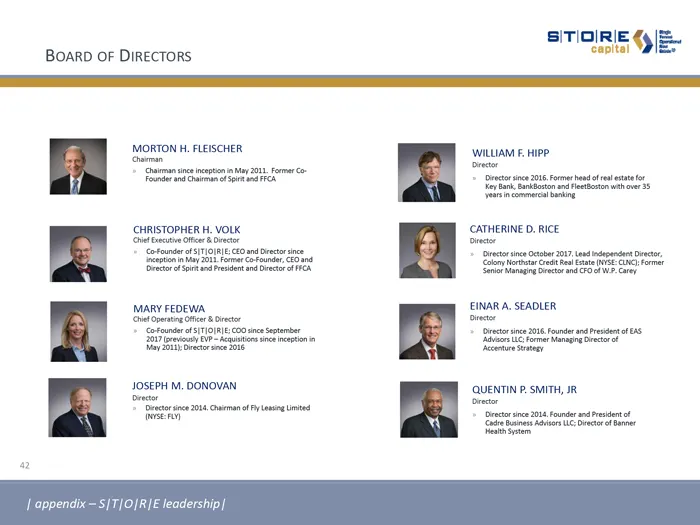
Slide 42: Board of Directors
Boarb oF DIRECTORS MORTON H. FLEISCHER. ‘ama gent My 201, fee Co- ‘Sandra tata Sp ack WILLIAM F. HIP. eta anton aa etsan oho CHRISTOPHER H. VOLK ‘CATHERINE D. RICE (fein of ILO) an rea nce ‘rato sine Otter 2017 anand Dea lid Beecort Spt andre snd Bec Ve Soe pense oe EINAR A. SEADLER SS ie rego MARY
Slide 43: Financial Information
SITIOIRIE <y Financial Information
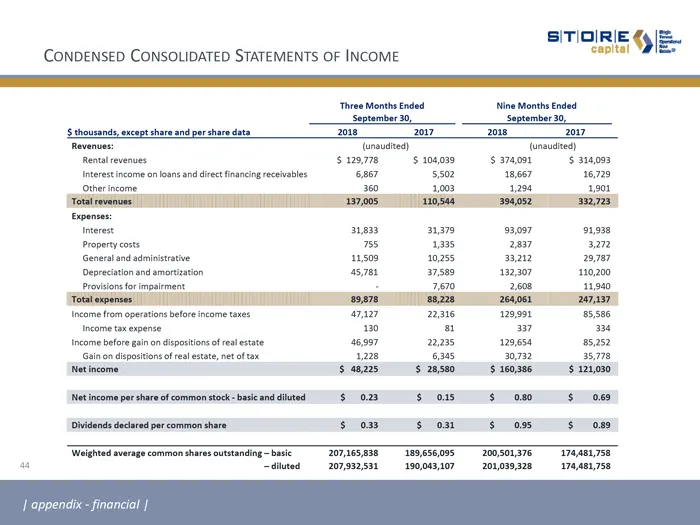
Slide 44: Condensed Consolidated Statements of Income
SITIOIRIE ‘capital CONDENSED CONSOLIDATED STATEMENTS OF INCOME ° LLL ‘Thre Month Ended in Month nad September 30, Septomber30, Showed excep share and per share data 7a = 78 2a arene: rere) (onaades) era reverues Sm97@ $1043 Sa74on——§ 284003 Interest incre on ons nd ect acing eehables 67 5502 18667 1
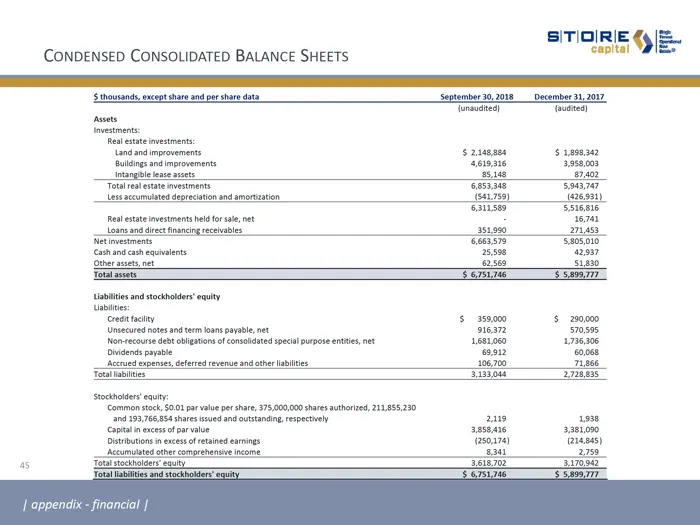
Slide 45: Condensed Consolidated Balance Sheets
SITIOIRIE <9 |E- CONDENSED CONSOLIDATED BALANCE SHEETS cape) ie thousands except sar and pe share data Seoember 30,2018 __acmber 51,2017 Tunsuatec) ‘austed) {and and improvements $ 2asnaee 5 sasaaee Bulg: ainprovements Seisais Basan: inangbelese sets 8 57402 “Totes esate vestnens Sasa So03787 Less a
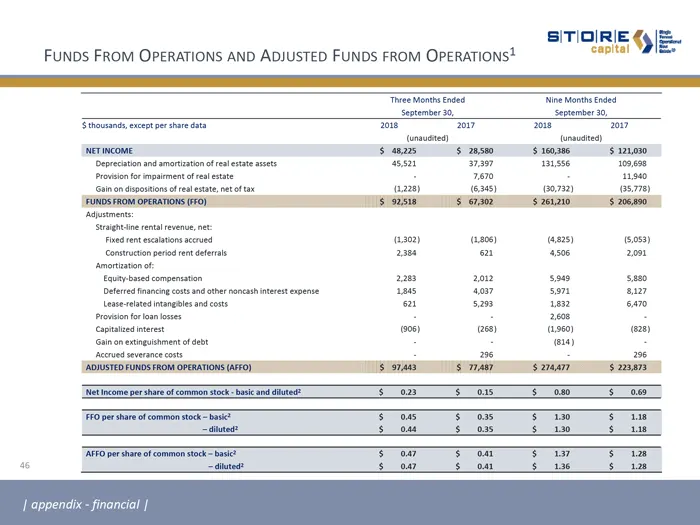
Slide 46: Funds from Operations and Adjusted Funds from Operations
FUNDS FROM OPERATIONS AND ADJUSTED FUNDS FROM OPERATIONS? SLL Seater 3 September 30, ‘Fitouanas cep peta de 78 Esa en a (wrmustes) (urauttes) verincome 8 ass Sms Sima $ L080 Depression andamartaston fel este eats 5501 37397 S86 109.658 ‘oven for tnptnnent fea eae . 7670 : 1900 Guinondpestions fel es
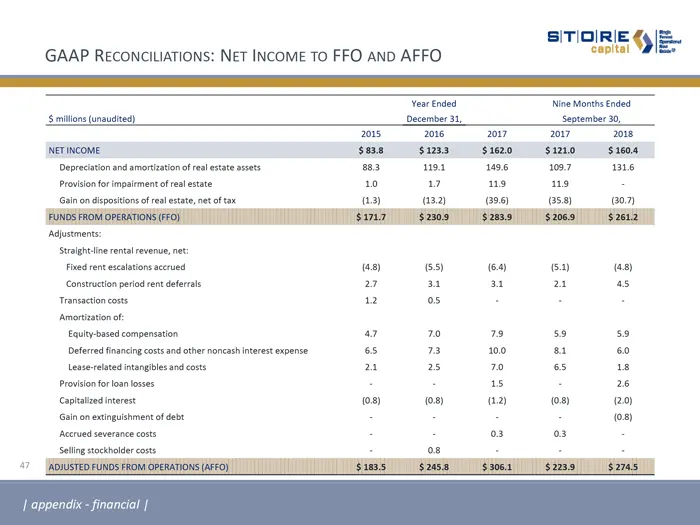
Slide 47: GAAP Reconciliations: Net Income to FFO and AFFO
SITIOIRIE ¢ |=. GAAP RECONCILIATIONS: NET INCOME TO FFO AND AFFO capital Wie Year Ended Nine Monthe Ended S illon (unaudited) December 31, September 30 2015 2016 3017 3017 2018 INETINCOME $38 $1233 $1820 Sato S604 Depreciation and amortisation of esl ett 83 nea 196 1087 118 Prosi for impalement of r
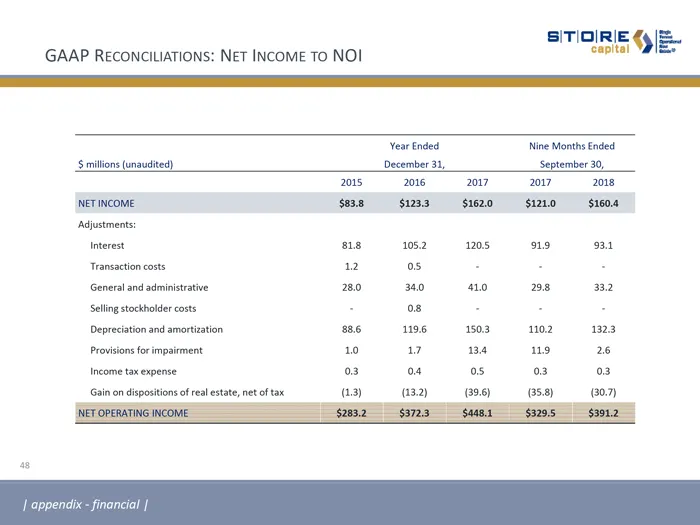
Slide 48: GAAP Reconciliations: Net Income to NOI
SITIOIRIE ¢ |= GAAP RECONCILIATIONS: NeT INCOME To NOI 15s OE Year Ended Nine Months Ended $ millions (unaudited) December 31, September 30, 2015 2016 2017 2017 2018 NETINCOME ges $1233 $1620 S210 ($160.8 Adjustments Interest as 10521205 a9 oan Transaction costs a2 os . : . General and administrativ
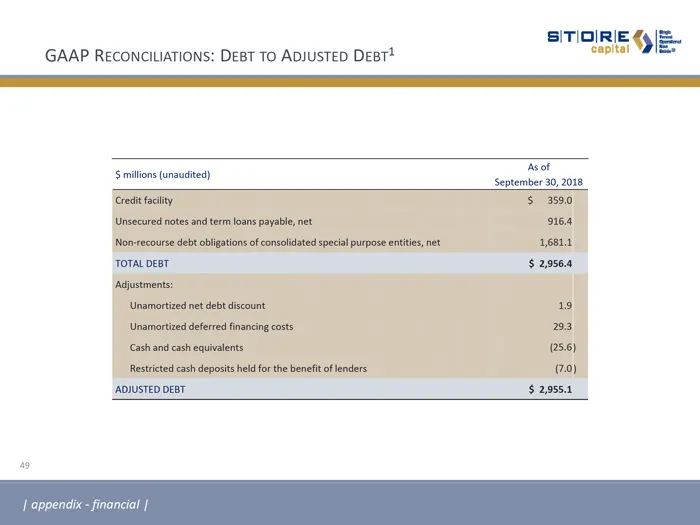
Slide 49: GAAP Reconciliations: Debt to Adjusted Debt
SITIOIRIE & GAAP RECONCILIATIONS: DEBT To AduusTeD Deet* $ milions (unaudited) ae September 30, 2018 “Credit faity 3 3590 ‘Unsecured notes and term loans payable, net o164 "Non-recourse debt obligations of consolidated special purpose entities, net 4681.1 TOTAL DEBT $ 2,956.4 Adjustments: ‘Unamortiz
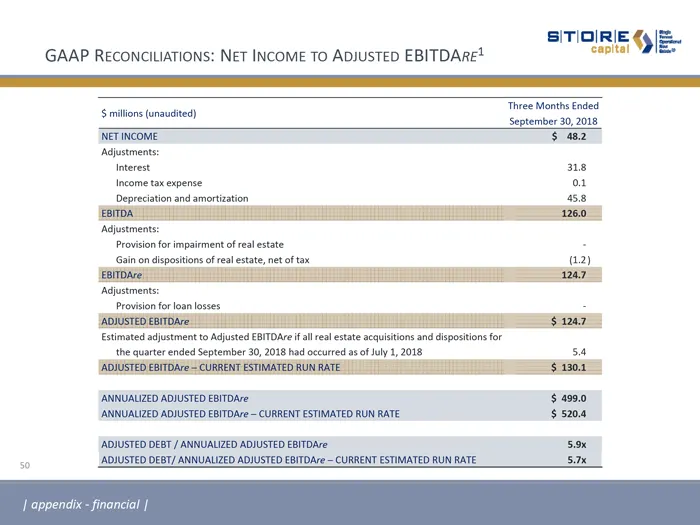
Slide 50: GAAP Reconciliations: Net Income to Adjusted EBITDAre
SITIOIRIE €y|E- GAAP RECONCILIATIONS: NET INCOME To ADJUSTED EBITDARE* capil SLL Thee Mont ded $ milion (unaudited) on NETINCOME $ a2 Adjustments: interest. ne Income tax expense = Depreciation and srortzatin 358 bebo OOH Sue ago. Adjustment: Provision for impart of rel estate . Gain on dapostons of
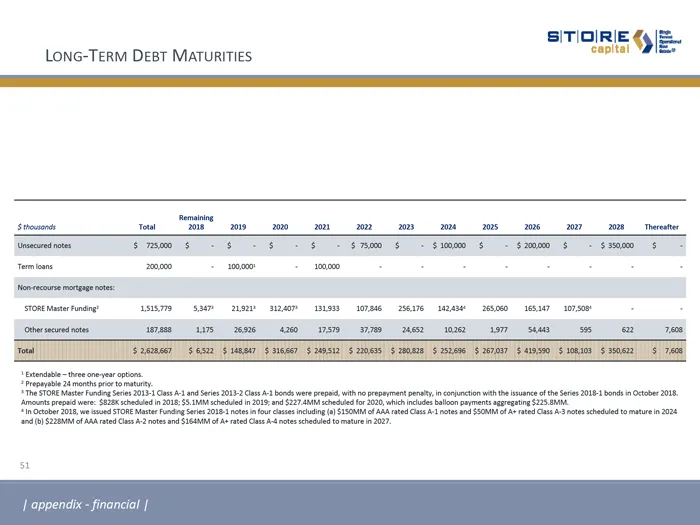
Slide 51: Long-Term Debt Maturities
IRIE y=. LonG-TeRM Deer MATURITIES 1S OE saat roa “TaieS ignorant tots 20H anaes Smo s $$ - 5 - snow $ - Simm $ sams suum 5 - enc manent: STORE Mater fd 1sis7% Samra) andor ian) Sorat ENTE AeA SOD STS Coed ime utes ao sn mementos “Penn not roar “The STOR Maser ing Ste 2191.0 and eres 2012 Cs en nt p
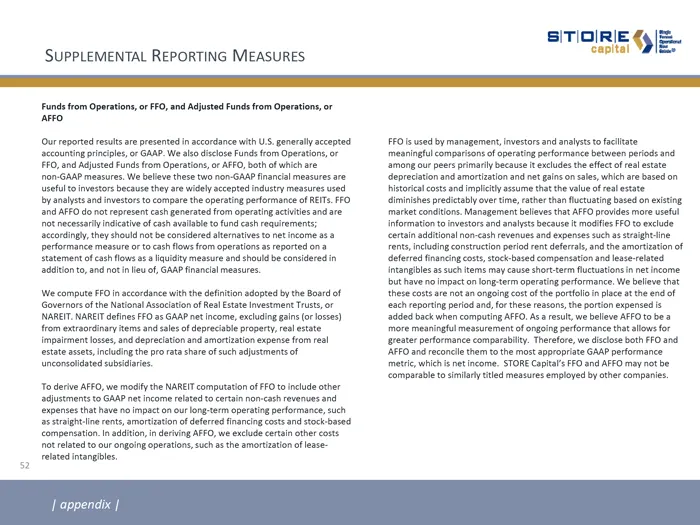
Slide 52: Supplemental Reporting Measures
SUPPLEMENTAL REPORTING MEASURES Funds from Operations or FF, and Adjusted Funds from Operations or (ur reported results are presented in accordance with US. generally accepted sccounting rincpes or GAAP. We alo dacore Funds rom Operation, oF FO, and Aajsted Funds fom Operations, or AFFO, bath of whi
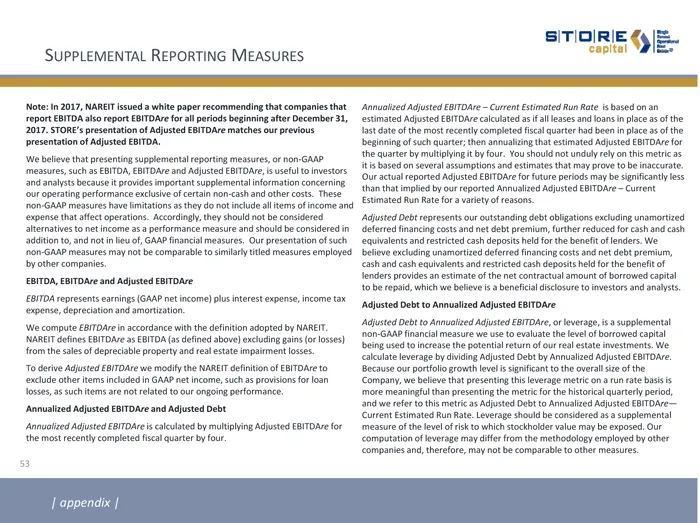
Slide 53: Supplemental Reporting Measures
‘SUPPLEMENTAL REPORTING MEASURES Smolin SOE "Not: n 2017, NARET issued a whitepaper recommending that companies that report EBITDA alo report EBITDAre forall periods begining after December 31, 2017. STORE's presentation of Adjusted EBITOAre matches our previous ‘resentation of Ajusted EBITDA, ‘We b
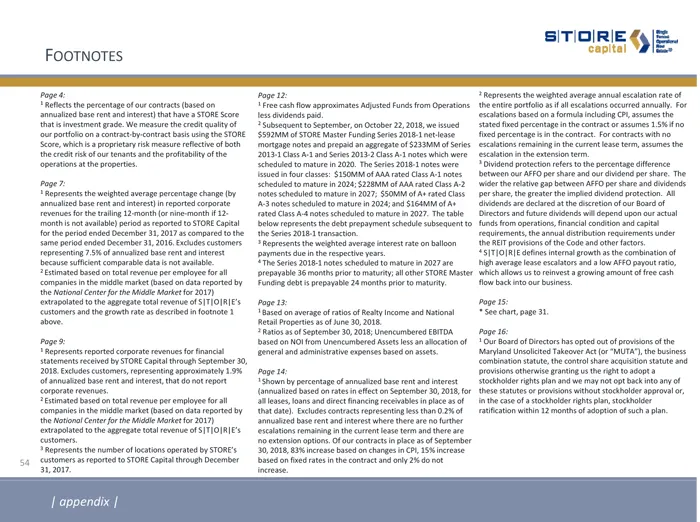
Slide 54: Footnotes
FooTNoTEs Pose "aes teprcentoe our cota asedon saualued bare ror ares tthe 3 STORE Sore ‘hate estnen pace Weresr teat uly ot ‘urpaoio ons oma by coro ung the STORE Sore china opty mesure eect bh ‘ecco tears andthe pray othe pase ‘epresethe weighs vera percentage chang snnated bern ona etre) rope cer
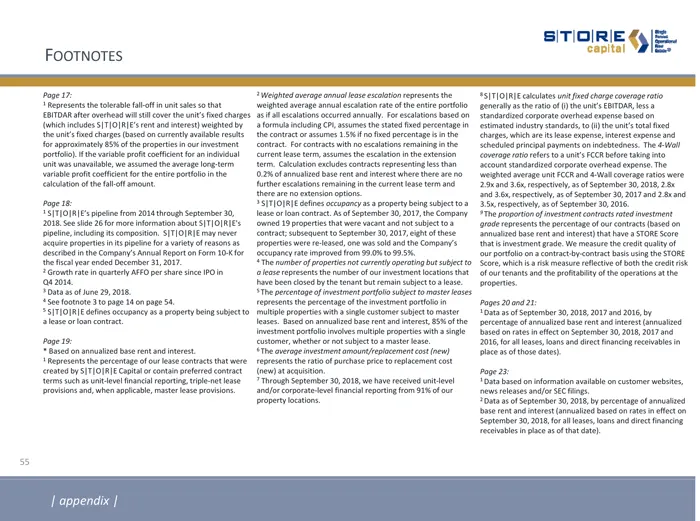
Slide 55: Footnotes
FOOTNOTES TOI OE Pape 7 ‘egress the tka af int sss that {wton ness TIO Reser ana eters wee by ‘Beene ted ener sea on covery aisle ets {er approumoty 3 the propertsin aurea foots) evar prof cuter onal ‘nb oft coticest forthe entre otloin the Pape 18 "SITOIRIes pene ram 204 ou Septeer 30, 201 Ses ofor
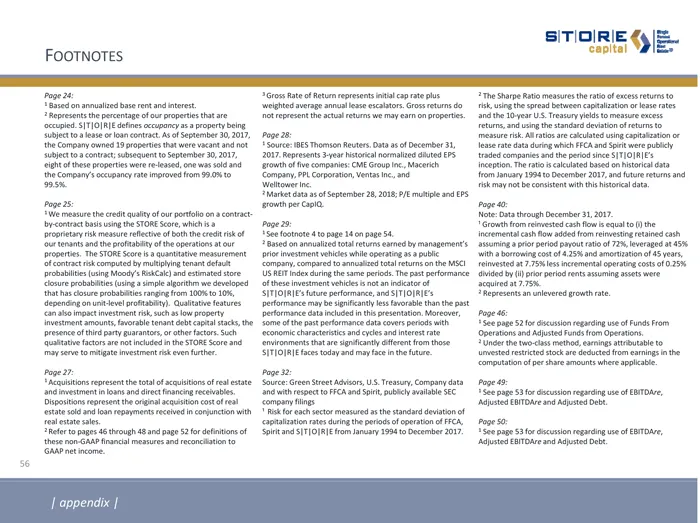
Slide 56: Footnotes
FOOTNOTES Smolin SOE eed on aang base ret an ‘egress percentage fr proper hat ae ‘seep 510A Sees ccapaney a property Deg Ste alu eo cotoce At Setrb0207, the amour owned 9 rete tre wat an ot Sbjct» conc subsequent to September 30207 ‘Semel ese opris wr rete oe wa a ‘congo ozmey ae inerevs om ost Nts
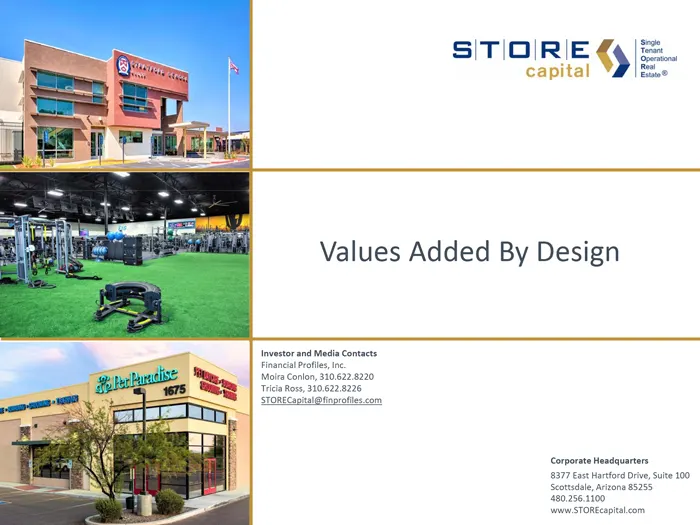
Slide 57: Values Added By Design
SITIOIRIE <y Values Added By Design
Source: SEC EDGAR · 8-K filed Nov 1, 2018
More decks from STORE Capital Corp
 Q2 2023 Earnings Presentation10 slides · Aug 4, 2023
 Q2 2022 Earnings Presentation26 slides · Aug 3, 2022
 Q2 2022 Earnings Presentation22 slides · Aug 3, 2022
 Q1 2022 Earnings Presentation26 slides · May 4, 2022
 Q1 2022 Earnings Presentation22 slides · May 4, 2022
 Q4 2021 Earnings Presentation33 slides · Feb 23, 2022