Miller Energy Resources — Investor Presentation (February 2014)
22 slides from Miller Energy Resources's investor presentation, Feb 12, 2014
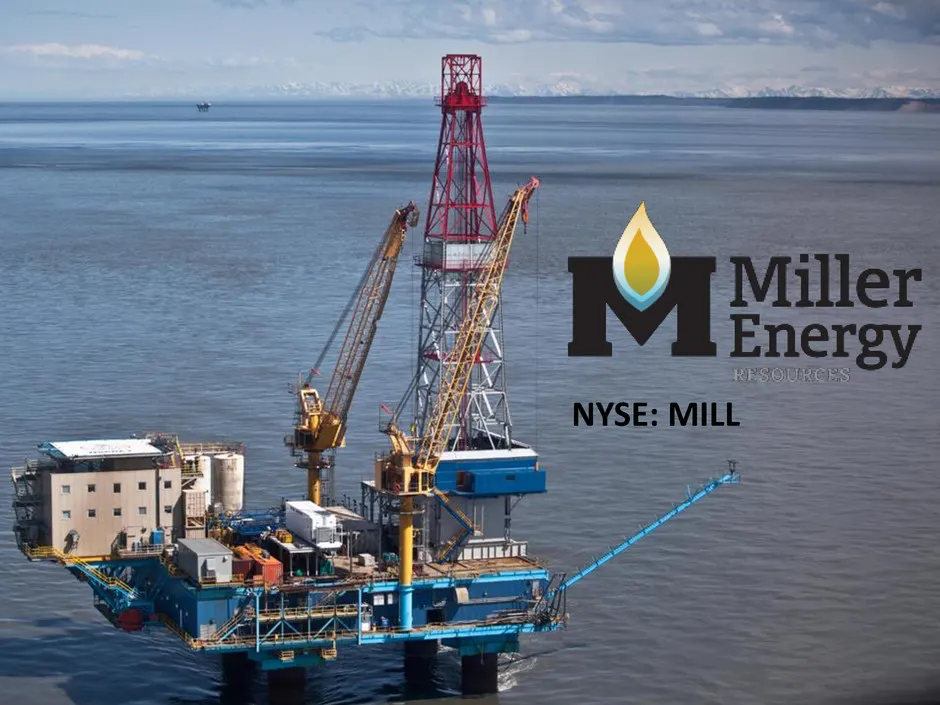
Slide 1: NYSE: MILL
NYSE: MILL
Slide 2: Forward Looking Statements
2 Forward Looking Statements Certain statements in this presentation and elsewhere by Miller Energy Resources¸ Inc. are "forward-looking statements" within the meaning of the Private Securities Litigation Reform Act of 1995. These forward-looking statements involve the implied assessment that the re
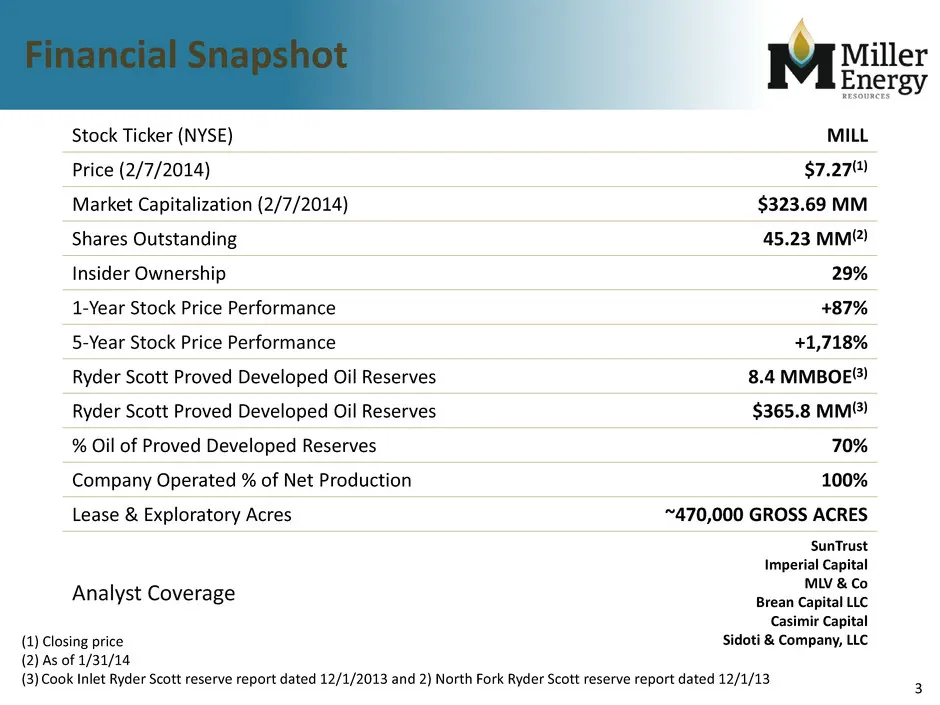
Slide 3: Financial Snapshot
3 Financial Snapshot Stock Ticker (NYSE) MILL Price (2/7/2014) $7.27(1) Market Capitalization (2/7/2014) $323.69 MM Shares Outstanding 45.23 MM(2) Insider Ownership 29% 1-Year Stock Price Performance +87% 5-Year Stock Price Performance +1,718% Ryder Scott Proved Developed Oil Reserves 8.4 MMBOE(3) R
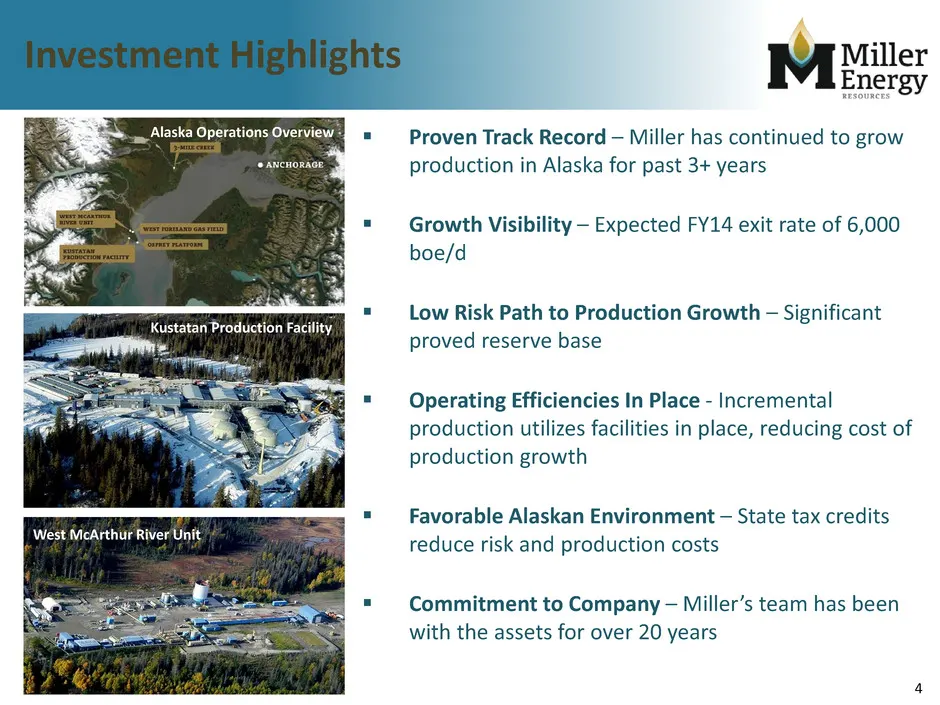
Slide 4: Investment Highlights
4 Investment Highlights Kustatan Production Facility West McArthur River Unit Alaska Operations Overview Proven Track Record – Miller has continued to grow production in Alaska for past 3+ years Growth Visibility – Expected FY14 exit rate of 6,000 boe/d Low Risk Path to Production Growth – Sig
Slide 5: Asset Overview
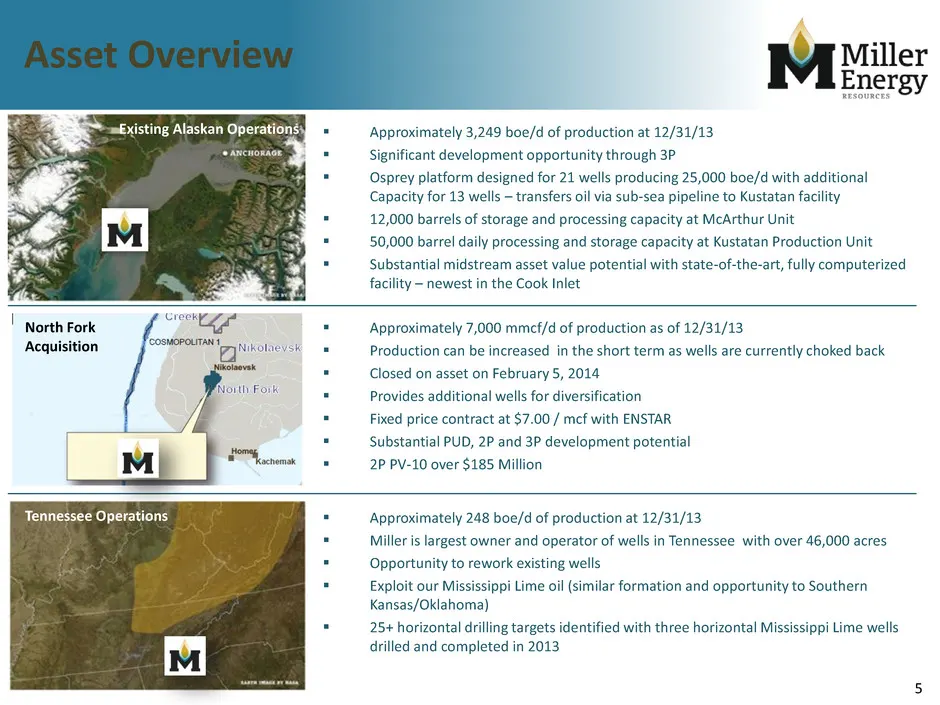
5 Asset Overview Existing Alaskan Operations Tennessee Operations Approximately 3,249 boe/d of production at 12/31/13 Significant development opportunity through 3P Osprey platform designed for 21 wells producing 25,000 boe/d with additional Capacity for 13 wells – transfers oil via sub-sea pi
Slide 6: Shareholder Value With Milestones
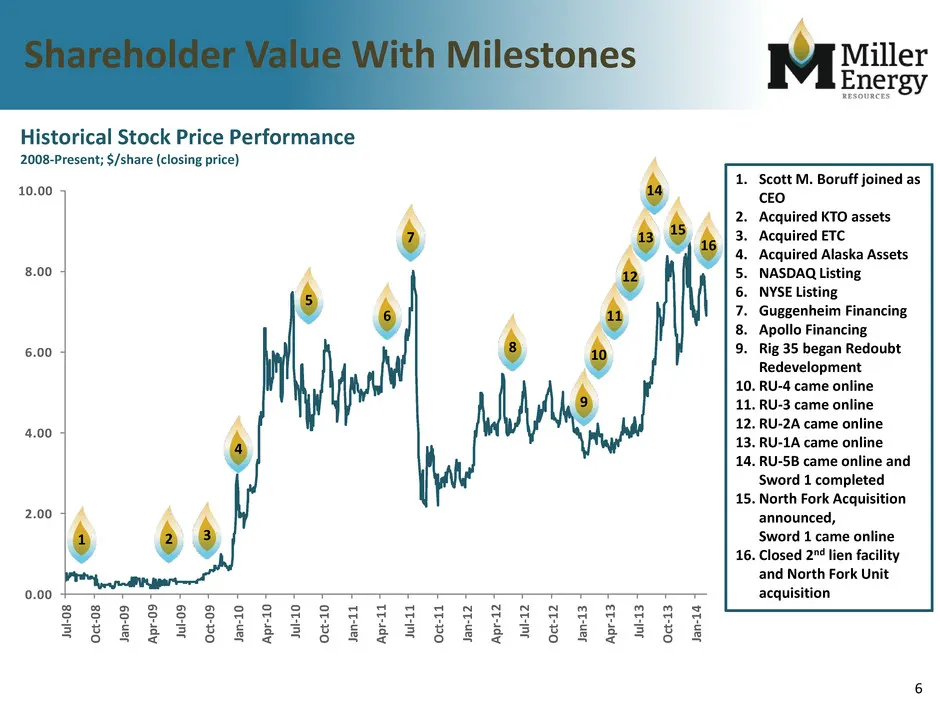
6 Shareholder Value With Milestones 1. Scott M. Boruff joined as CEO 2. Acquired KTO assets 3. Acquired ETC 4. Acquired Alaska Assets 5. NASDAQ Listing 6. NYSE Listing 7. Guggenheim Financing 8. Apollo Financing 9. Rig 35 began Redoubt Redevelopment 10. RU-4 came online 11. RU-3 came online 12. RU-2
Slide 7: Production: Historical and Forecast Production
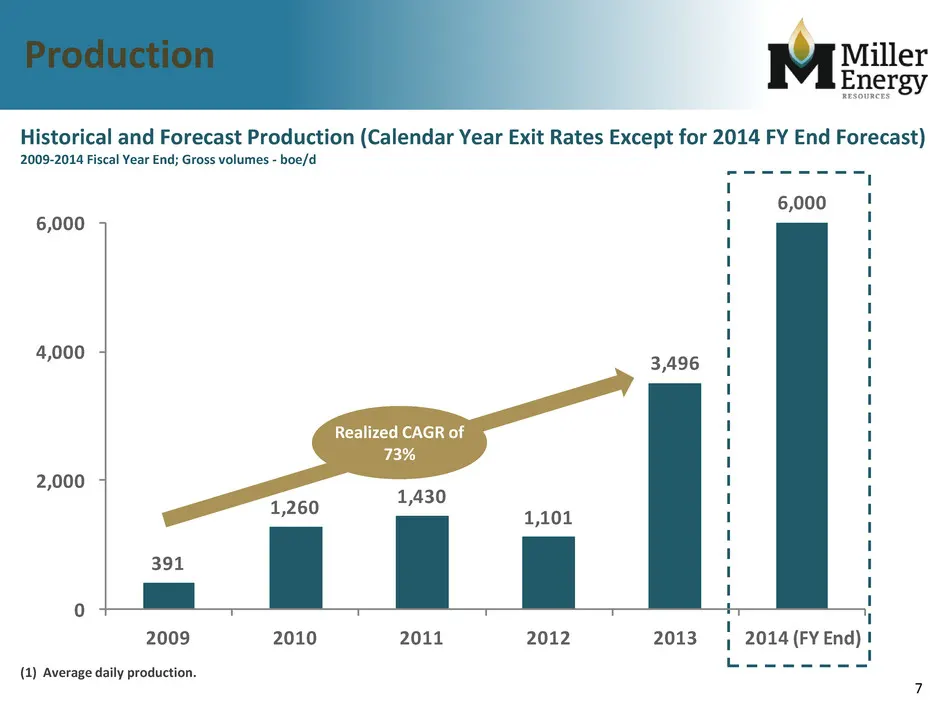
7 Production Historical and Forecast Production (Calendar Year Exit Rates Except for 2014 FY End Forecast) 2009-2014 Fiscal Year End; Gross volumes - boe/d Realized CAGR of 73% (1) Average daily production. 391 1,260 1,430 1,101 3,496 6,000 0 2,000 4,000 6,000 2009 2010 2011 2012 2013 2014 (FY End)
Slide 8: Reserves - Proved with Upside
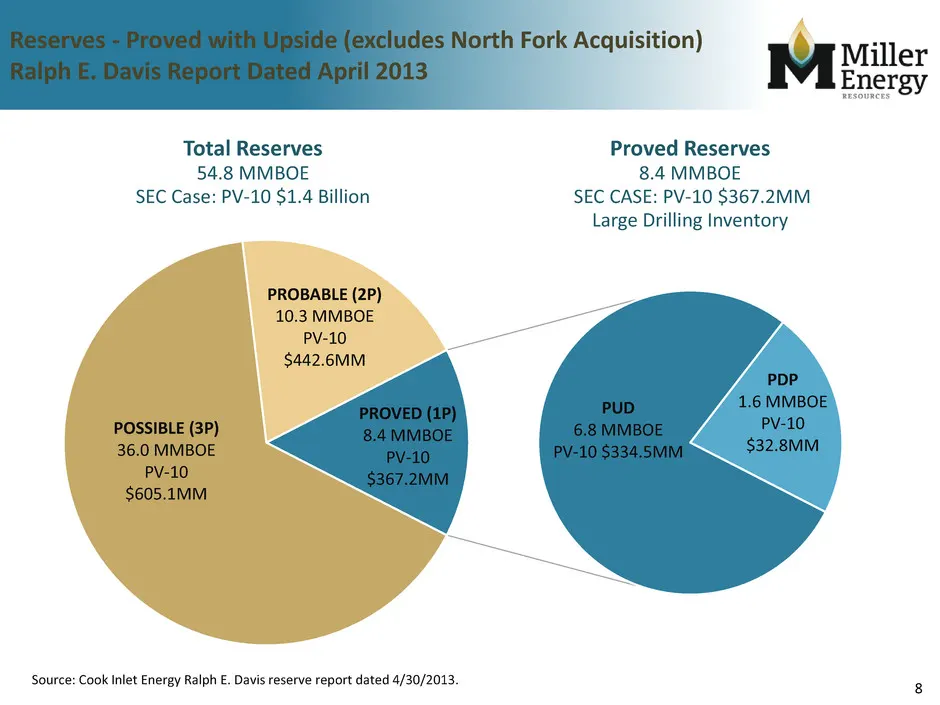
8 Reserves - Proved with Upside (excludes North Fork Acquisition) Ralph E. Davis Report Dated April 2013 PUD 6.8 MMBOE PV-10 $334.5MM Total Reserves 54.8 MMBOE SEC Case: PV-10 $1.4 Billion Proved Reserves 8.4 MMBOE SEC CASE: PV-10 $367.2MM Large Drilling Inventory PDP 1.6 MMBOE PV-10 $32.8MM PROBABL
Slide 9: Reserves – Proved Developed (Including North Fork Acquisition)
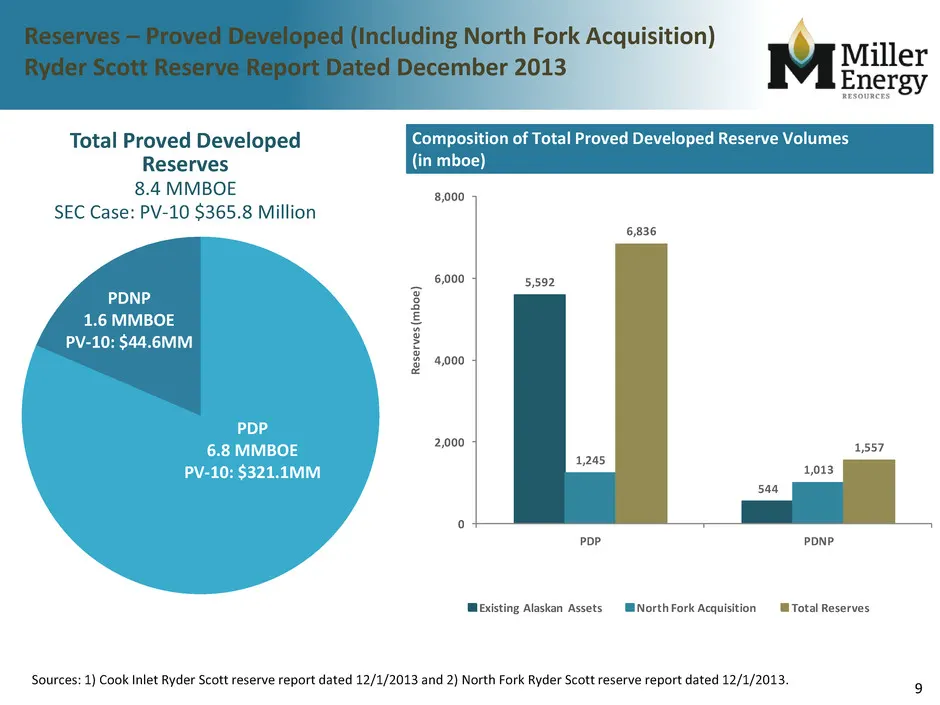
9 Reserves – Proved Developed (Including North Fork Acquisition) Ryder Scott Reserve Report Dated December 2013 Total Proved Developed Reserves 8.4 MMBOE SEC Case: PV-10 $365.8 Million PDNP 1.6 MMBOE PV-10: $44.6MM PDP 6.8 MMBOE PV-10: $321.1MM Sources: 1) Cook Inlet Ryder Scott reserve report dated
Slide 10: North Fork Acquisition Closed
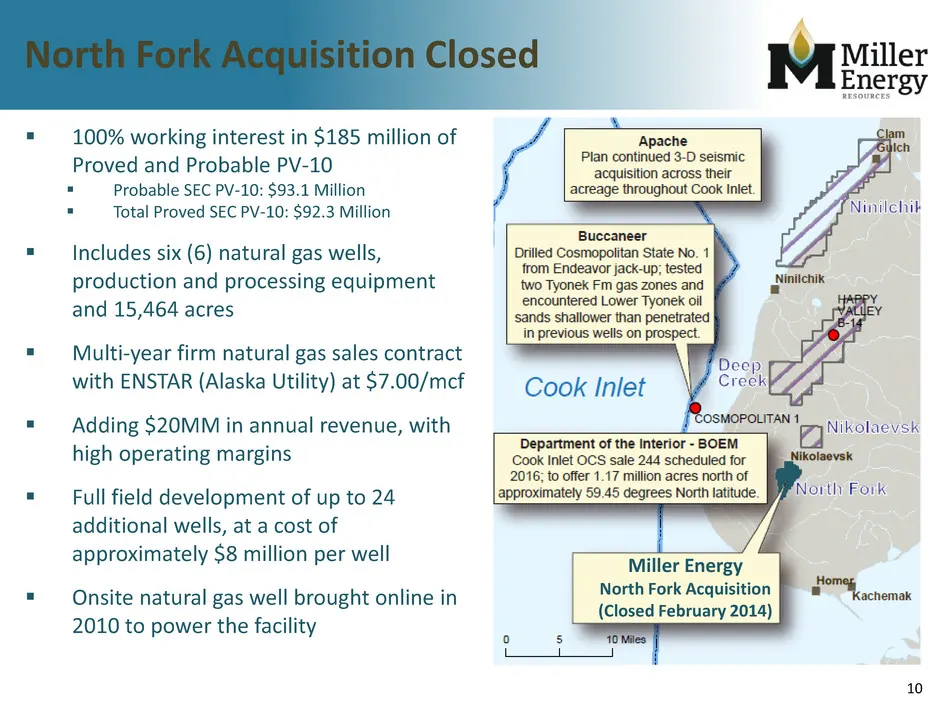
10 North Fork Acquisition Closed 100% working interest in $185 million of Proved and Probable PV-10 Probable SEC PV-10: $93.1 Million Total Proved SEC PV-10: $92.3 Million Includes six (6) natural gas wells, production and processing equipment and 15,464 acres Multi-year firm natural gas s
Slide 11: Acquisition Financing
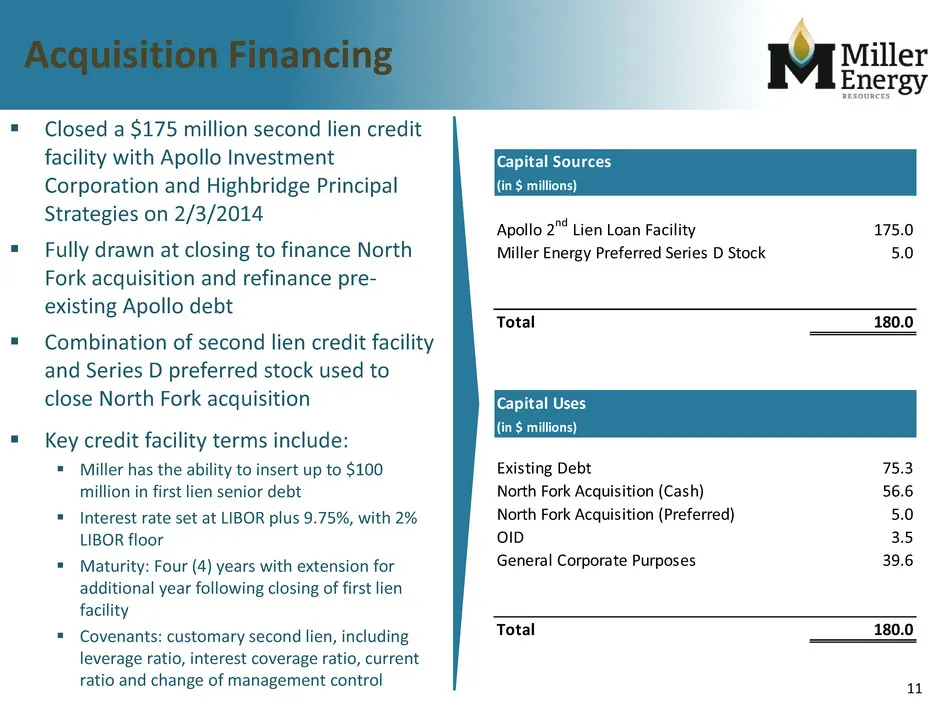
11 Acquisition Financing Closed a $175 million second lien credit facility with Apollo Investment Corporation and Highbridge Principal Strategies on 2/3/2014 Fully drawn at closing to finance North Fork acquisition and refinance pre- existing Apollo debt Combination of second lien credit facil
Slide 12: Tax Friendly Environment
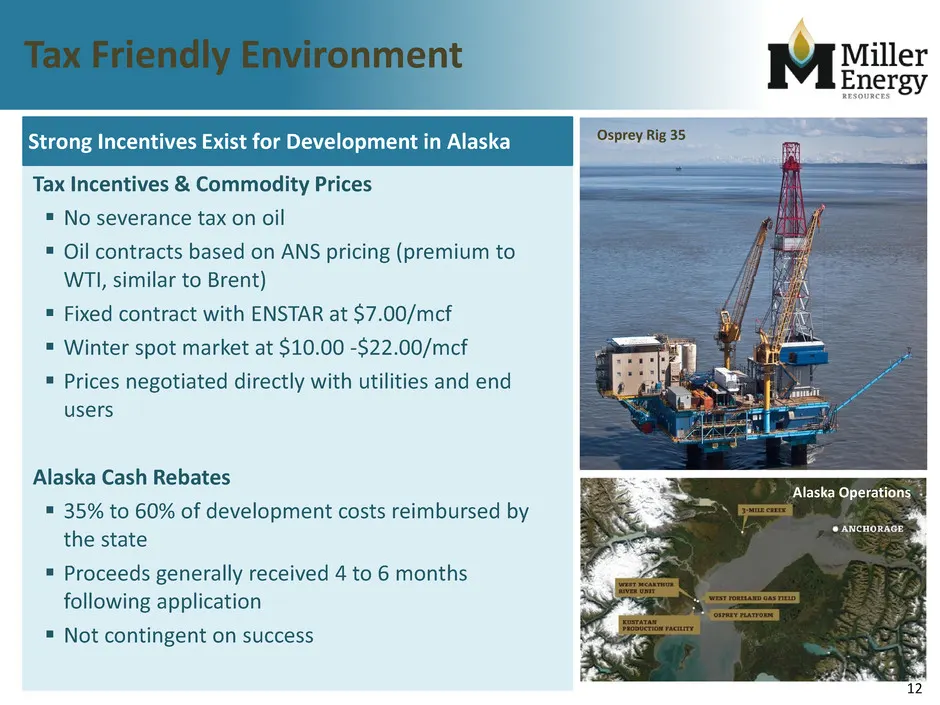
12 Tax Friendly Environment Tax Incentives & Commodity Prices No severance tax on oil Oil contracts based on ANS pricing (premium to WTI, similar to Brent) Fixed contract with ENSTAR at $7.00/mcf Winter spot market at $10.00 -$22.00/mcf Prices negotiated directly with utilities and end use
Slide 13: Operational Update & Capital Budget
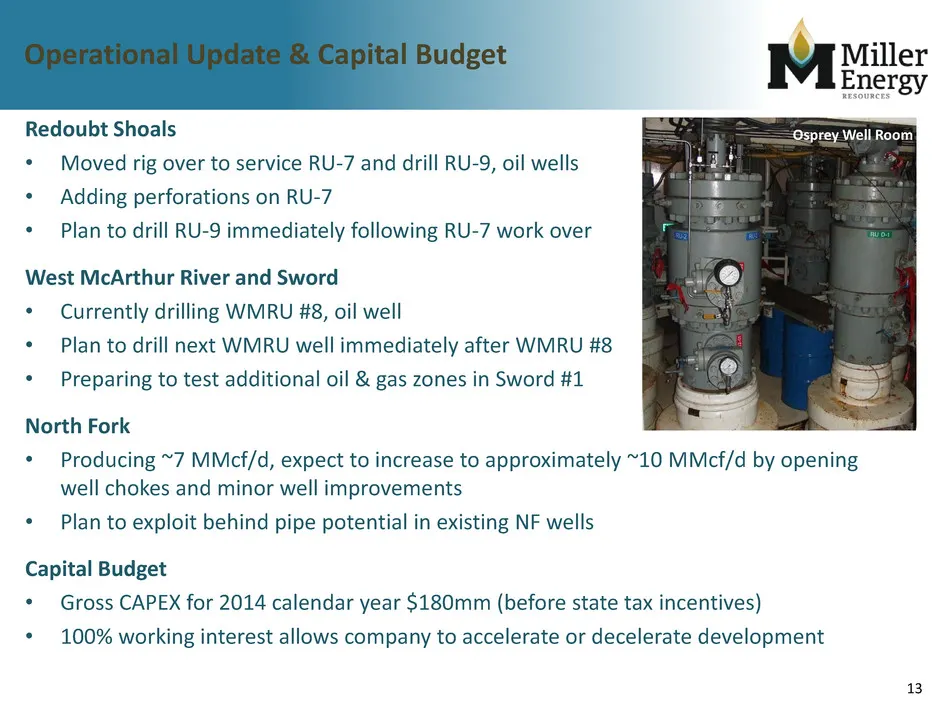
13 Operational Update & Capital Budget Redoubt Shoals • Moved rig over to service RU-7 and drill RU-9, oil wells • Adding perforations on RU-7 • Plan to drill RU-9 immediately following RU-7 work over West McArthur River and Sword • Currently drilling WMRU #8, oil well • Plan to drill next WMRU well
Slide 14: Hedging
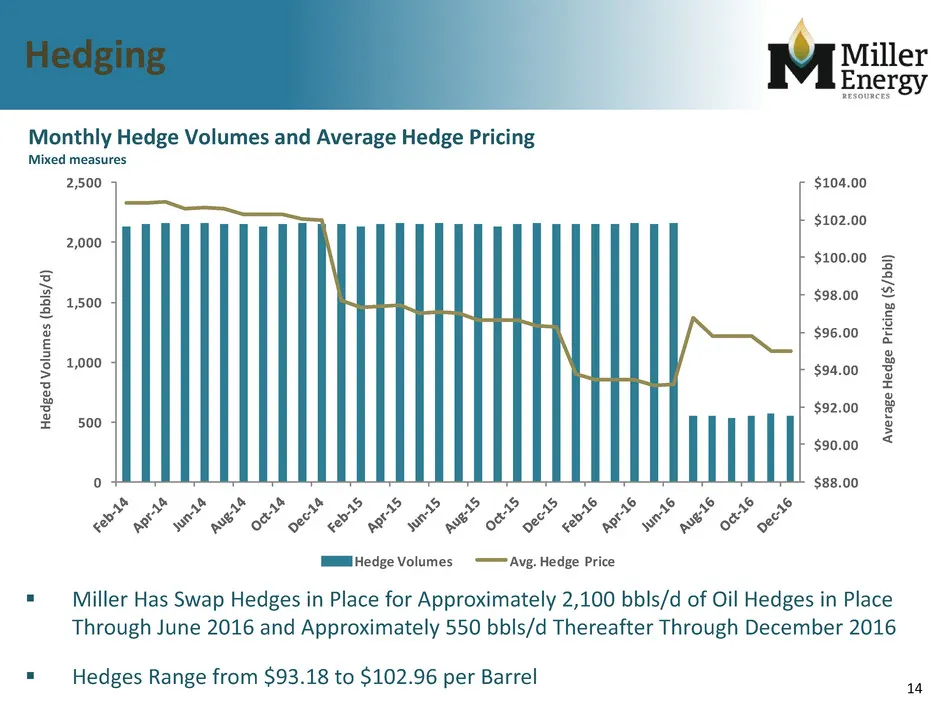
14 Hedging Monthly Hedge Volumes and Average Hedge Pricing Mixed measures Miller Has Swap Hedges in Place for Approximately 2,100 bbls/d of Oil Hedges in Place Through June 2016 and Approximately 550 bbls/d Thereafter Through December 2016 Hedges Range from $93.18 to $102.96 per Barrel $88.00 $9
Slide 15: Investment Summary
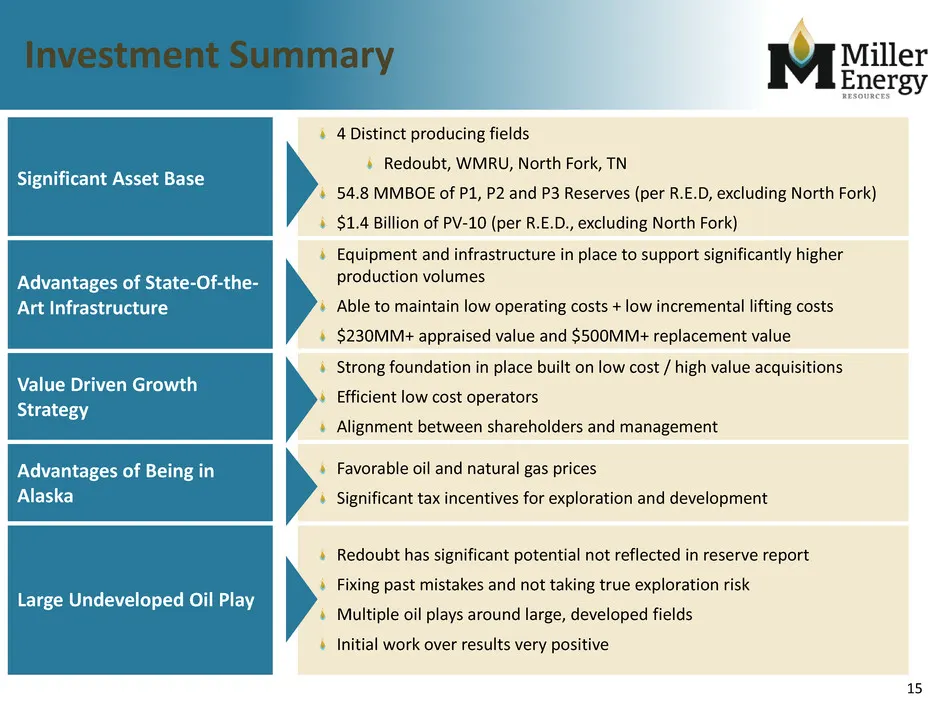
15 Investment Summary Significant Asset Base 4 Distinct producing fields Redoubt, WMRU, North Fork, TN 54.8 MMBOE of P1, P2 and P3 Reserves (per R.E.D, excluding North Fork) $1.4 Billion of PV-10 (per R.E.D., excluding North Fork) Advantages of State-Of-the- Art Infrastructure Equipment and infrastr
Slide 16: Appendix
Appendix Dynamic High Growth Leader
Slide 17: Management Bios
17 Management Bios Deloy Miller - Mr. Miller, our founder, has been Chairman of the Board of Directors since December 1996, and was CEO from 1967 to August 2008, and COO from August 2008 to July 2013. Since then, Mr. Miller has been Executive Chairman of the Board of Directors. He is a seasoned gas
Slide 18: Miller Thesis – Original Completions Optimized
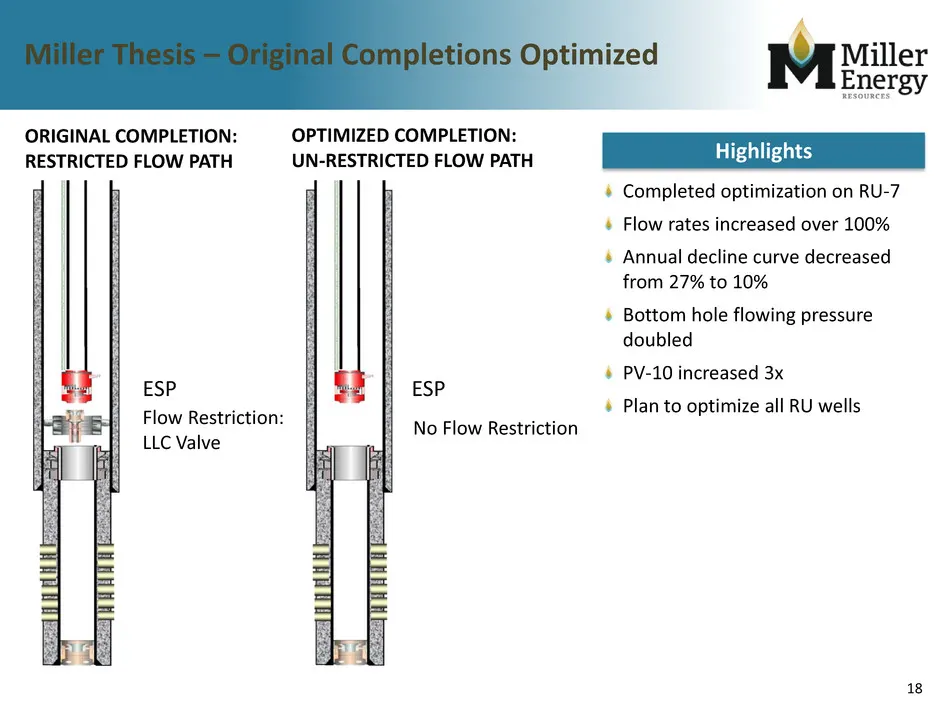
18 Miller Thesis – Original Completions Optimized ORIGINAL COMPLETION: RESTRICTED FLOW PATH OPTIMIZED COMPLETION: UN-RESTRICTED FLOW PATH Completed optimization on RU-7 Flow rates increased over 100% Annual decline curve decreased from 27% to 10% Bottom hole flowing pressure doubled PV-10 increased
Slide 19: Alaska – Redoubt Unit Field (Osprey)
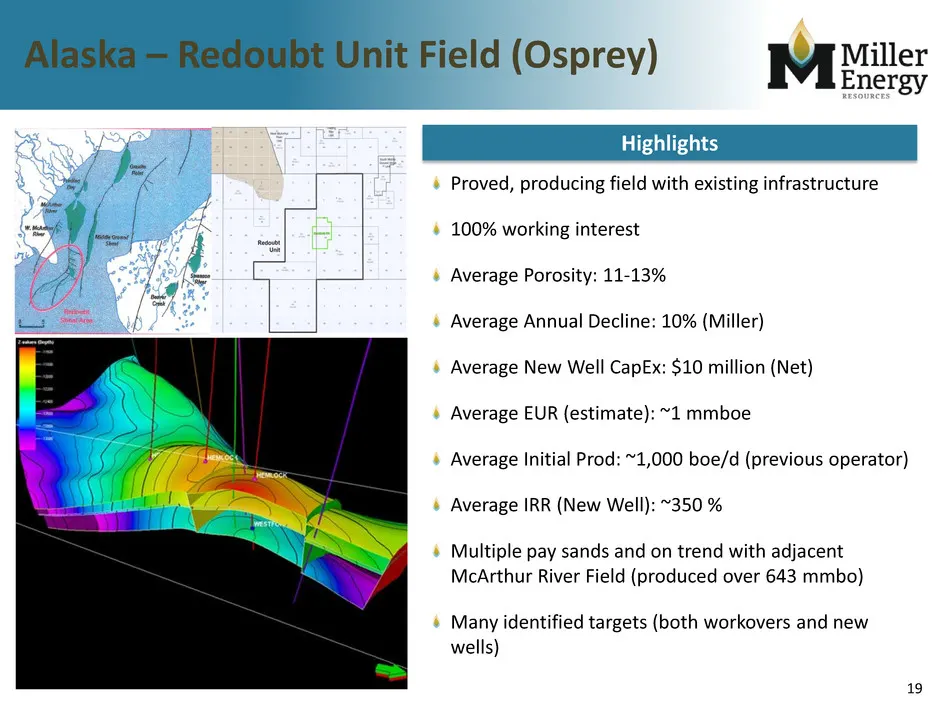
19 Alaska – Redoubt Unit Field (Osprey) Proved, producing field with existing infrastructure 100% working interest Average Porosity: 11-13% Average Annual Decline: 10% (Miller) Average New Well CapEx: $10 million (Net) Average EUR (estimate): ~1 mmboe Average Initial Prod: ~1,000 boe/d (previous ope
Slide 20: Redoubt Shoal Hemlock Structure Map
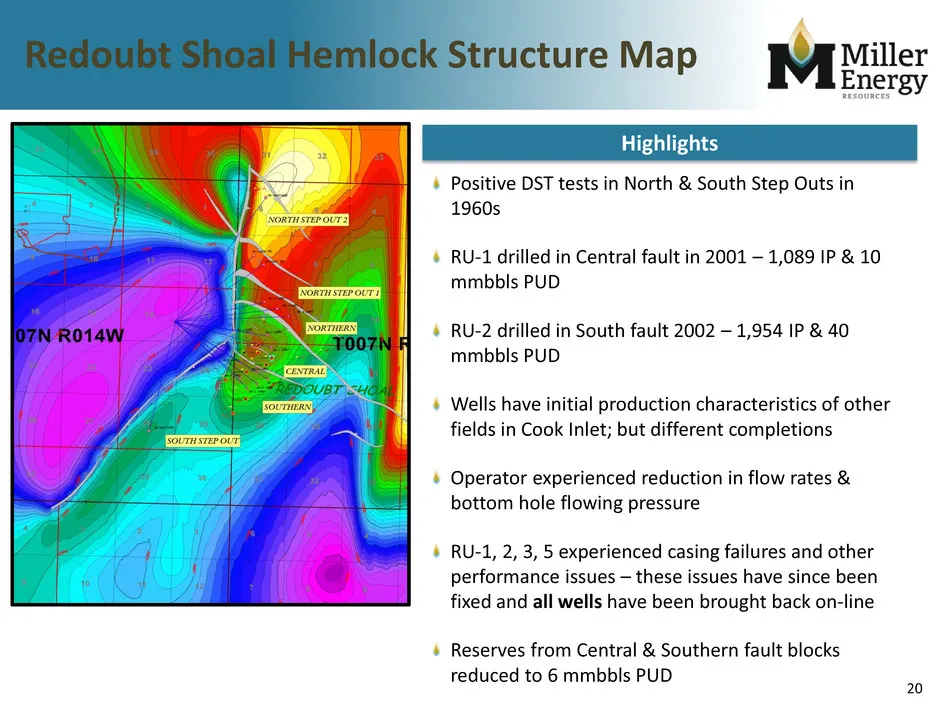
20 Redoubt Shoal Hemlock Structure Map Positive DST tests in North & South Step Outs in 1960s RU-1 drilled in Central fault in 2001 – 1,089 IP & 10 mmbbls PUD RU-2 drilled in South fault 2002 – 1,954 IP & 40 mmbbls PUD Wells have initial production characteristics of other fields in Cook Inlet; but
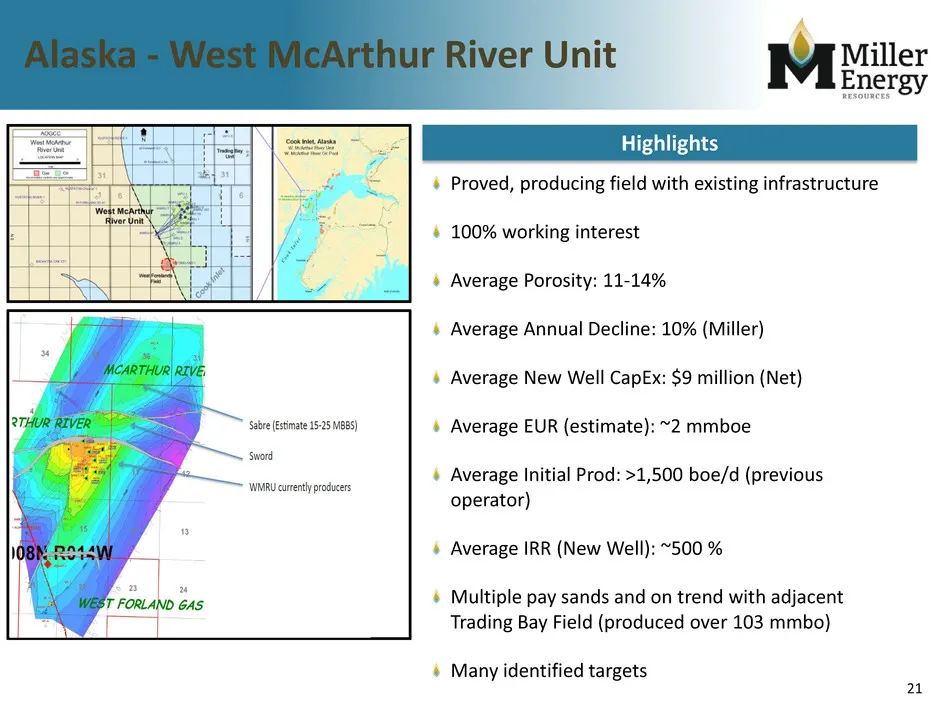
Slide 21: Alaska - West McArthur River Unit
21 Alaska - West McArthur River Unit Proved, producing field with existing infrastructure 100% working interest Average Porosity: 11-14% Average Annual Decline: 10% (Miller) Average New Well CapEx: $9 million (Net) Average EUR (estimate): ~2 mmboe Average Initial Prod: >1,500 boe/d (previous operato
Slide 22: Contact Information
22 Contact Information Miller Energy Resources, Inc. 9721 Cogdill Road, Suite 302 Knoxville, TN 37932-3425 Phone: 865-223-6575 info@millerenergyresources.com www.millerenergyresources.com Investor Relations MZ Group - North America Derek Gradwell SVP, Natural Resources Phone: 512-270-6990 dgradwell@
Source: SEC EDGAR · 8-K filed Feb 12, 2014
More decks from Miller Energy Resources Inc
 Investor Presentation (March 2015)31 slides · Mar 19, 2015
 IPAA OGIS Florida 201519 slides · Feb 3, 2015
 Investor Presentation (December 2014)25 slides · Dec 19, 2014
 Investor Presentation (December 2014)23 slides · Dec 16, 2014
 Shareholder Meeting (October 2014)21 slides · Oct 30, 2014
 EnerCom Conference 201426 slides · Aug 20, 2014