Carmila SA · EURONEXT:CARM
Carmila SA — FY2017 Earnings Presentation
44 slides from Carmila SA's earnings presentation, Feb 15, 2018
Slide 1: 2017 Annual Results
BAB2 - Biarritz 2017 Annual Results 1
Slide 2: Key Highlights
Pau Lescar Key Highlights 2
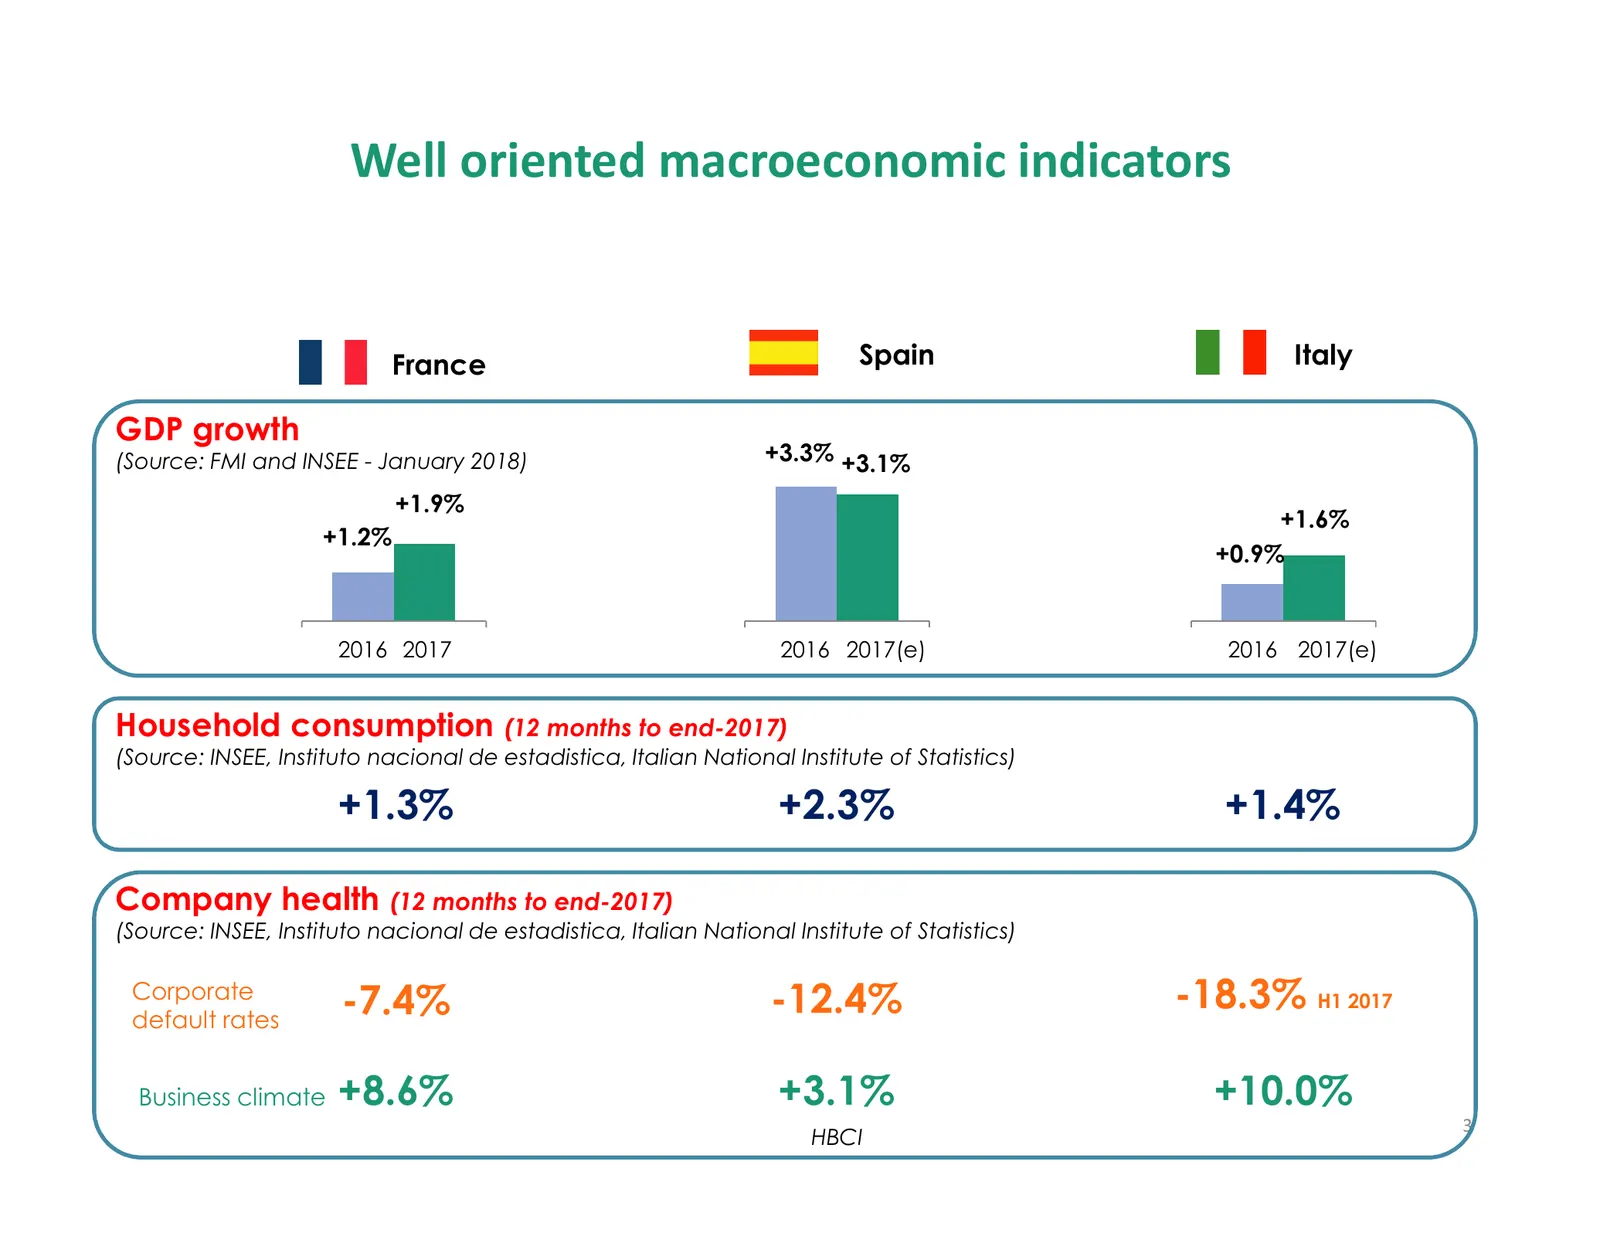
Slide 3: Well oriented macroeconomic indicators
Well oriented macroeconomic indicators France Spain Italy GDP growth (Source: FMI and INSEE - January 2018) +3.3% +3.1% +1.9% +1.6% +1.2% +0.9% 2016 2017 2016 2017(e) 2016 2017(e) Household consumption (12 months to end-2017) (Source: INSEE, Instituto nacional de estadistica, Italian National Instit
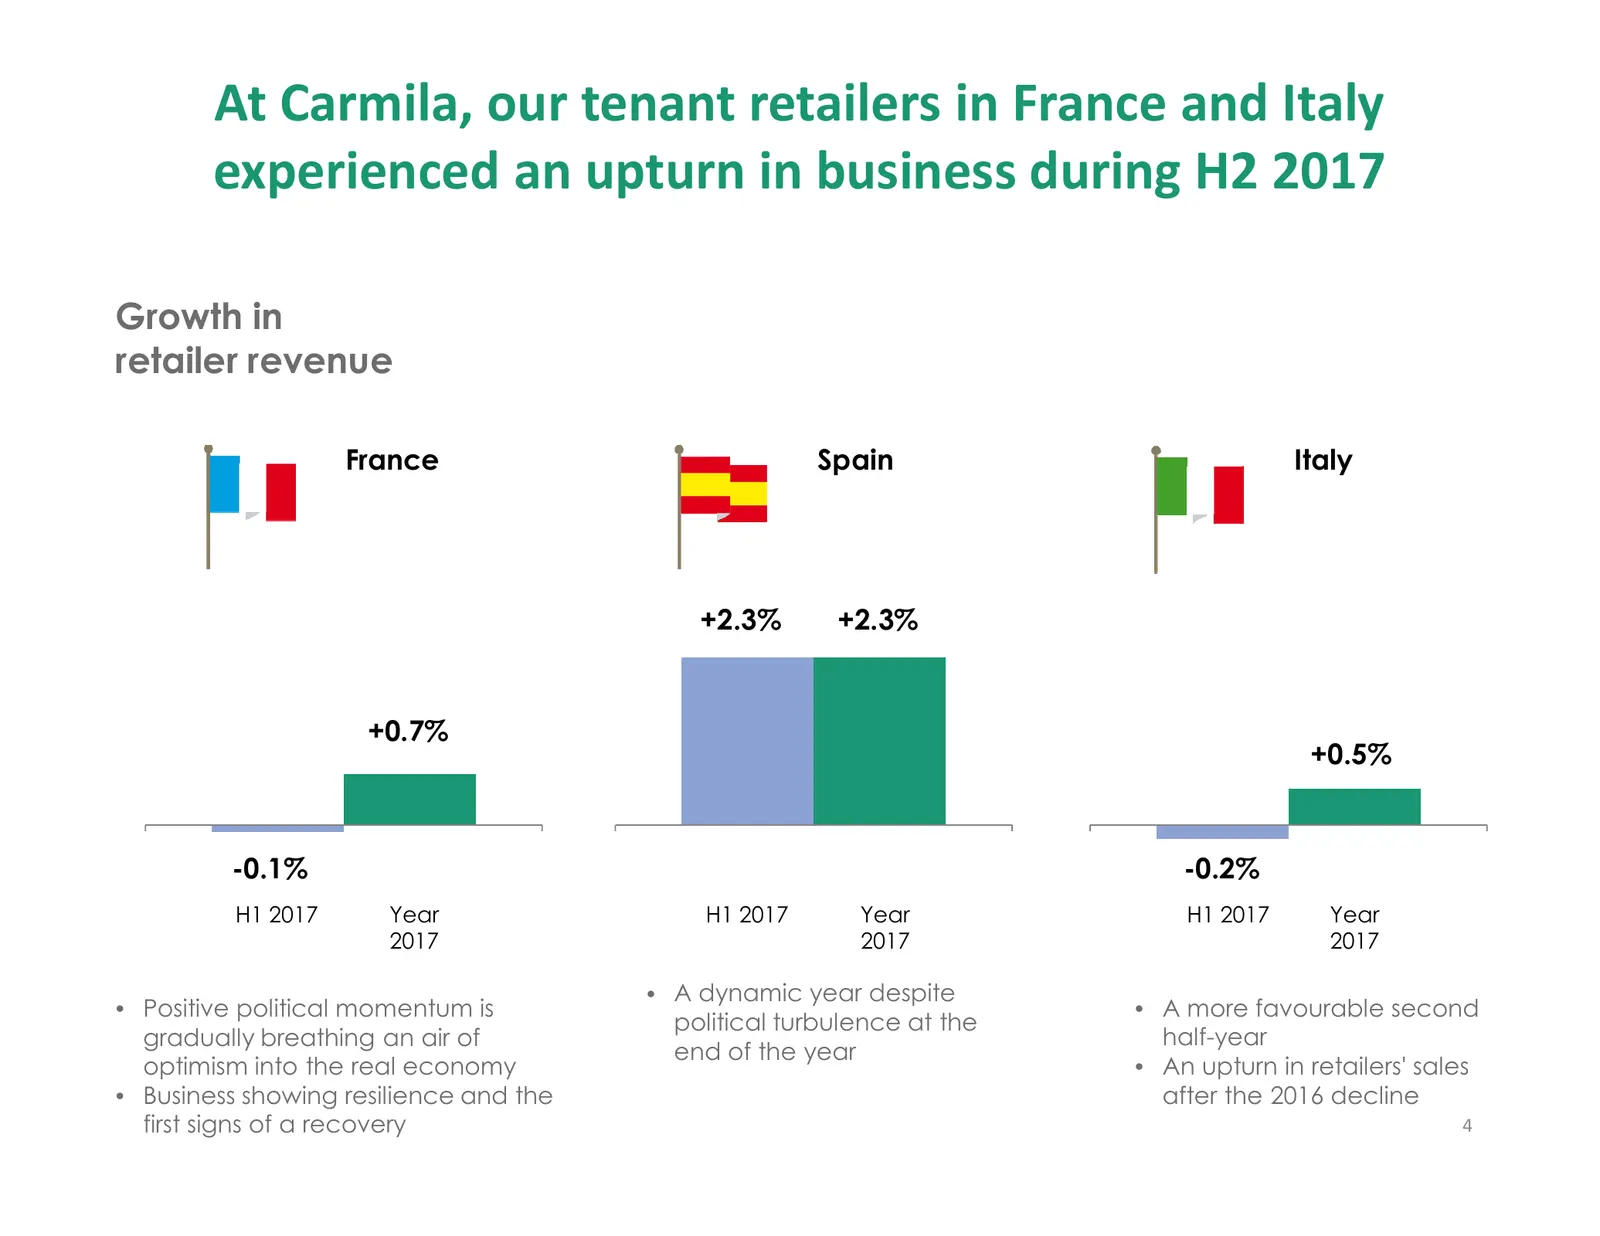
Slide 4: Tenant retailers in France and Italy experienced an upturn in business during H2 2017
At Carmila, our tenant retailers in France and Italy experienced an upturn in business during H2 2017 Growth in retailer revenue France Spain Italy +2.3% +2.3% +0.7% +0.5% -0.1% -0.2% H1 2017 Year H1 2017 Year H1 2017 Year 2017 2017 2017 • A dynamic year despite • Positive political momentum is • A
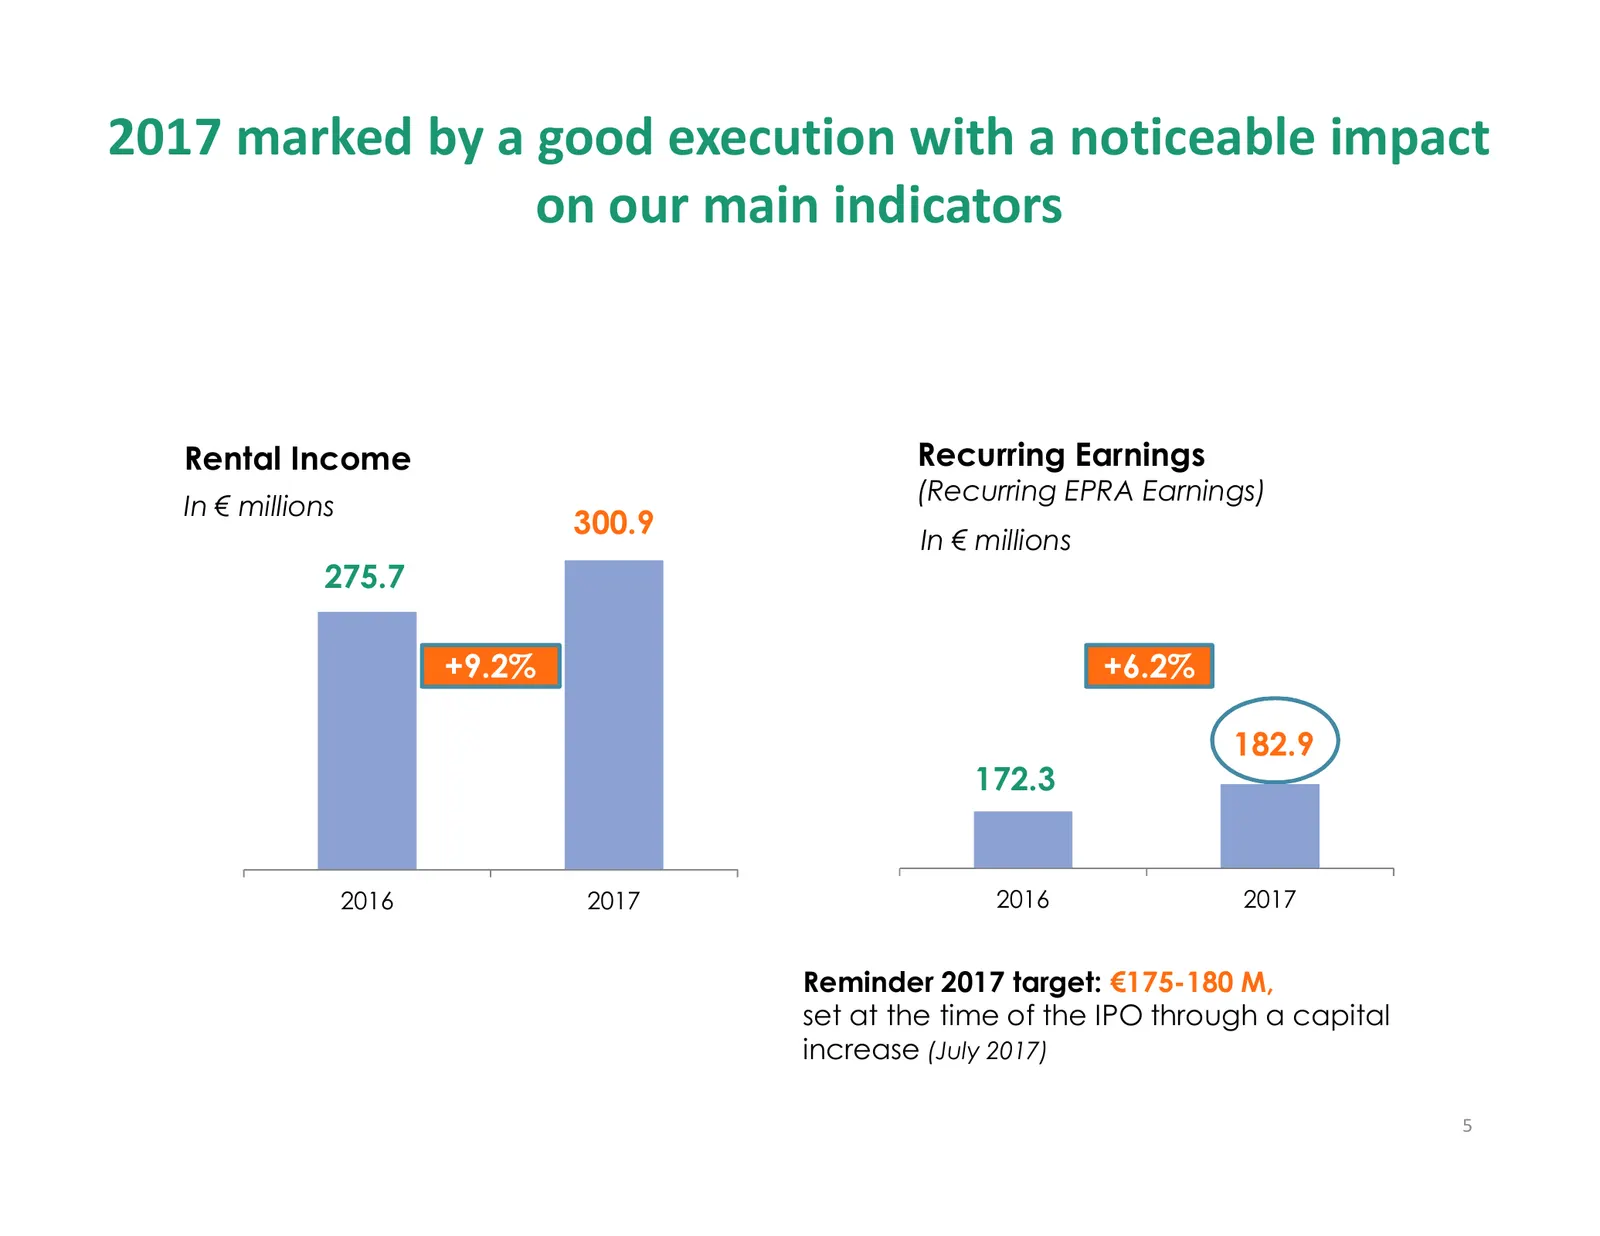
Slide 5: 2017 marked by a good execution with a noticeable impact on our main indicators
2017 marked by a good execution with a noticeable impact on our main indicators Rental Income Recurring Earnings (Recurring EPRA Earnings) In € millions 300.9 In € millions 275.7 +9.2% +6.2% 182.9 172.3 2016 2017 2016 2017 Reminder 2017 target: €175-180 M, set at the time of the IPO through a capita
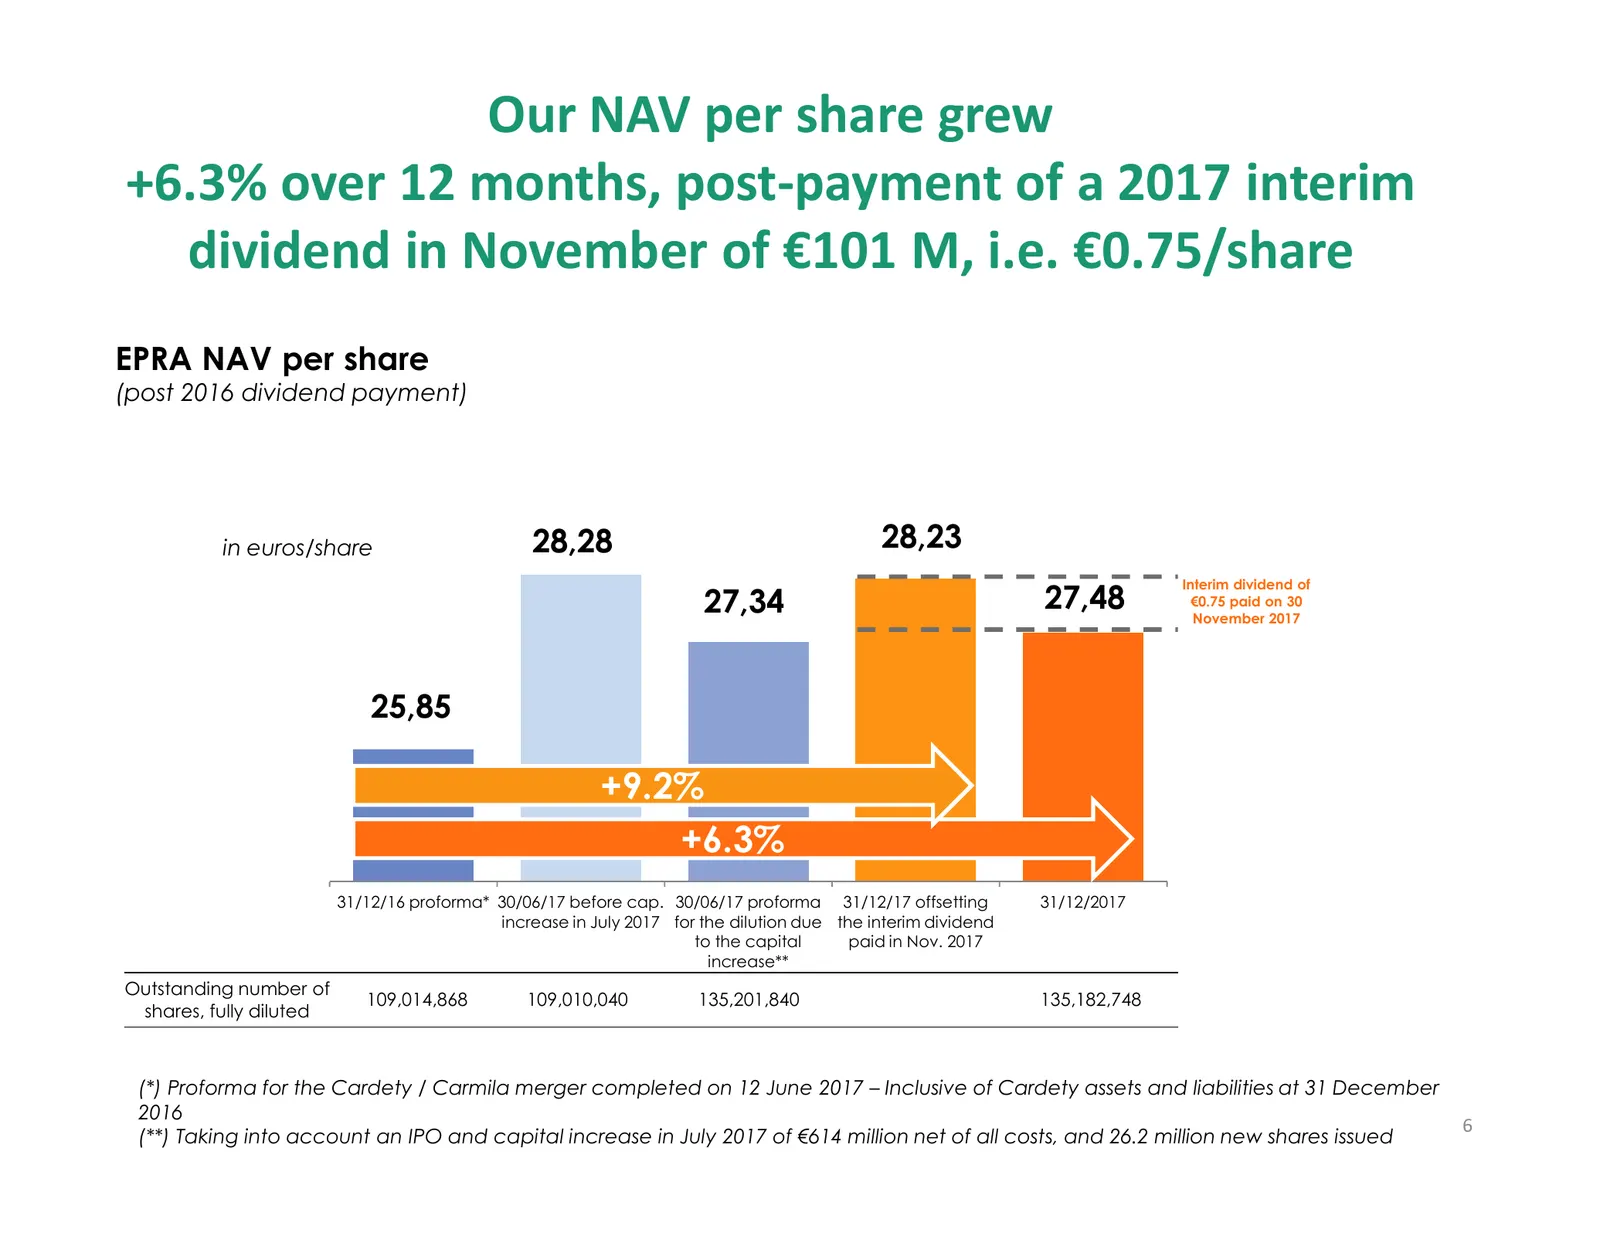
Slide 6: NAV per share grew +6.3% over 12 months, post-payment of a 2017 interim dividend
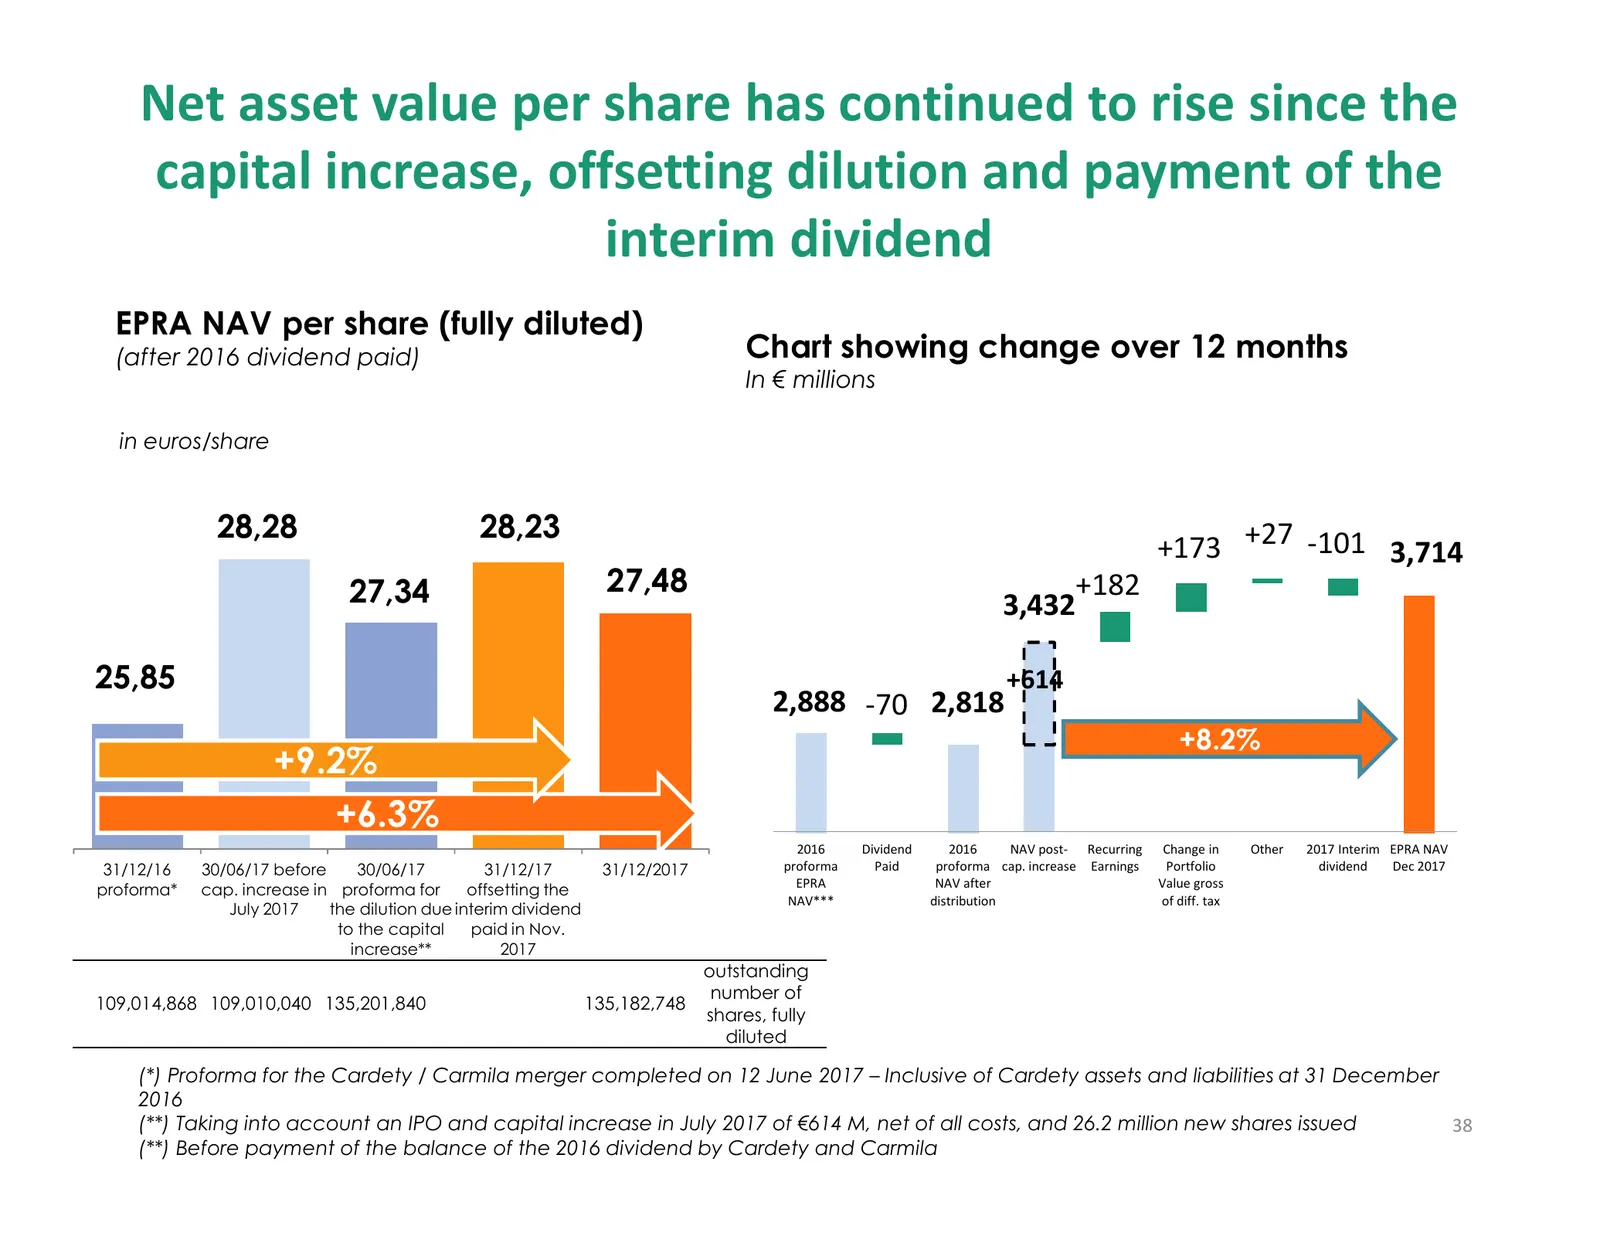
Our NAV per share grew +6.3% over 12 months, post-payment of a 2017 interim dividend in November of €101 M, i.e. €0.75/share EPRA NAV per share (post 2016 dividend payment) in euros/share 28,28 28,23 Interim dividend of 27,34 27,48 €0.75 paid on 30 November 2017 25,85 +9.2% +6.3% 31/12/16 proforma*
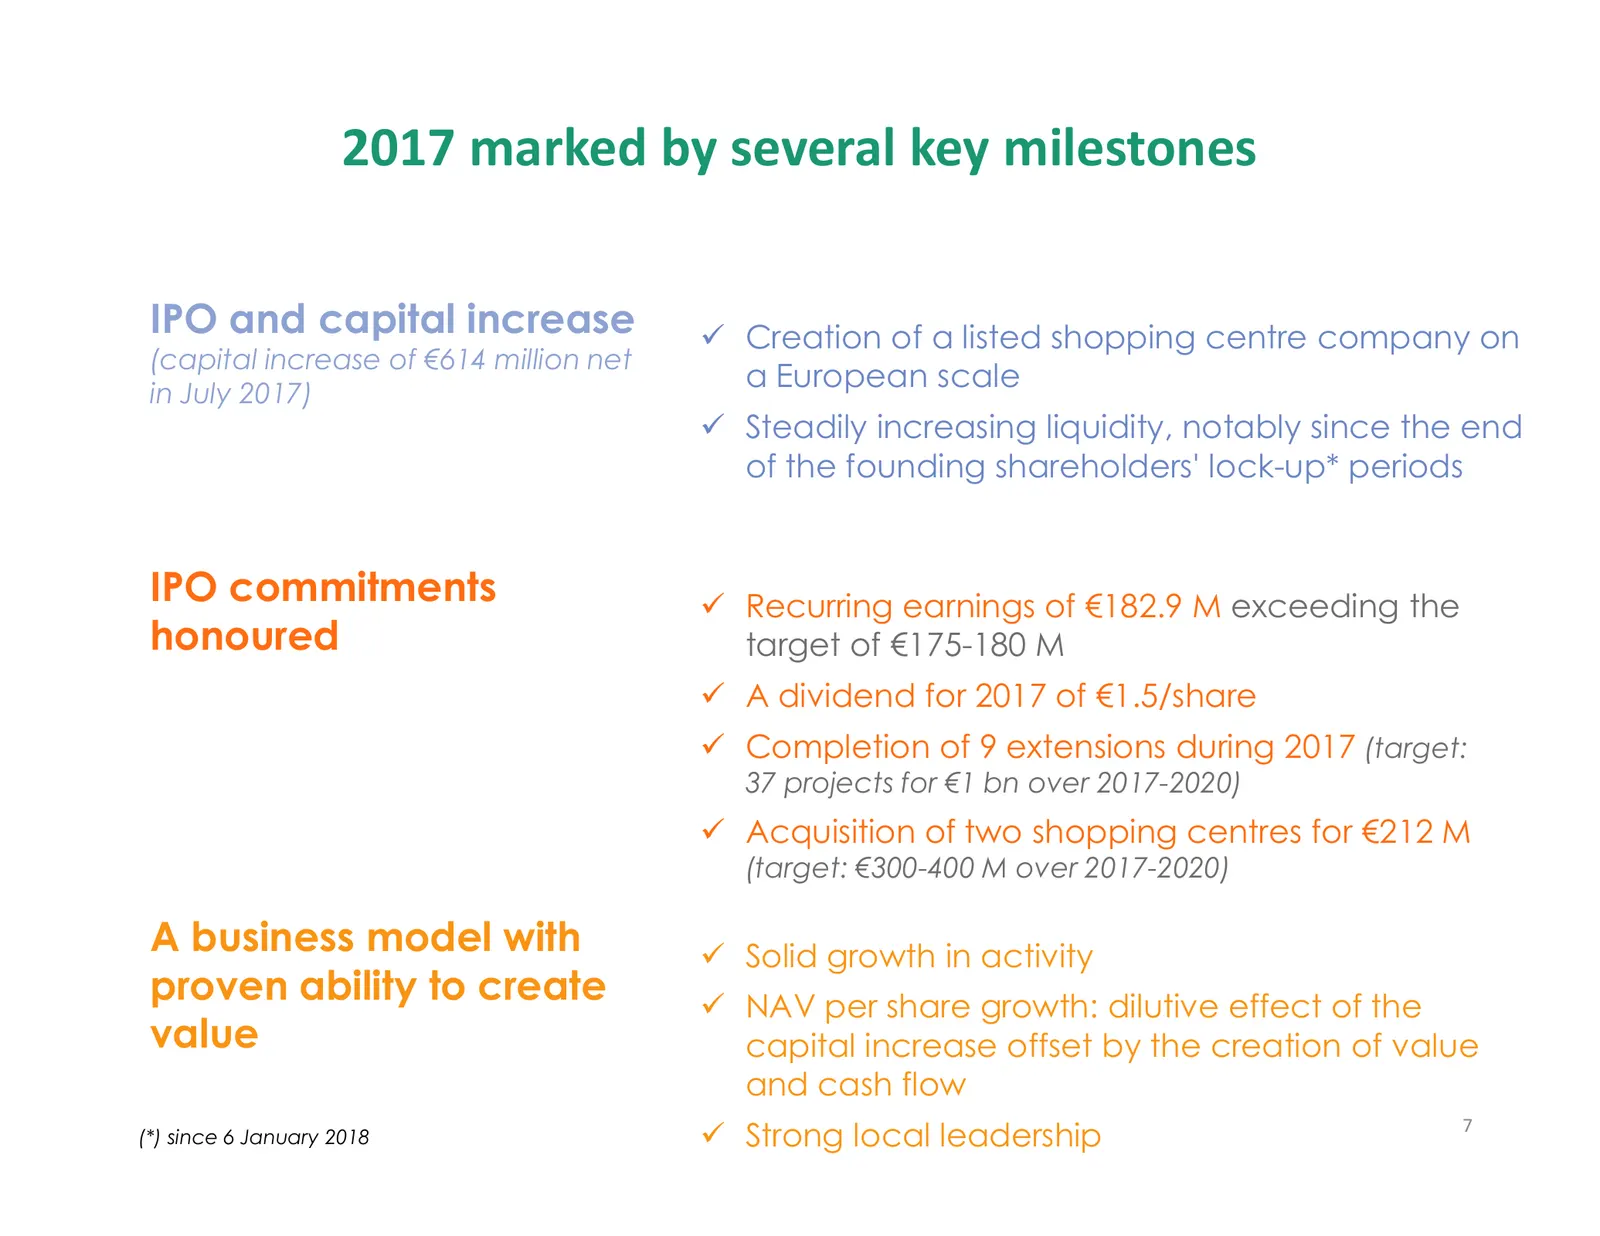
Slide 7: 2017 marked by several key milestones
2017 marked by several key milestones IPO and capital increase Creation of a listed shopping centre company on (capital increase of €614 million net in July 2017) a European scale Steadily increasing liquidity, notably since the end of the founding shareholders' lock-up* periods IPO commitments Recu
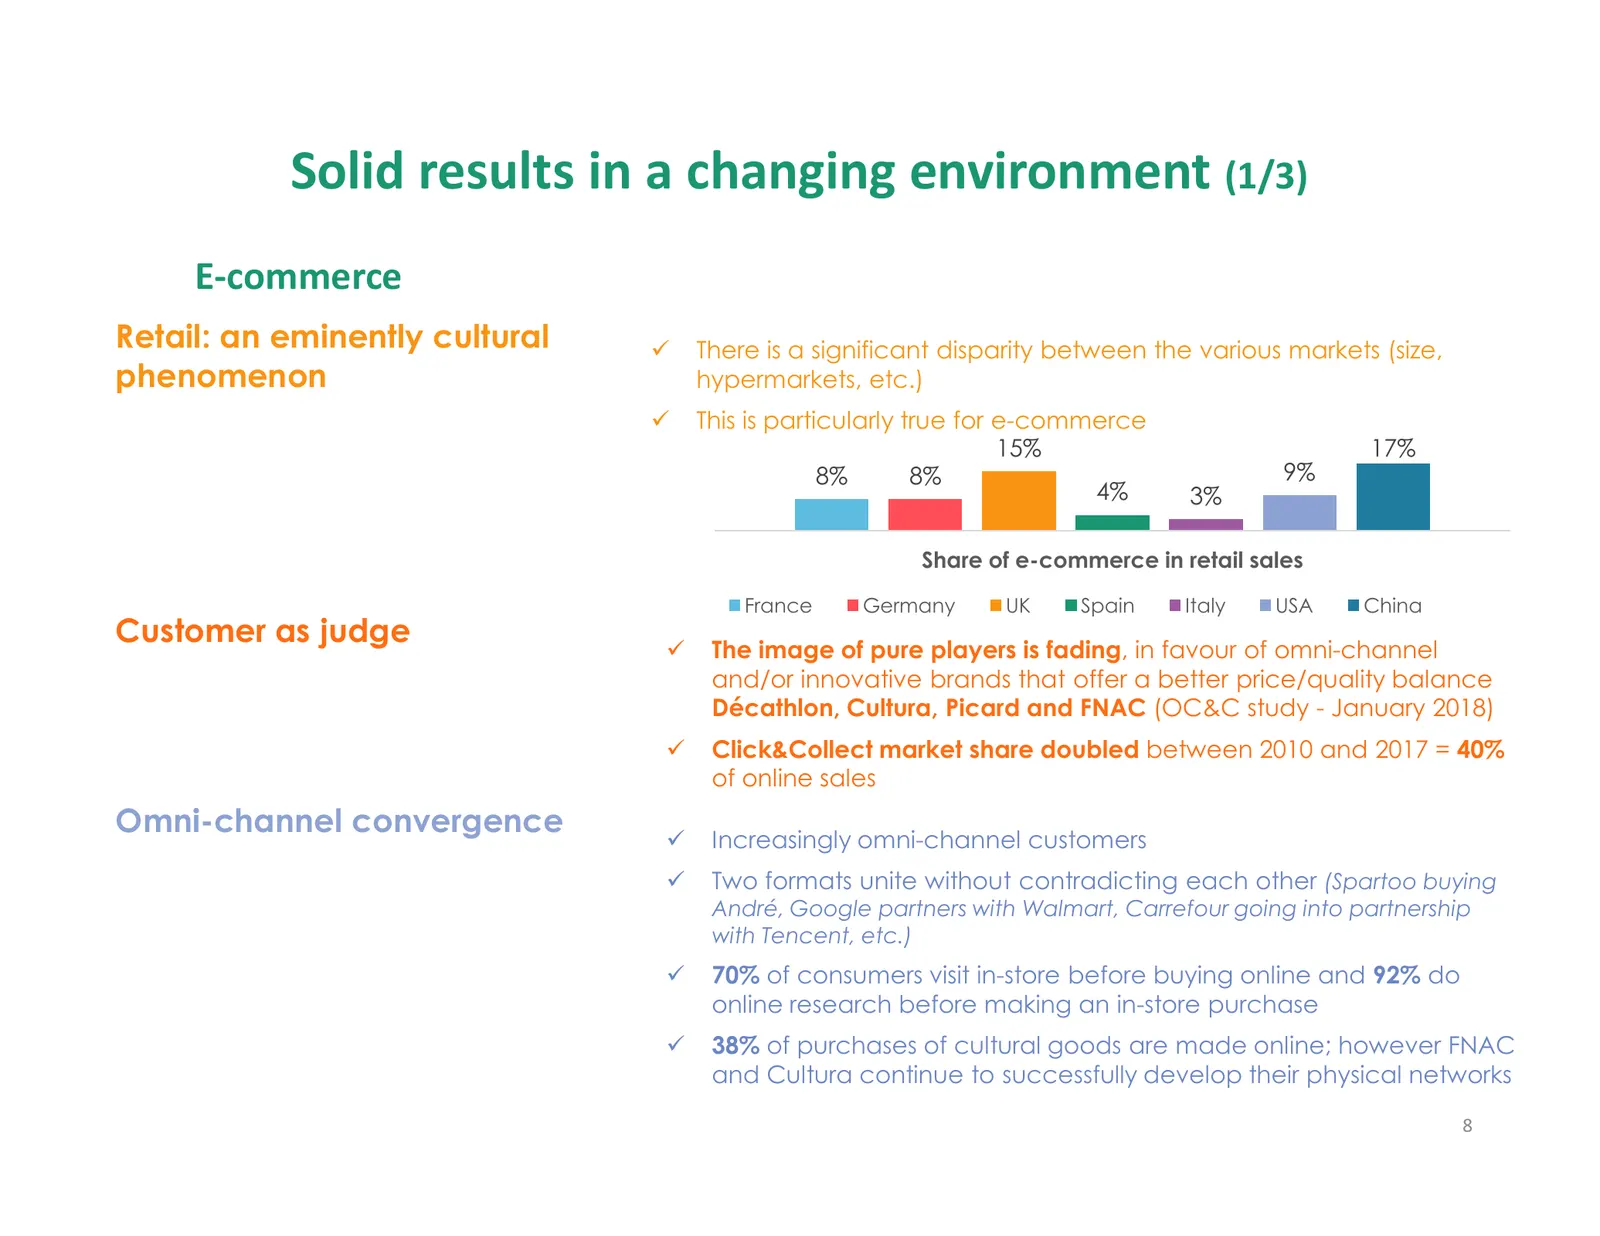
Slide 8: Solid results in a changing environment (1/3)
Solid results in a changing environment (1/3) E-commerce Retail: an eminently cultural There is a significant disparity between the various markets (size, phenomenon hypermarkets, etc.) This is particularly true for e-commerce 15% 17% 8% 8% 9% 4% 3% Share of e-commerce in retail sales France Germany
Slide 9: Solid results in a changing environment (2/3)
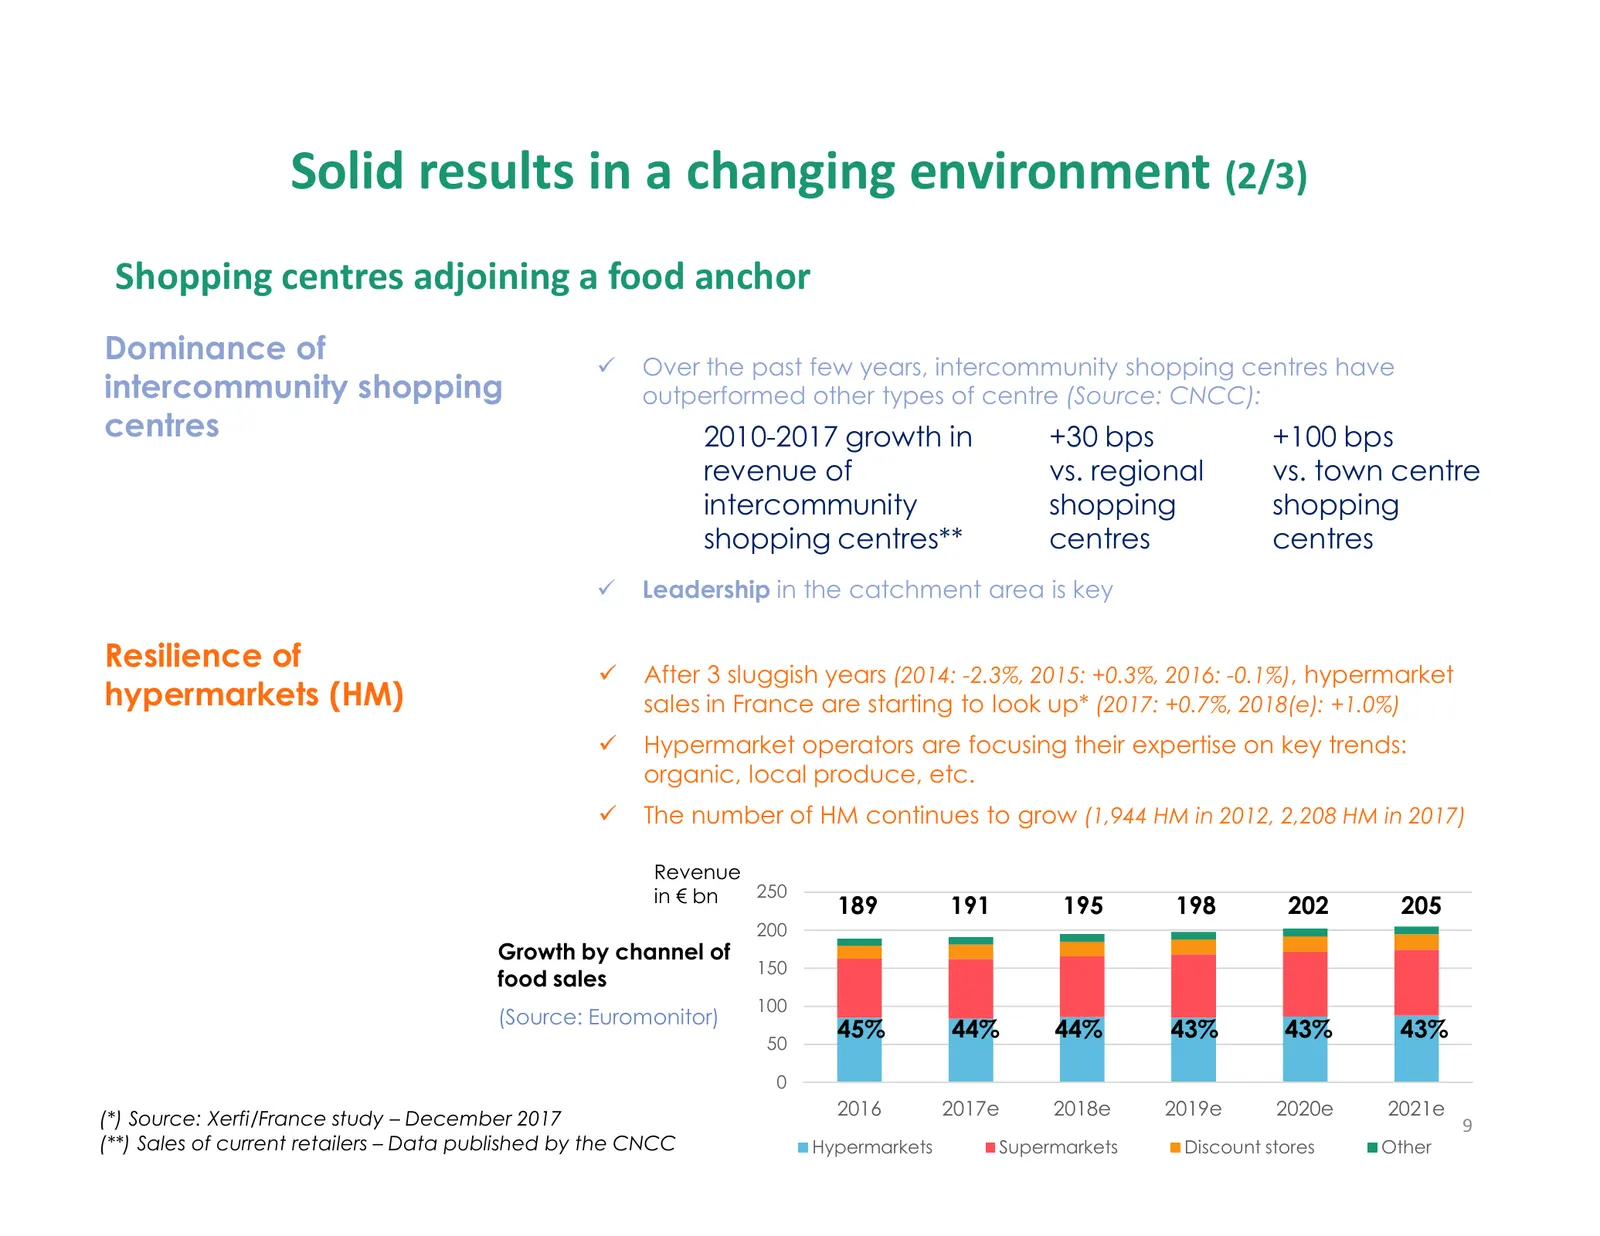
Solid results in a changing environment (2/3) Shopping centres adjoining a food anchor Dominance of Over the past few years, intercommunity shopping centres have intercommunity shopping outperformed other types of centre (Source: CNCC): centres 2010-2017 growth in +30 bps +100 bps revenue of vs. reg
Slide 10: Solid results in a changing environment (3/3)
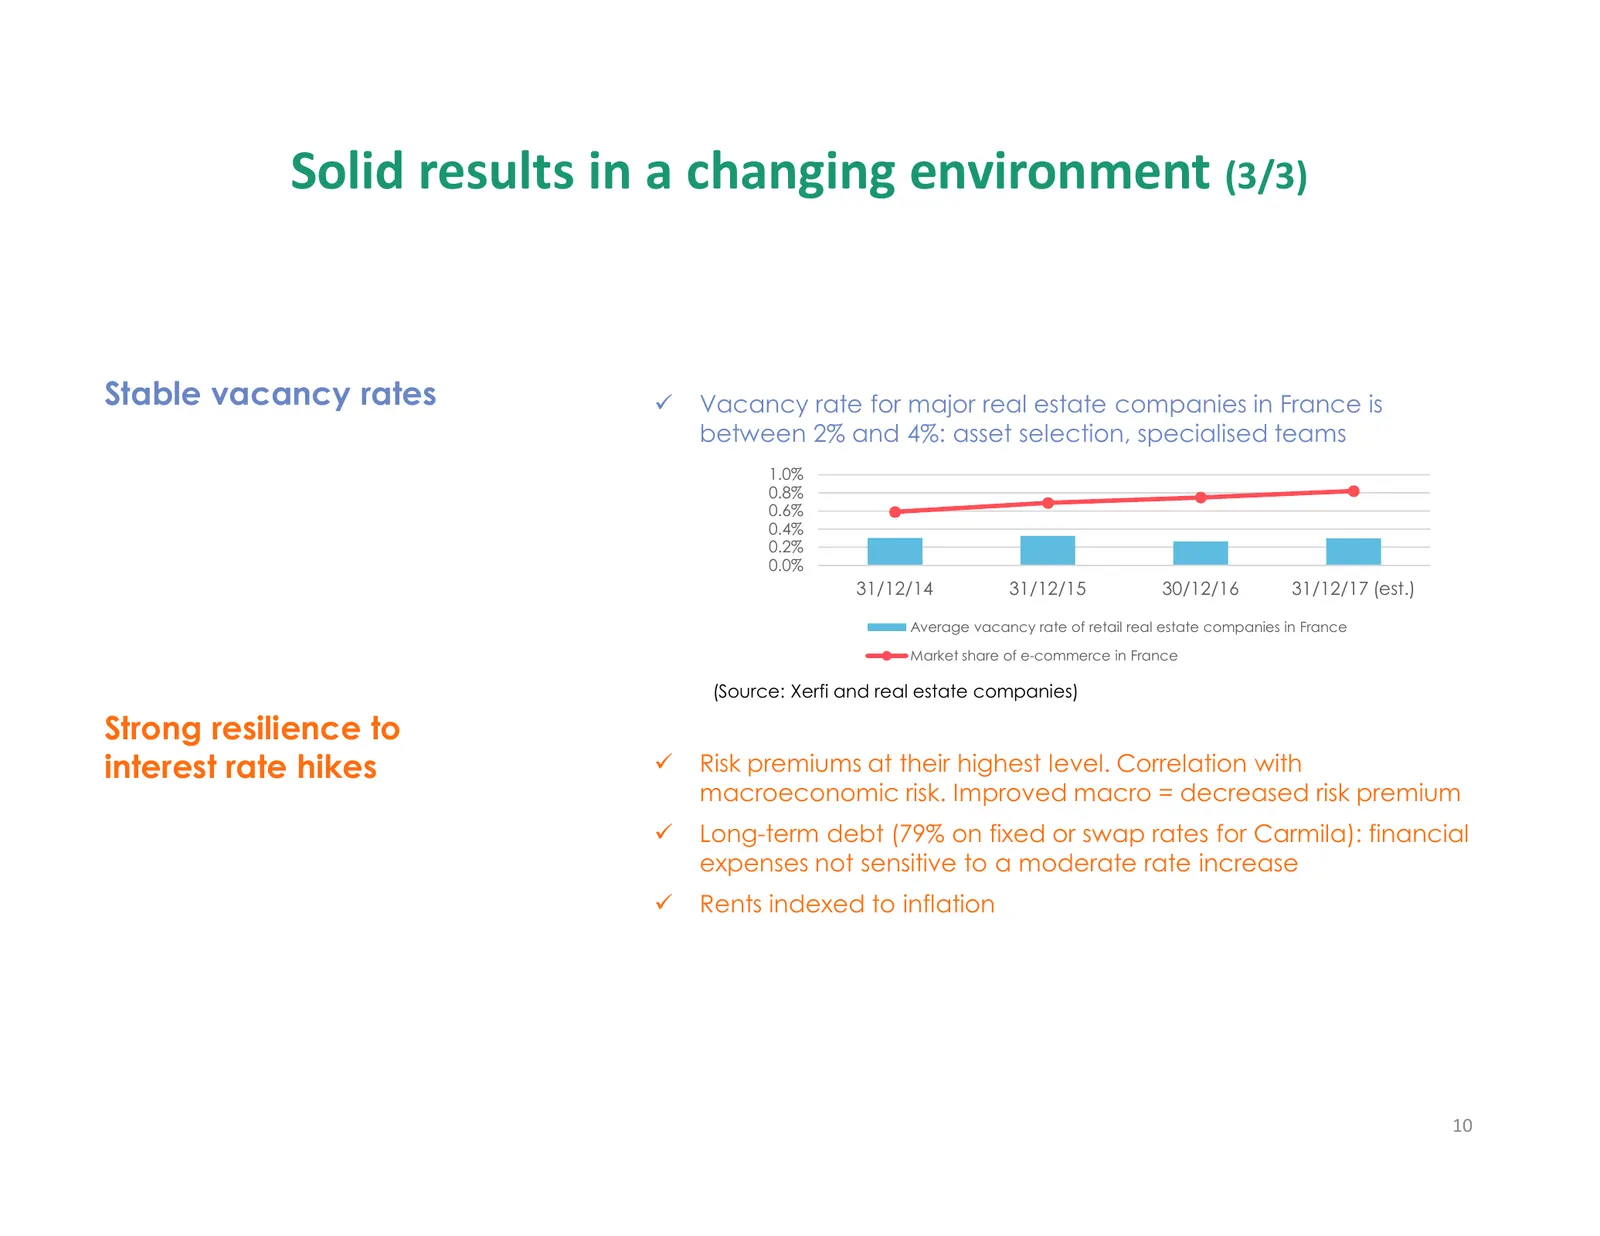
Solid results in a changing environment (3/3) Stable vacancy rates Vacancy rate for major real estate companies in France is between 2% and 4%: asset selection, specialised teams 1.0% 0.8% 0.6% 0.4% 0.2% 0.0% 31/12/14 31/12/15 30/12/16 31/12/17 (est.) Average vacancy rate of retail real estate compa
Slide 11: Retail is a value-creating industry that requires highly-skilled professionals
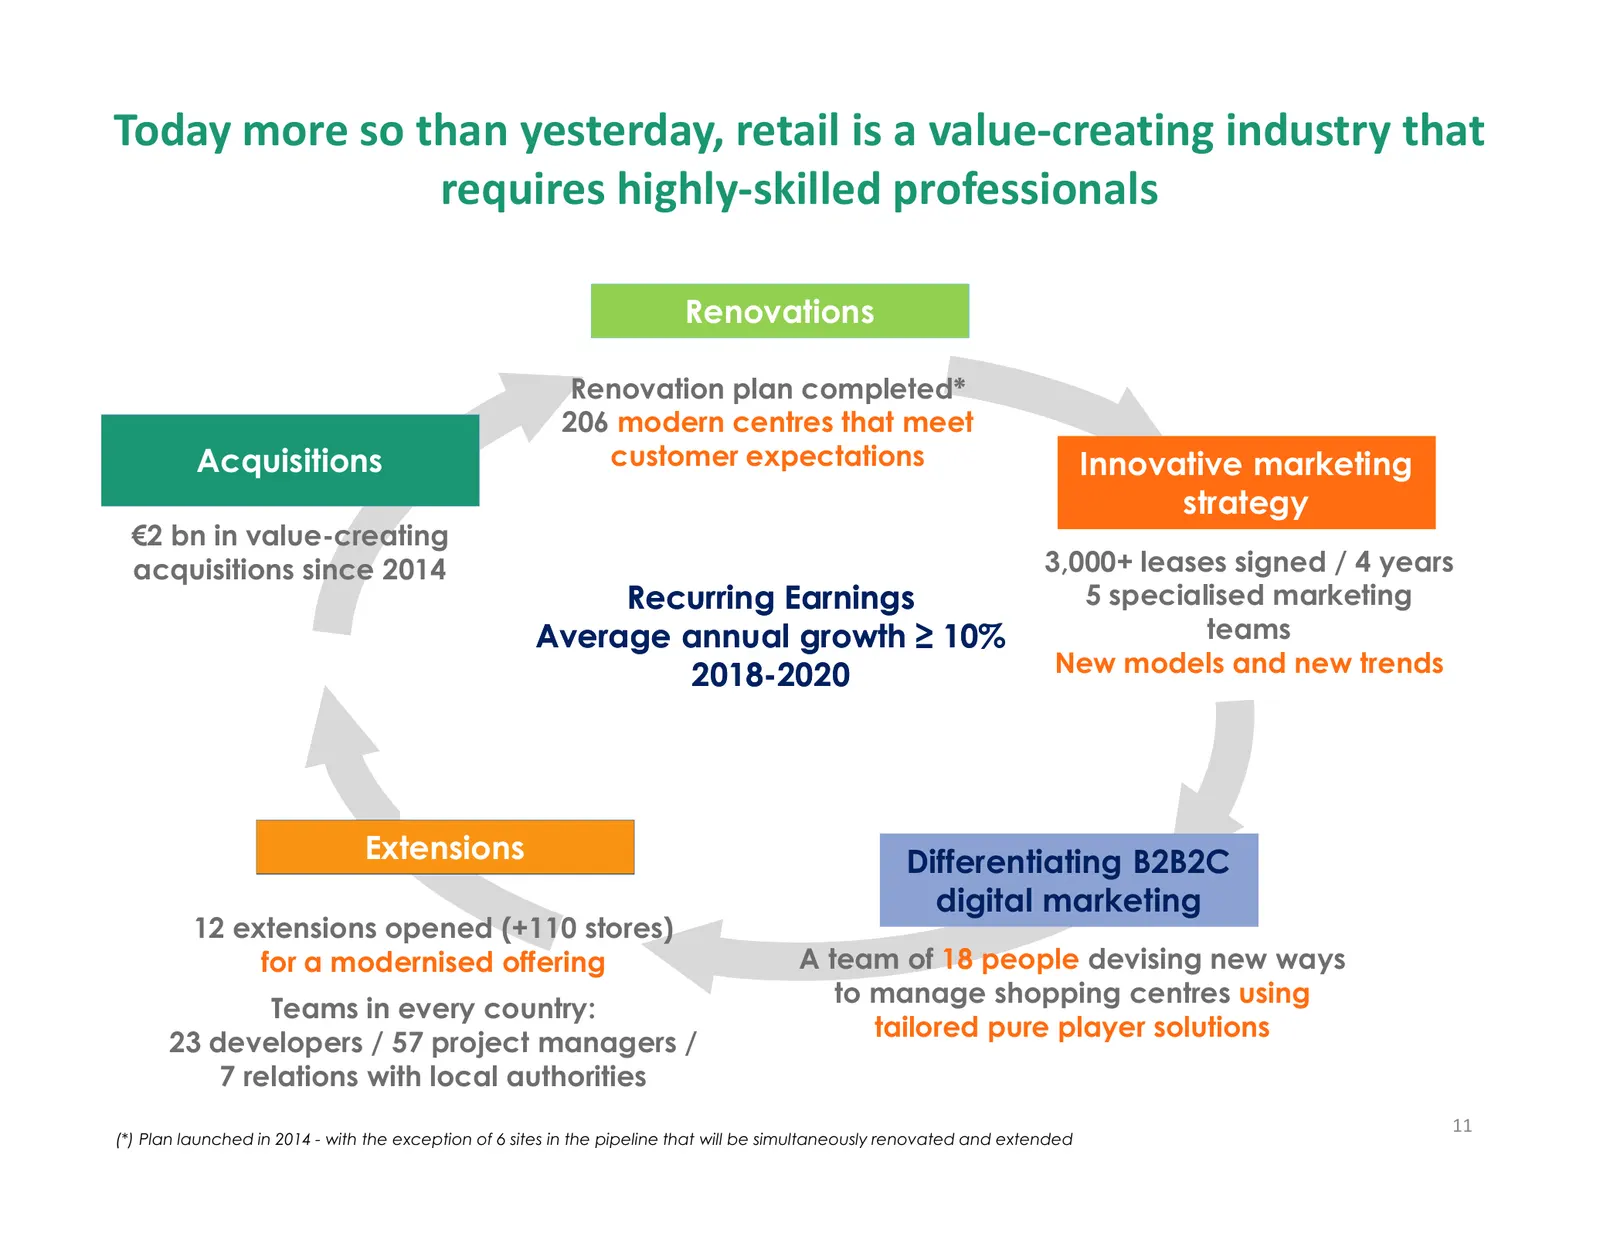
Today more so than yesterday, retail is a value-creating industry that requires highly-skilled professionals Renovations Renovation plan completed* 206 modern centres that meet Acquisitions customer expectations Innovative marketing strategy €2 bn in value-creating acquisitions since 2014 3,000+ lea
Slide 12: Using the skills of specialised teams to address changes in the sector
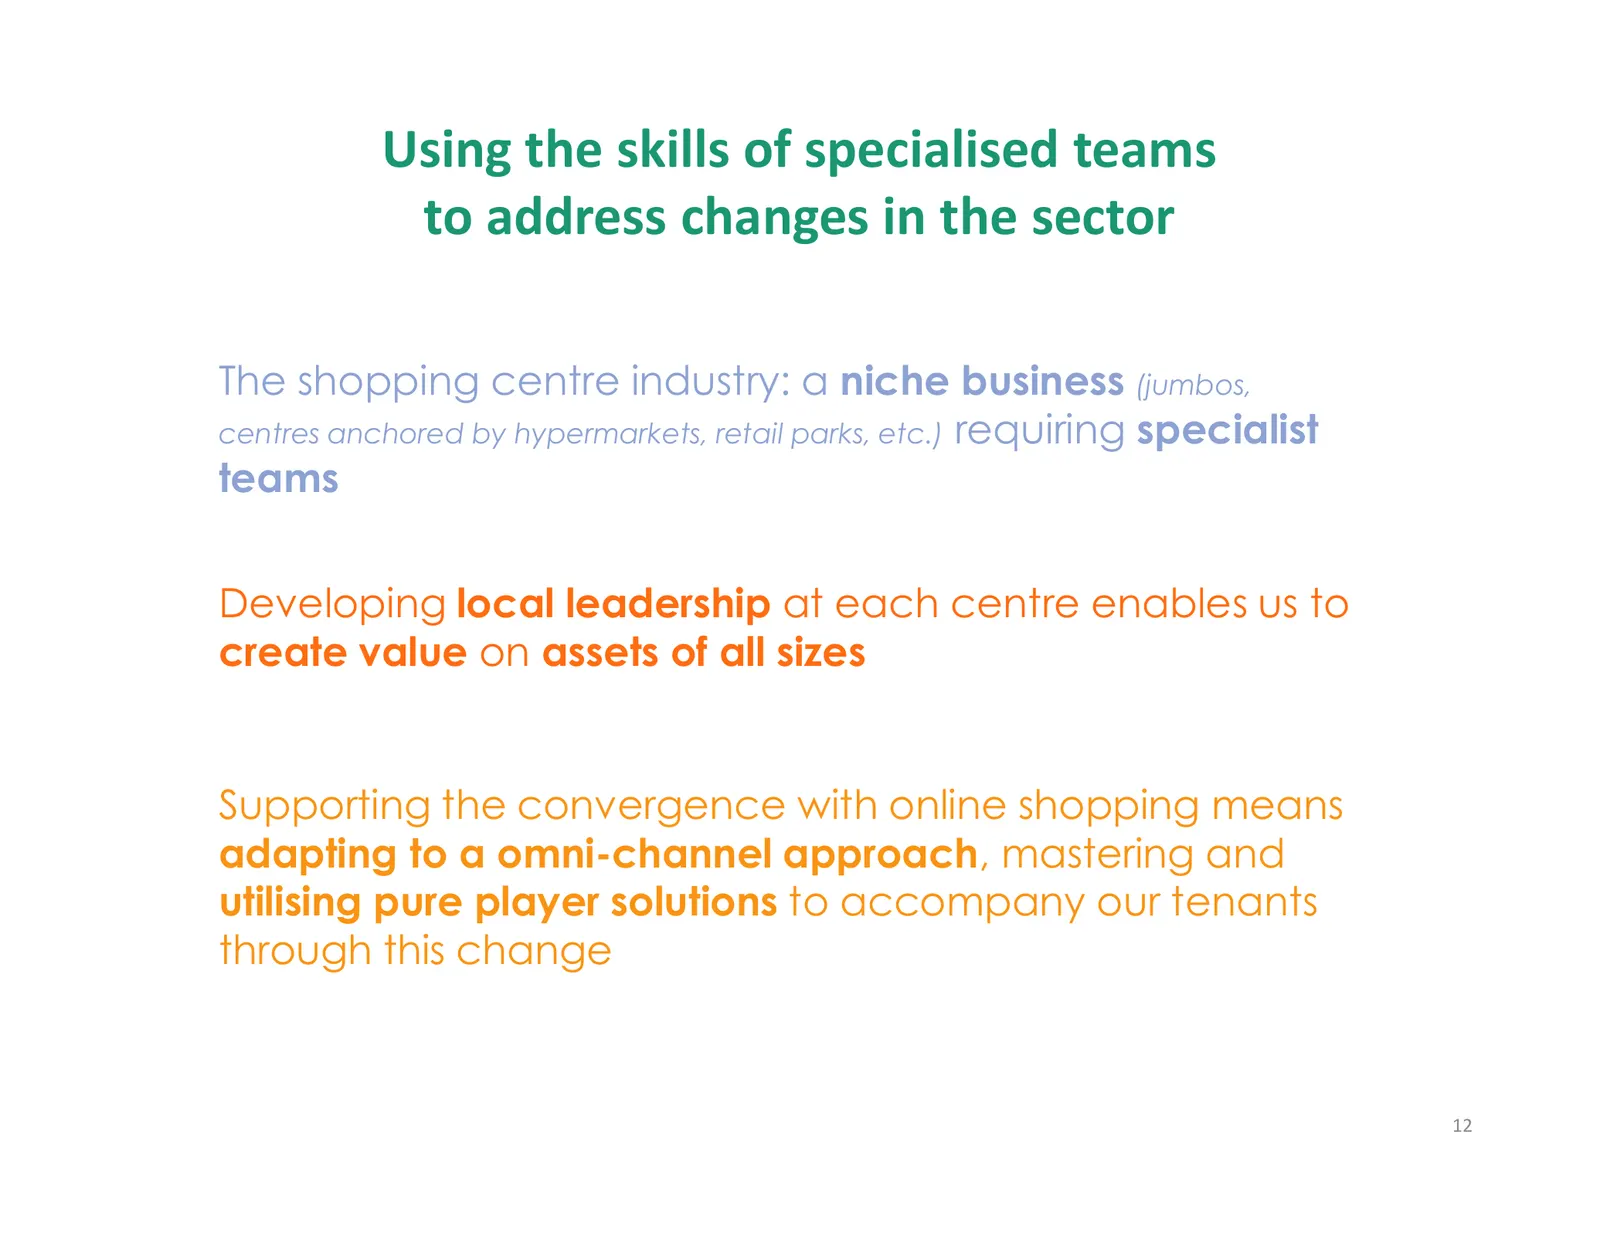
Using the skills of specialised teams to address changes in the sector The shopping centre industry: a niche business (jumbos, centres anchored by hypermarkets, retail parks, etc.) requiring specialist teams Developing local leadership at each centre enables us to create value on assets of all sizes
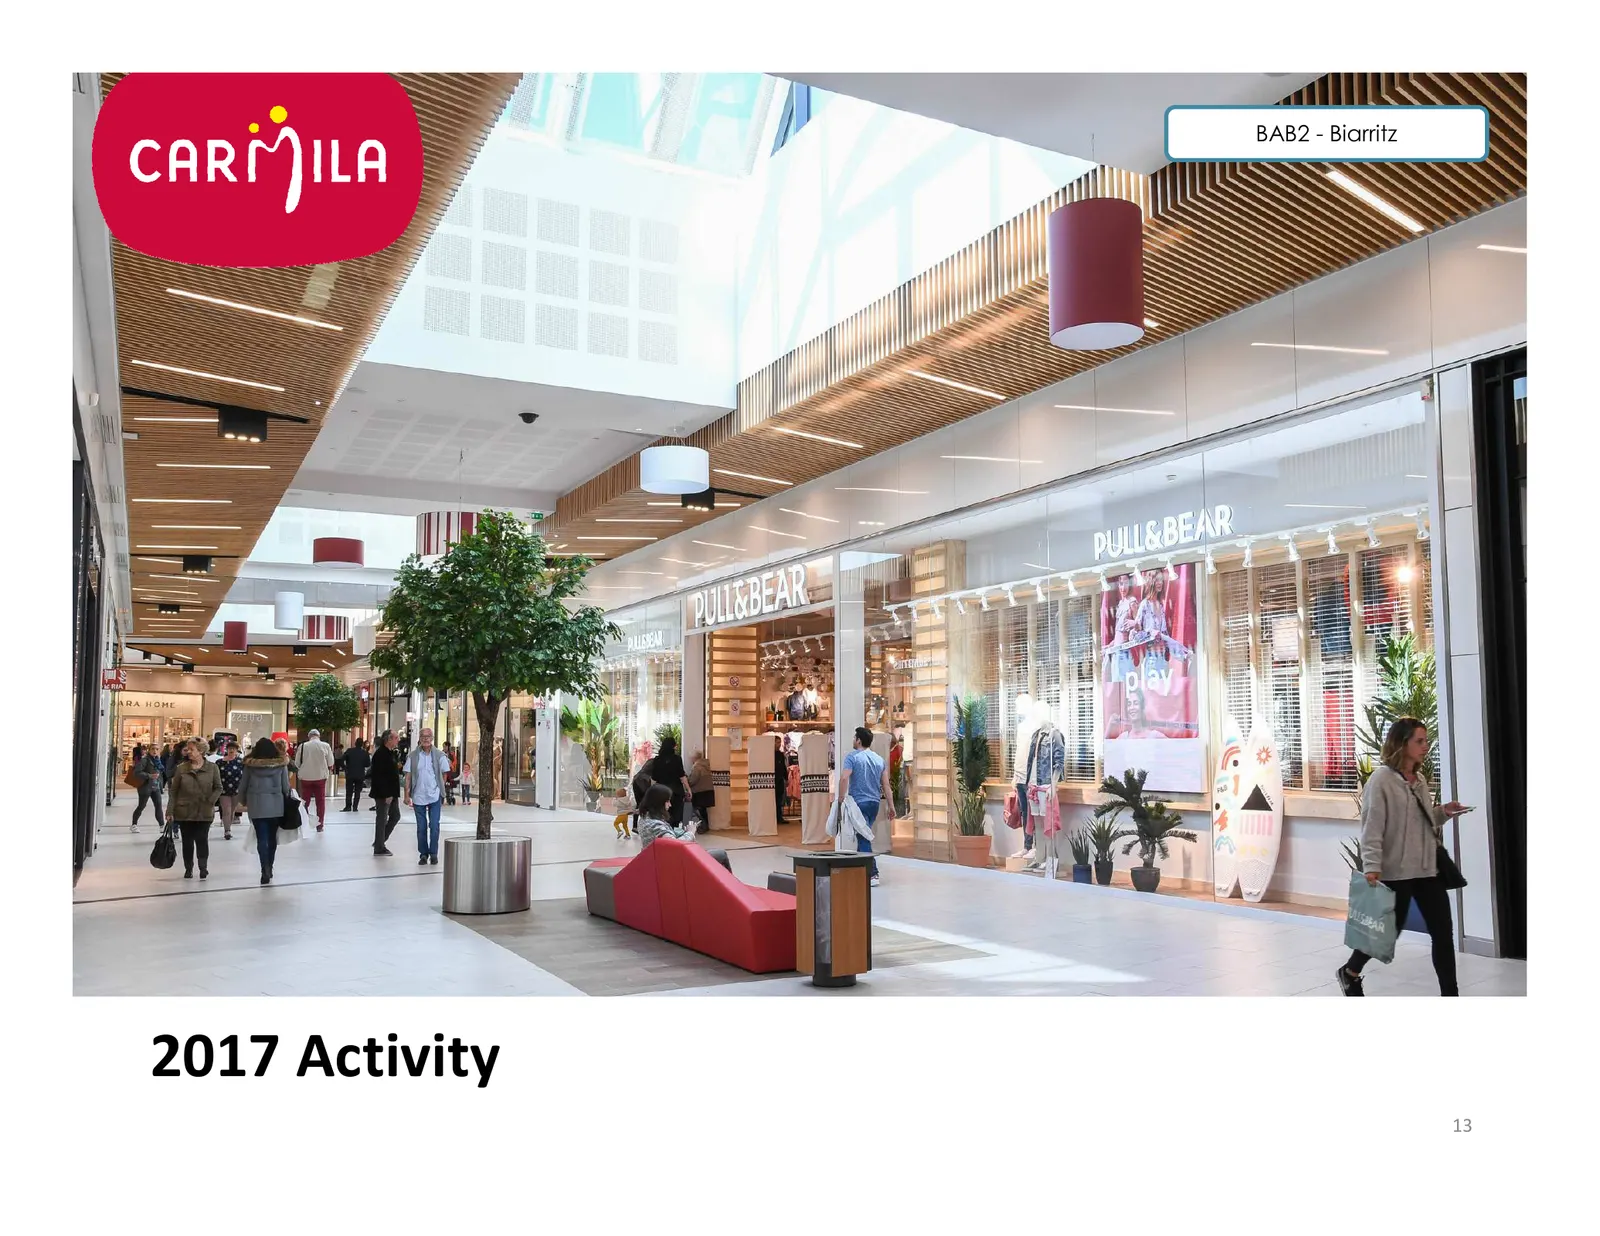
Slide 13: 2017 Activity
BAB2 - Biarritz 2017 Activity 13
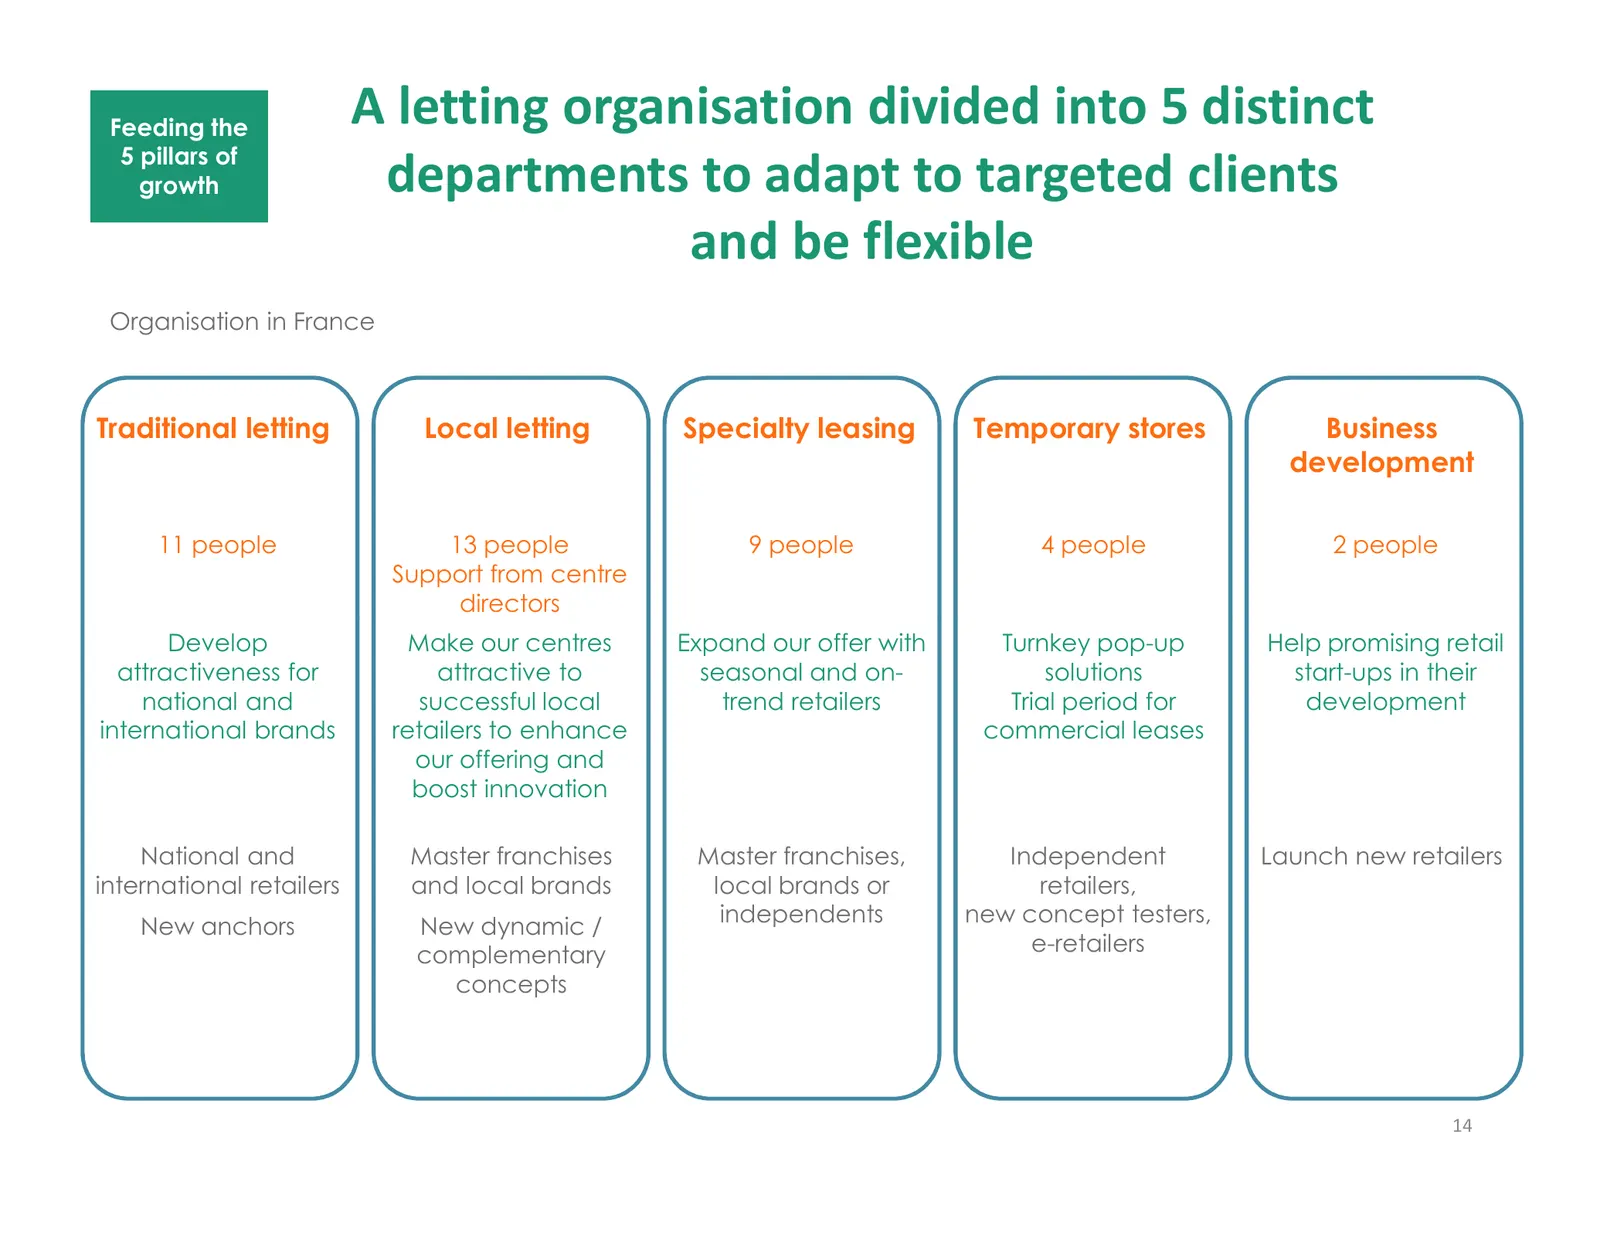
Slide 14: A letting organisation divided into 5 distinct departments
Feeding the A letting organisation divided into 5 distinct 5 pillars of growth departments to adapt to targeted clients and be flexible Organisation in France Traditional letting Local letting Specialty leasing Temporary stores Business development 11 people 13 people 9 people 4 people 2 people Supp
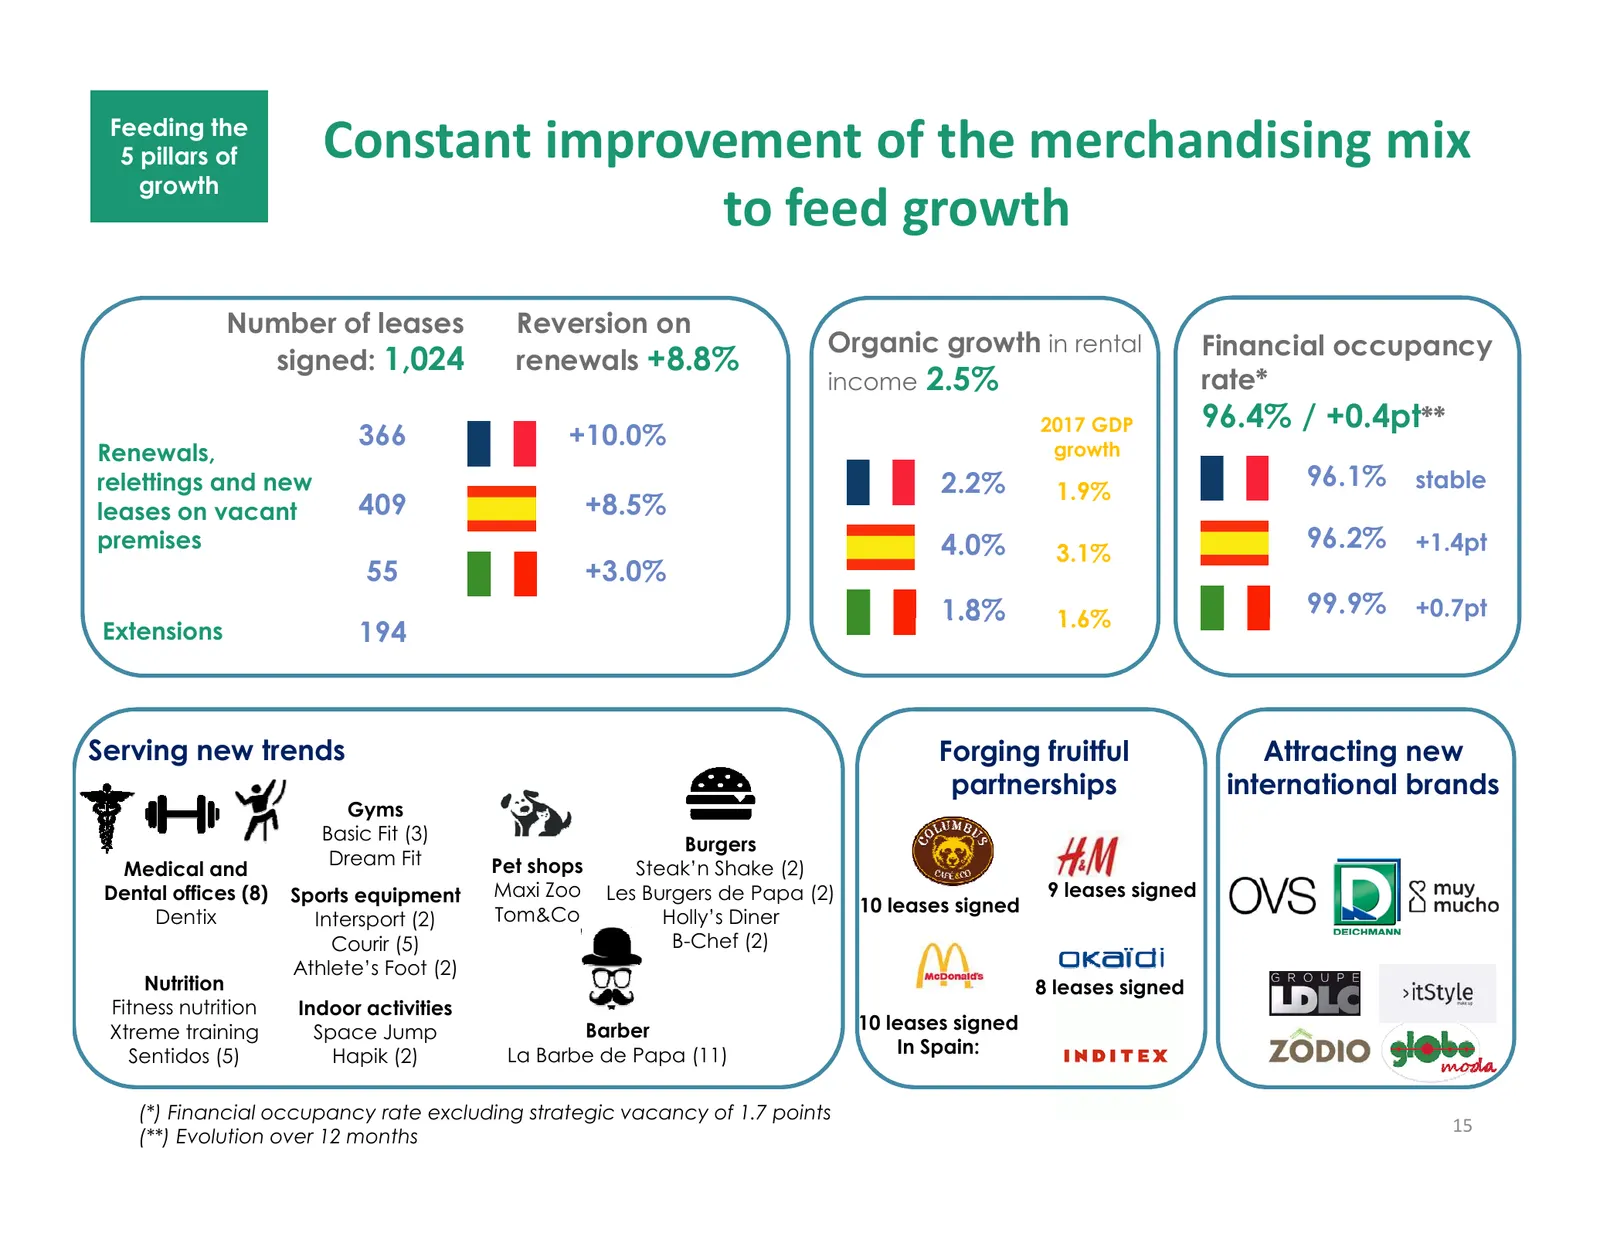
Slide 15: Constant improvement of the merchandising mix to feed growth
Feeding the 5 pillars of Constant improvement of the merchandising mix growth to feed growth Number of leases Reversion on Organic growth in rental Financial occupancy signed: 1,024 renewals +8.8% income 2.5% rate* 2017 GDP 96.4% / +0.4pt** 366 +10.0% growth Renewals, relettings and new 2.2% 1.9% 96
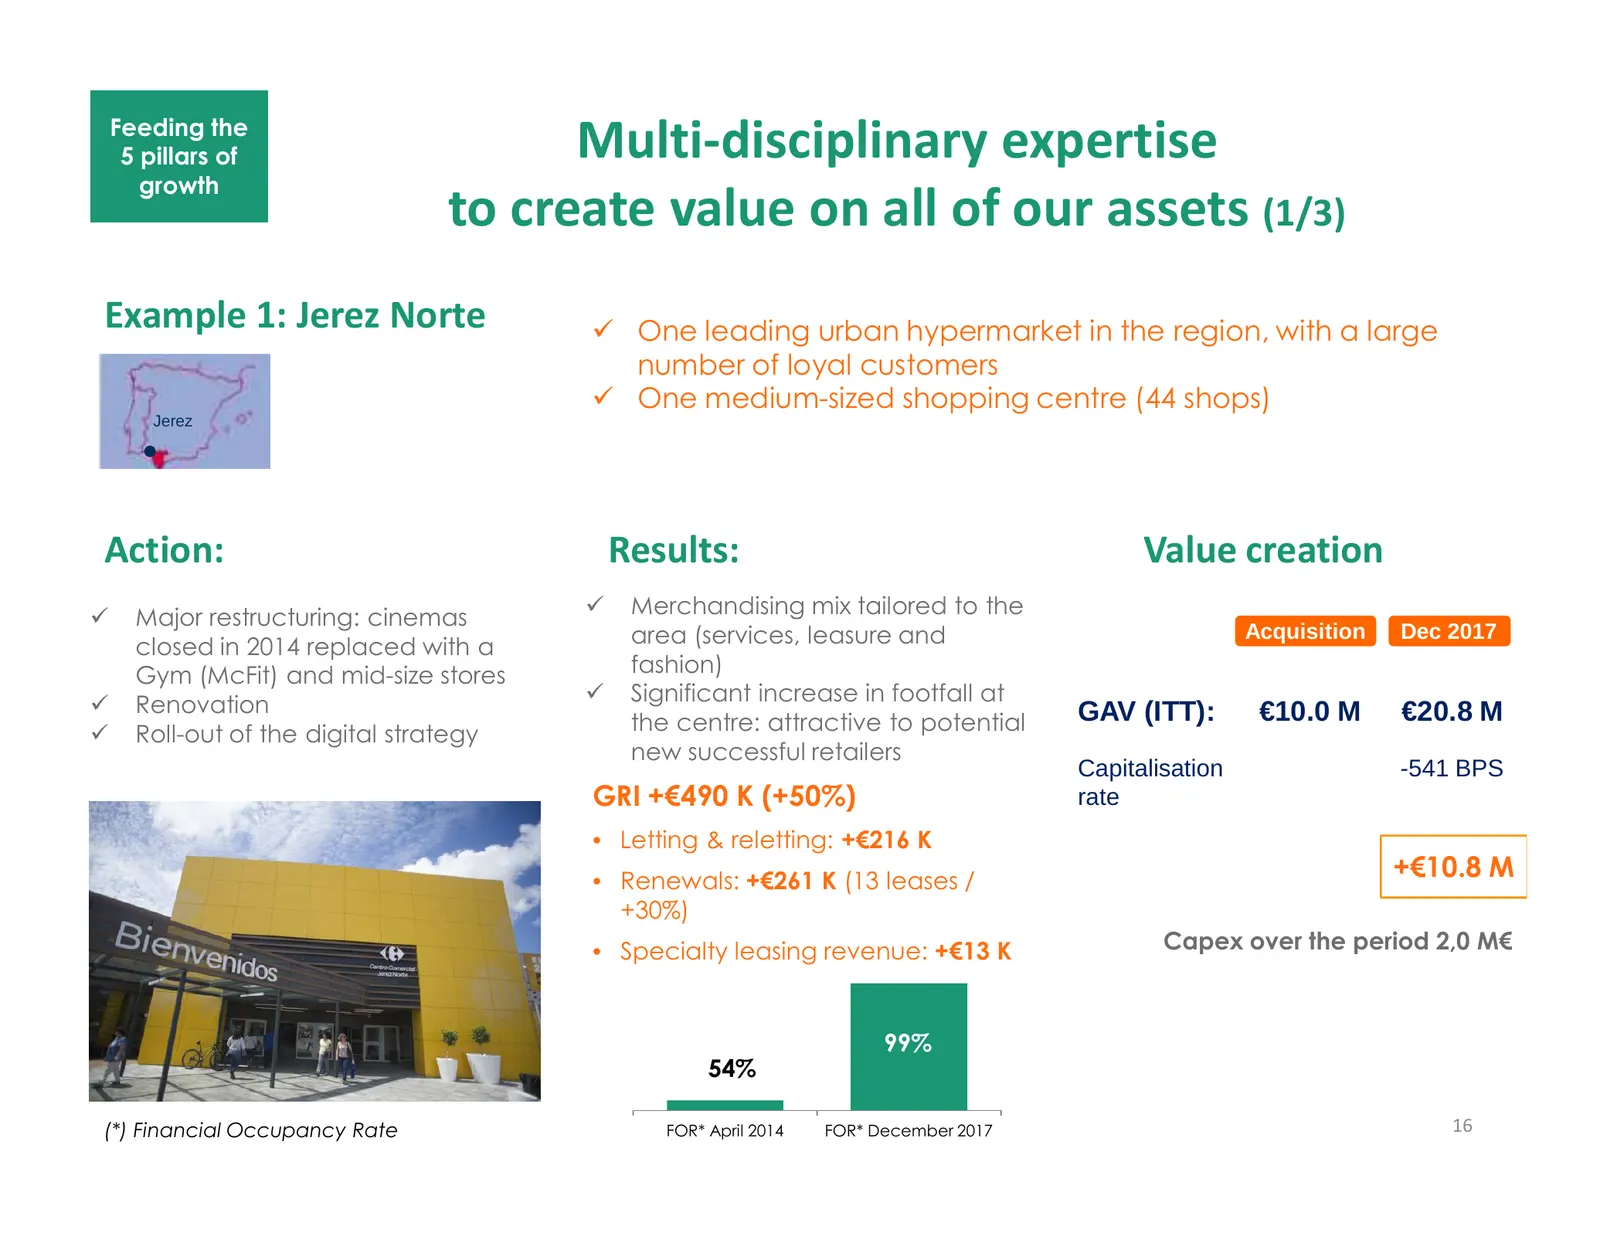
Slide 16: Multi-disciplinary expertise to create value on all of our assets (1/3)
Feeding the 5 pillars of Multi-disciplinary expertise growth to create value on all of our assets (1/3) Example 1: Jerez Norte One leading urban hypermarket in the region, with a large number of loyal customers One medium-sized shopping centre (44 shops) Jerez Action: Results: Value creation Major r
Slide 17: Multi-disciplinary expertise to create value on all of our assets (2/3)
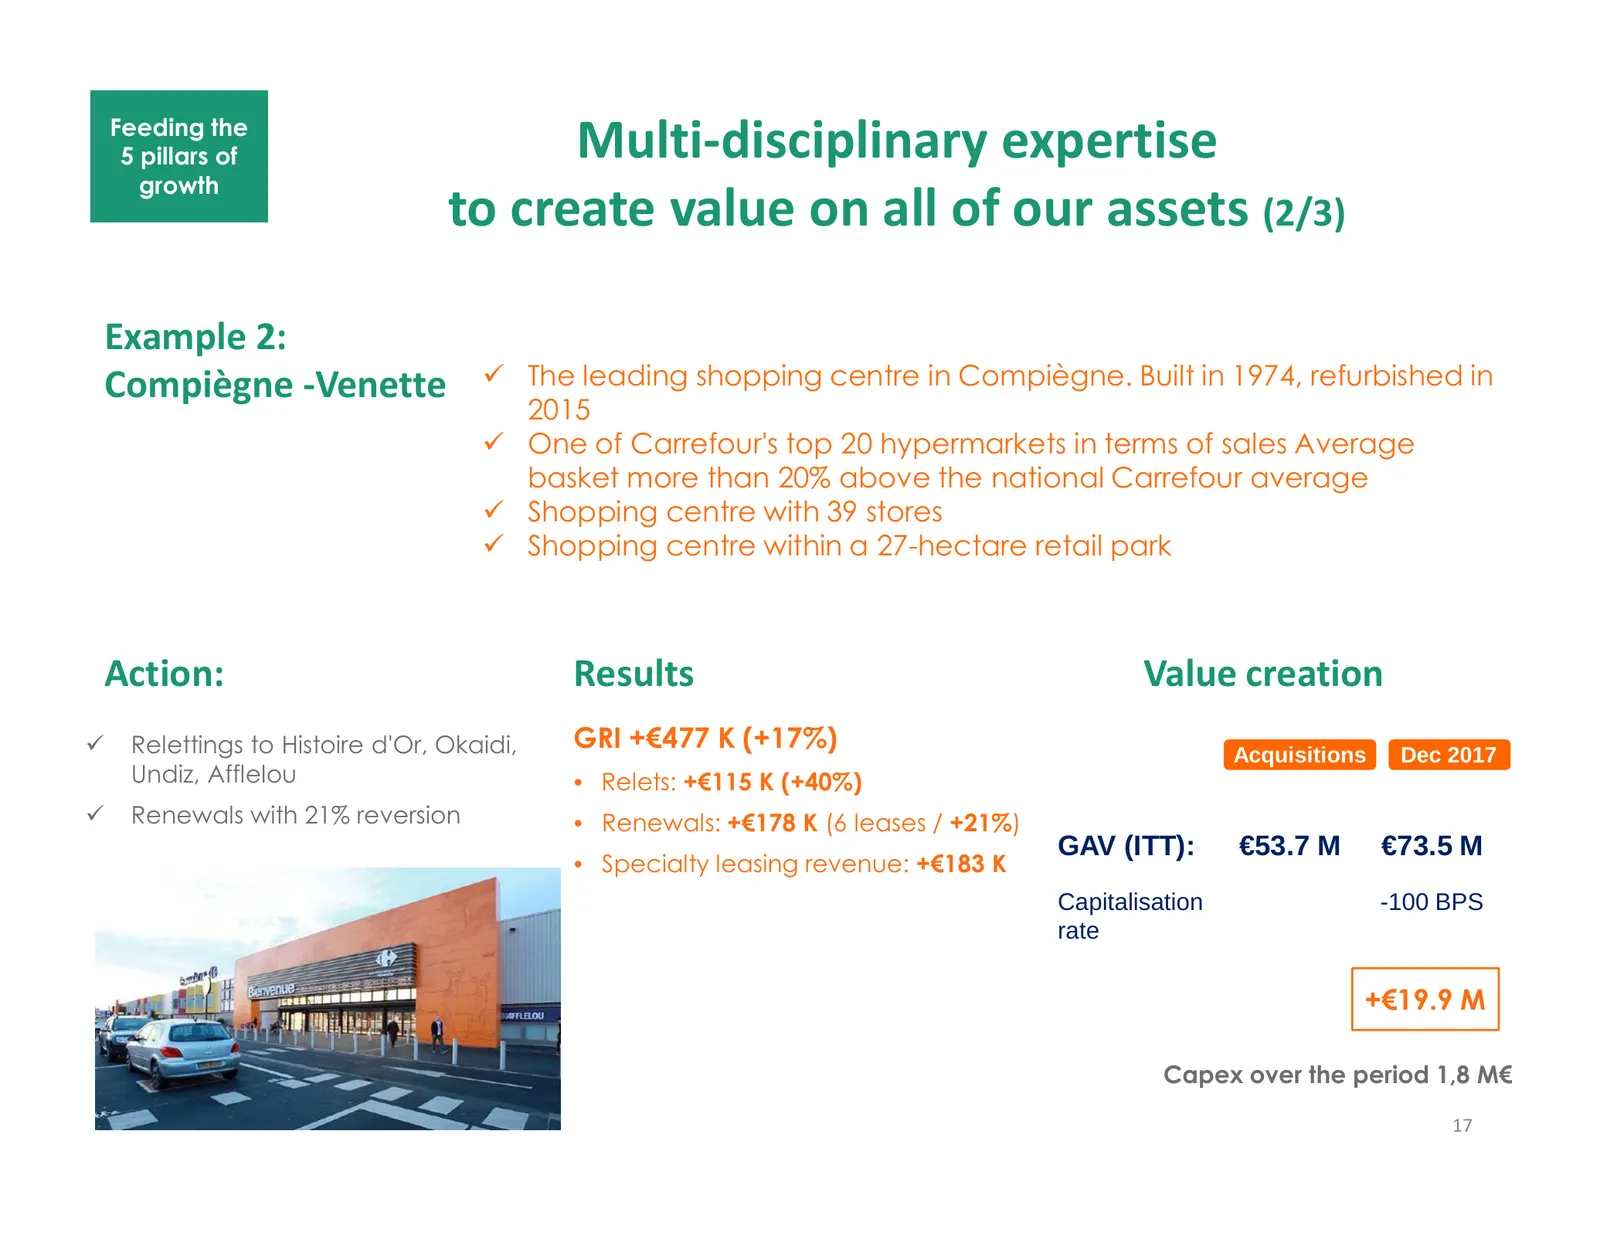
Feeding the 5 pillars of Multi-disciplinary expertise growth to create value on all of our assets (2/3) Example 2: Compiègne -Venette The leading shopping centre in Compiègne. Built in 1974, refurbished in 2015 One of Carrefour's top 20 hypermarkets in terms of sales Average basket more than 20% abo
Slide 18: Multi-disciplinary expertise to create value on all of our assets (3/3)
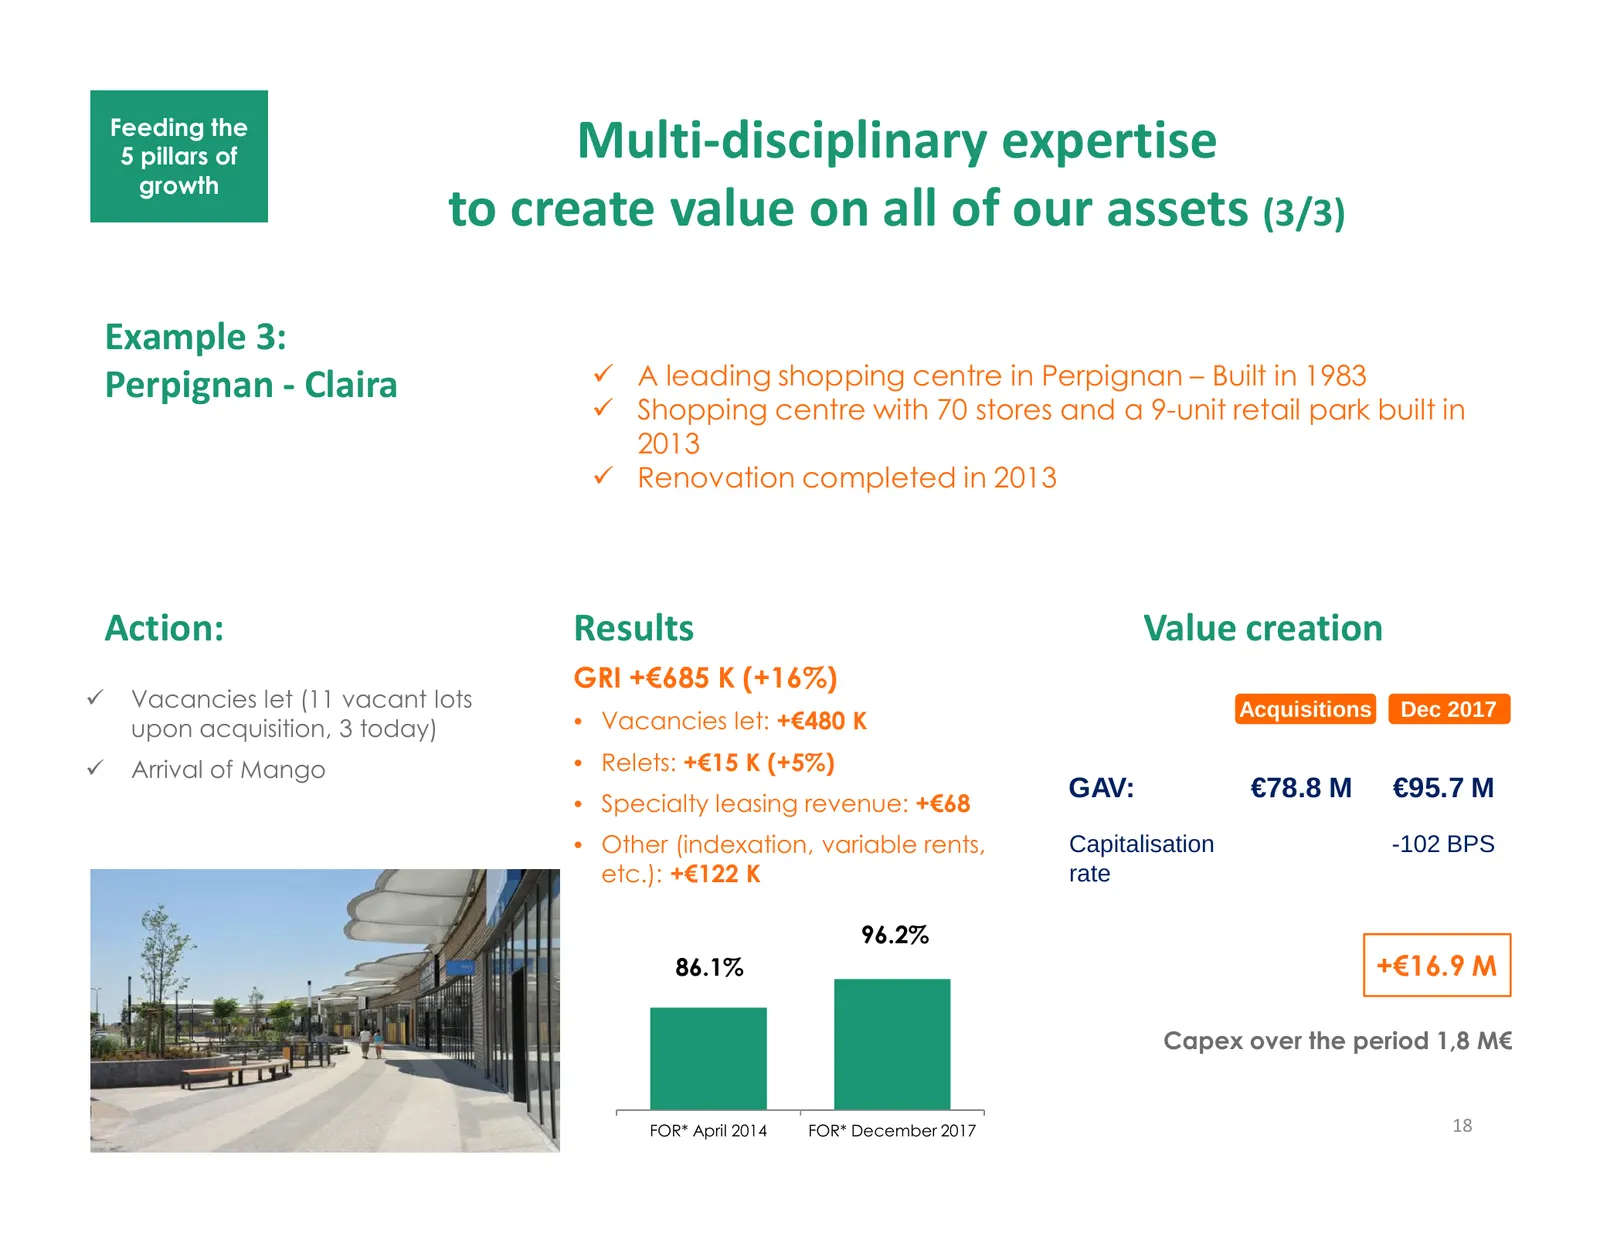
Feeding the 5 pillars of Multi-disciplinary expertise growth to create value on all of our assets (3/3) Example 3: Perpignan - Claira A leading shopping centre in Perpignan – Built in 1983 Shopping centre with 70 stores and a 9-unit retail park built in 2013 Renovation completed in 2013 Action: Resu
Slide 19: Using digital and data management levers to become a local digital marketing expert (1/2)
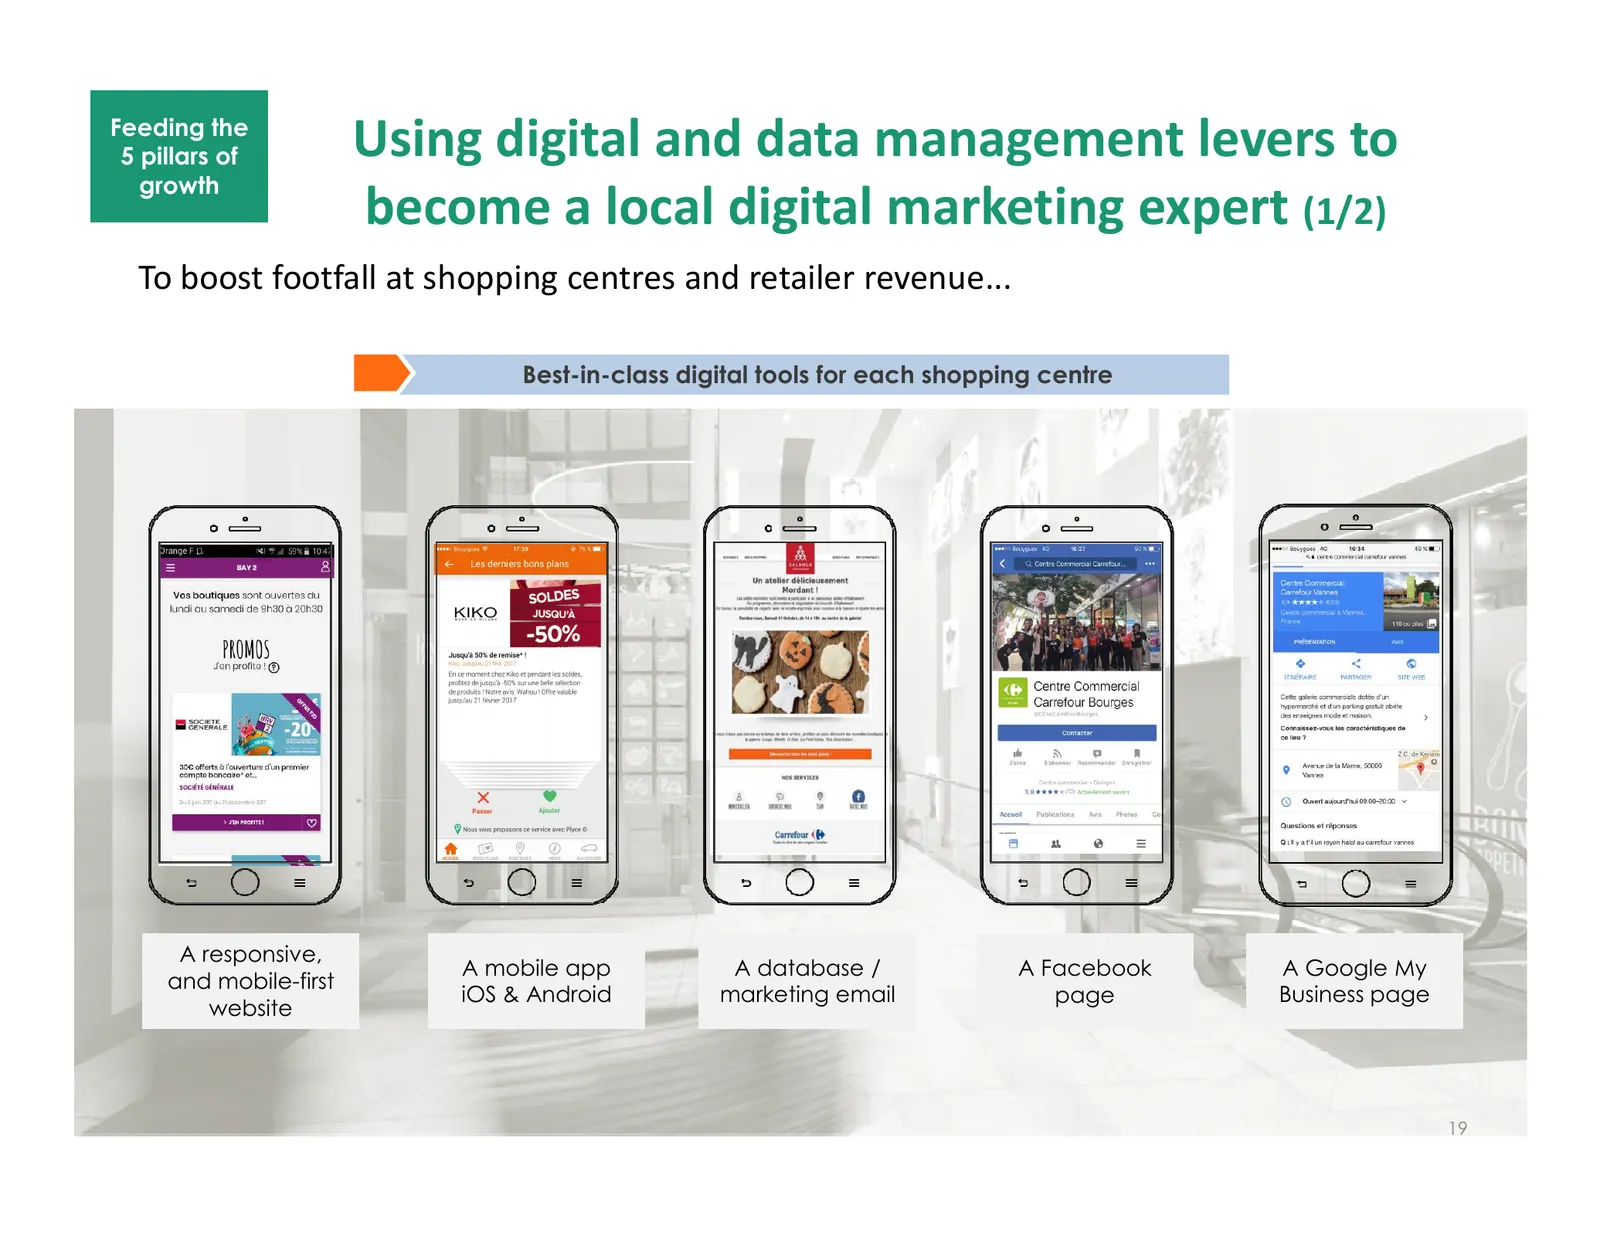
Feeding the 5 pillars of Using digital and data management levers to growth become a local digital marketing expert (1/2) To boost footfall at shopping centres and retailer revenue... Best-in-class digital tools for each shopping centre A responsive, A mobile app A database / A Facebook A Google My
Slide 20: Using digital and data management levers to become a local digital marketing expert (2/2)
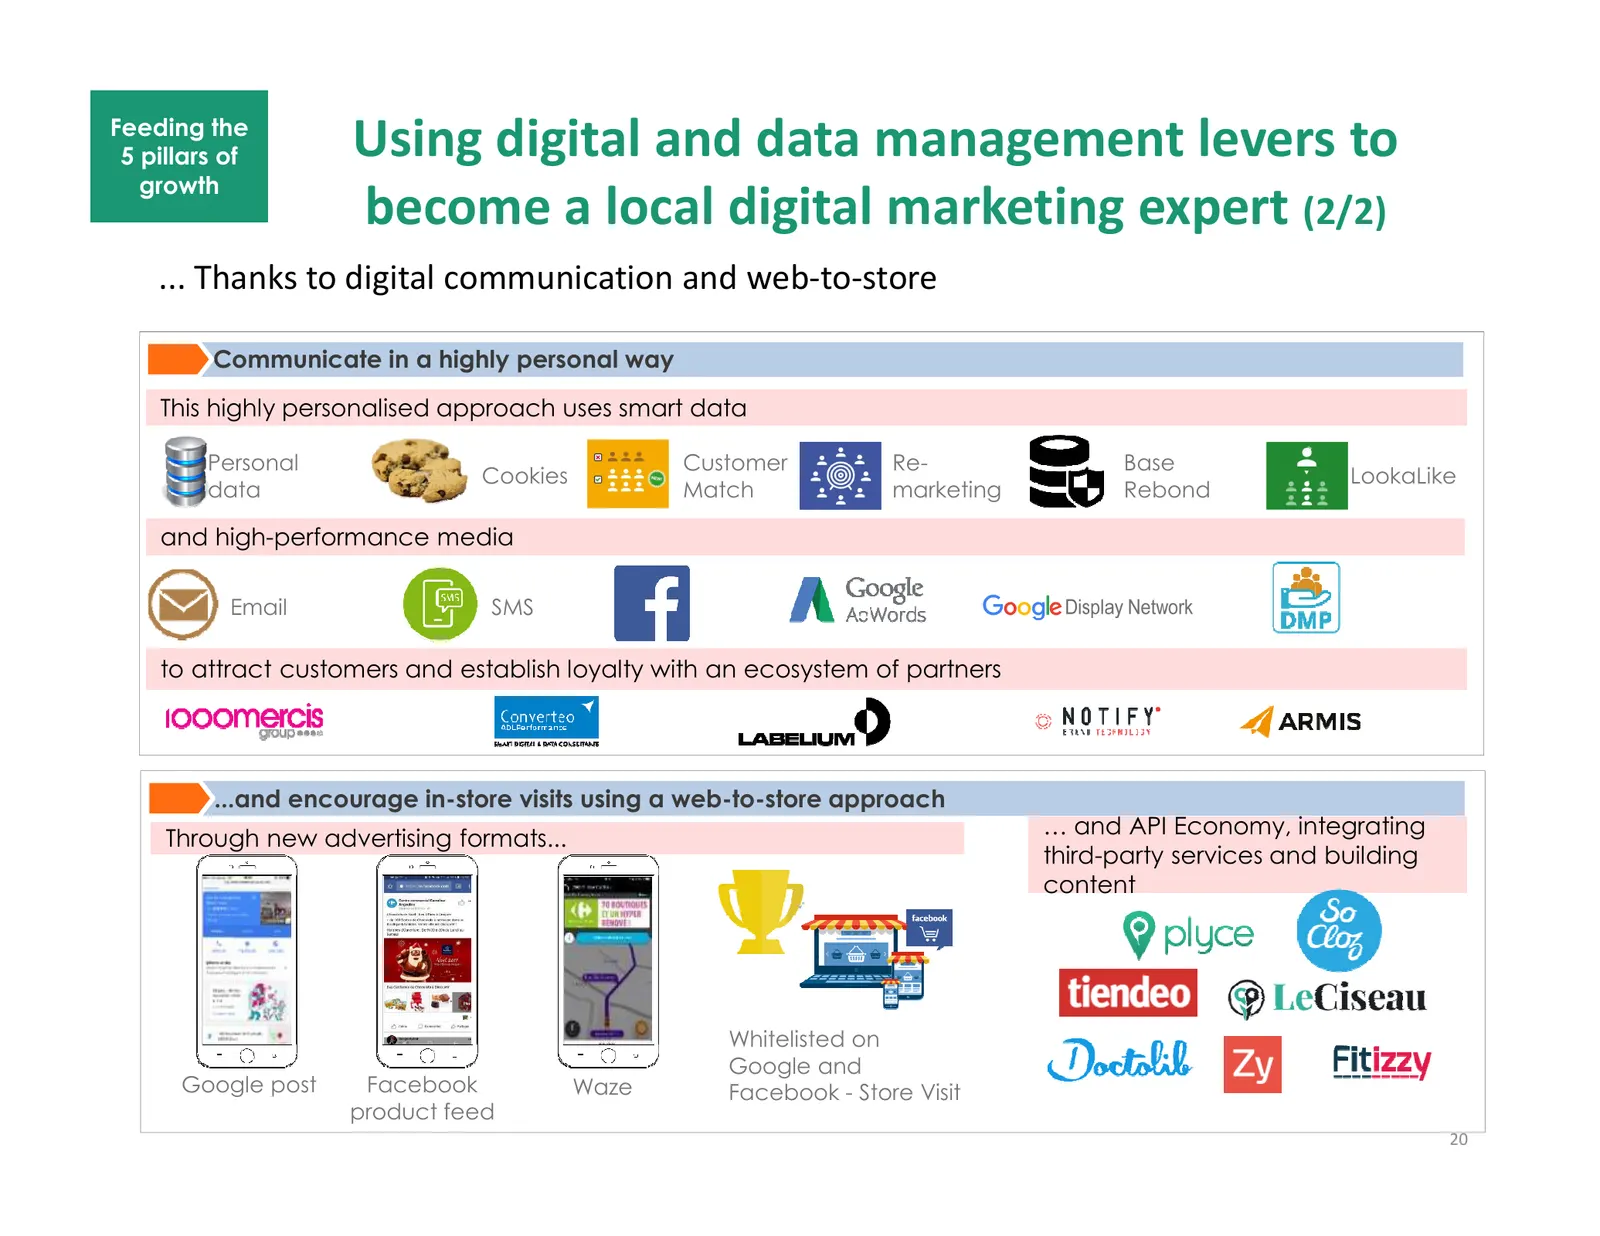
Feeding the 5 pillars of Using digital and data management levers to growth become a local digital marketing expert (2/2) ... Thanks to digital communication and web-to-store Communicate in a highly personal way This highly personalised approach uses smart data Personal Customer Re- Base Cookies Loo
Slide 21: Distributed marketing to guarantee scalability and agility
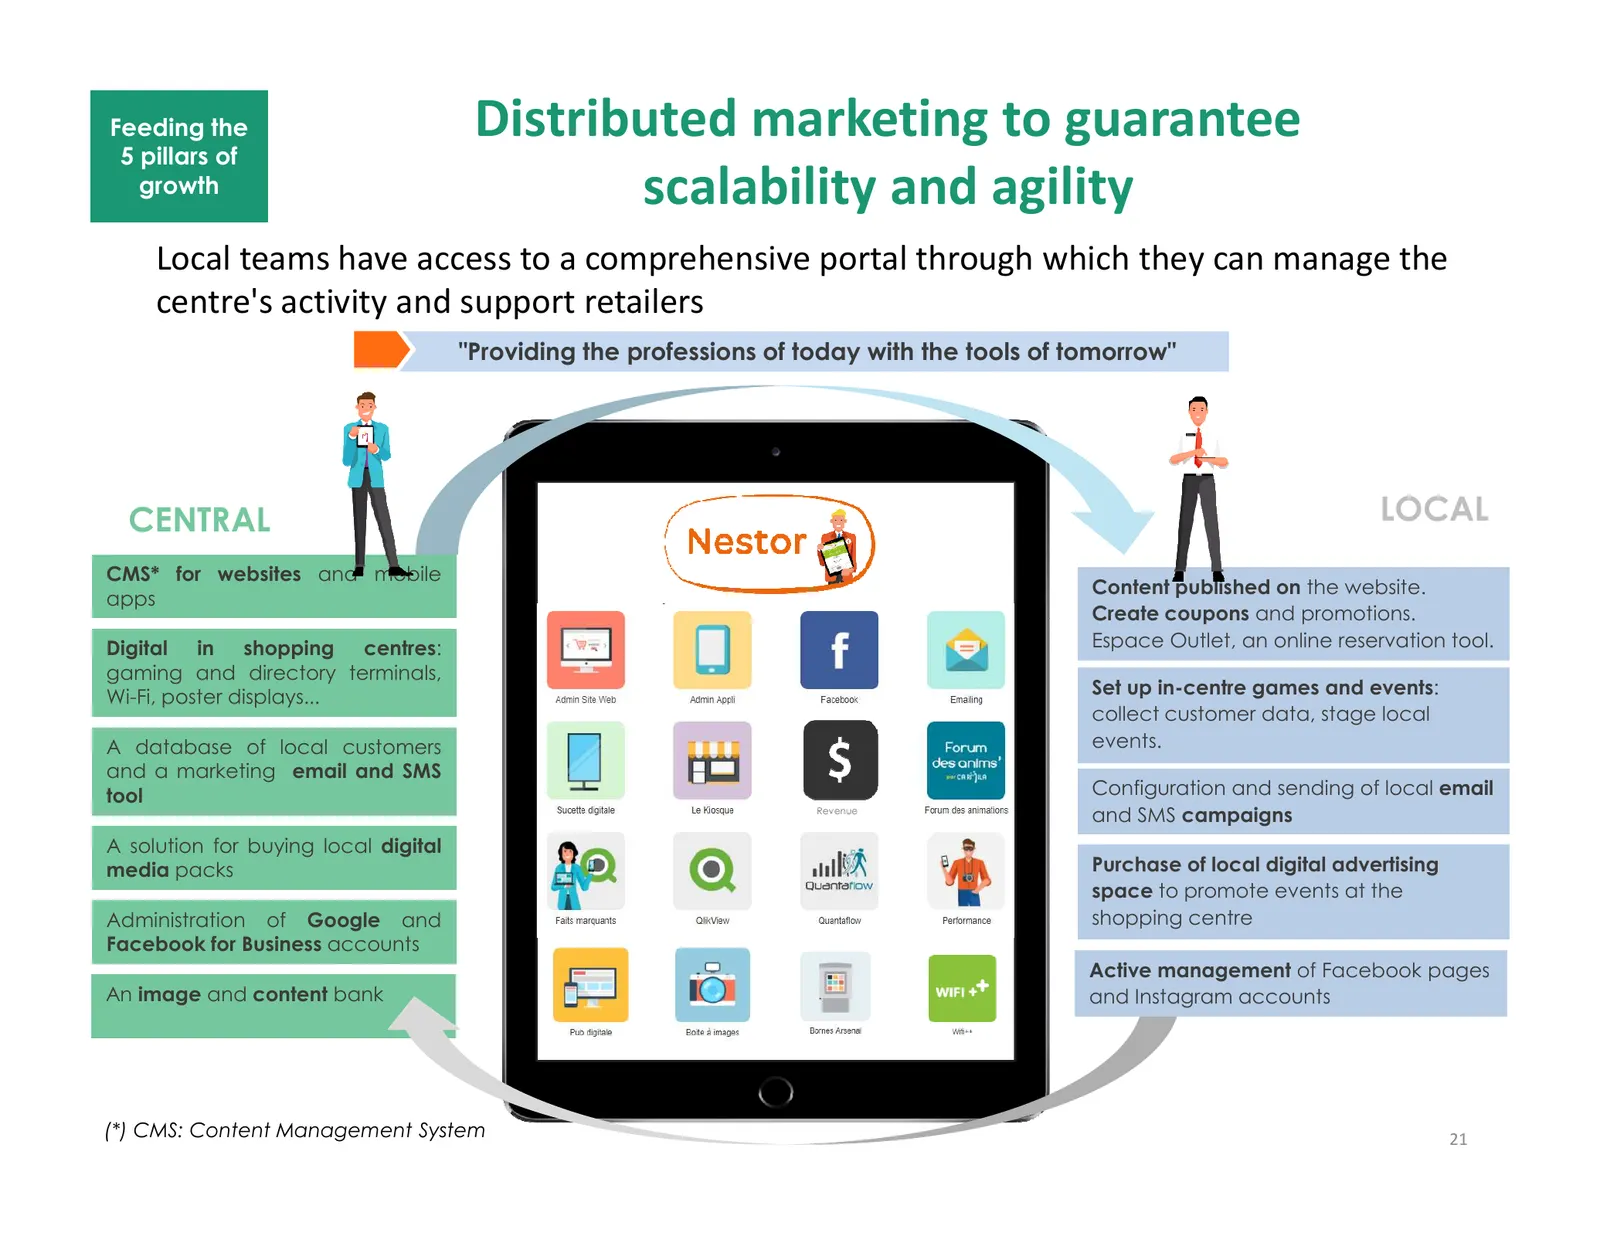
Feeding the Distributed marketing to guarantee 5 pillars of growth scalability and agility Local teams have access to a comprehensive portal through which they can manage the centre's activity and support retailers "Providing the professions of today with the tools of tomorrow" CENTRAL LOCAL CMS* fo
Slide 22: Result: significant rise in activity
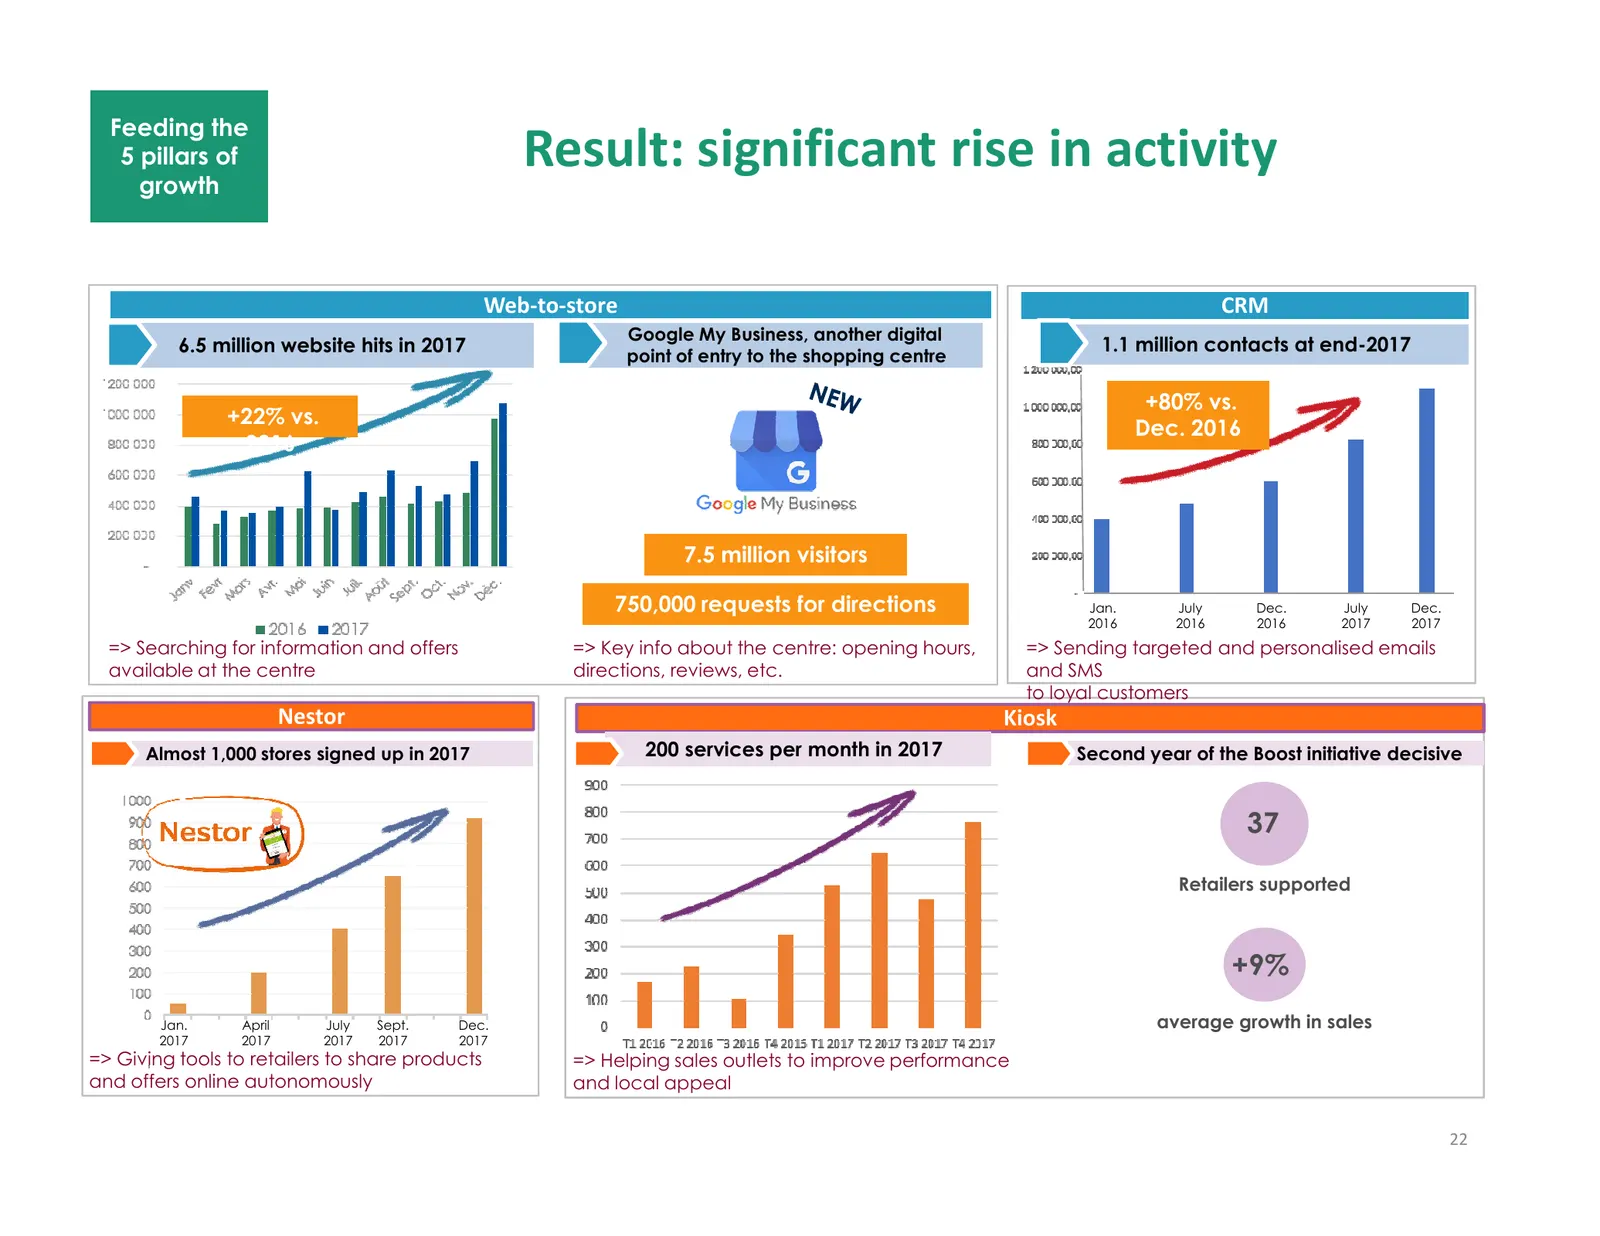
Feeding the 5 pillars of growth Result: significant rise in activity Web-to-store CRM Google My Business, another digital 6.5 million website hits in 2017 1.1 million contacts at end-2017 point of entry to the shopping centre +80% vs. +22% vs. Dec. 2016 2016 7.5 million visitors 750,000 requests for
Slide 23: Some examples of digital campaigns
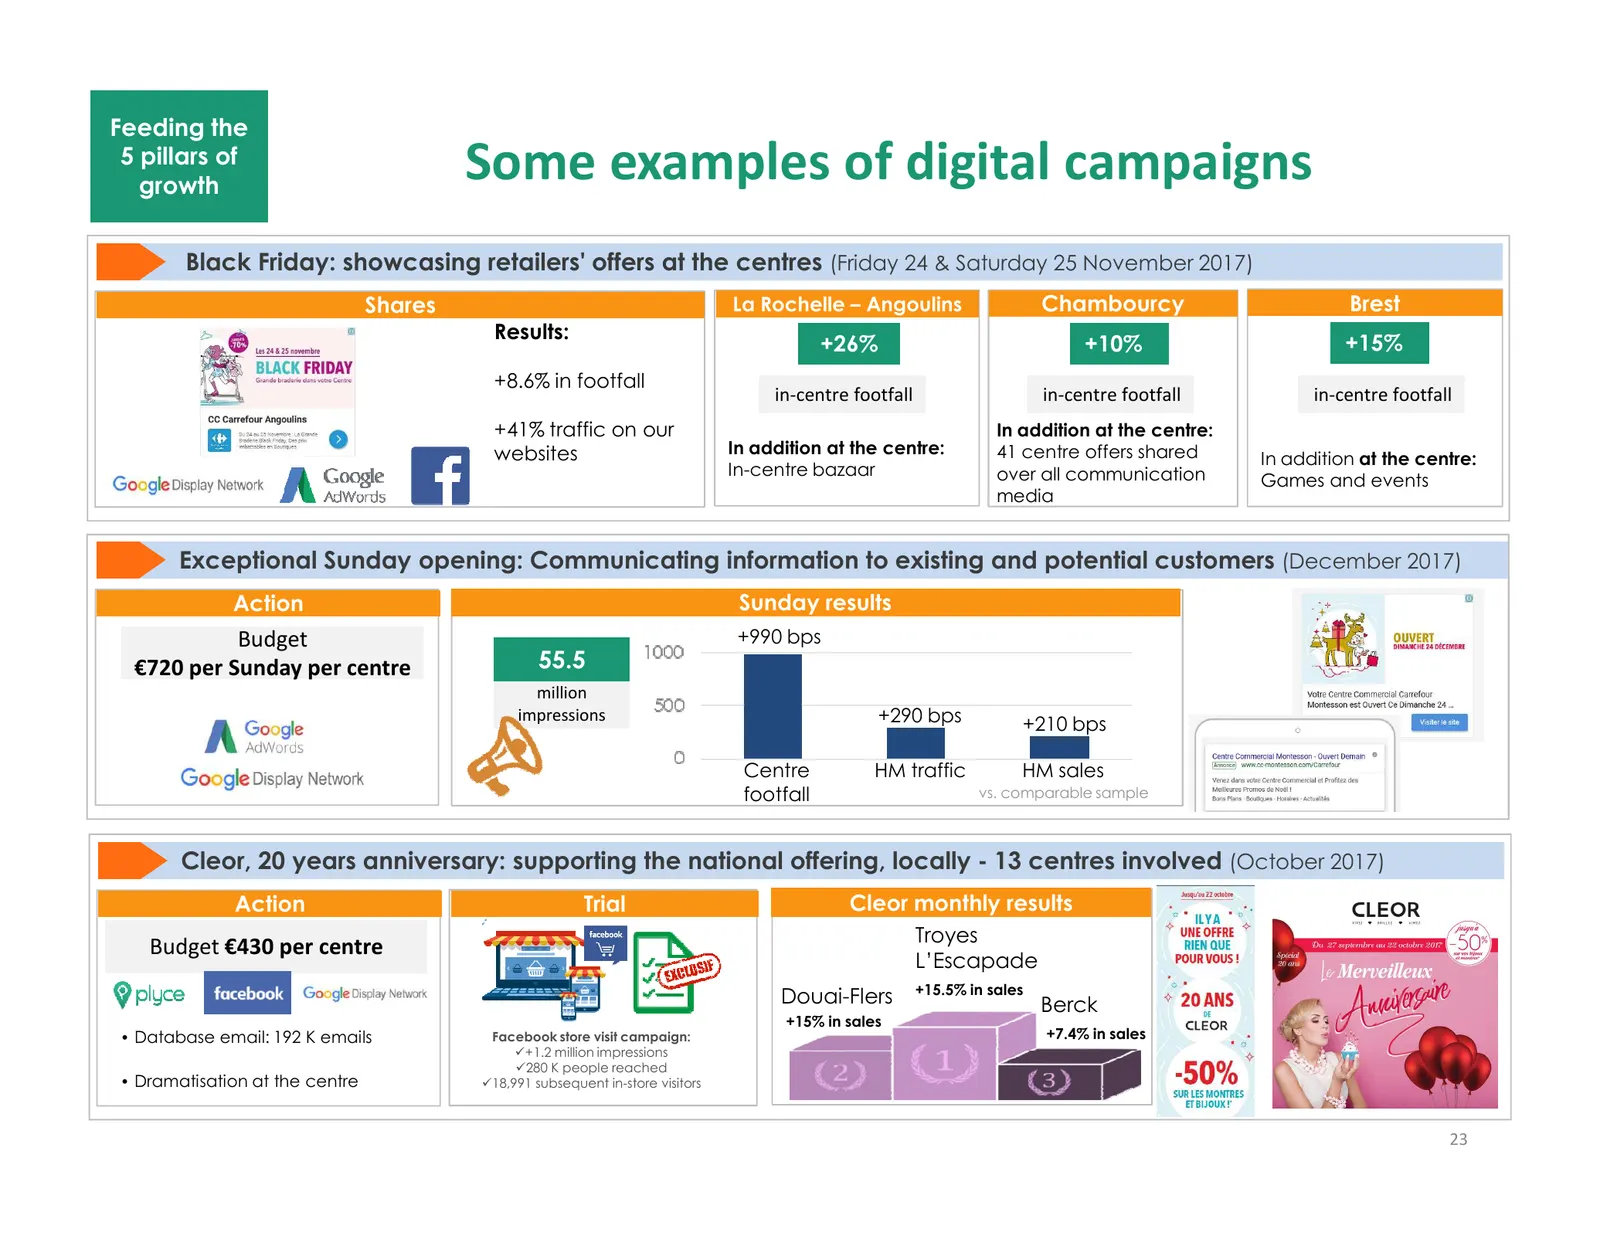
Feeding the 5 pillars of growth Some examples of digital campaigns Black Friday: showcasing retailers' offers at the centres (Friday 24 & Saturday 25 November 2017) Shares La Rochelle – Angoulins Chambourcy Brest Results: +26% +10% +15% +8.6% in footfall in-centre footfall in-centre footfall in-cent
Slide 24: Examples of service kiosk B2B2C initiative
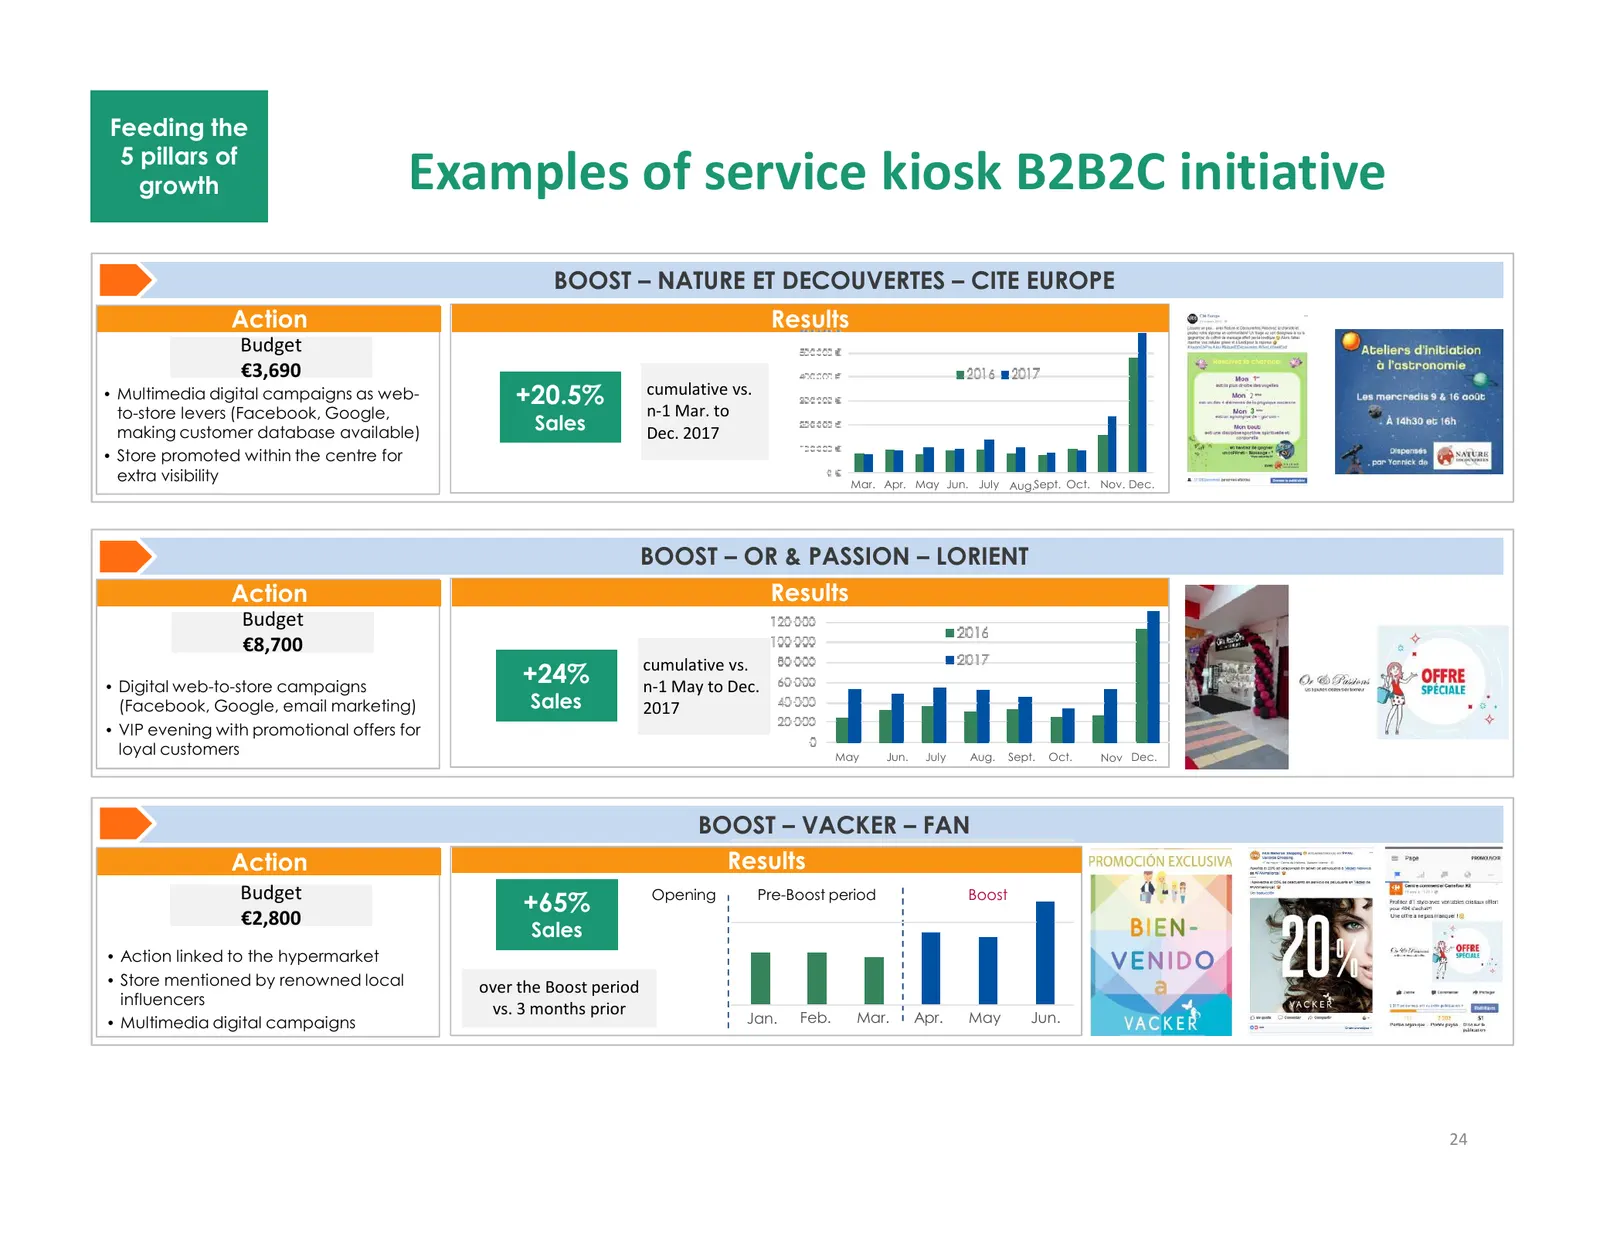
Feeding the 5 pillars of growth Examples of service kiosk B2B2C initiative BOOST – NATURE ET DECOUVERTES – CITE EUROPE Action Results Budget €3,690 cumulative vs. +5% • Multimedia digital campaigns as web- +20.5% n-1 Mar. to to-store levers (Facebook, Google, making customer database available) Sale
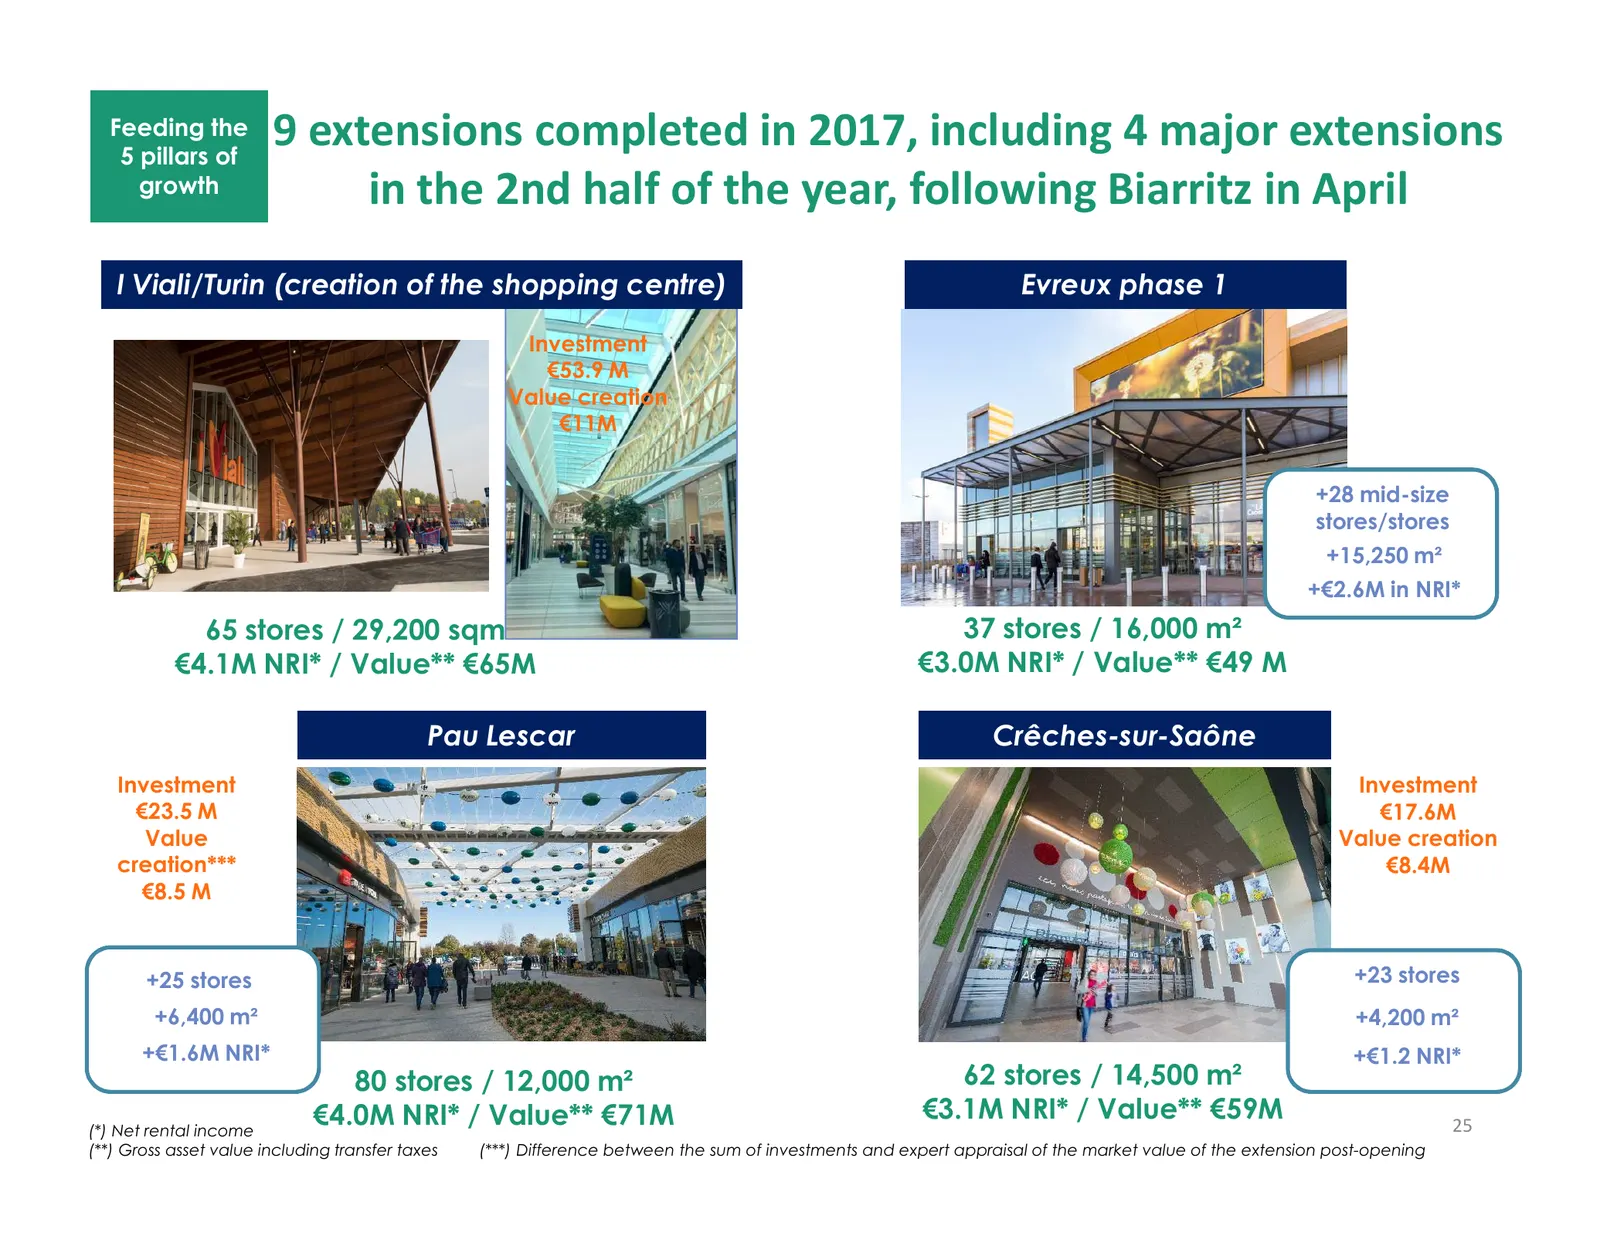
Slide 25: 9 extensions completed in 2017
Feeding the 5 pillars of 9 extensions completed in 2017, including 4 major extensions growth in the 2nd half of the year, following Biarritz in April I Viali/Turin (creation of the shopping centre) Evreux phase 1 Investment €53.9 M Value creation €11M +28 mid-size stores/stores +15,250 m² +€2.6M in
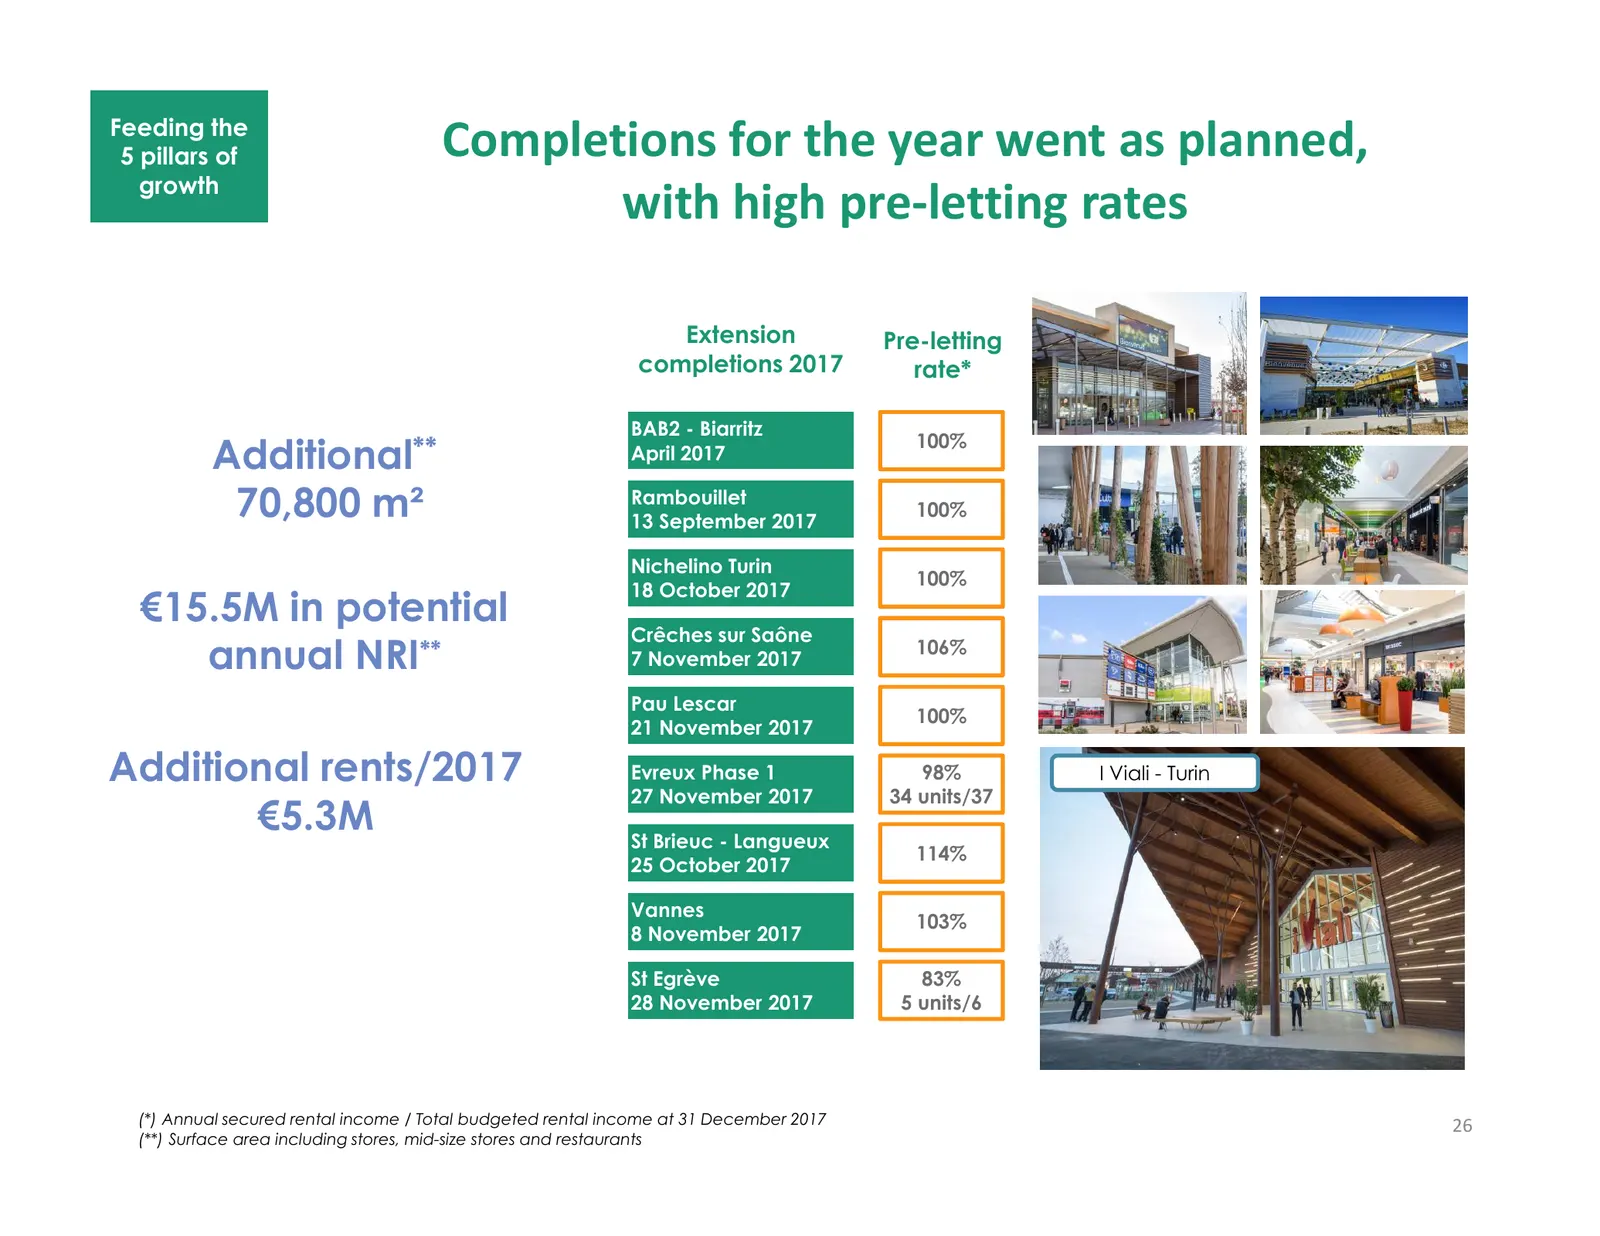
Slide 26: Completions for the year went as planned, with high pre-letting rates
Feeding the 5 pillars of Completions for the year went as planned, growth with high pre-letting rates Extension Pre-letting completions 2017 rate* BAB2 - Biarritz 100% Additional** April 2017 70,800 m² Rambouillet 13 September 2017 100% Nichelino Turin 100% 18 October 2017 €15.5M in potential Crêche
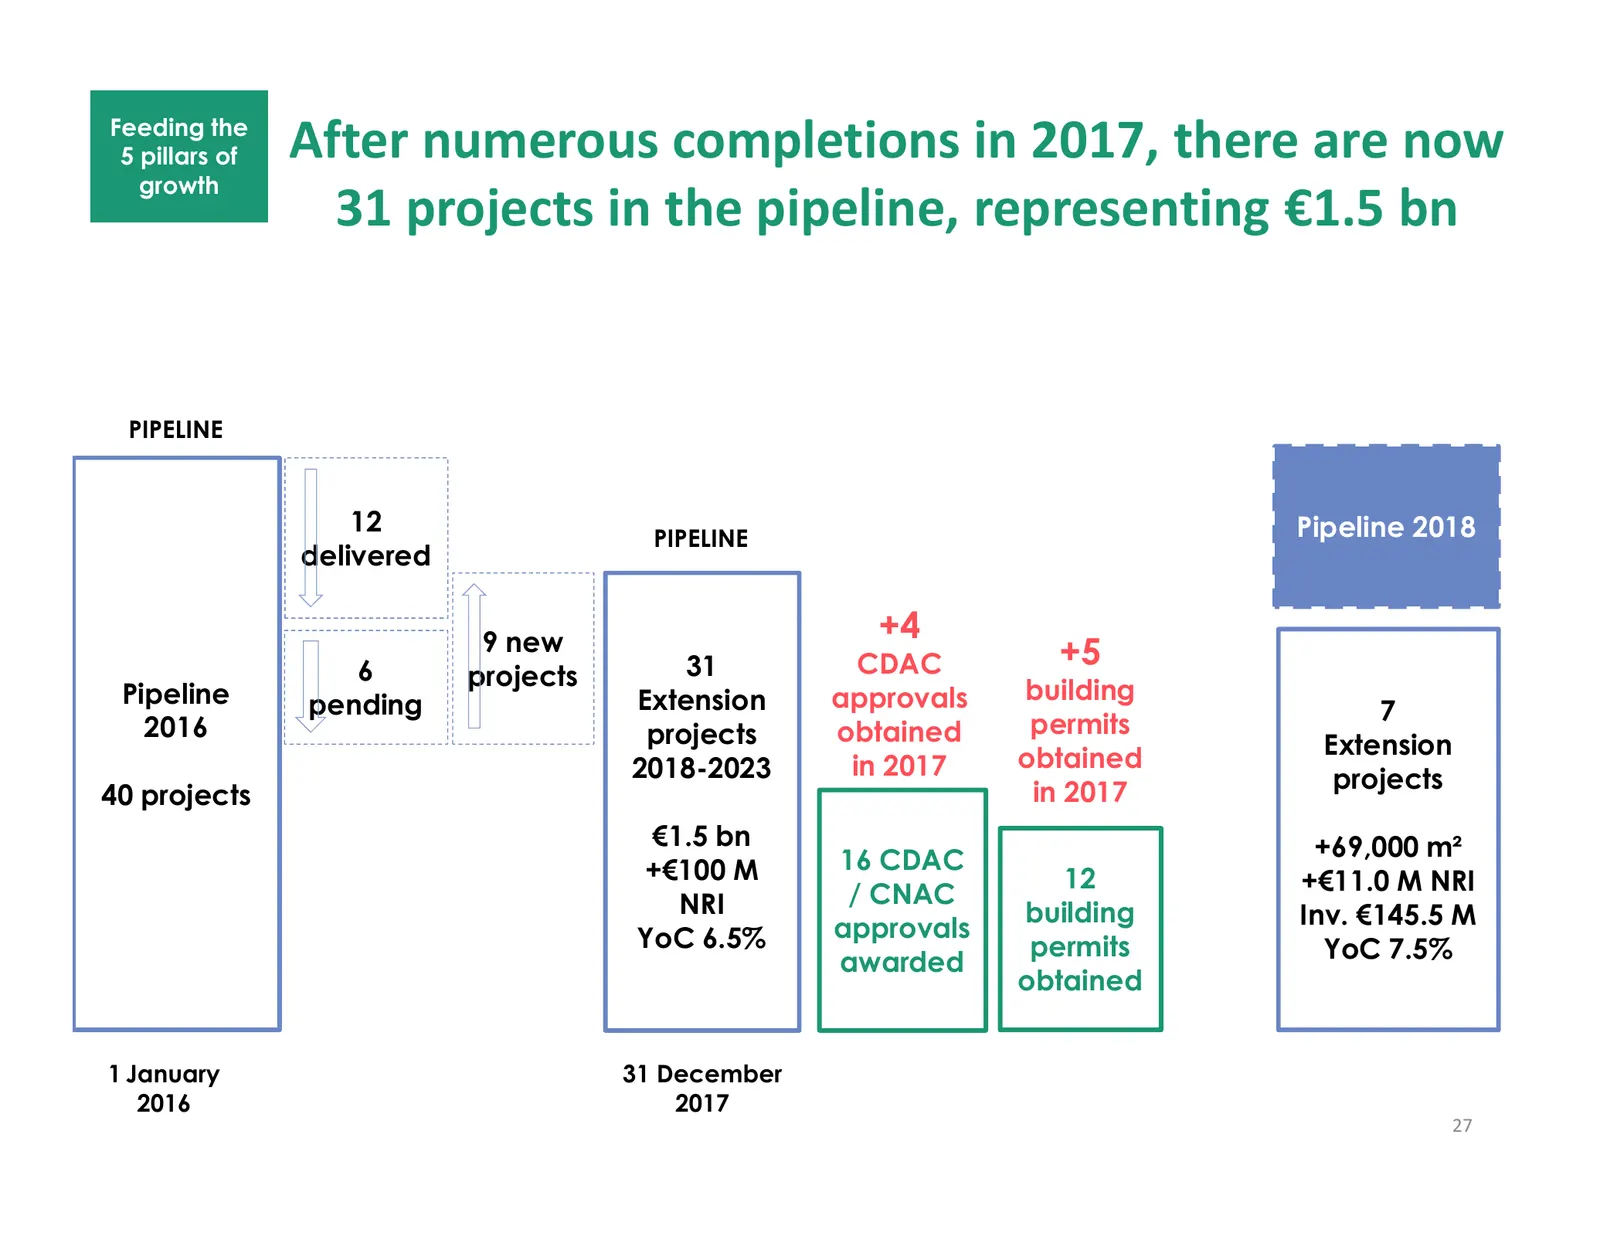
Slide 27: 31 projects in the pipeline, representing €1.5 bn
Feeding the 5 pillars of After numerous completions in 2017, there are now growth 31 projects in the pipeline, representing €1.5 bn PIPELINE 12 Pipeline 2018 PIPELINE delivered 9 new +4 6 31 CDAC +5 projects Pipeline Extension approvals building pending 7 2016 projects obtained permits obtained Exte
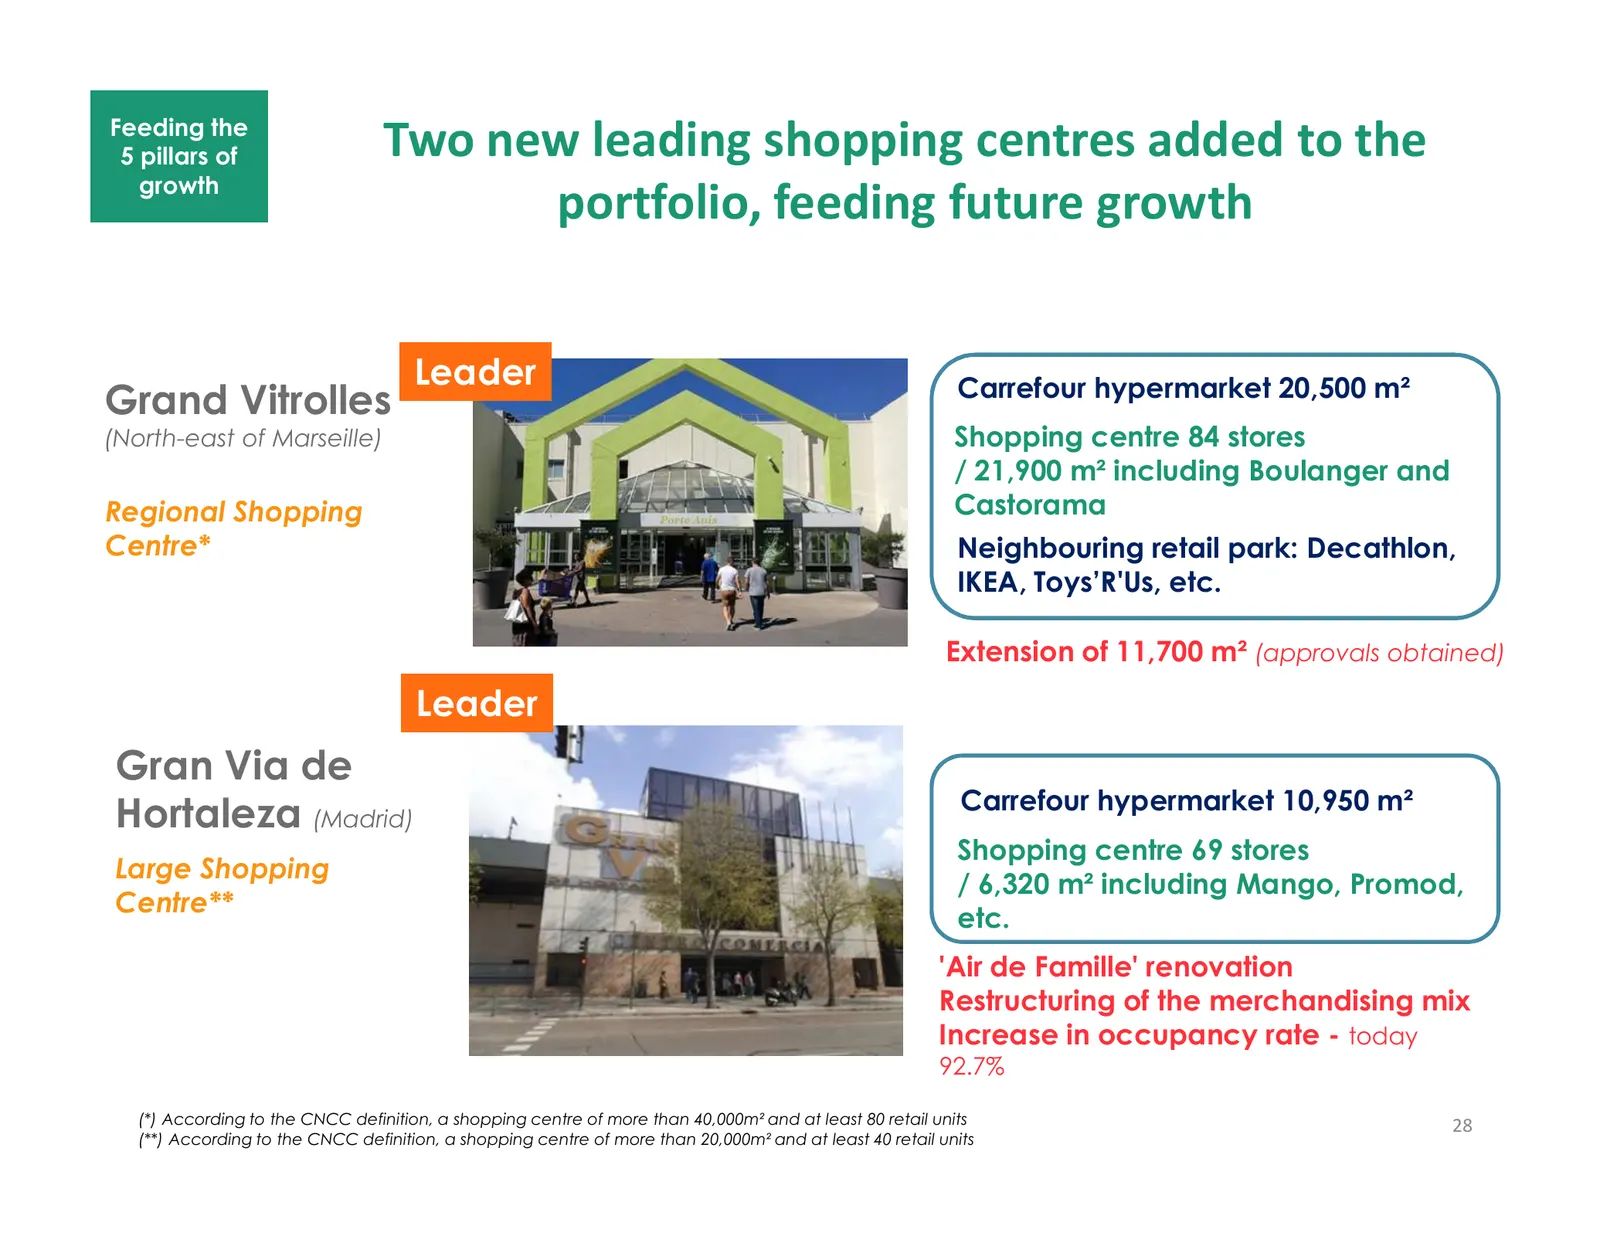
Slide 28: Two new leading shopping centres added to the portfolio
Feeding the 5 pillars of Two new leading shopping centres added to the growth portfolio, feeding future growth Leader Carrefour hypermarket 20,500 m² Grand Vitrolles (North-east of Marseille) Shopping centre 84 stores / 21,900 m² including Boulanger and Regional Shopping Castorama Centre* Neighbouri
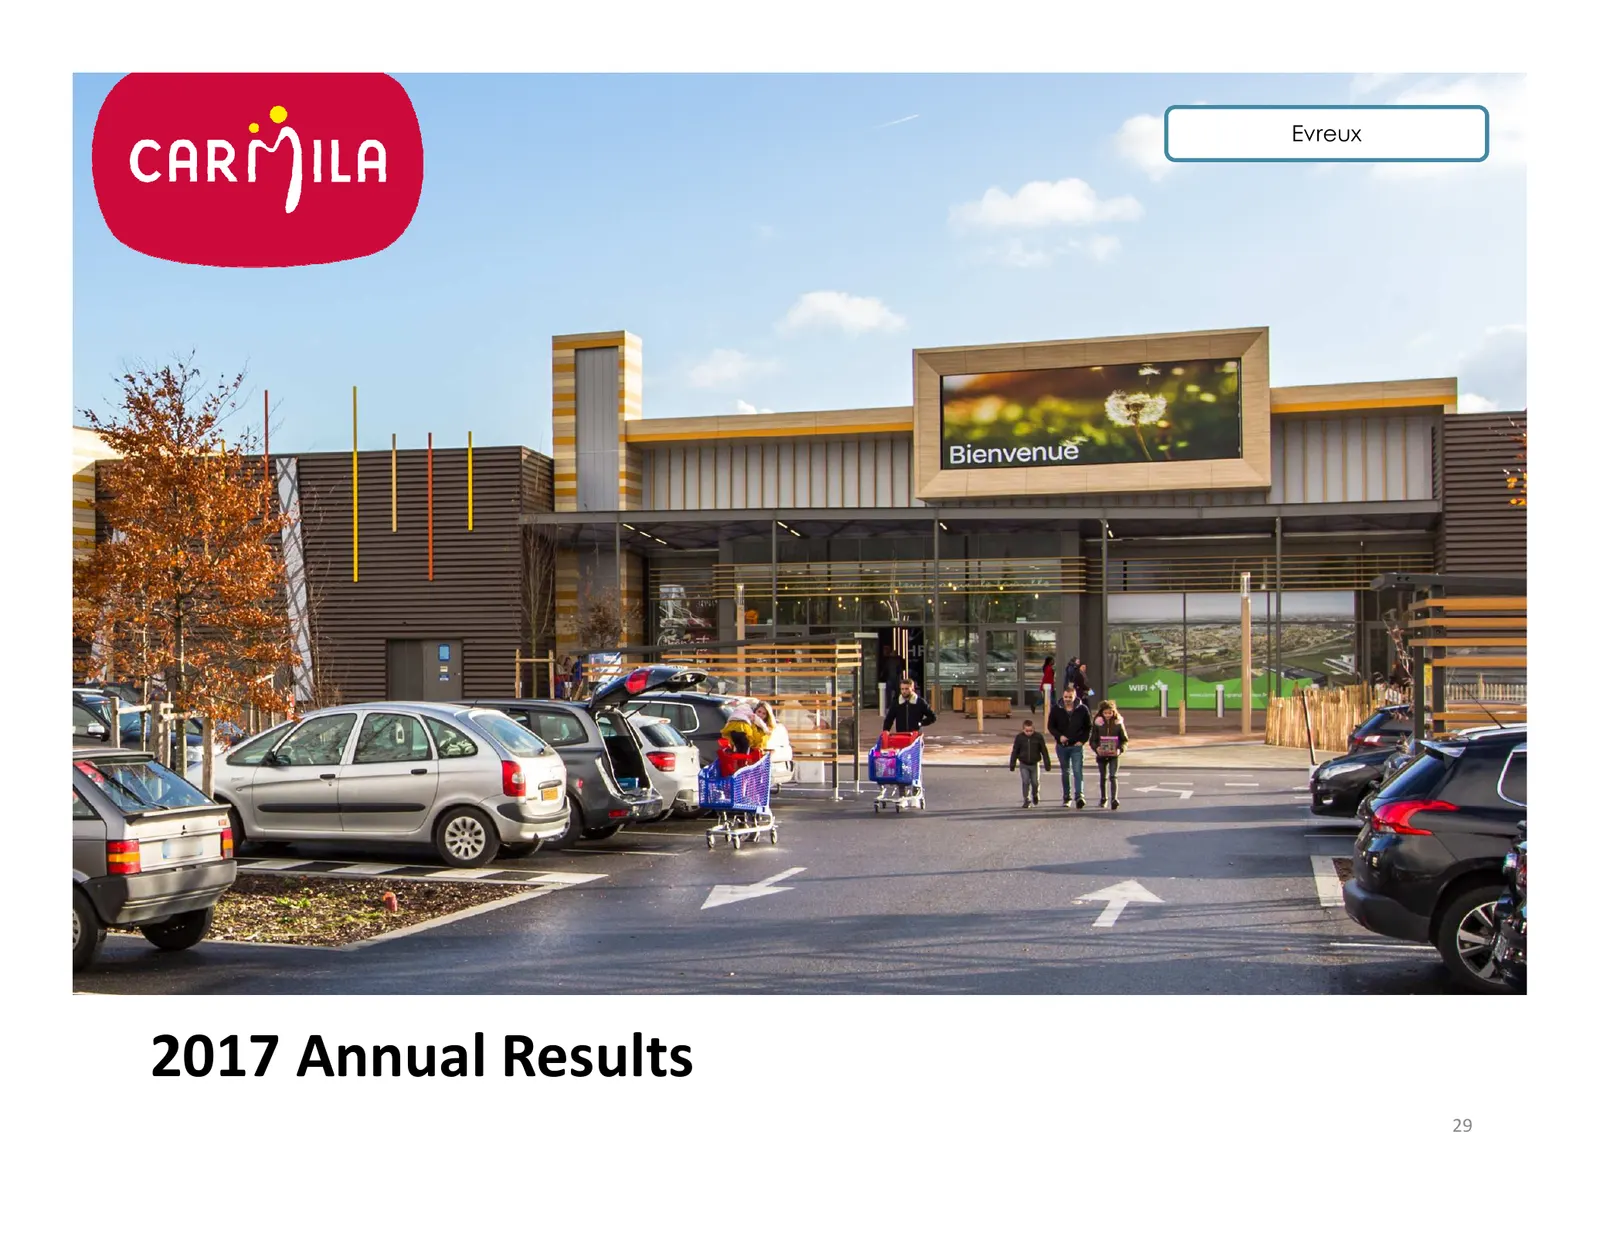
Slide 29: 2017 Annual Results
Evreux 2017 Annual Results 29
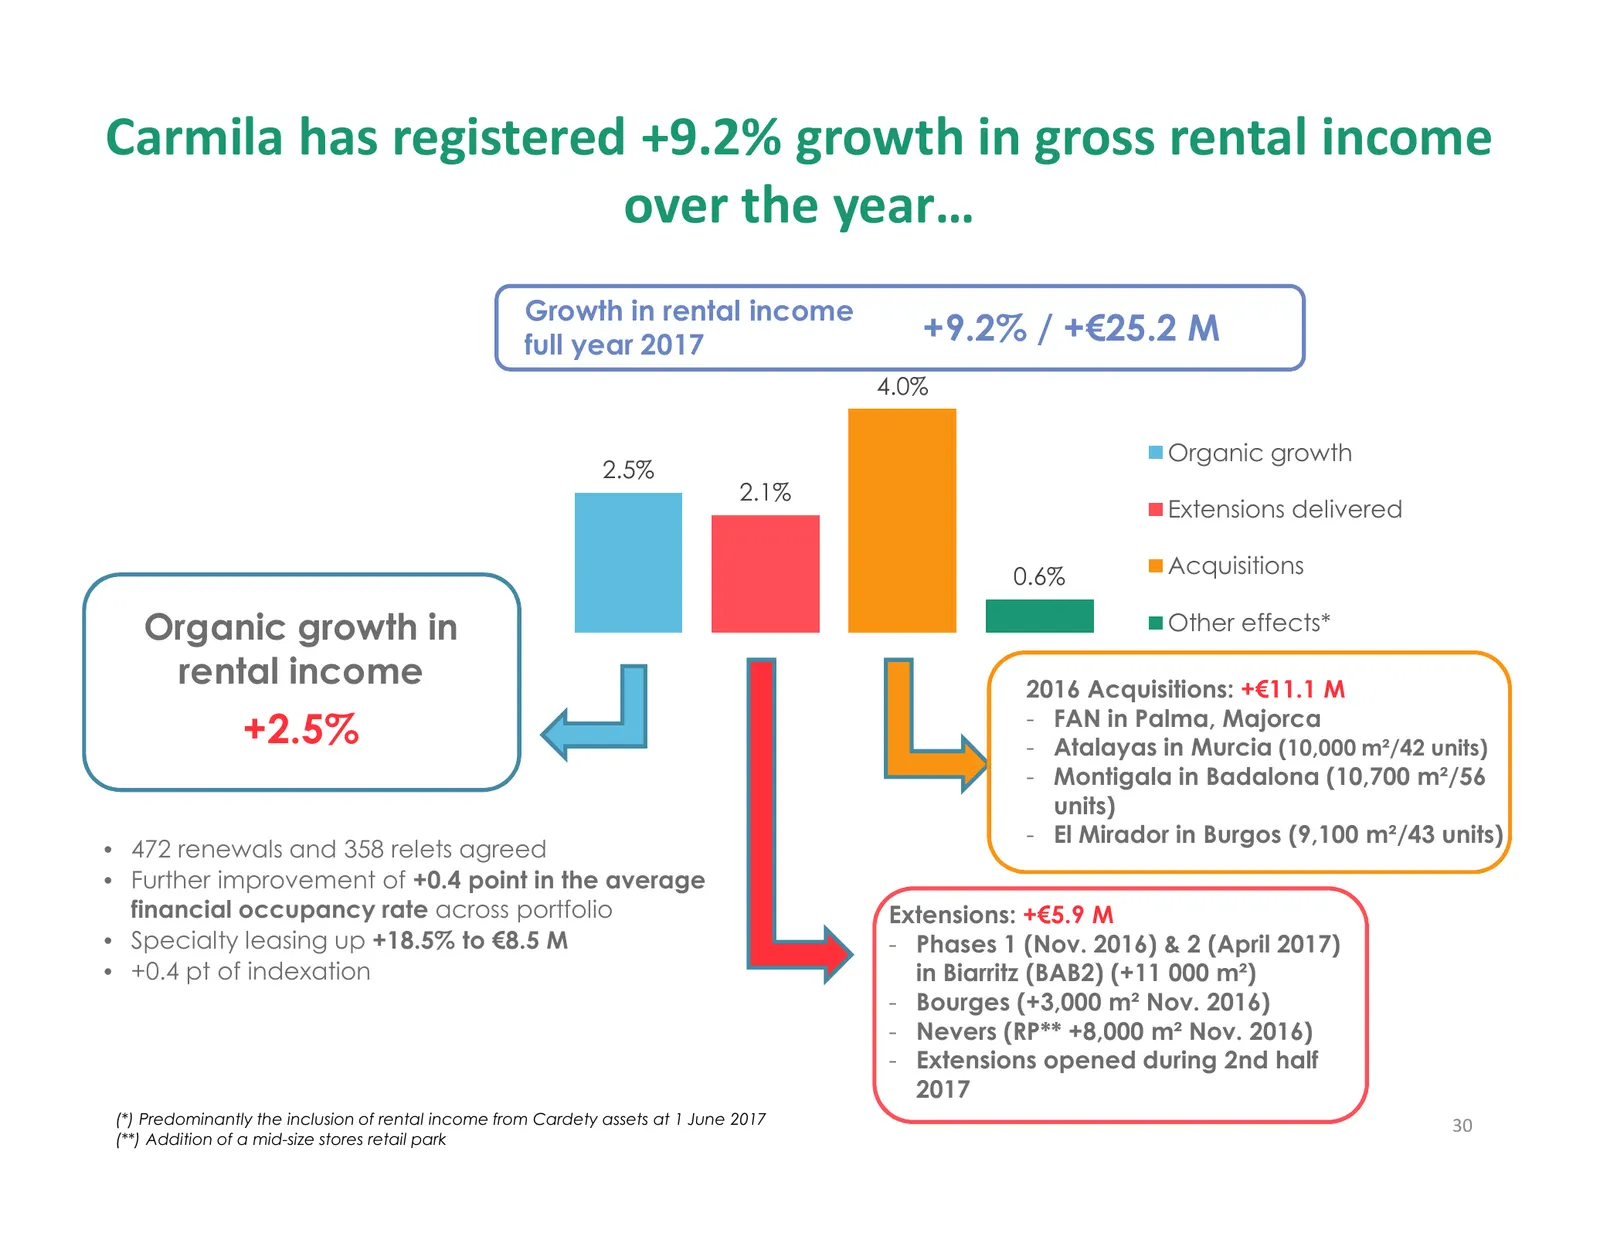
Slide 30: +9.2% growth in gross rental income over the year
Carmila has registered +9.2% growth in gross rental income over the year… Growth in rental income full year 2017 +9.2% / +€25.2 M 4.0% Organic growth 2.5% 2.1% Extensions delivered 0.6% Acquisitions Organic growth in Other effects* rental income 2016 Acquisitions: +€11.1 M - FAN in Palma, Majorca +2
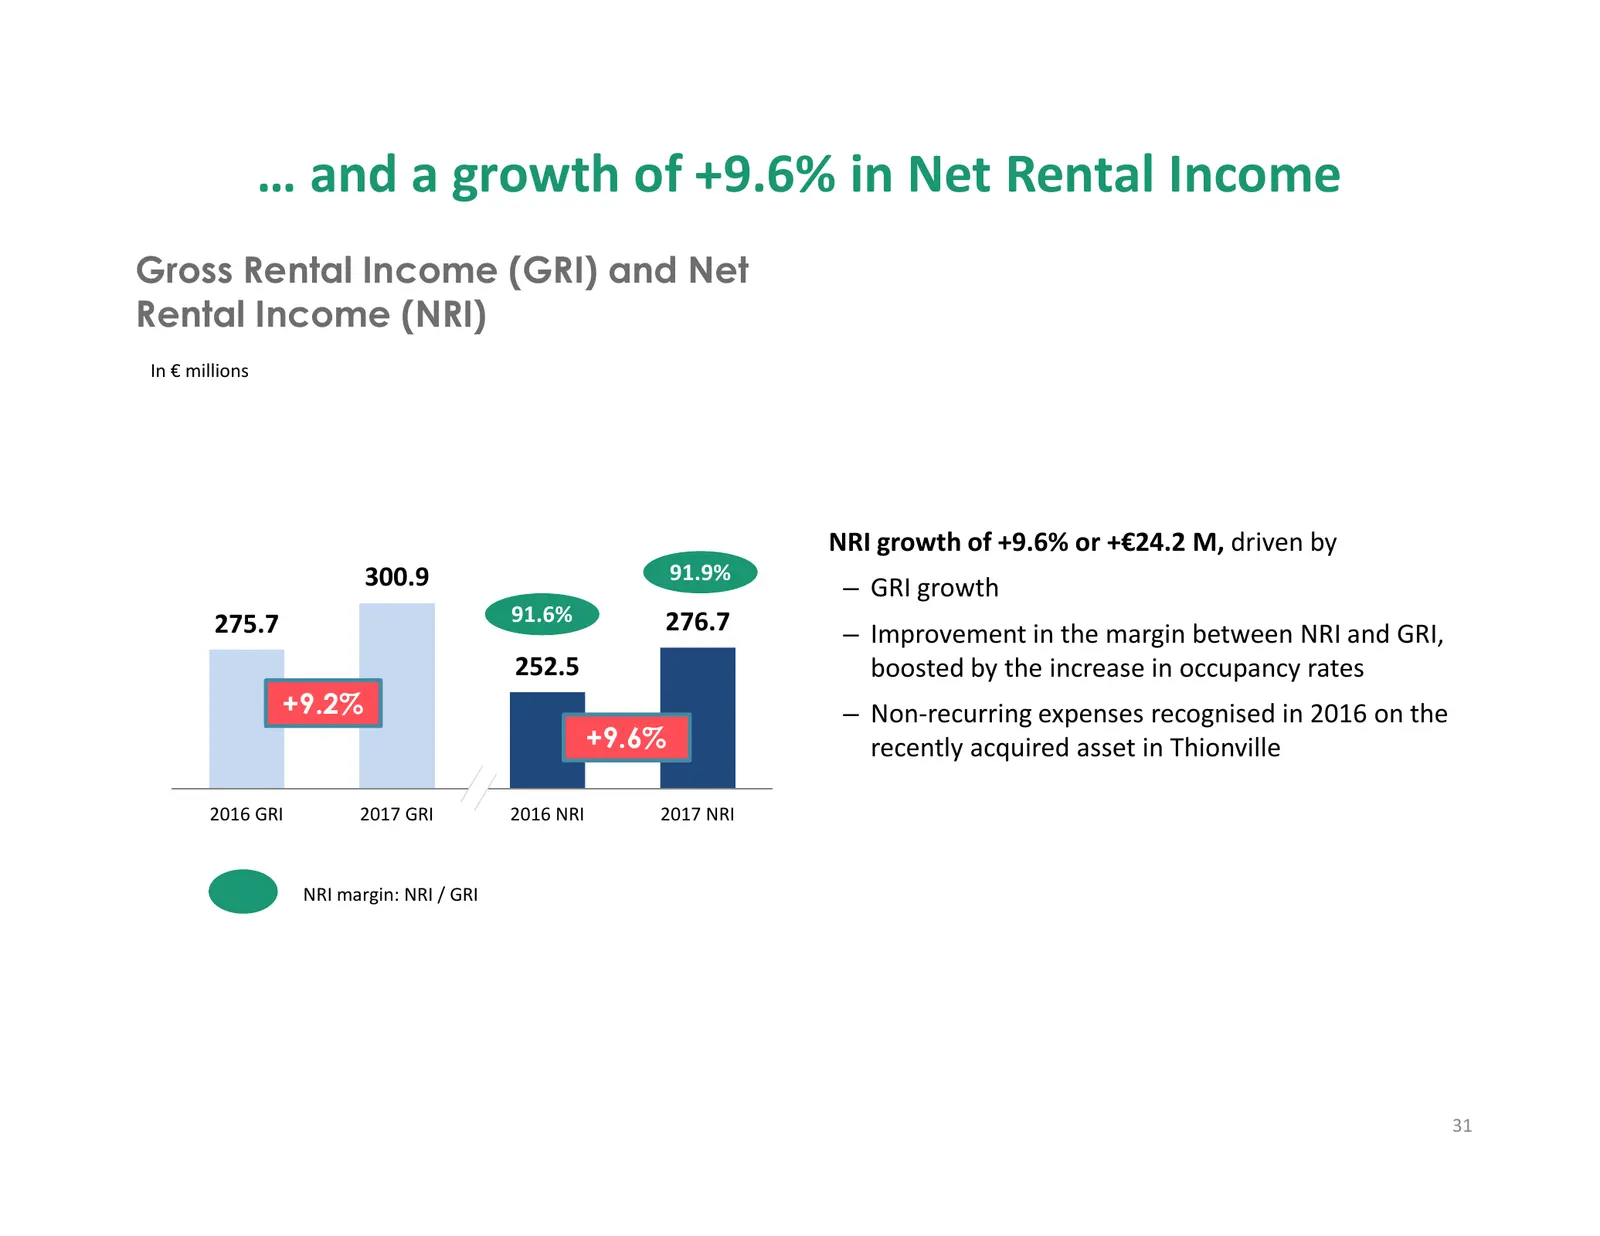
Slide 31: Growth of +9.6% in Net Rental Income
… and a growth of +9.6% in Net Rental Income Gross Rental Income (GRI) and Net Rental Income (NRI) In € millions NRI growth of +9.6% or +€24.2 M, driven by 300.9 91.9% – GRI growth 275.7 91.6% 276.7 – Improvement in the margin between NRI and GRI, 252.5 boosted by the increase in occupancy rates +9.
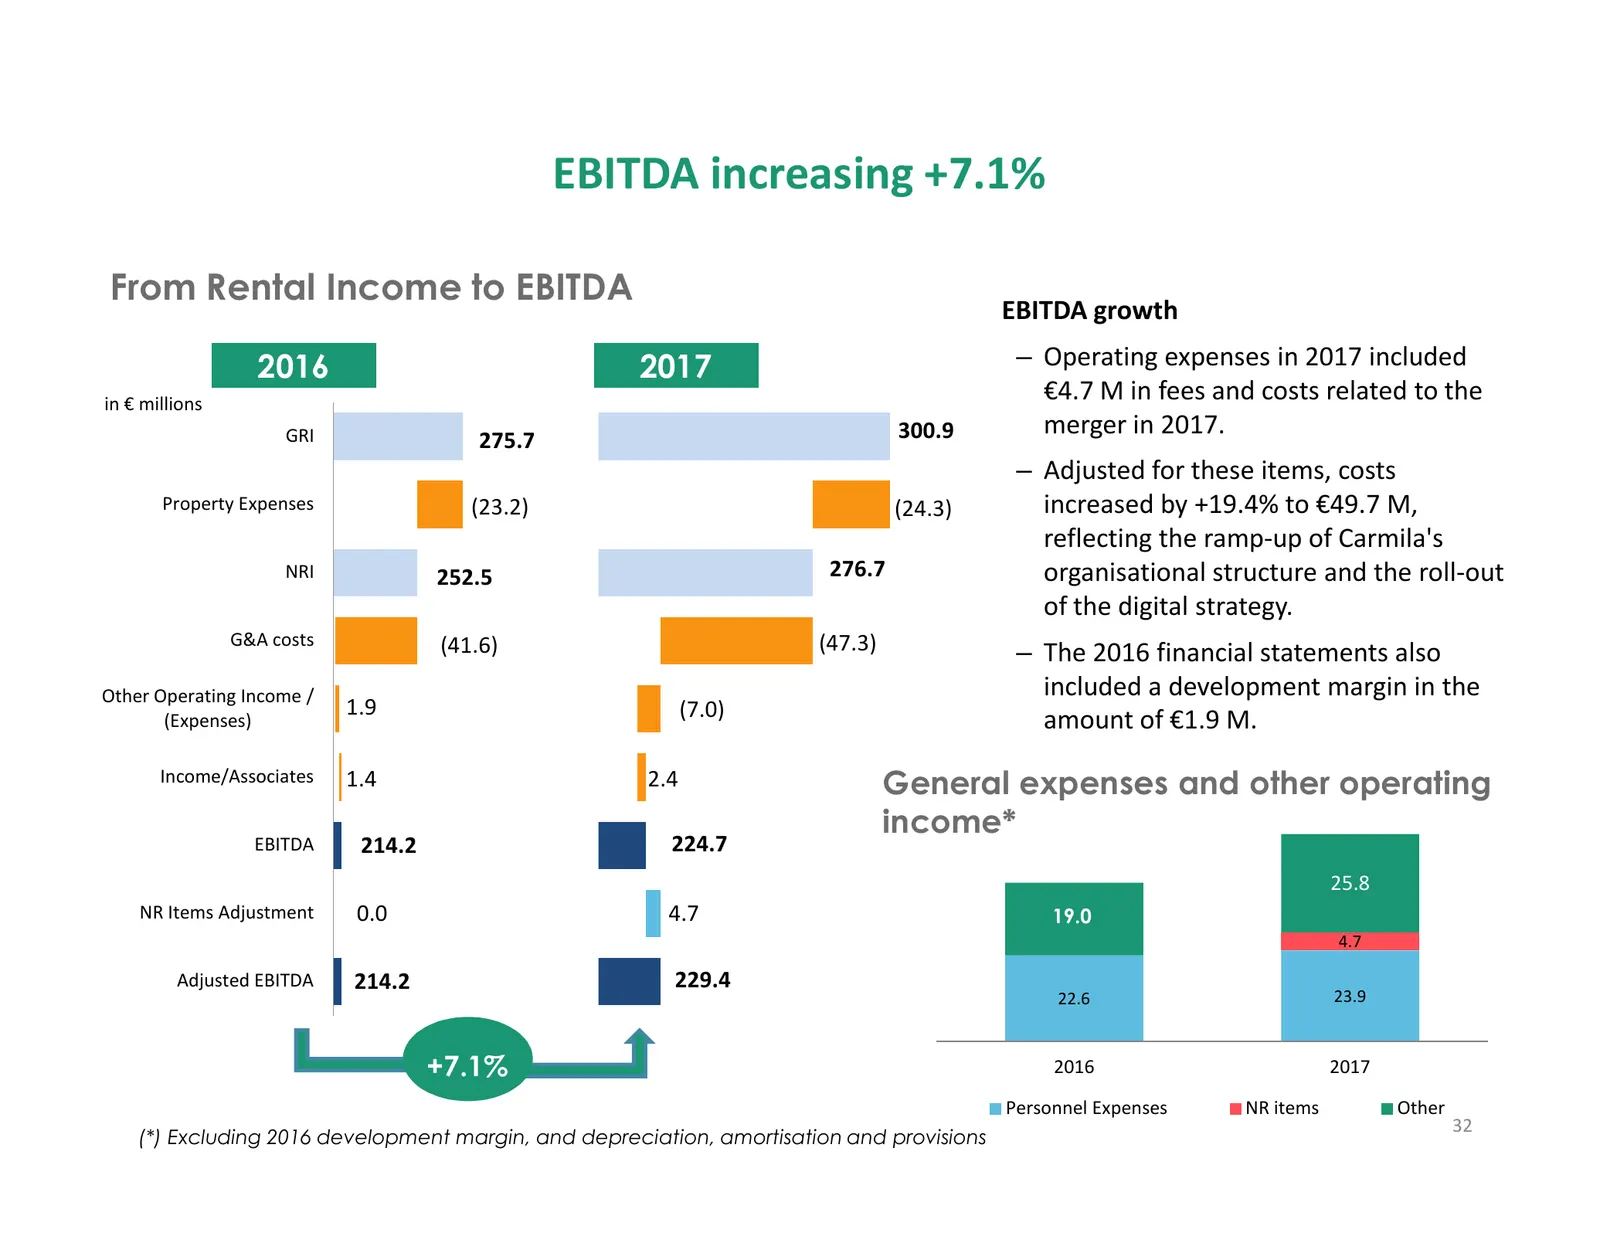
Slide 32: EBITDA increasing +7.1%
EBITDA increasing +7.1% From Rental Income to EBITDA EBITDA growth 2016 2017 – Operating expenses in 2017 included in € millions €4.7 M in fees and costs related to the GRI 300.9 merger in 2017. 275.7 – Adjusted for these items, costs Property Expenses (23.2) (24.3) increased by +19.4% to €49.7 M, r
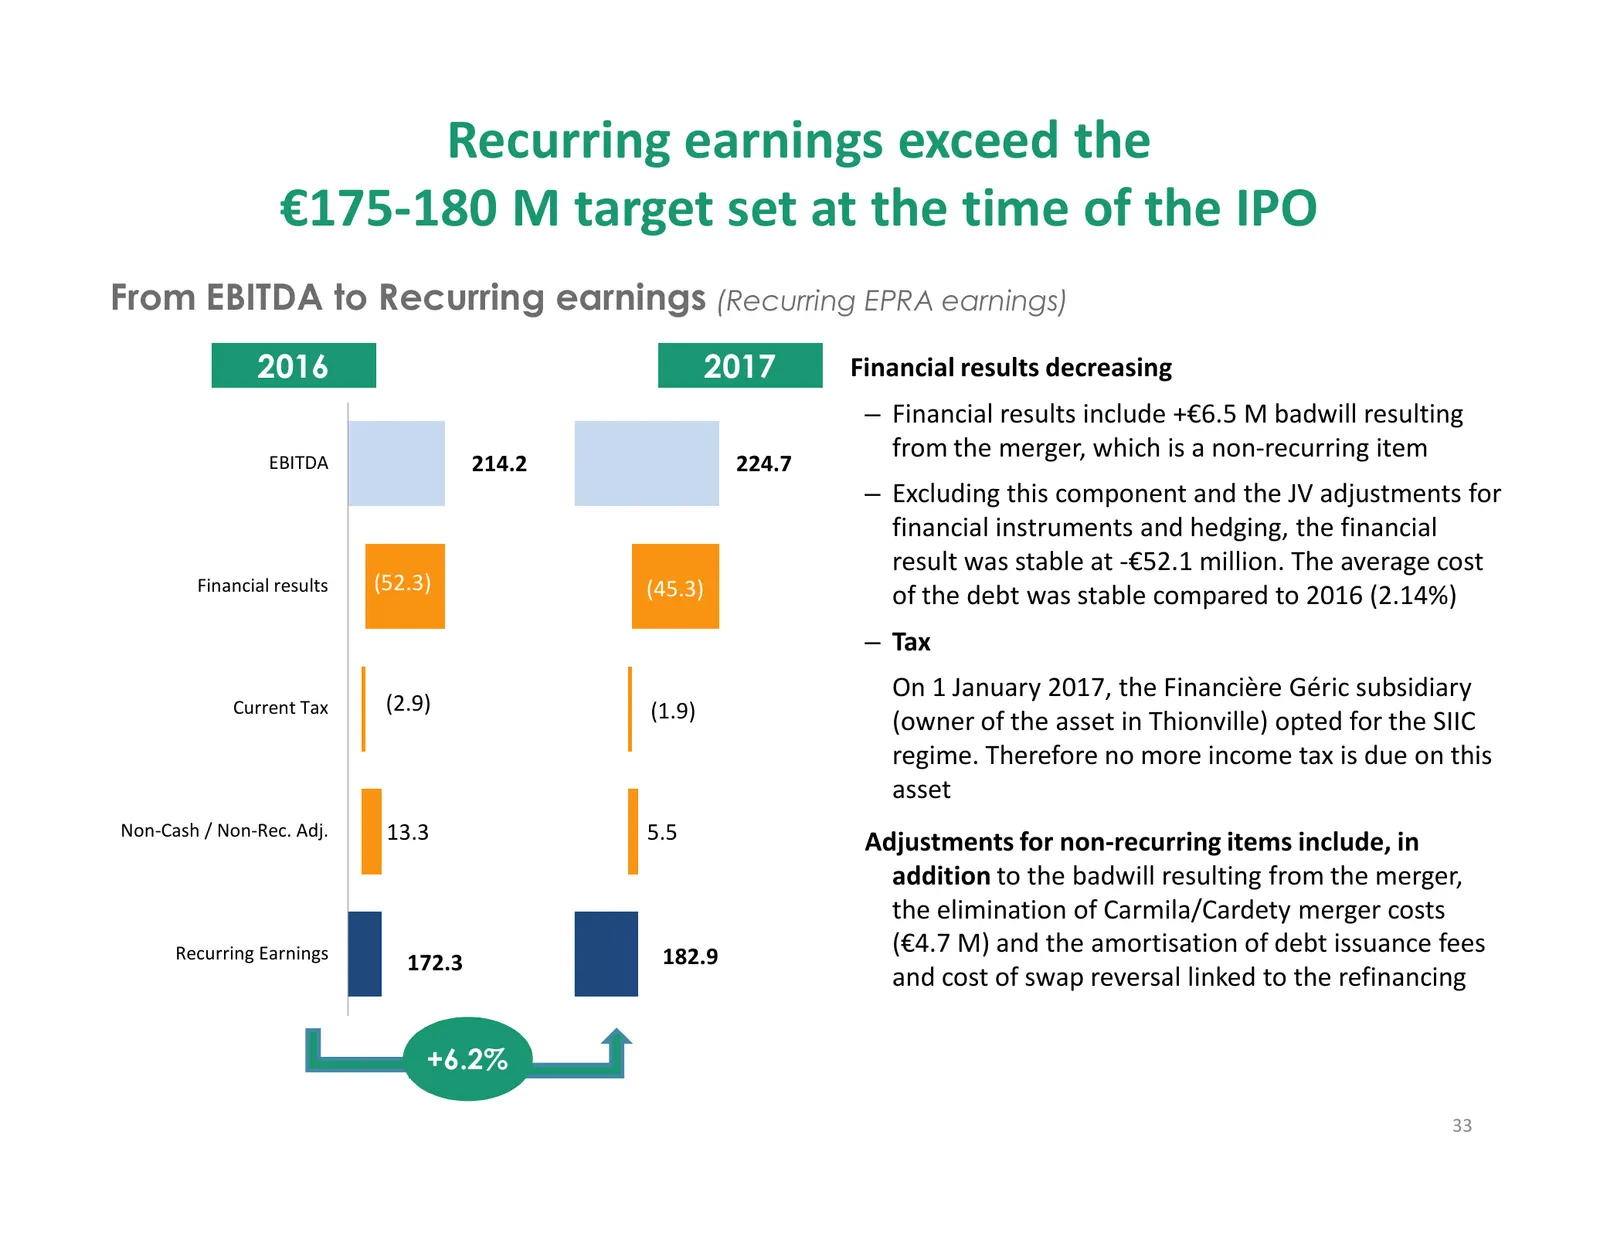
Slide 33: Recurring earnings exceed the €175-180 M target set at the IPO
Recurring earnings exceed the €175-180 M target set at the time of the IPO From EBITDA to Recurring earnings (Recurring EPRA earnings) 2016 2017 Financial results decreasing – Financial results include +€6.5 M badwill resulting from the merger, which is a non-recurring item EBITDA 214.2 224.7 – Excl
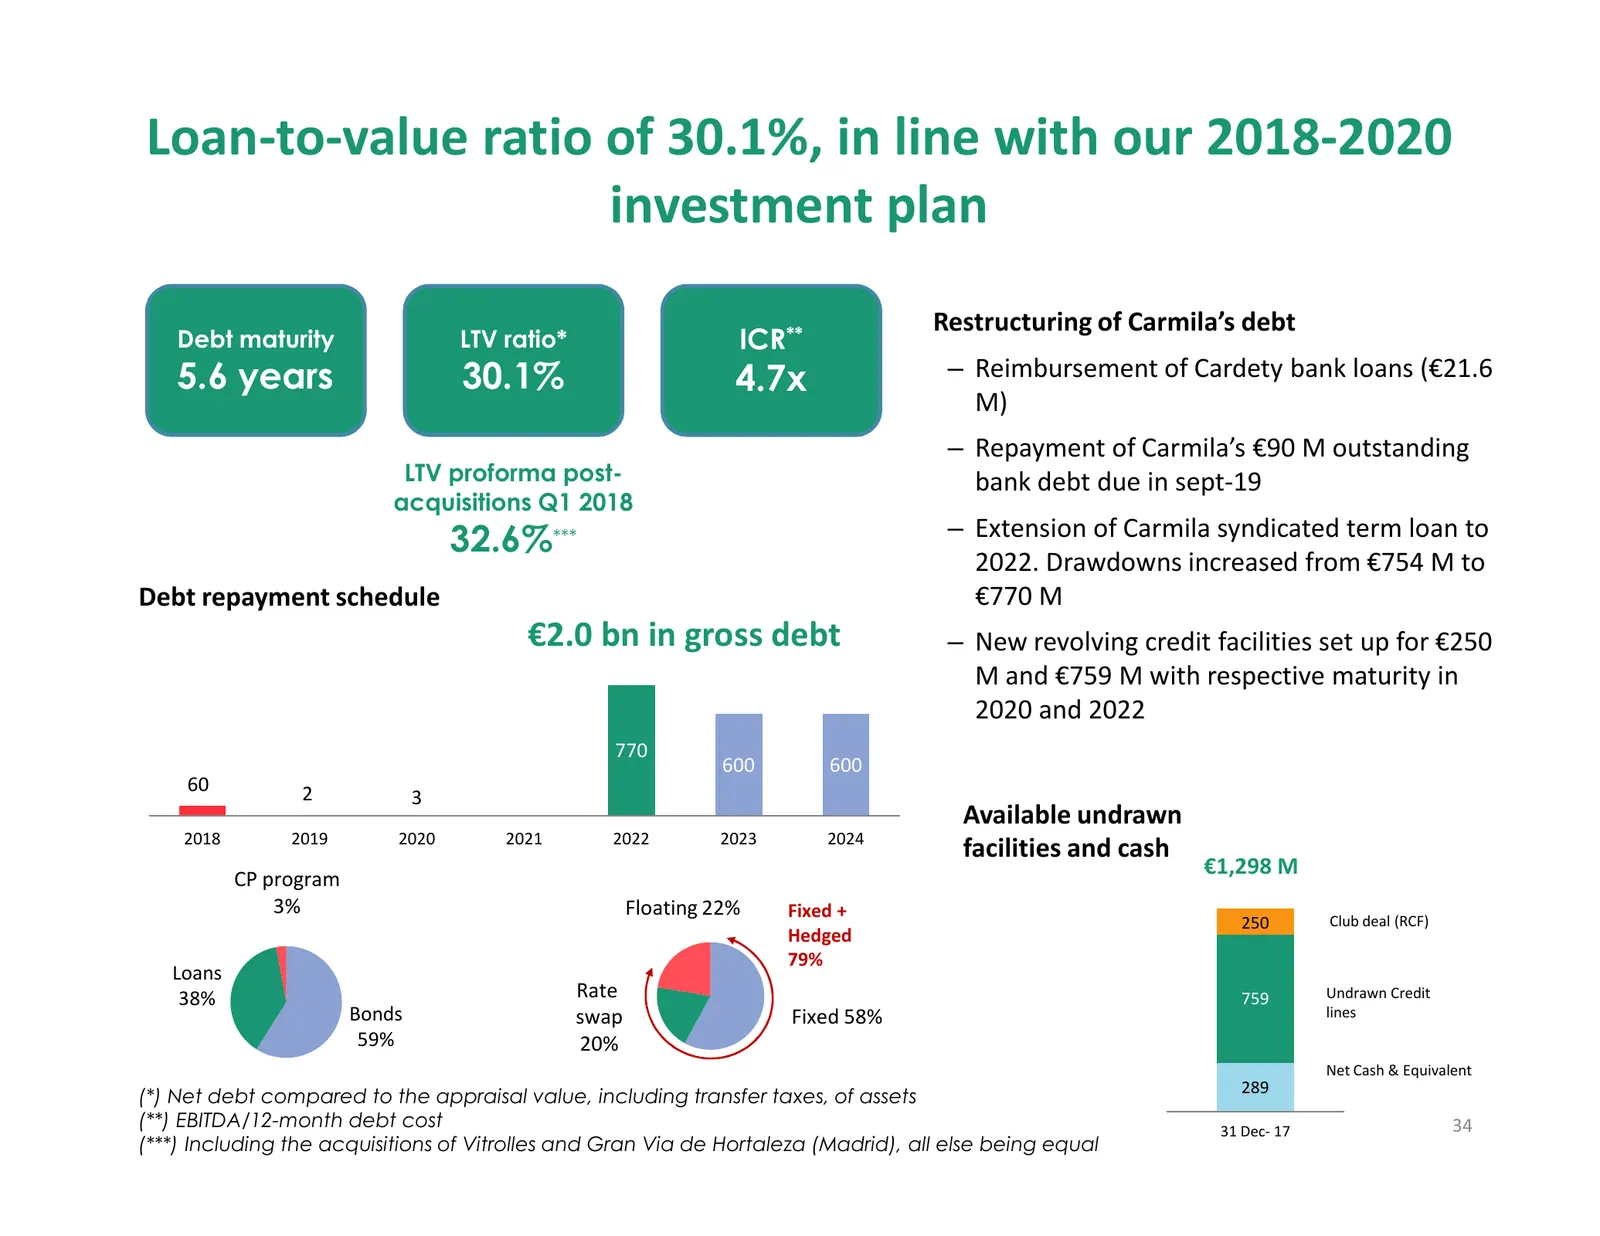
Slide 34: Loan-to-value ratio of 30.1%, in line with 2018-2020 investment plan
Loan-to-value ratio of 30.1%, in line with our 2018-2020 investment plan Restructuring of Carmila’s debt Debt maturity LTV ratio* ICR** 5.6 years 30.1% 4.7x – Reimbursement of Cardety bank loans (€21.6 M) – Repayment of Carmila’s €90 M outstanding LTV proforma post- bank debt due in sept-19 acquisit
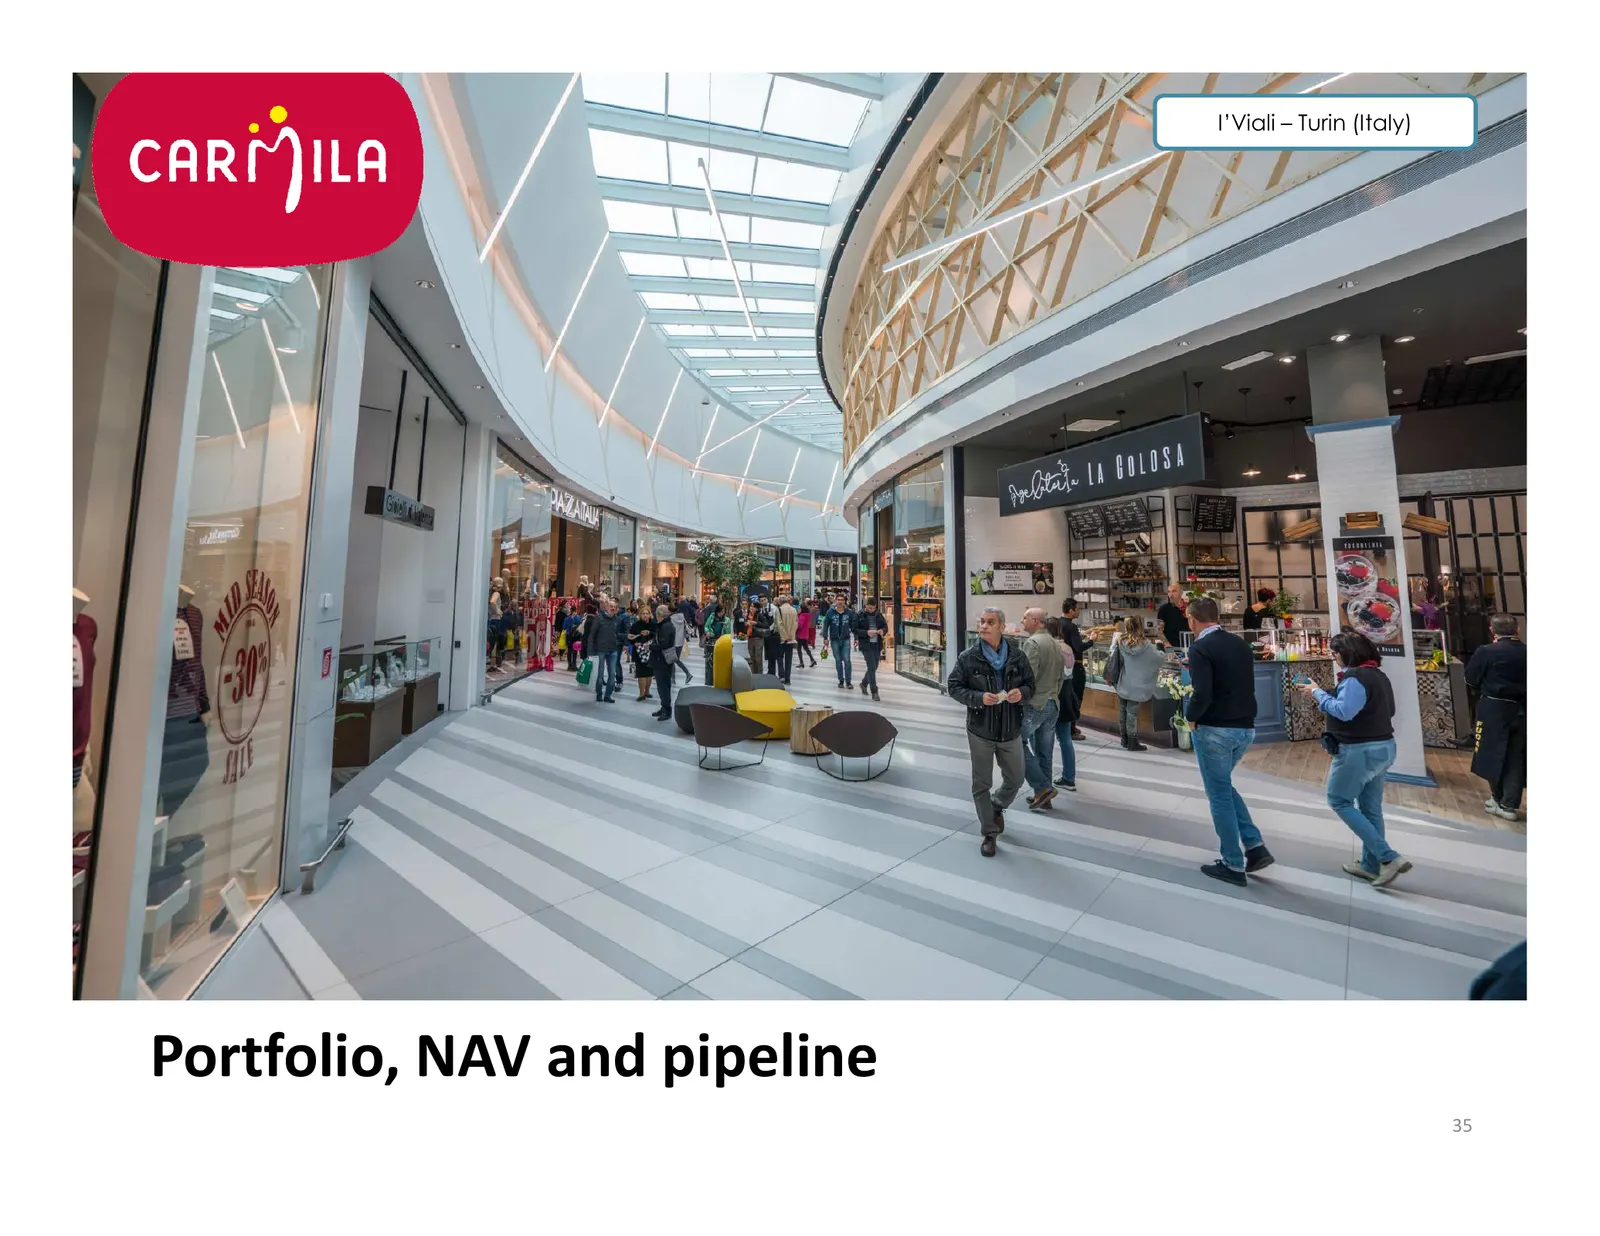
Slide 35: Portfolio, NAV and pipeline
I’Viali – Turin (Italy) Portfolio, NAV and pipeline 35
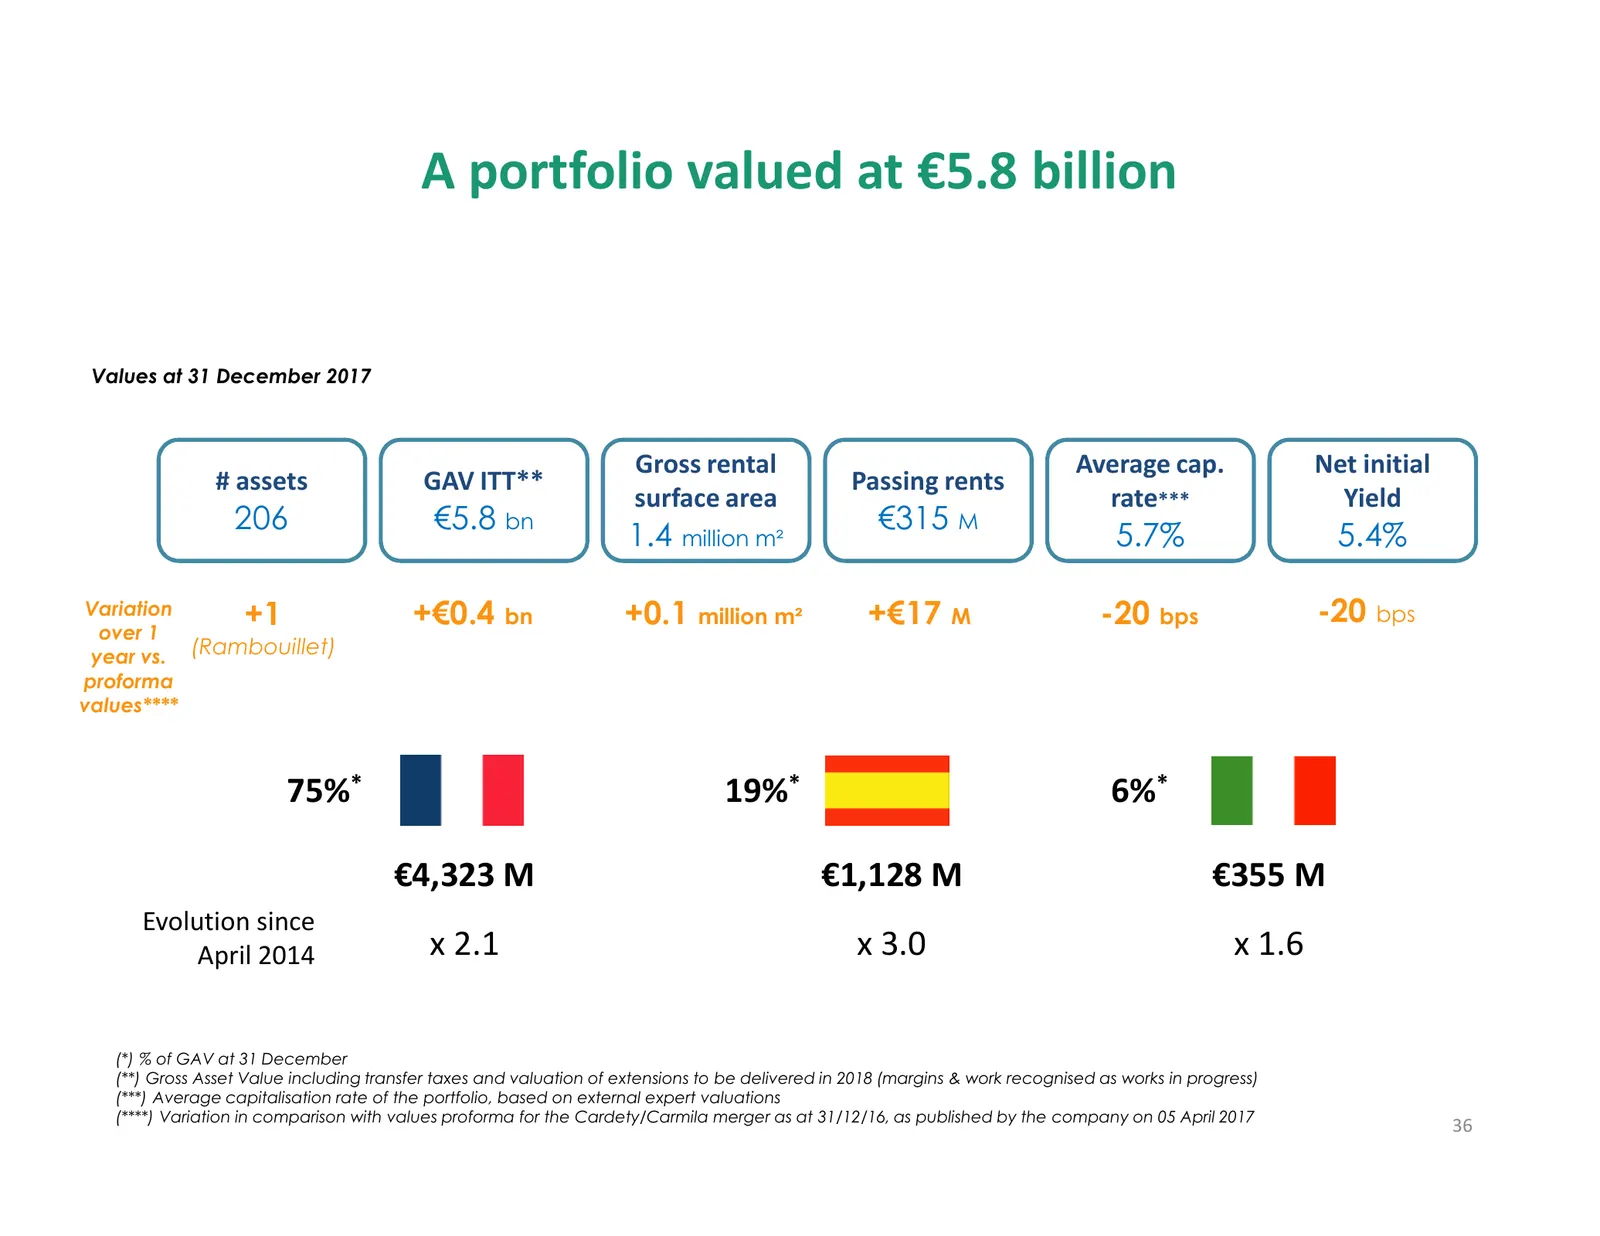
Slide 36: A portfolio valued at €5.8 billion
A portfolio valued at €5.8 billion Values at 31 December 2017 Gross rental Average cap. Net initial # assets GAV ITT** Passing rents surface area rate*** Yield 206 €5.8 bn €315 M 1.4 million m² 5.7% 5.4% Variation +1 +€0.4 bn +0.1 million m² +€17 M -20 bps -20 bps over 1 year vs. (Rambouillet) profo
Slide 37: Portfolio value up +€485 M since 31 December 2016
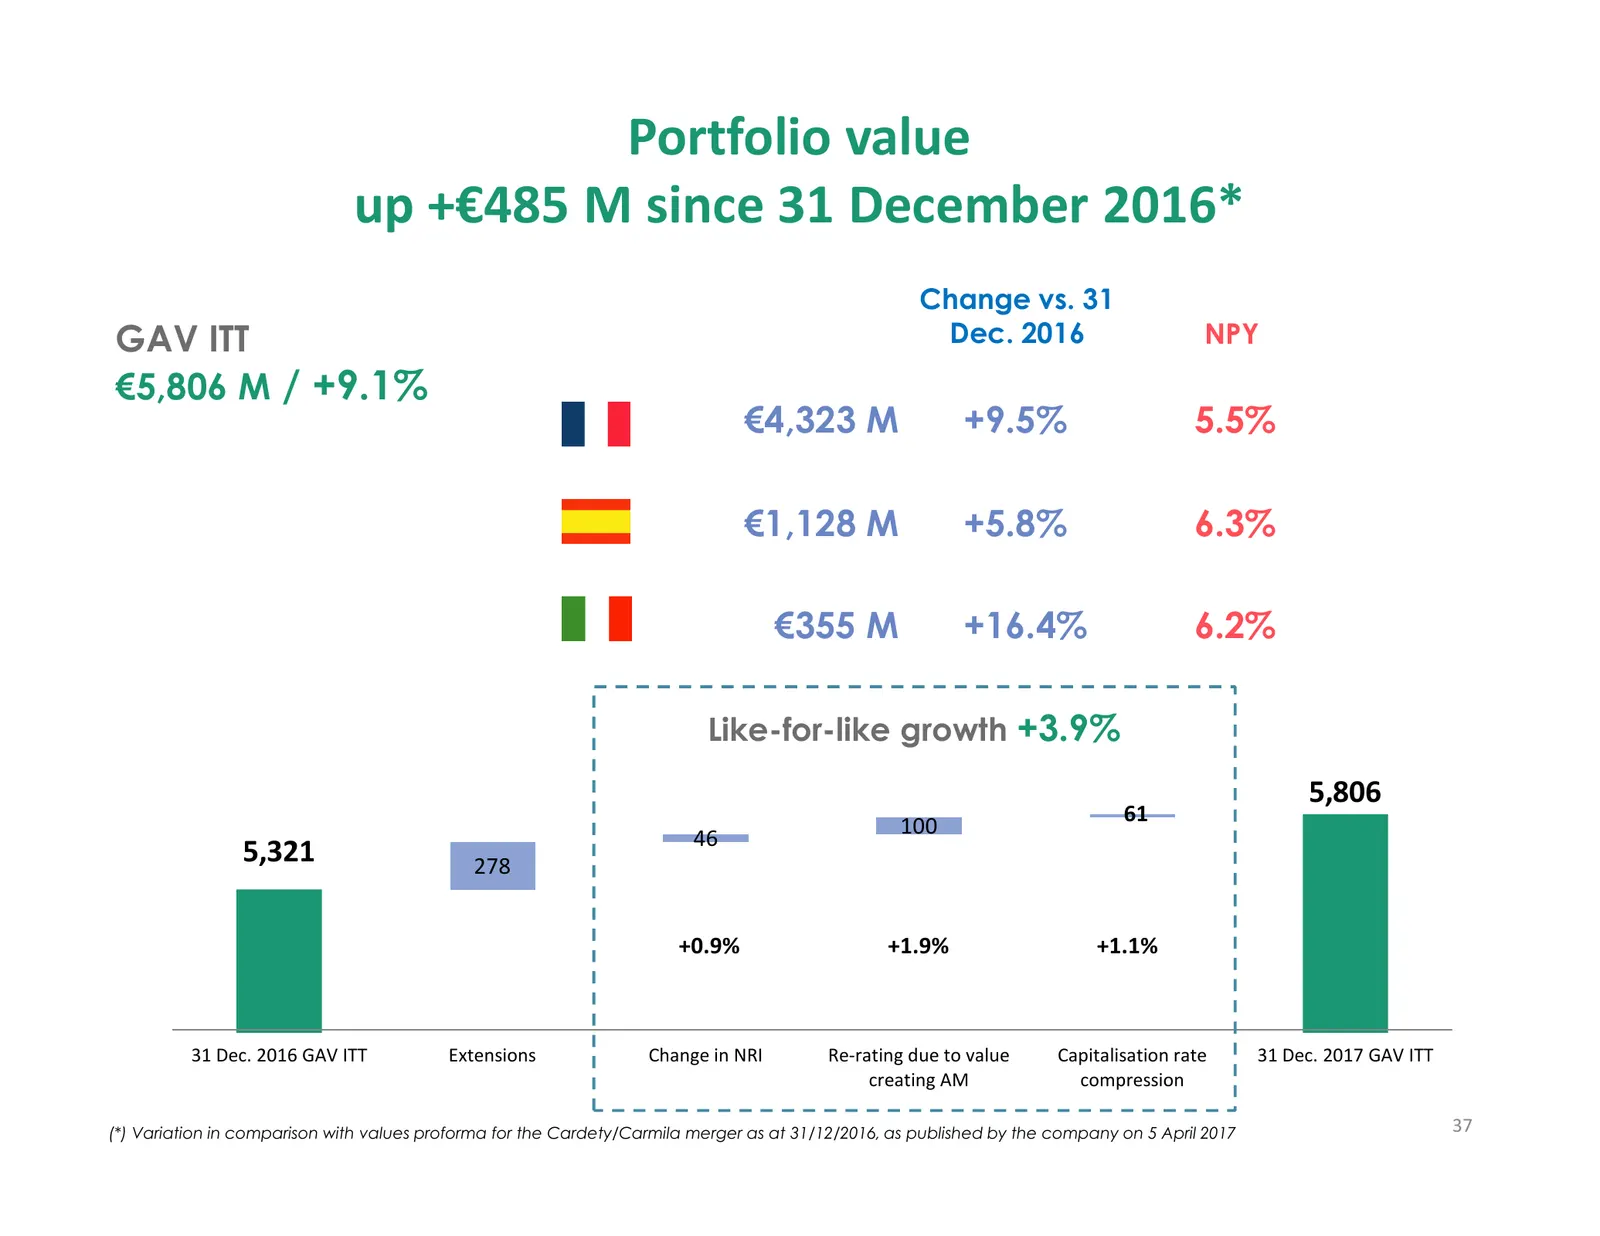
Portfolio value up +€485 M since 31 December 2016* Change vs. 31 GAV ITT Dec. 2016 NPY €5,806 M / +9.1% €4,323 M +9.5% 5.5% €1,128 M +5.8% 6.3% €355 M +16.4% 6.2% Like-for-like growth +3.9% 5,806 100 61 46 5,321 278 +0.9% +1.9% +1.1% 31 Dec. 2016 GAV ITT Extensions Change in NRI Re-rating due to val
Slide 38: Net asset value per share has continued to rise since the capital increase
Net asset value per share has continued to rise since the capital increase, offsetting dilution and payment of the interim dividend EPRA NAV per share (fully diluted) (after 2016 dividend paid) Chart showing change over 12 months In € millions in euros/share 28,28 28,23 +173 +27 -101 3,714 27,34 27,
Slide 39: Our various NAV per share showed growth
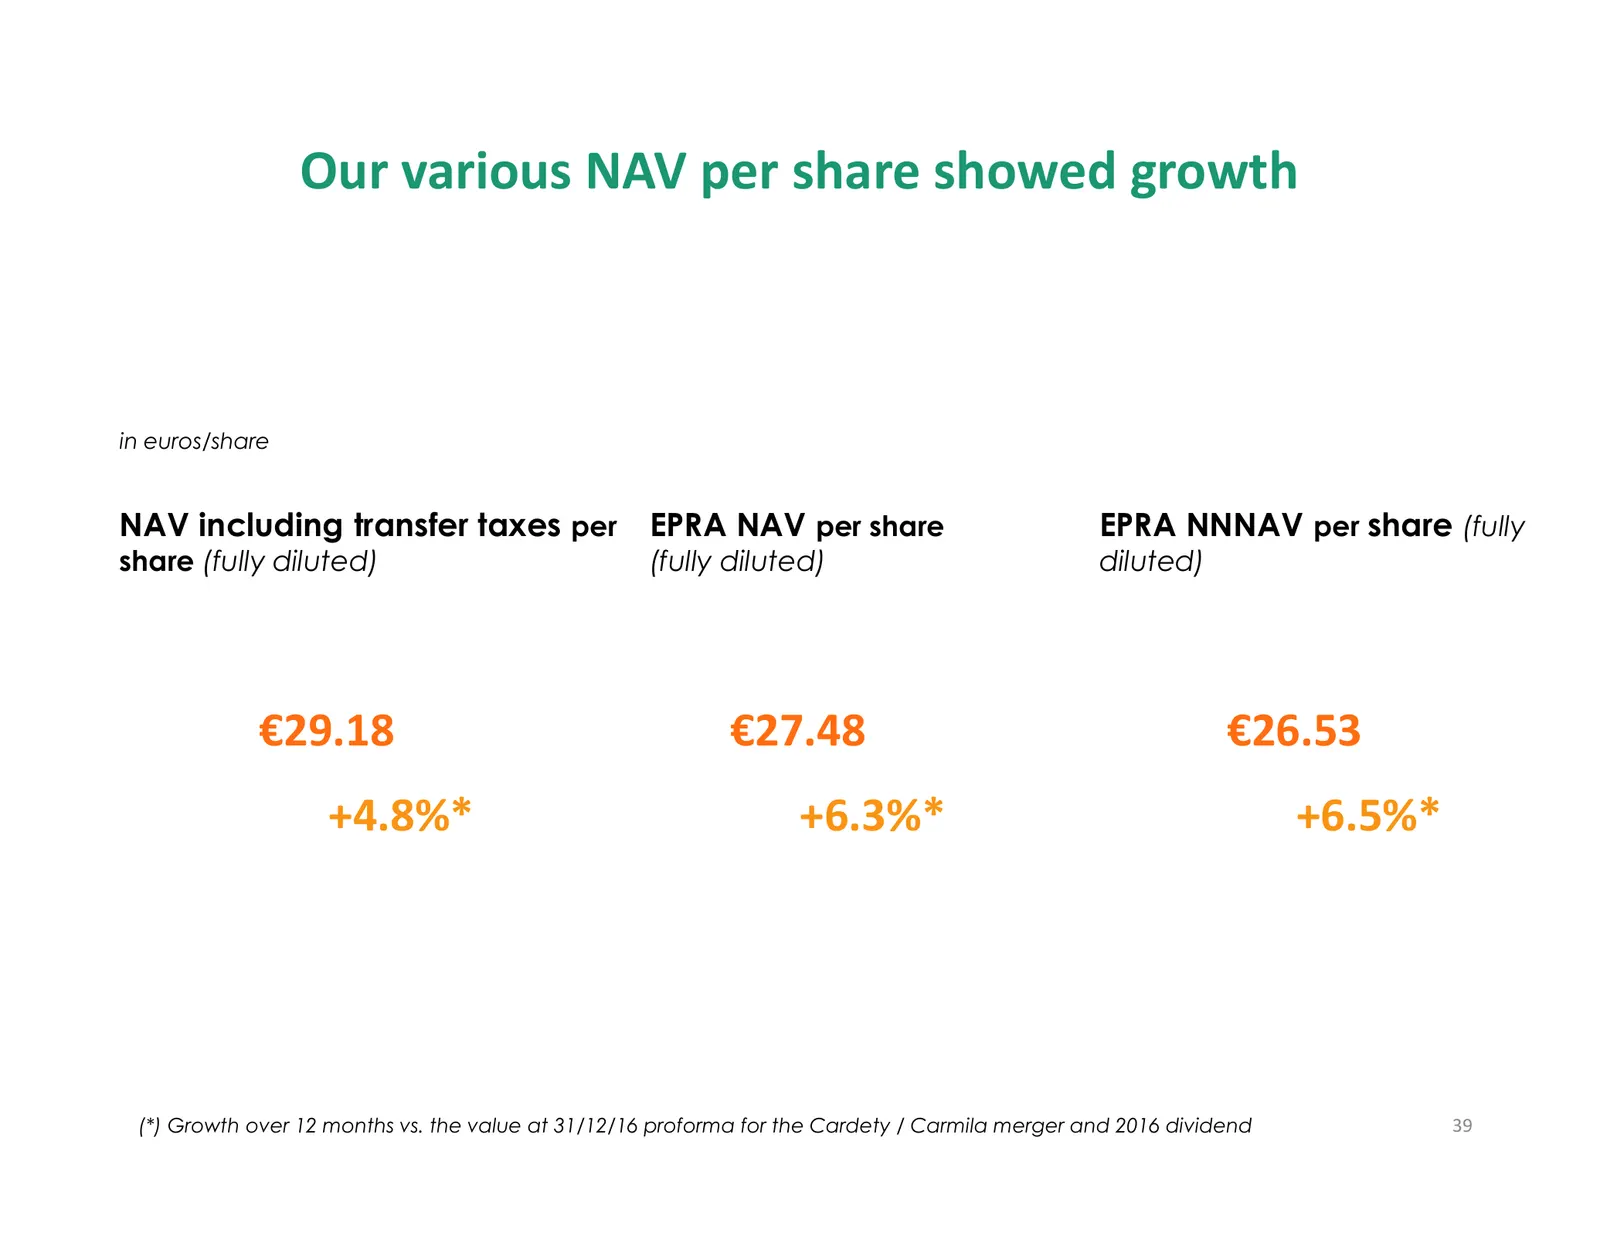
Our various NAV per share showed growth in euros/share NAV including transfer taxes per EPRA NAV per share EPRA NNNAV per share (fully share (fully diluted) (fully diluted) diluted) €29.18 €27.48 €26.53 +4.8%* +6.3%* +6.5%* (*) Growth over 12 months vs. the value at 31/12/16 proforma for the Cardety
Slide 40: Outlook for 2018
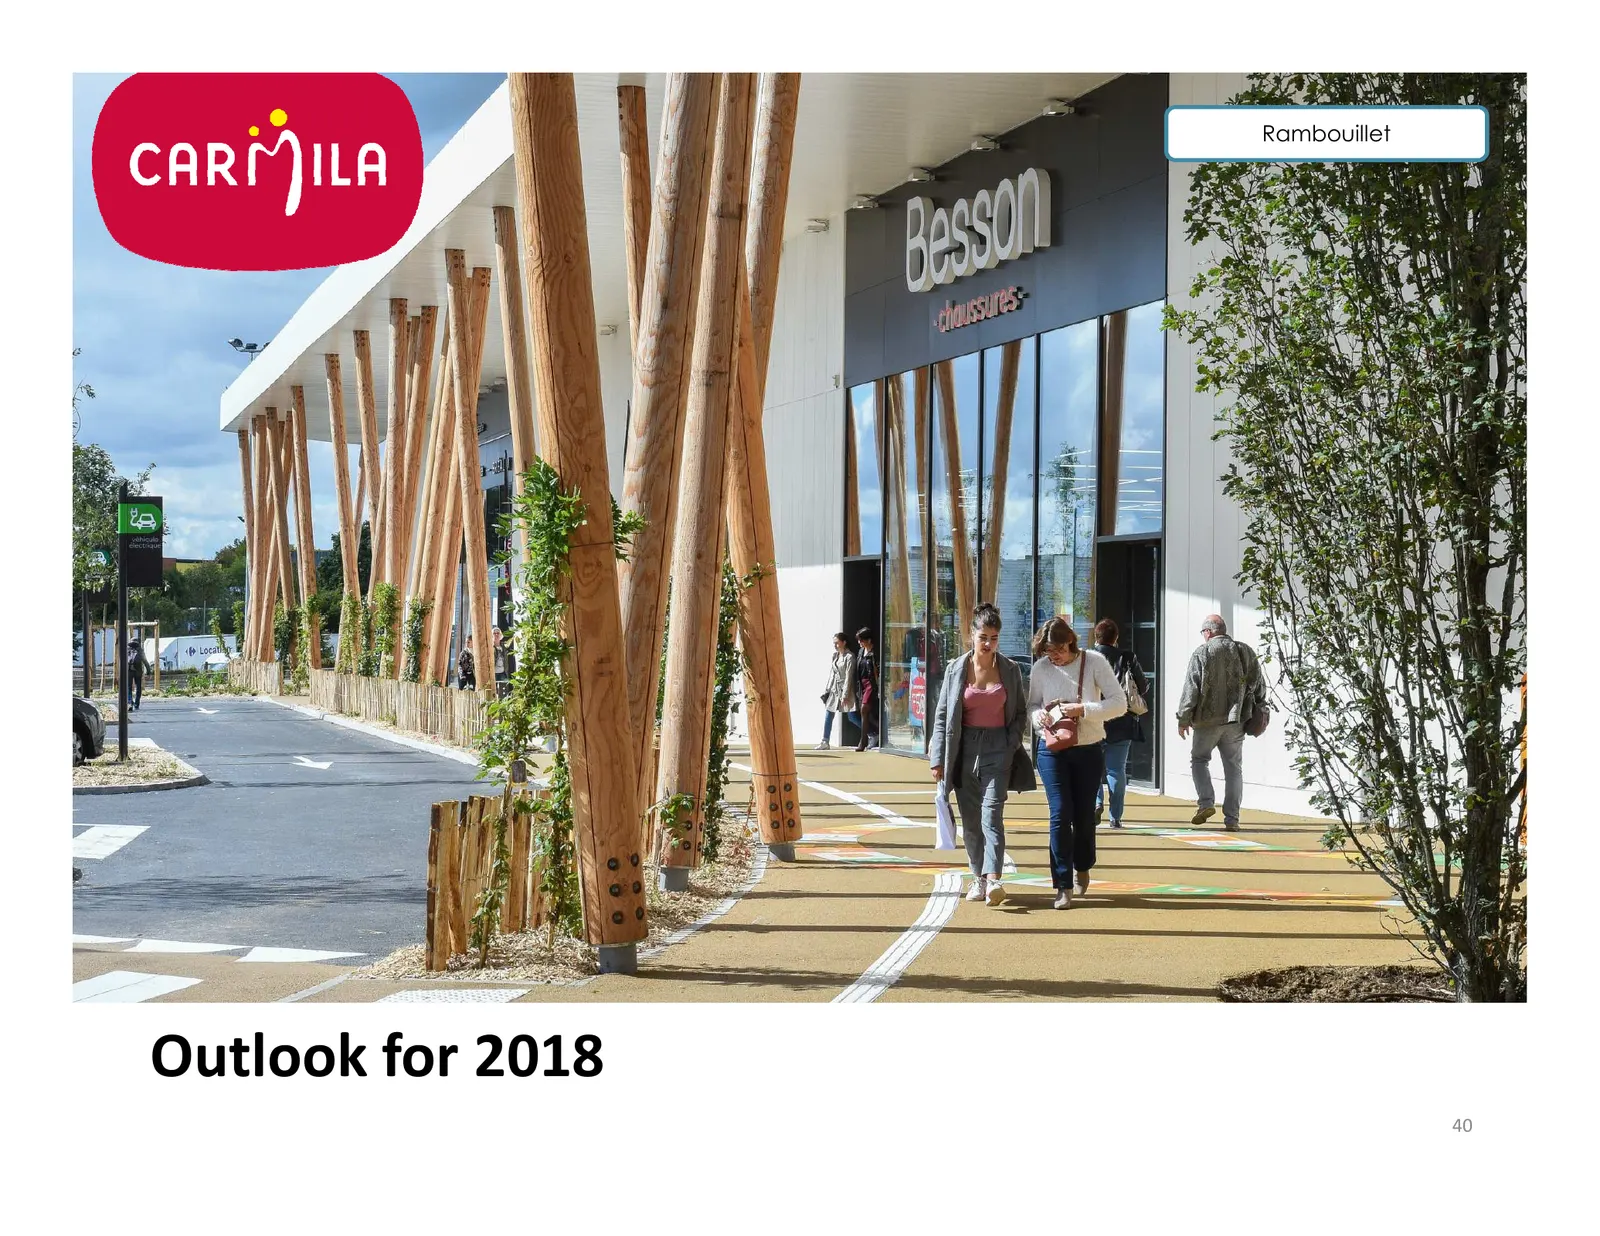
Rambouillet Outlook for 2018 40
Slide 41: The strategy presented by Carrefour offers opportunities for Carmila
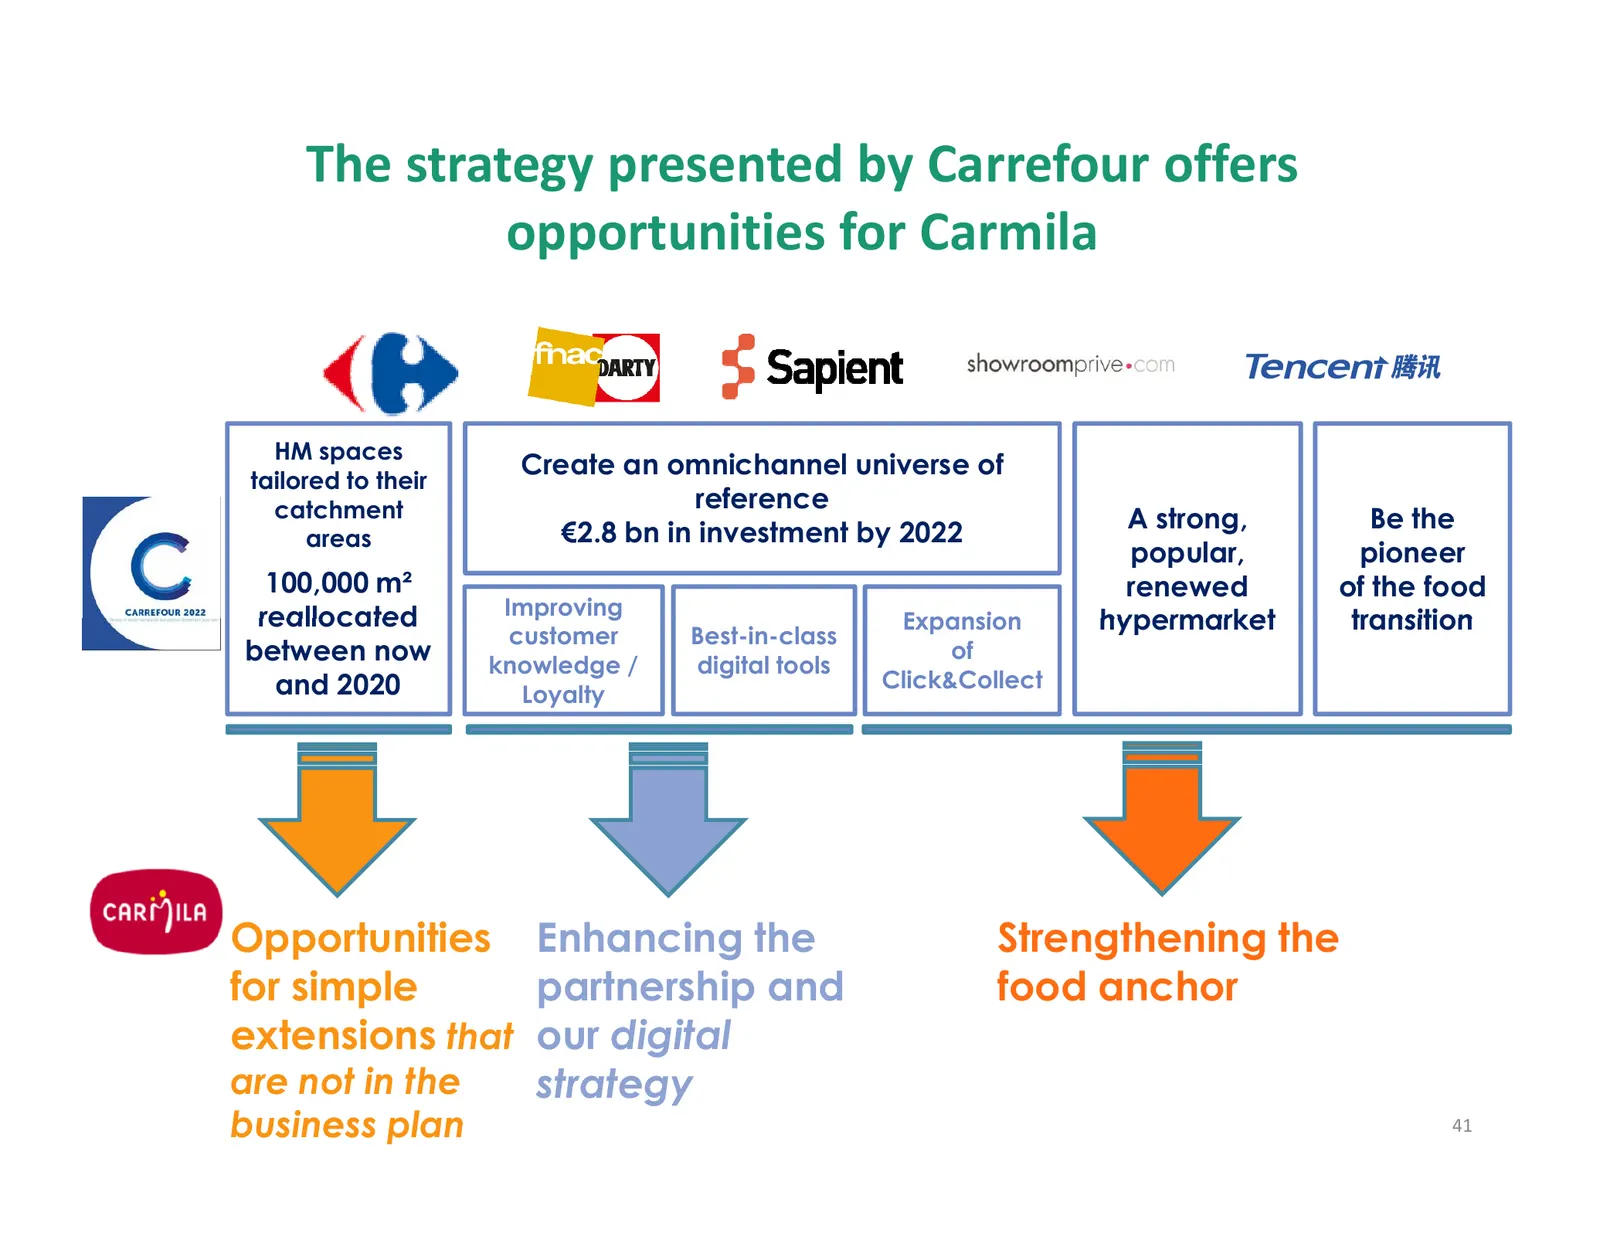
The strategy presented by Carrefour offers opportunities for Carmila HM spaces Create an omnichannel universe of tailored to their catchment reference A strong, Be the areas €2.8 bn in investment by 2022 popular, pioneer 100,000 m² renewed of the food reallocated Improving Expansion hypermarket tran
Slide 42: The foundations for Carmila's growth over the coming years are in place
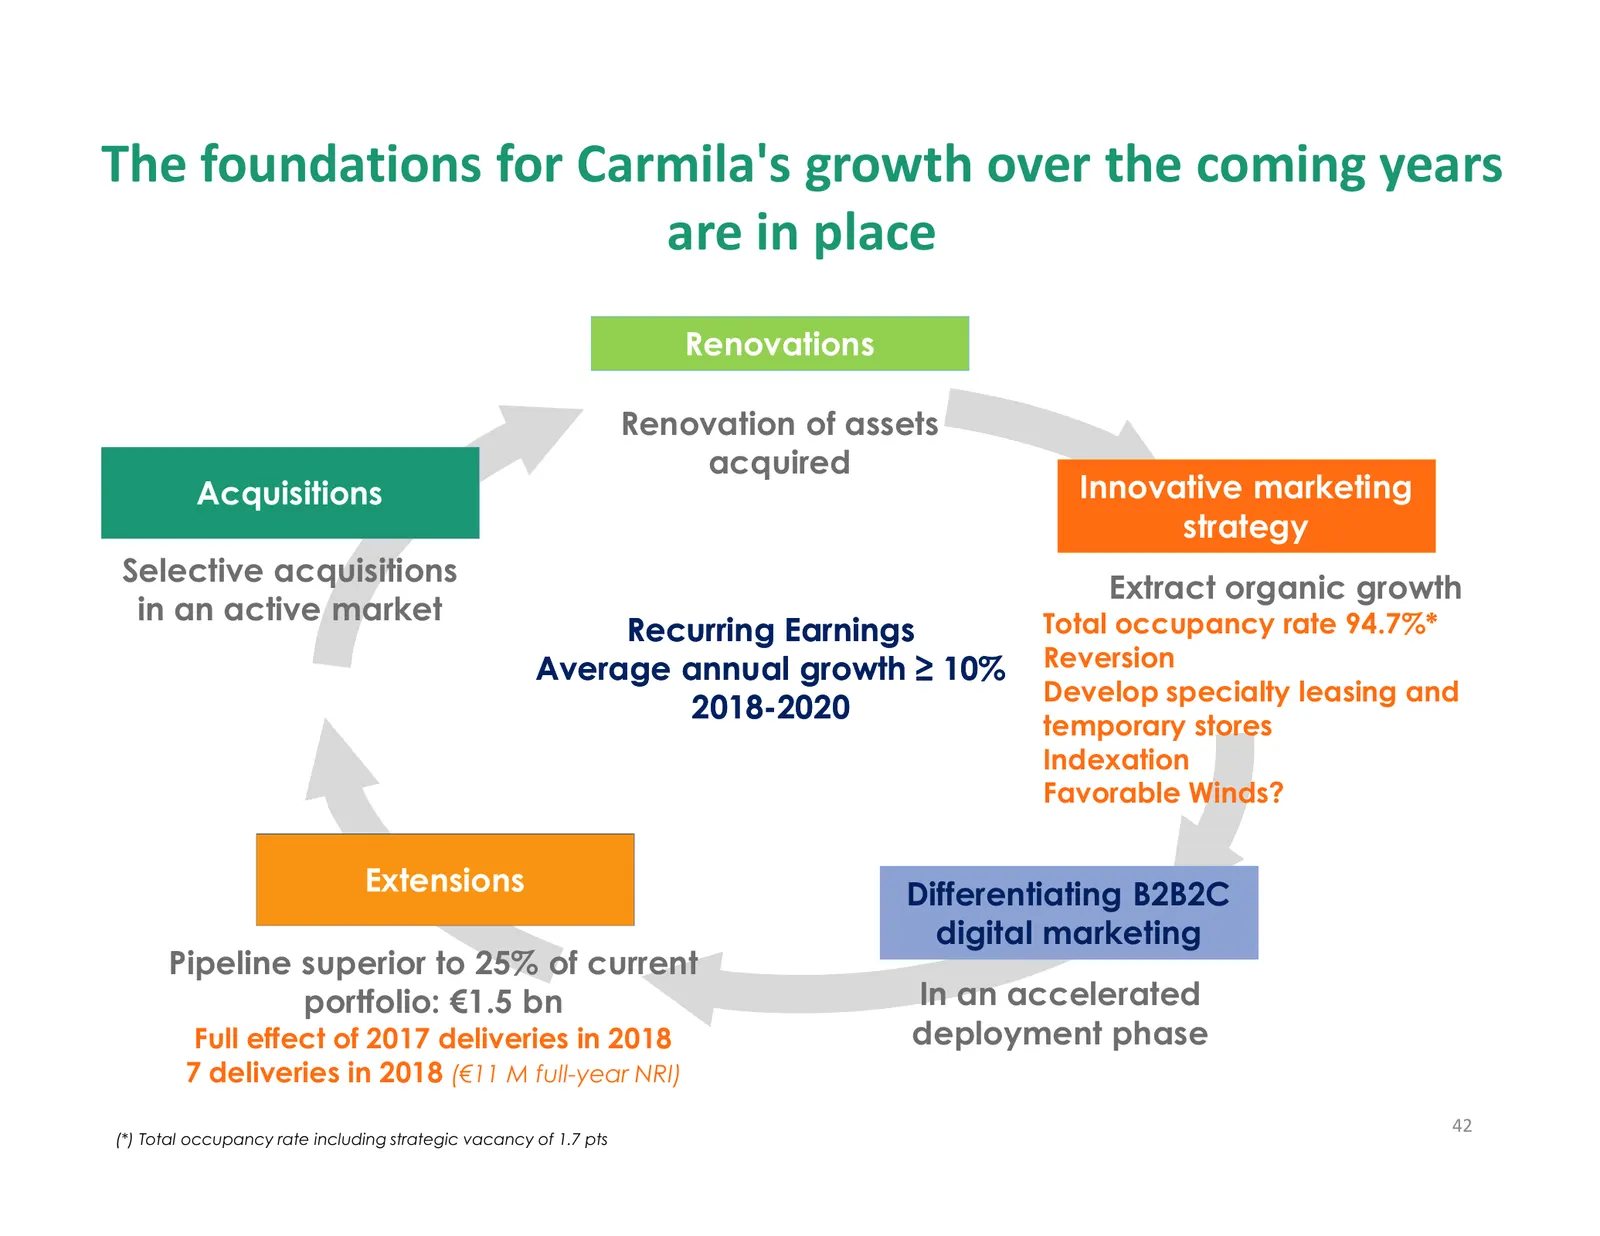
The foundations for Carmila's growth over the coming years are in place Renovations Renovation of assets acquired Acquisitions Innovative marketing strategy Selective acquisitions Extract organic growth in an active market Total occupancy rate 94.7%* Recurring Earnings Average annual growth ≥ 10% Re
Slide 43: Notoriety of our shares is maturing
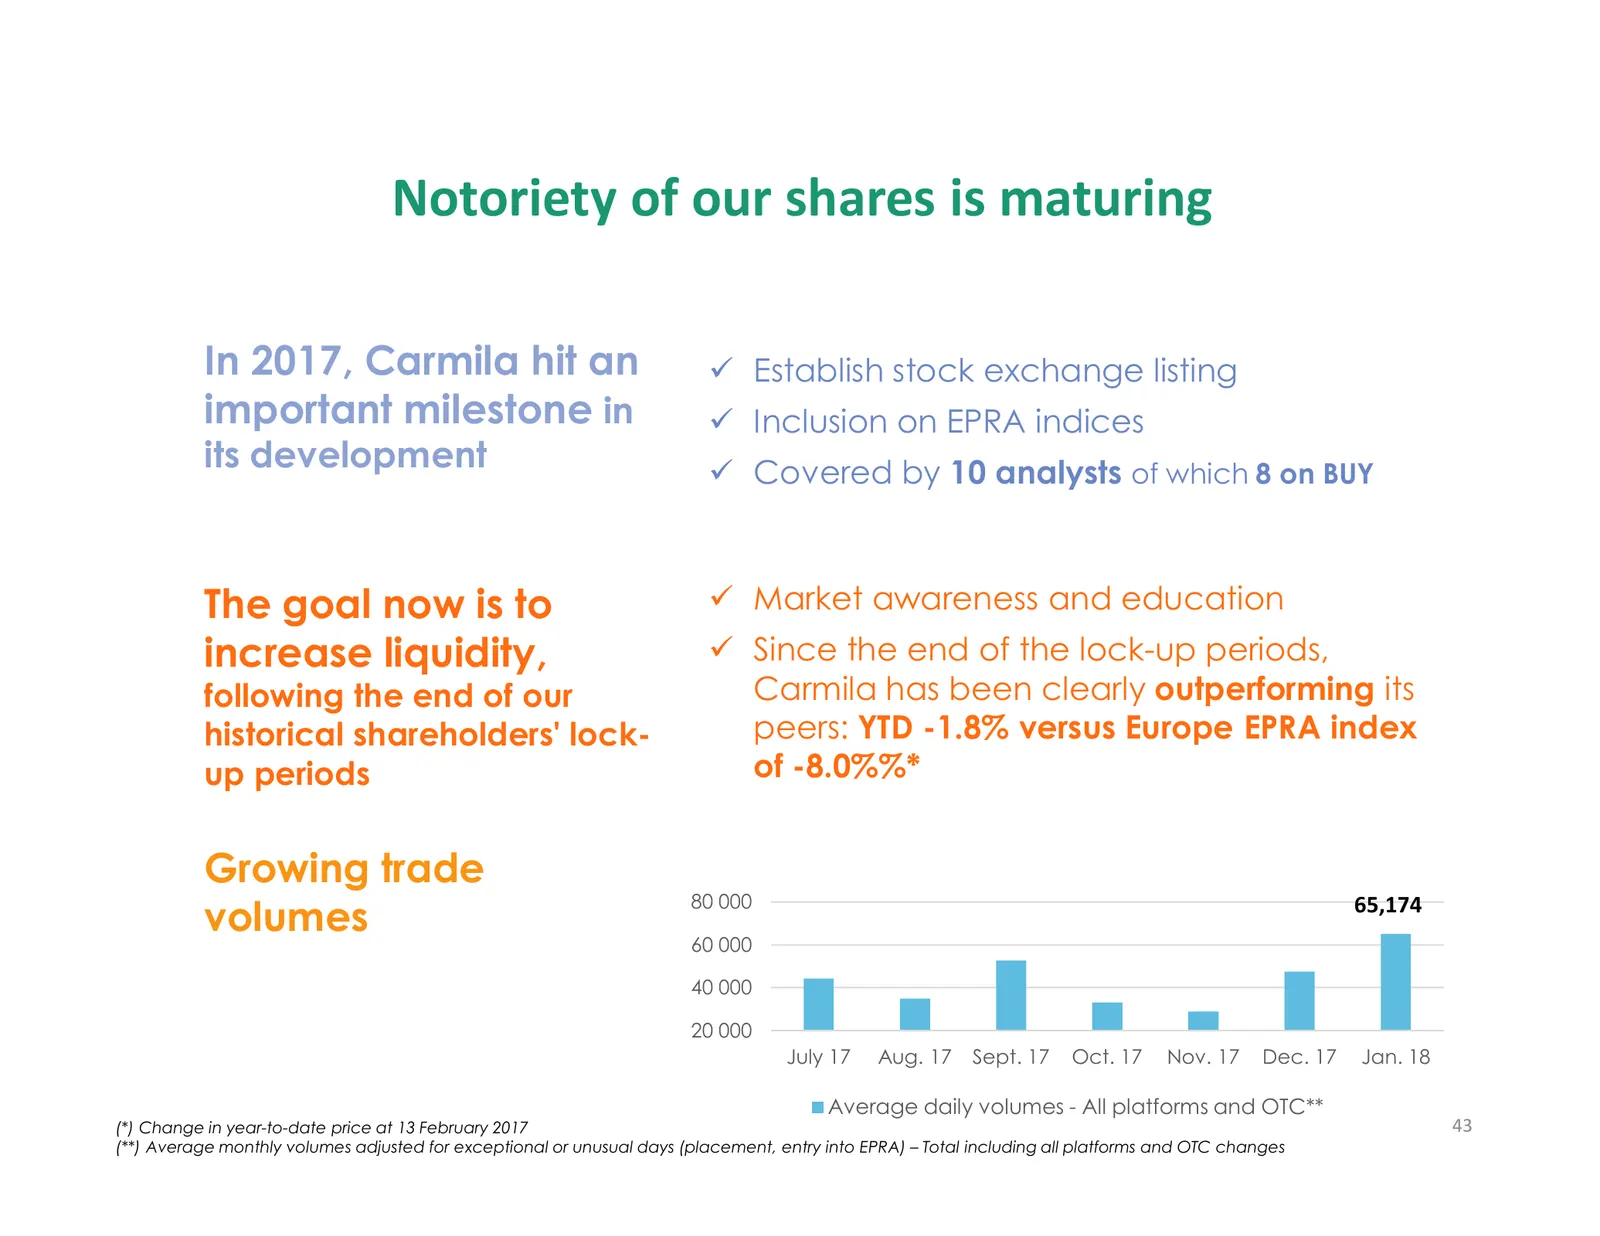
Notoriety of our shares is maturing In 2017, Carmila hit an Establish stock exchange listing important milestone in Inclusion on EPRA indices its development Covered by 10 analysts of which 8 on BUY The goal now is to Market awareness and education increase liquidity, Since the end of the lock-up pe
Slide 44: 2018 presents good prospects
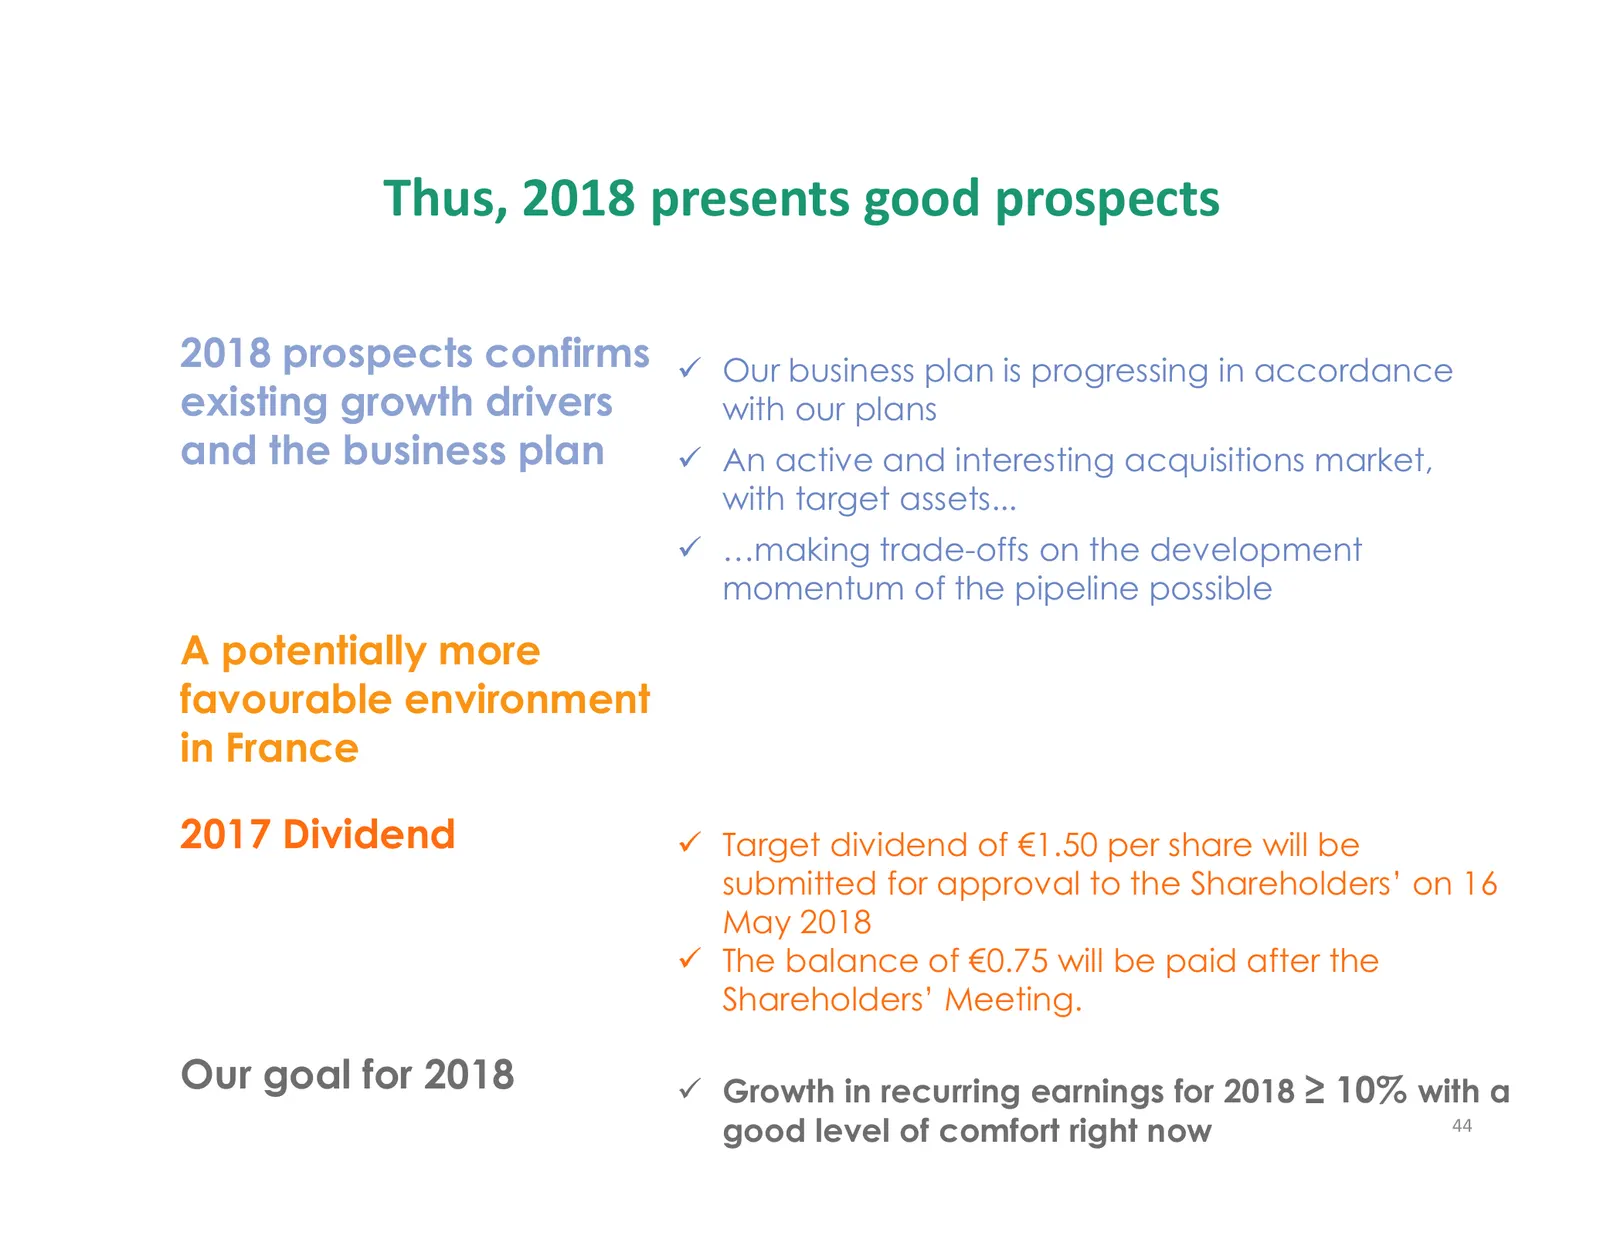
Thus, 2018 presents good prospects 2018 prospects confirms Our business plan is progressing in accordance existing growth drivers with our plans and the business plan An active and interesting acquisitions market, with target assets... …making trade-offs on the development momentum of the pipeline p
Source: Internet Archive copy of carmila.com
More decks from Carmila SA
 H1 2026 Earnings Presentation39 slides · Jul 29, 2026
 Shareholder Meeting (May 2026)71 slides · May 13, 2026
 FY2025 Earnings Presentation43 slides · February 2026
 H1 2025 Earnings Presentation44 slides · Jul 22, 2025
 Shareholder Meeting (May 2025)79 slides · May 14, 2025
 FY2024 Earnings Presentation43 slides · Feb 11, 2025