Naspers Limited Class N · JSE:NPN
Naspers Limited Class N — H1 FY2016 Earnings Presentation
33 slides from Naspers Limited Class N's earnings presentation, November 2015
Slide 1: Investor Briefing Booklet – additional financials
Investor Briefing Booklet – additional financials For the six months ended 30 September 2015
Slide 2: Important information
Important information This presentation contains forward-looking statements as defined in the United States Private Securities Litigation Reform Act of 1995. Words such as “believe”, “anticipate”, “intend”, “seek”, “will”, “plan”, “could”, “may”, “endeavour” and similar expressions are intended to i
Slide 3: 1H FY16: Synopsis of financials
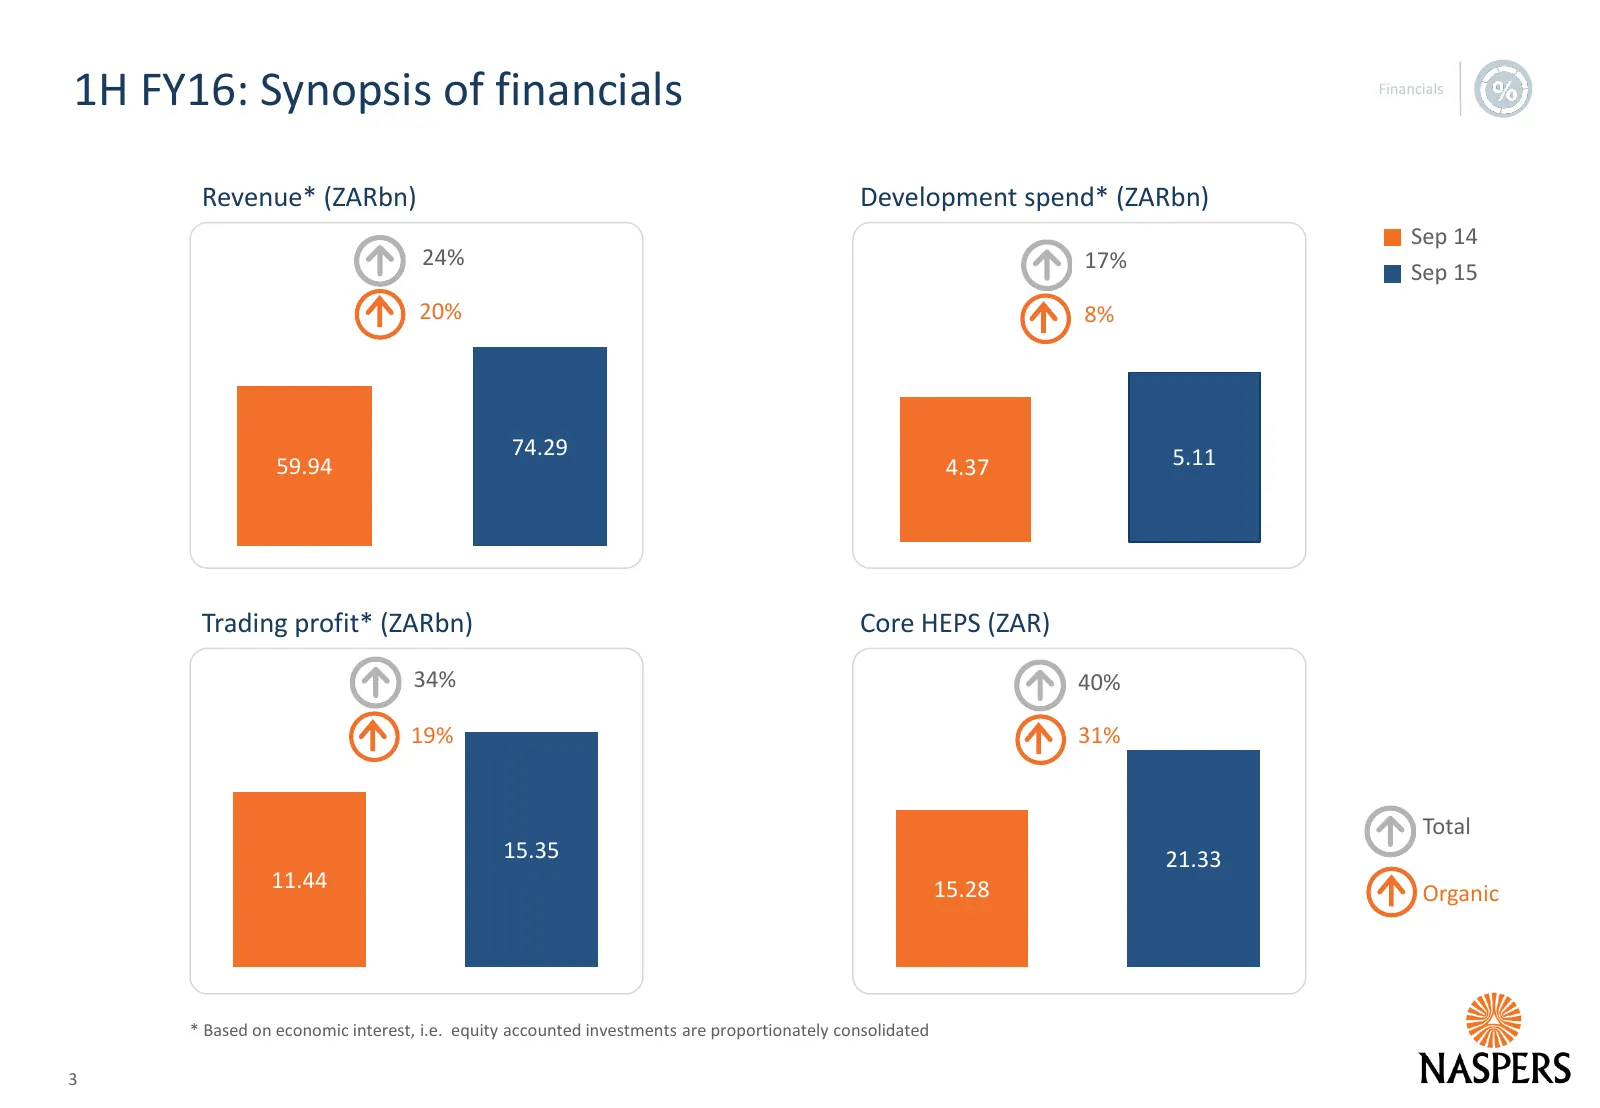
1H FY16: Synopsis of financials Revenue* (ZARbn) Development spend* (ZARbn) Sep 14 24% 17% Sep 15 20% 8% 74.29 5.11 59.94 4.37 Trading profit* (ZARbn) Core HEPS (ZAR) 34% 40% 19% 31% Total 15.35 21.33 11.44 15.28 Organic * Based on economic interest, i.e. equity accounted investments are proportiona
Slide 4: Revenue growth remains strong
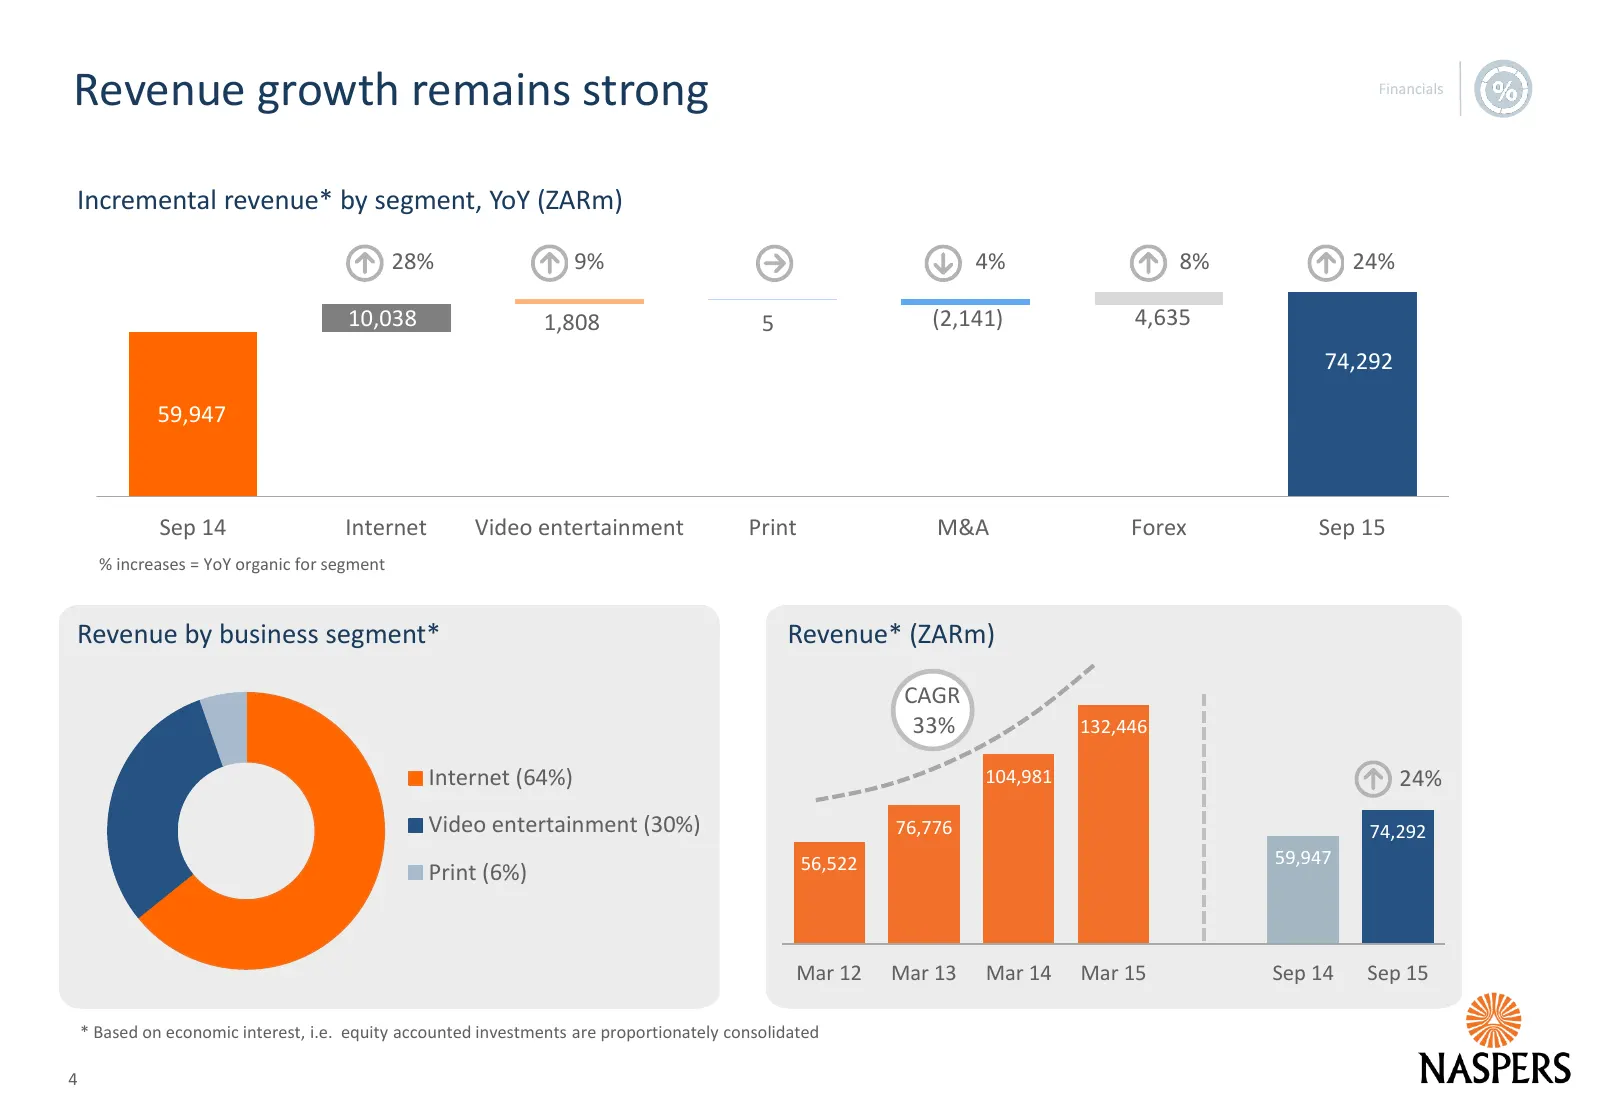
Revenue growth remains strong Incremental revenue* by segment, YoY (ZARm) 28% 9% 4% 8% 24% 10,038 1,808 5 (2,141) 4,635 74,292 59,947 Sep 14 Internet Video entertainment Print M&A Forex Sep 15 % increases = YoY organic for segment Revenue by business segment* Revenue* (ZARm) CAGR 33% 132,446 Interne
Slide 5: Diversified business mix
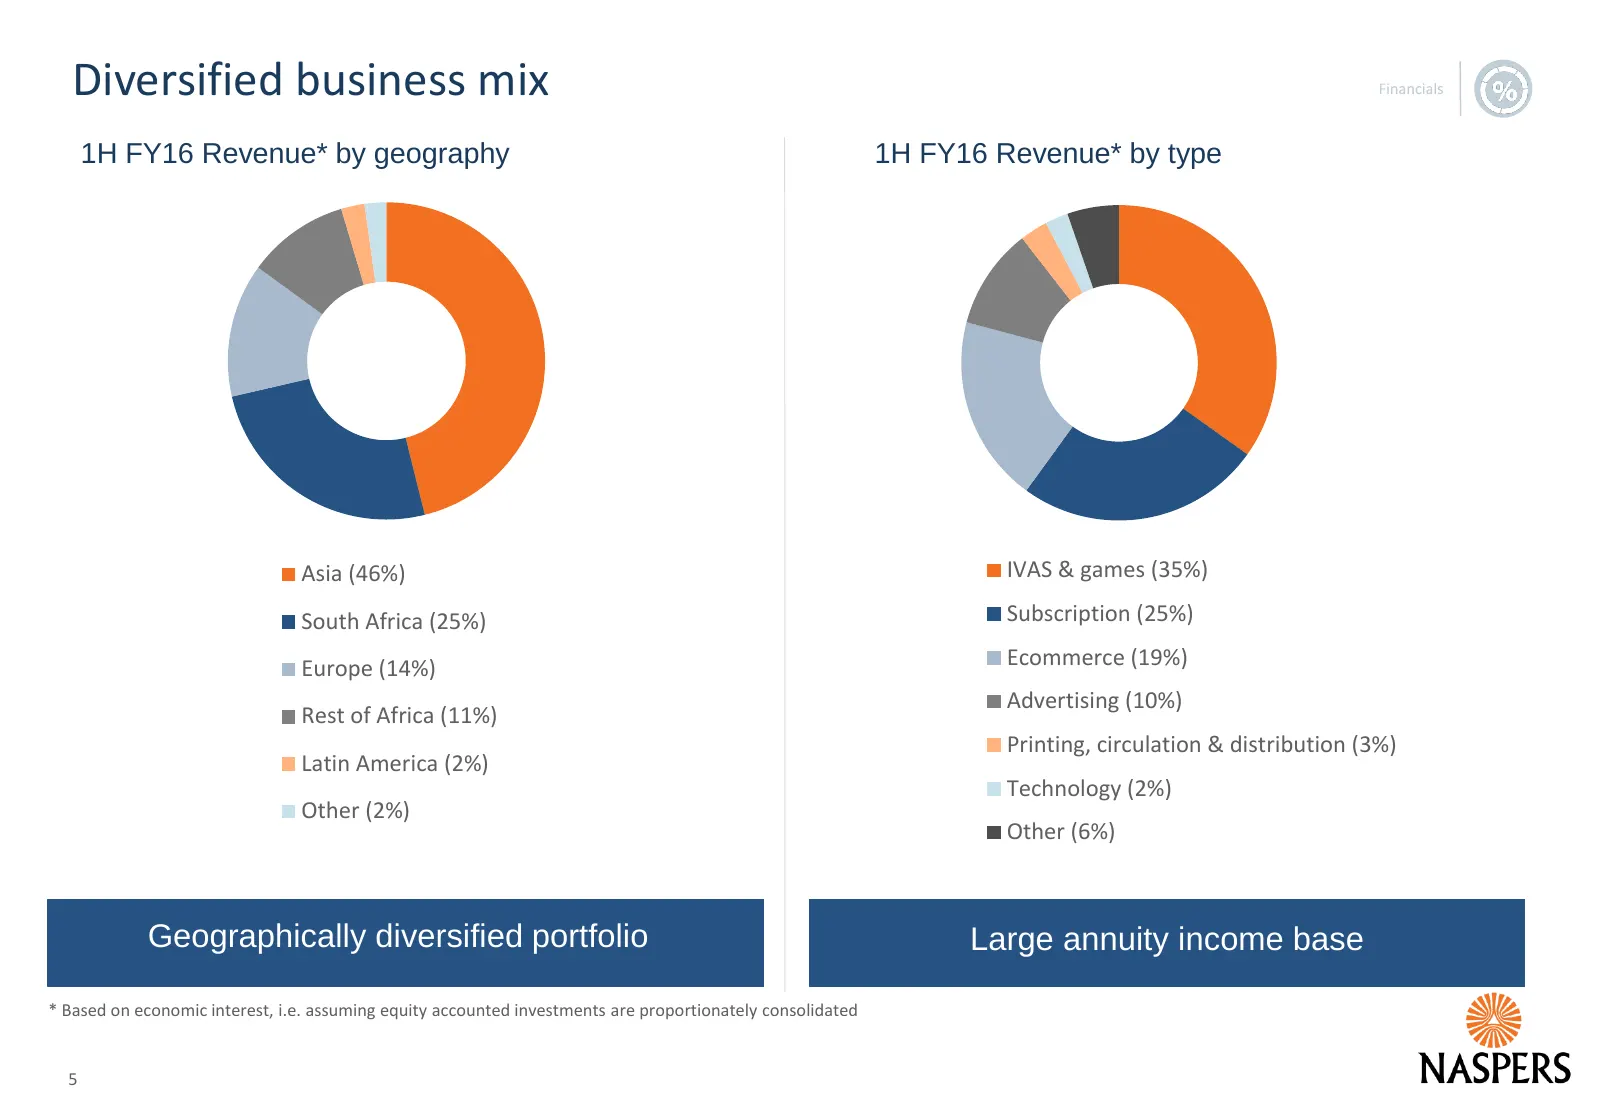
Diversified business mix 1H FY16 Revenue* by geography 1H FY16 Revenue* by type Asia (46%) IVAS & games (35%) South Africa (25%) Subscription (25%) Europe (14%) Ecommerce (19%) Advertising (10%) Rest of Africa (11%) Printing, circulation & distribution (3%) Latin America (2%) Technology (2%) Other (
Slide 6: Development spend growth decelerating
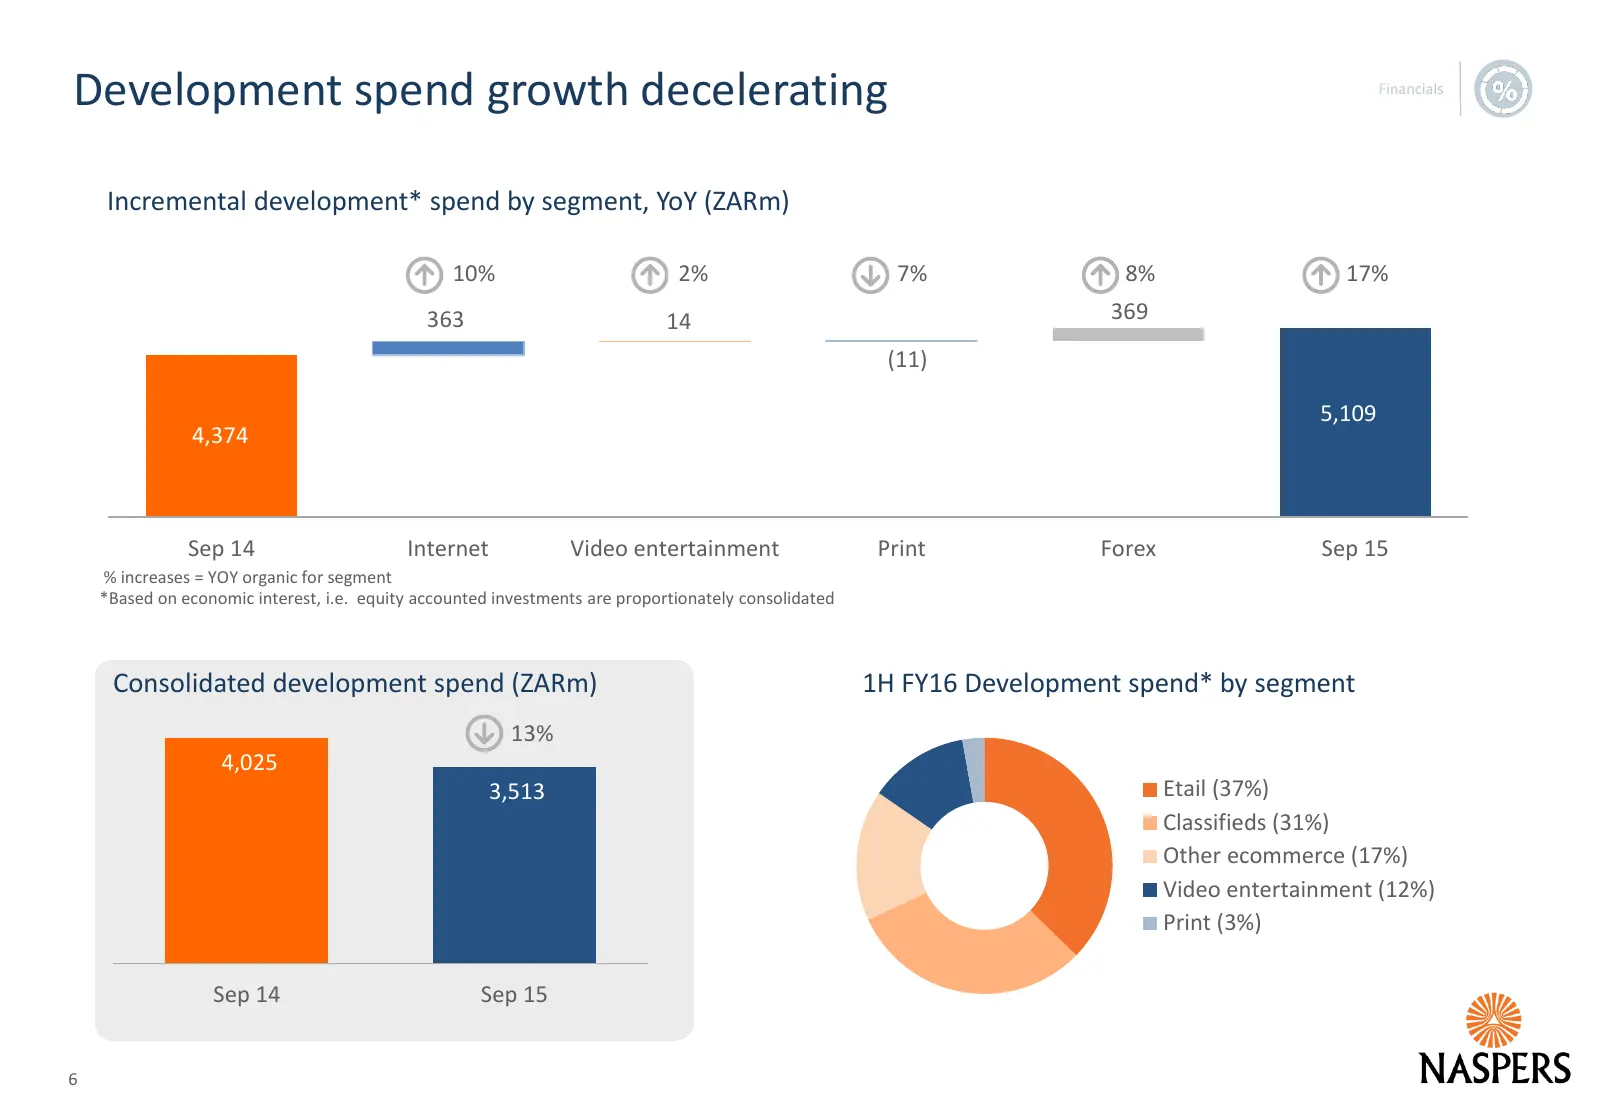
Development spend growth decelerating Incremental development* spend by segment, YoY (ZARm) 10% 2% 7% 8% 17% 363 14 369 (11) 5,109 4,374 Sep 14 Internet Video entertainment Print Forex Sep 15 % increases = YOY organic for segment *Based on economic interest, i.e. equity accounted investments are pro
Slide 7: Ecommerce: development spend
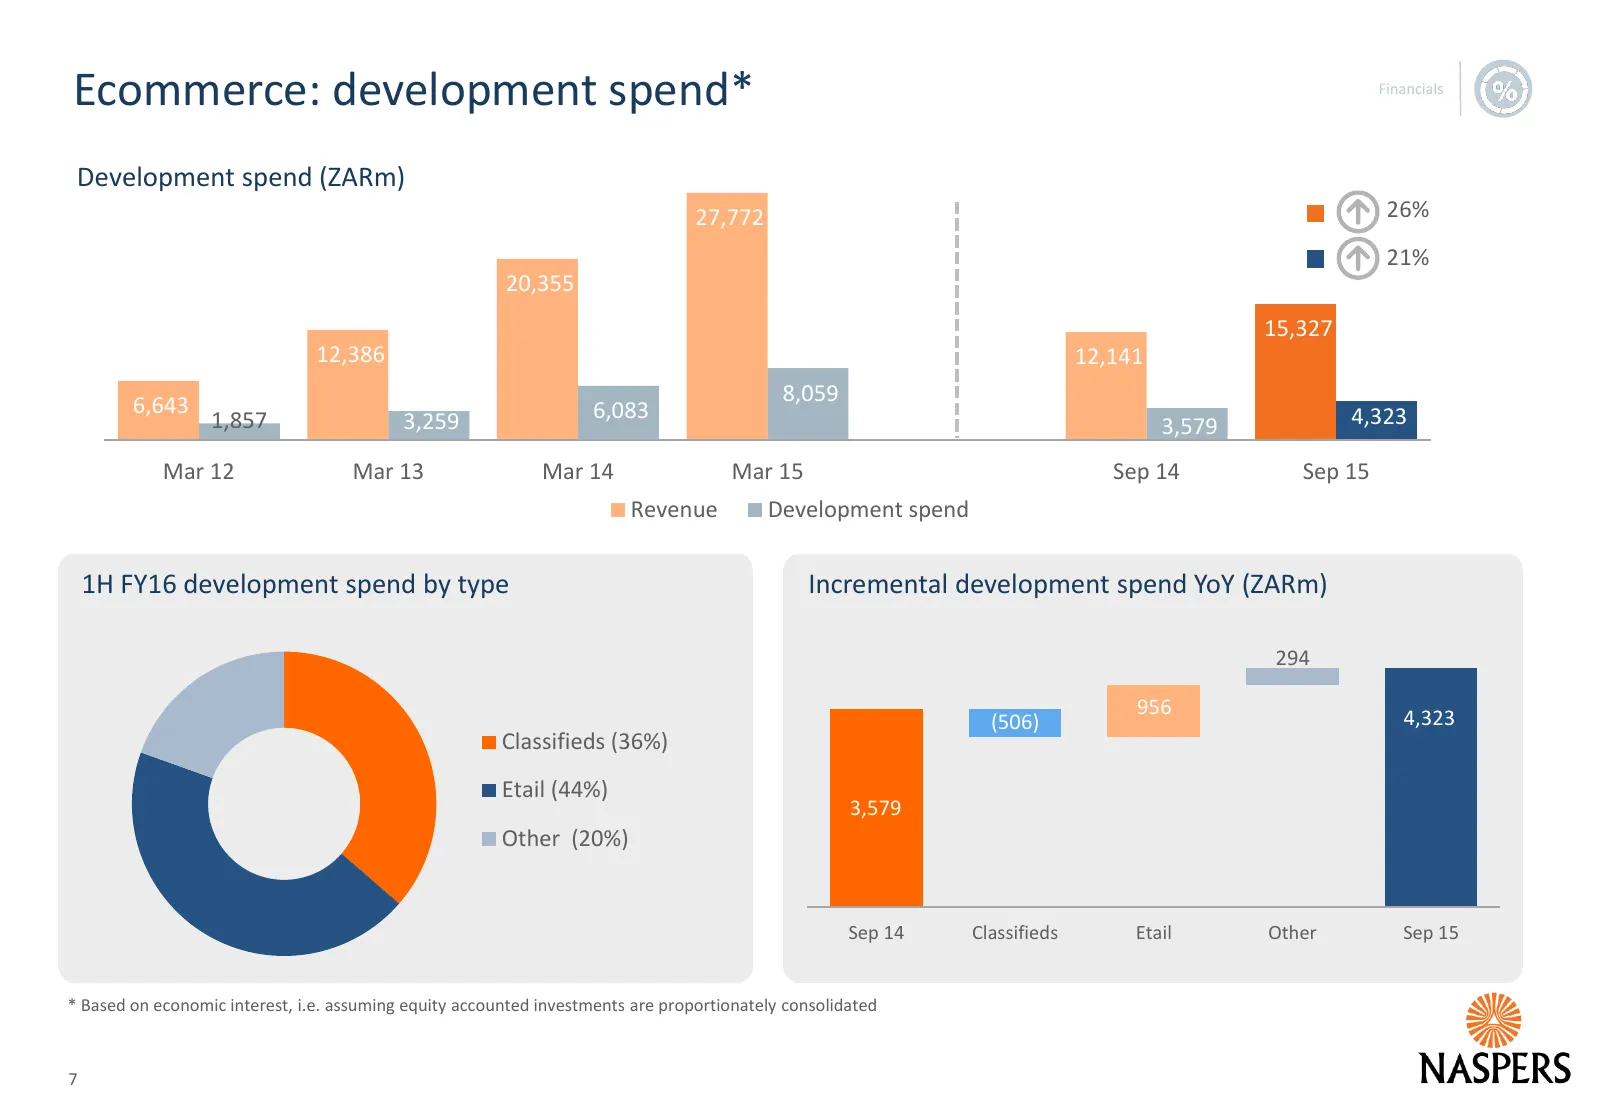
Ecommerce: development spend* Development spend (ZARm) 27,772 26% 21% 20,355 15,327 12,386 12,141 8,059 6,643 6,083 4,323 1,857 3,259 3,579 Mar 12 Mar 13 Mar 14 Mar 15 Sep 14 Sep 15 Revenue Development spend 1H FY16 development spend by type Incremental development spend YoY (ZARm) 294 956 4,323 (50
Slide 8: Ecommerce: consolidated development spend
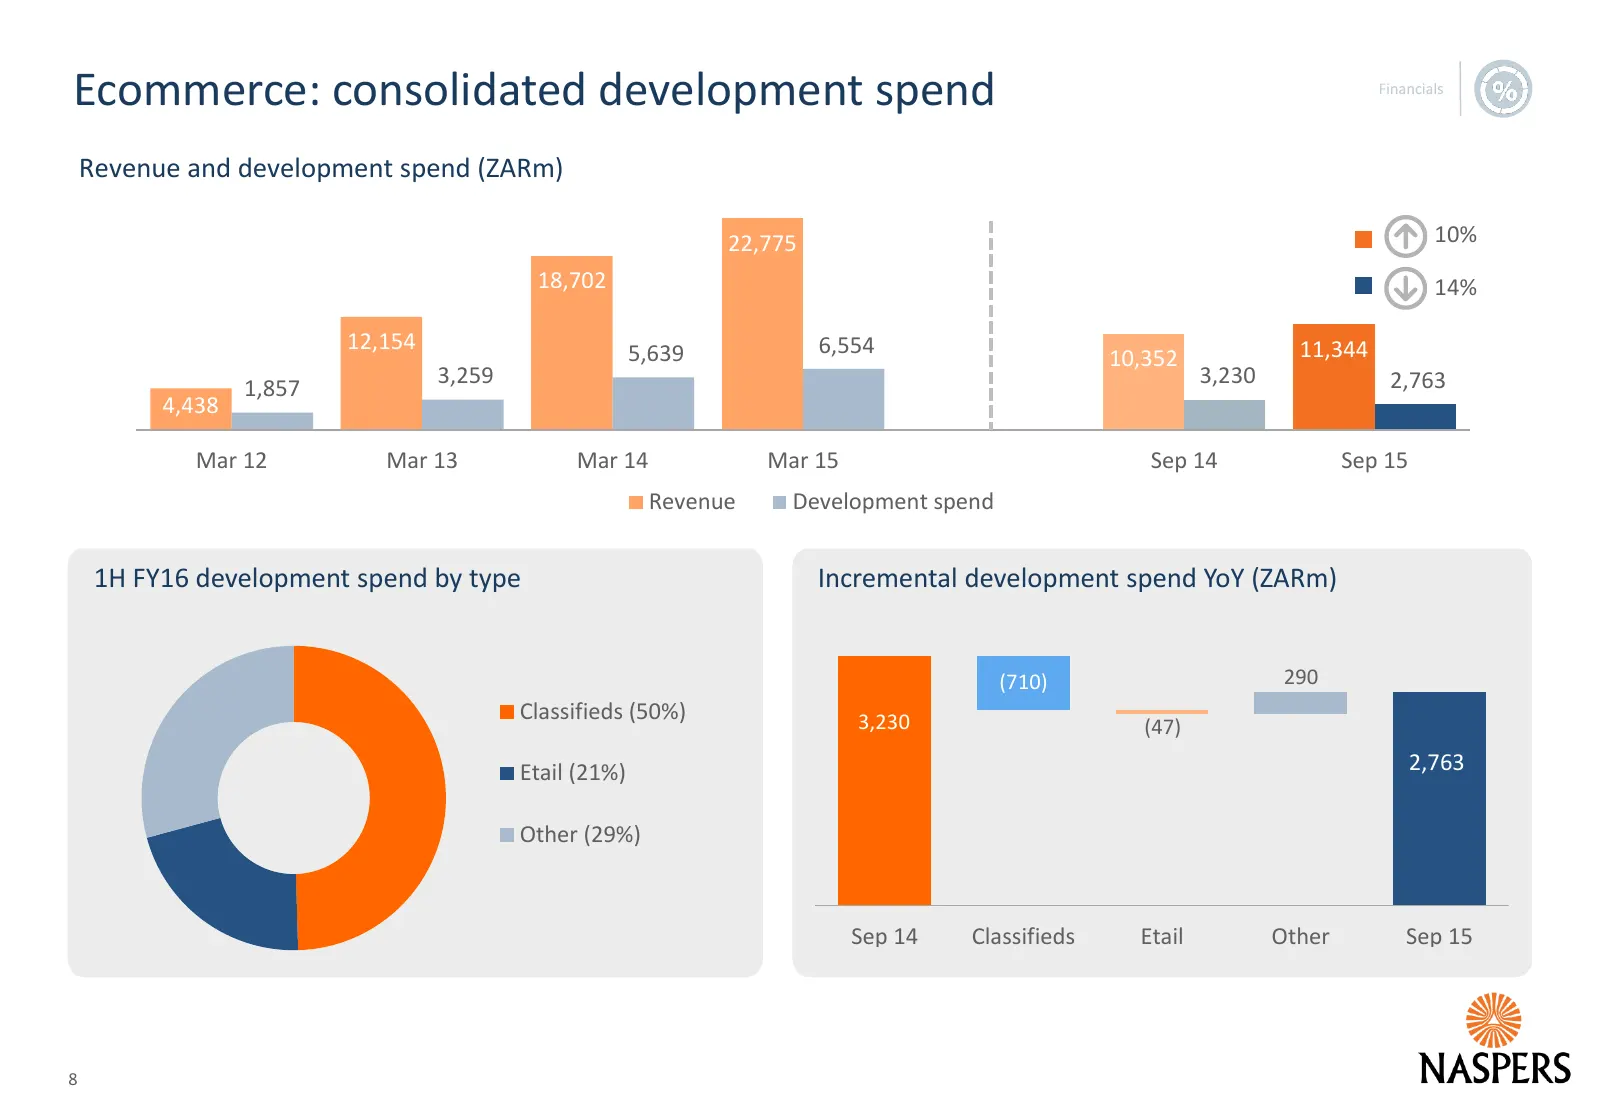
Ecommerce: consolidated development spend Revenue and development spend (ZARm) 22,775 10% 18,702 14% 12,154 5,639 6,554 11,344 10,352 3,259 3,230 2,763 1,857 4,438 Mar 12 Mar 13 Mar 14 Mar 15 Sep 14 Sep 15 Revenue Development spend 1H FY16 development spend by type Incremental development spend YoY
Slide 9: Internet the fastest growing segment
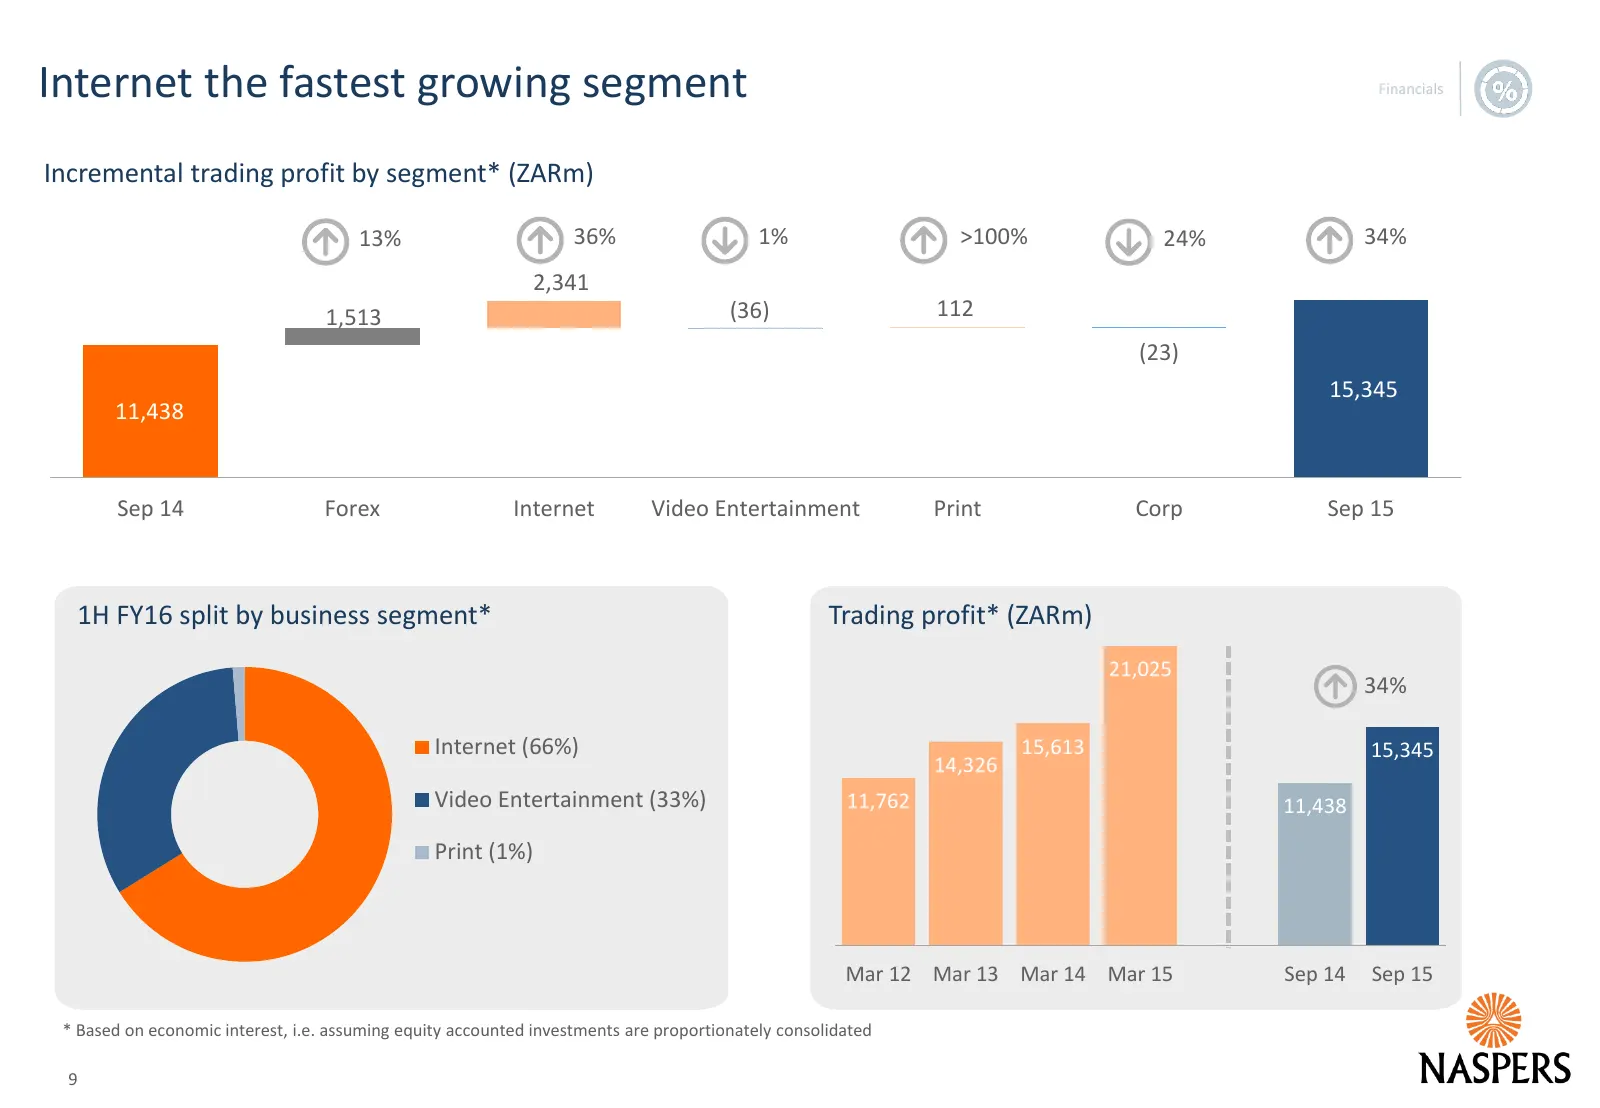
Internet the fastest growing segment Incremental trading profit by segment* (ZARm) 13% 36% 1% >100% 24% 34% 2,341 1,513 (36) 112 (23) 15,345 11,438 Sep 14 Forex Internet Video Entertainment Print Corp Sep 15 1H FY16 split by business segment* Trading profit* (ZARm) 21,025 34% Internet (66%) 15,613 1
Slide 10: Summarised consolidated income statement
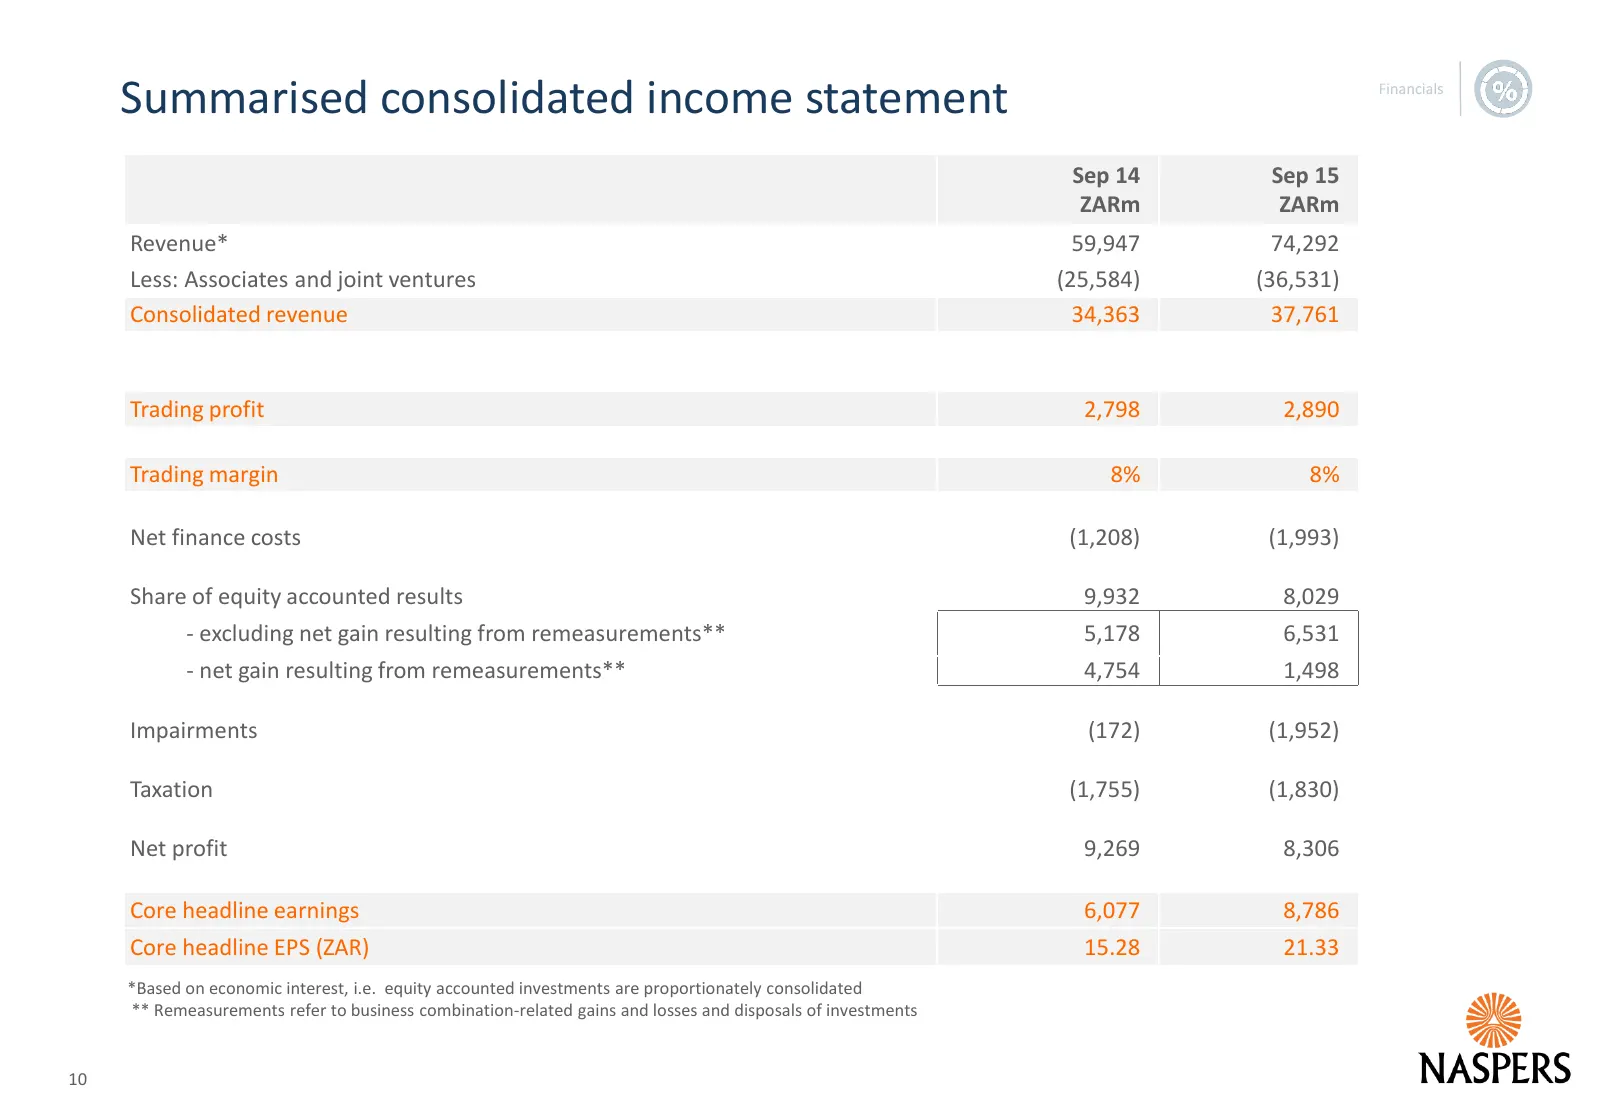
Summarised consolidated income statement Sep 14 Sep 15 ZARm ZARm Revenue* 59,947 74,292 Less: Associates and joint ventures (25,584) (36,531) Consolidated revenue 34,363 37,761 Trading profit 2,798 2,890 Trading margin 8% 8% Net finance costs (1,208) (1,993) Share of equity accounted results 9,932 8
Slide 11: Net finance costs
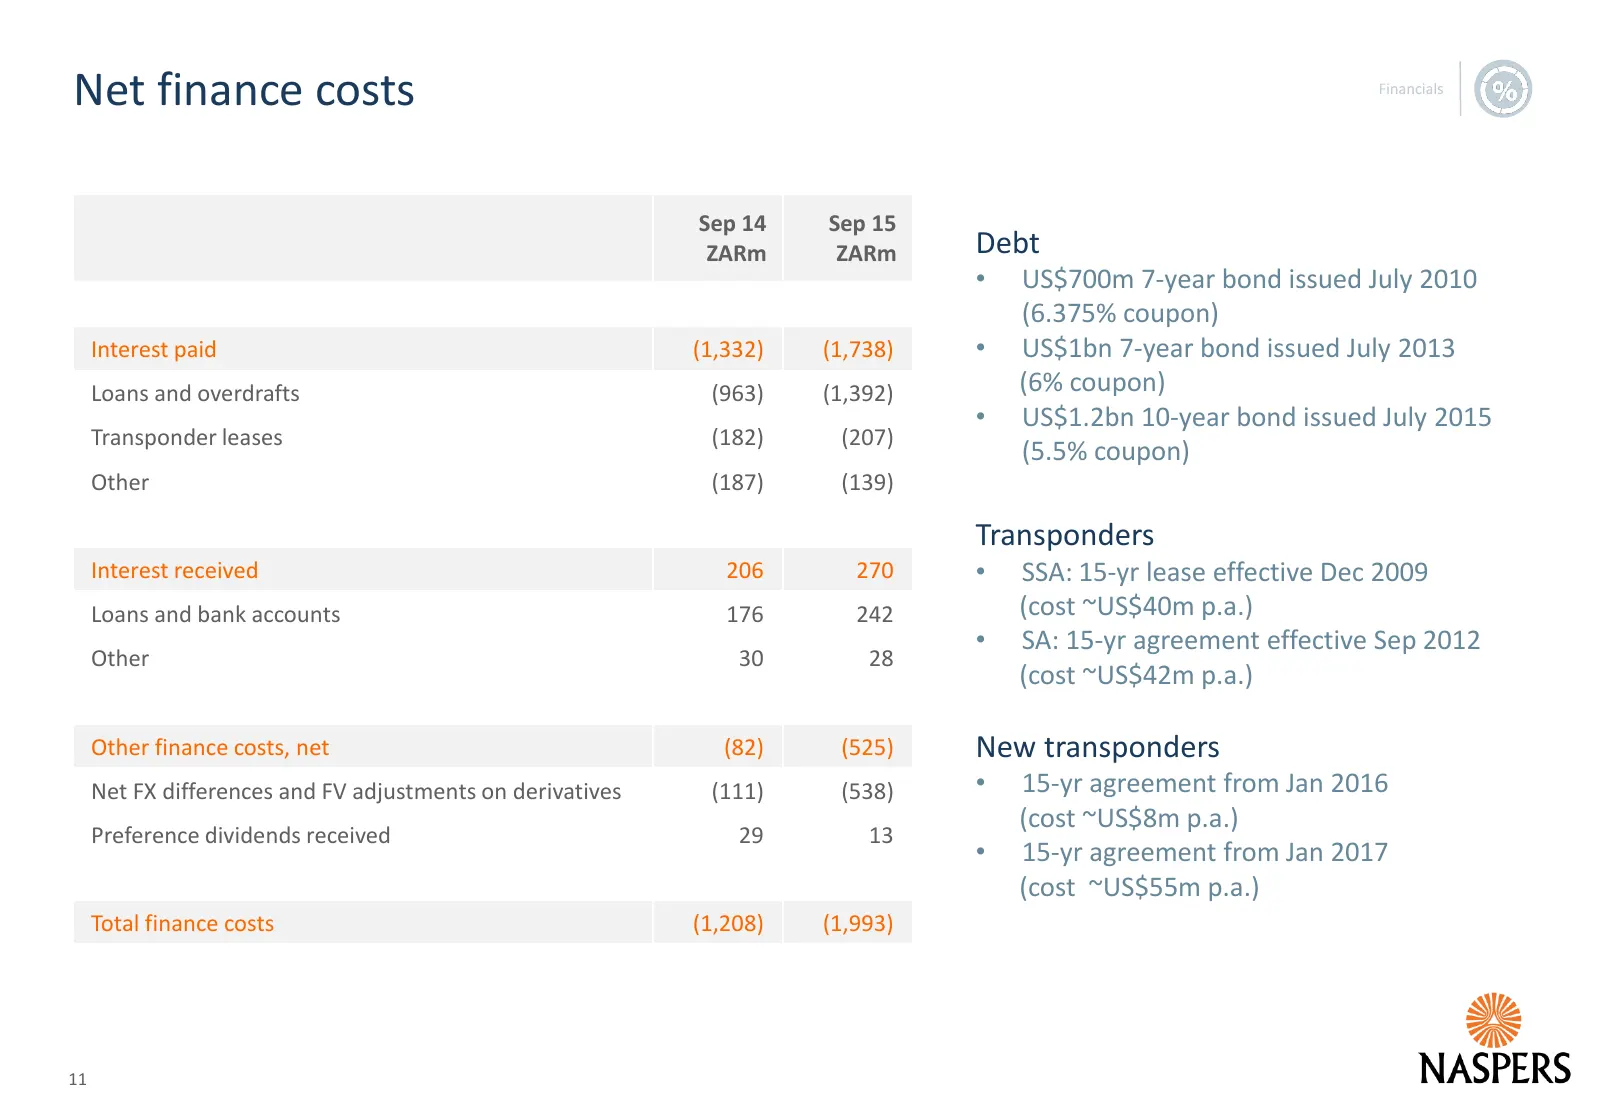
Net finance costs Sep 14 Sep 15 ZARm ZARm Debt • US$700m 7-year bond issued July 2010 (6.375% coupon) Interest paid (1,332) (1,738) • US$1bn 7-year bond issued July 2013 Loans and overdrafts (963) (1,392) (6% coupon) • US$1.2bn 10-year bond issued July 2015 Transponder leases (182) (207) (5.5% coupo
Slide 12: Equity accounted results
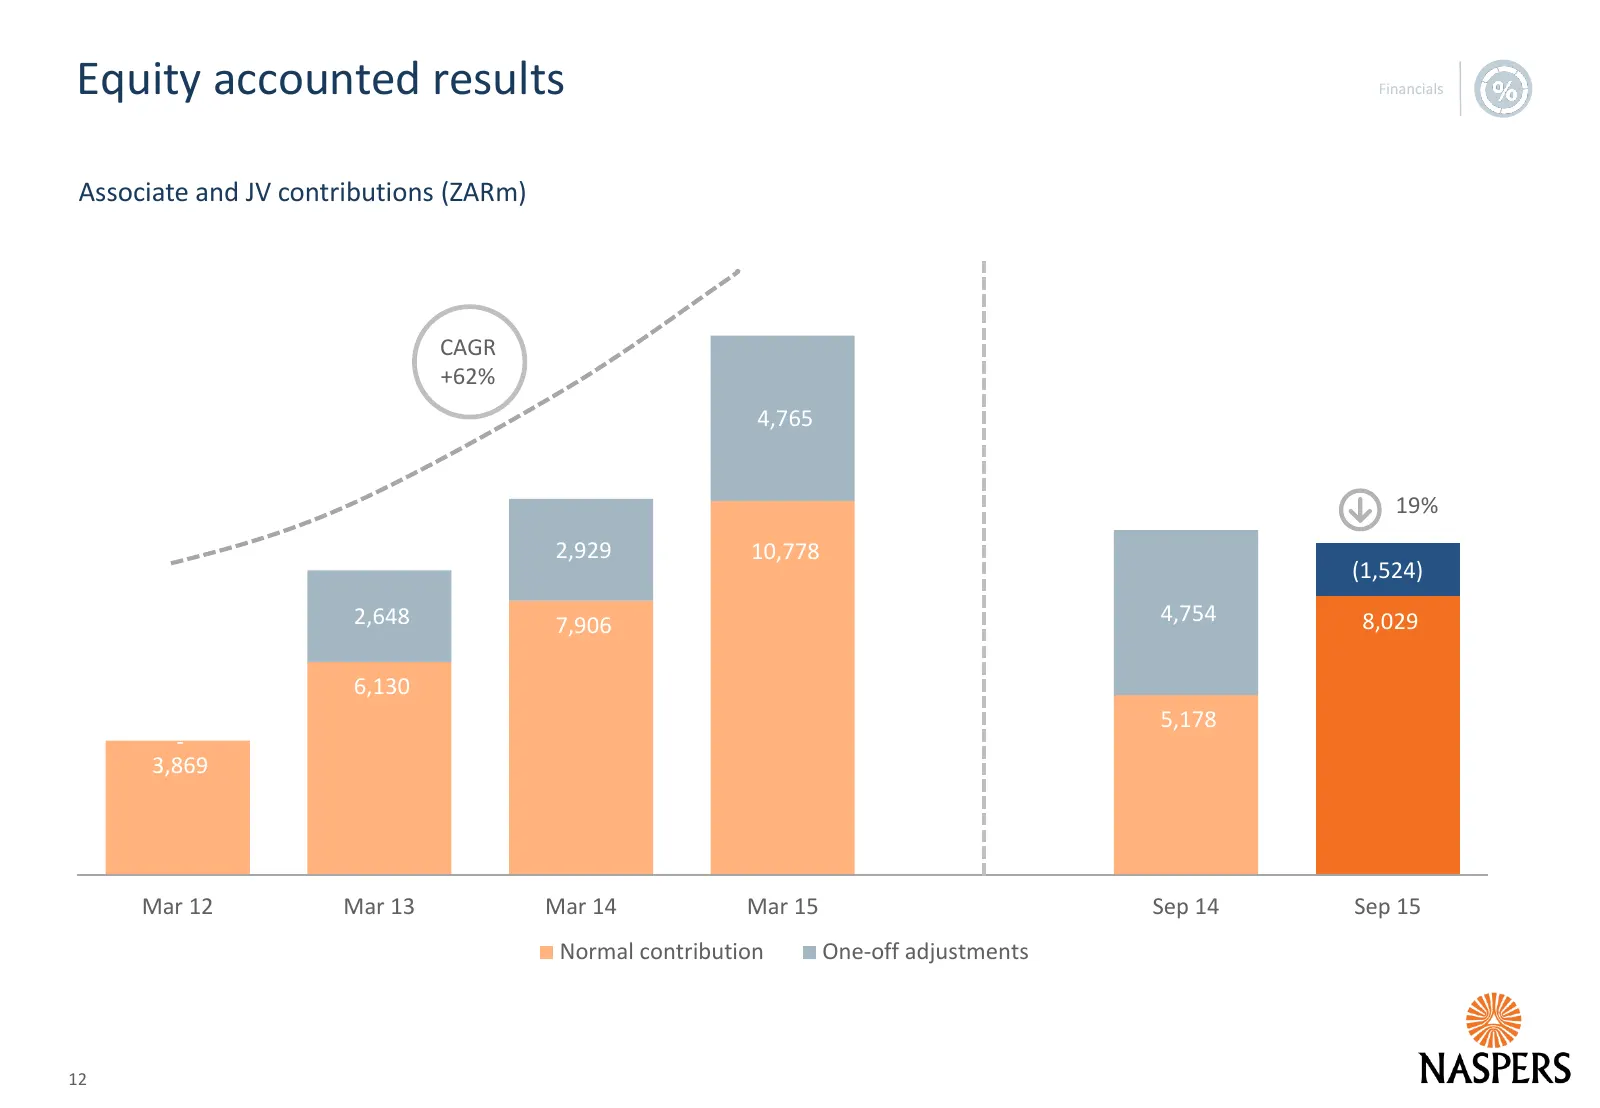
Equity accounted results Associate and JV contributions (ZARm) CAGR +62% 4,765 19% 2,929 10,778 (1,524) 2,648 7,906 4,754 8,029 6,130 5,178 - 3,869 Mar 12 Mar 13 Mar 14 Mar 15 Sep 14 Sep 15 Normal contribution One-off adjustments 12
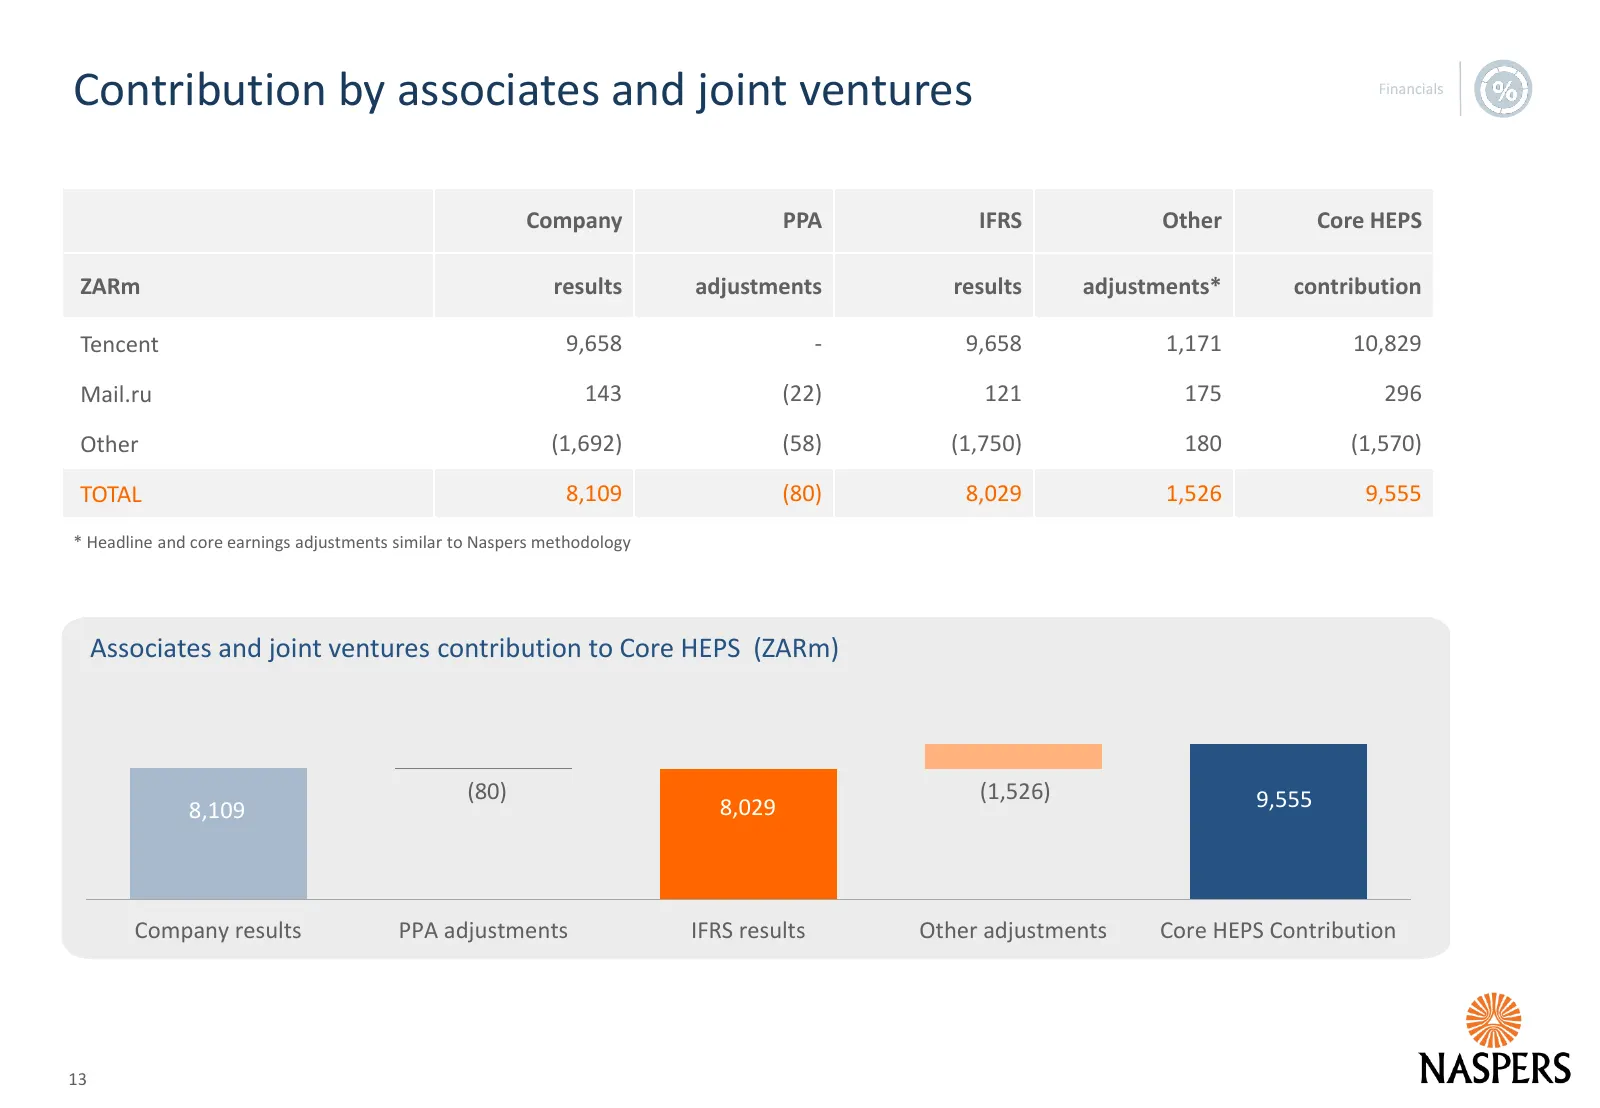
Slide 13: Contribution by associates and joint ventures
Contribution by associates and joint ventures Company PPA IFRS Other Core HEPS ZARm results adjustments results adjustments* contribution Tencent 9,658 - 9,658 1,171 10,829 Mail.ru 143 (22) 121 175 296 Other (1,692) (58) (1,750) 180 (1,570) TOTAL 8,109 (80) 8,029 1,526 9,555 * Headline and core earn
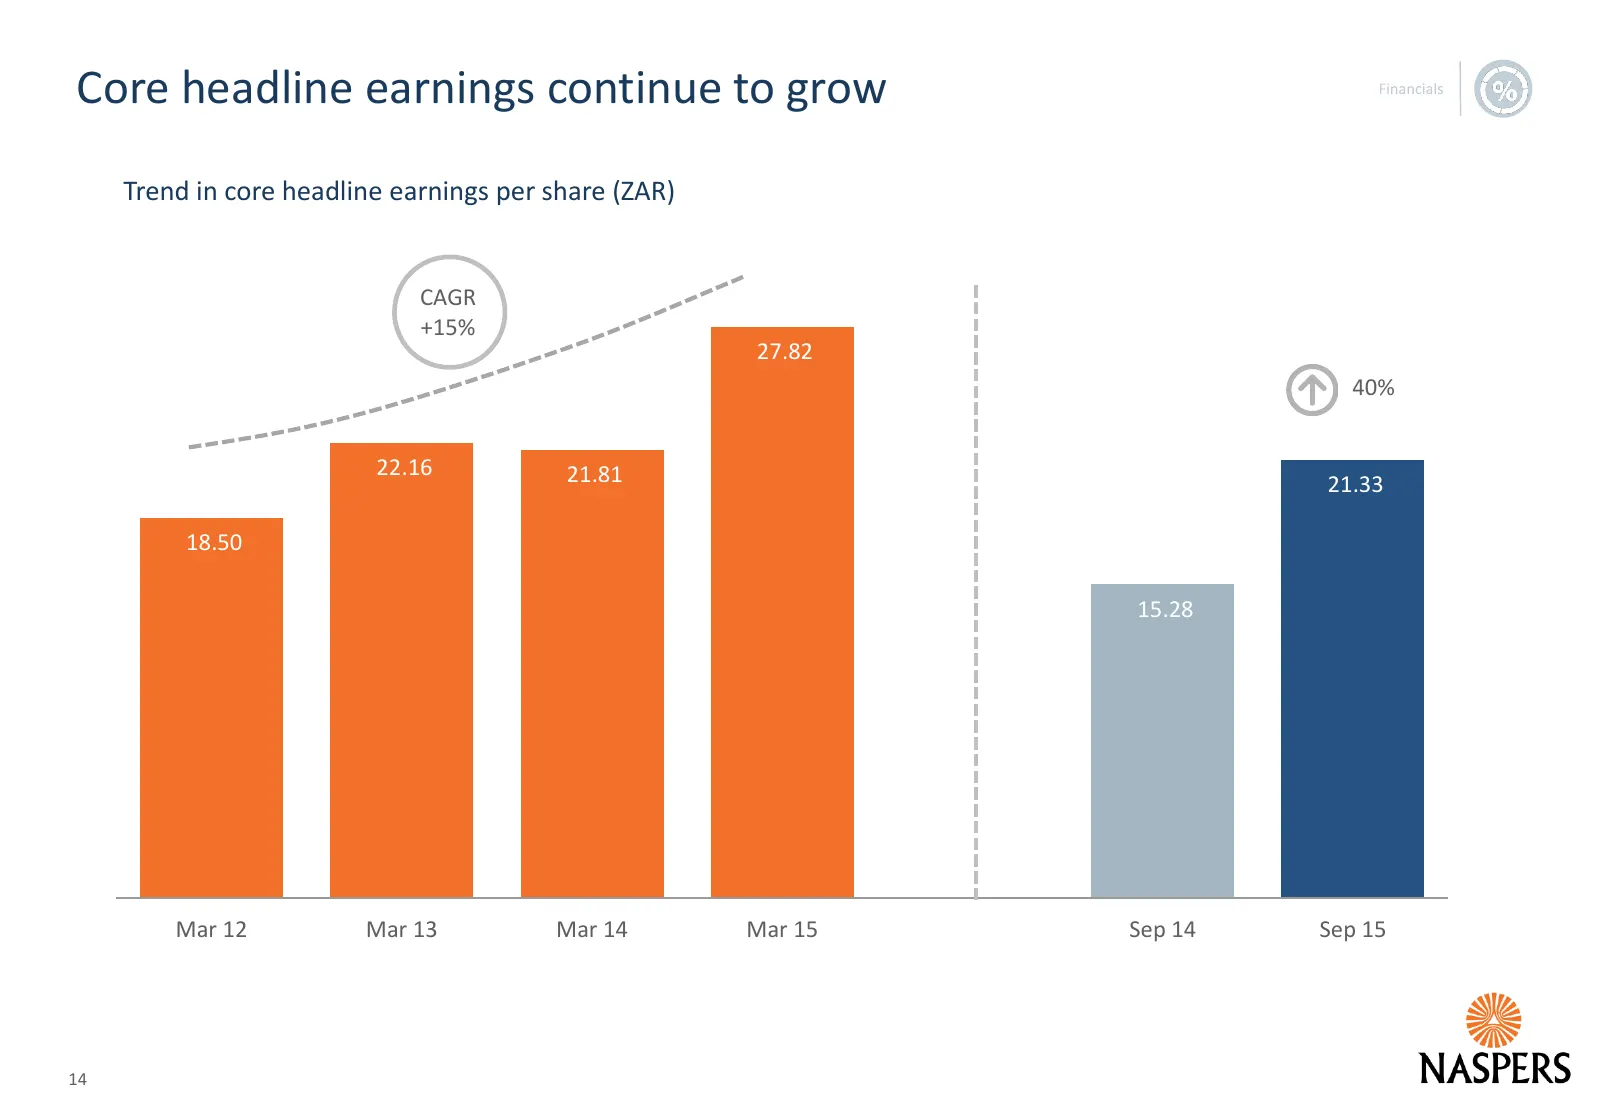
Slide 14: Core headline earnings continue to grow
Core headline earnings continue to grow Trend in core headline earnings per share (ZAR) CAGR +15% 27.82 40% 22.16 21.81 21.33 18.50 15.28 Mar 12 Mar 13 Mar 14 Mar 15 Sep 14 Sep 15 14
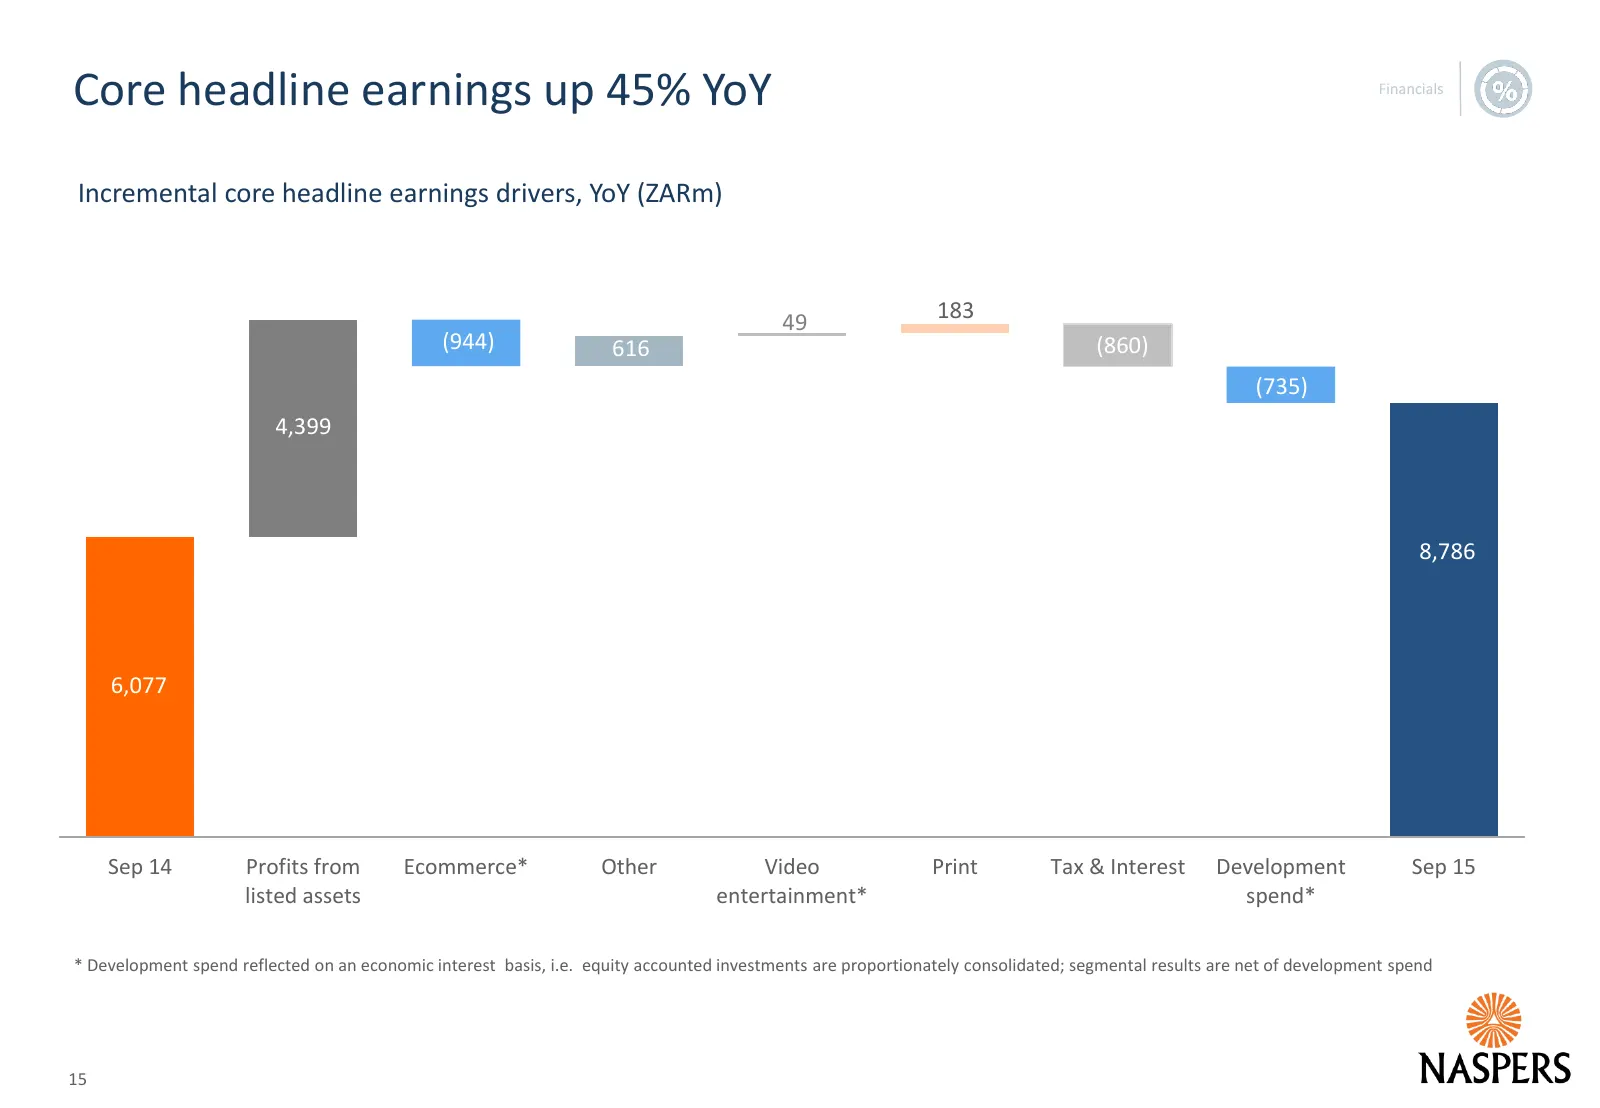
Slide 15: Core headline earnings up 45% YoY
Core headline earnings up 45% YoY Incremental core headline earnings drivers, YoY (ZARm) (1,560) 183 (1,233) 49 (944) 616 (860) (735) 4,399 (944) 8,786 6,077 Sep 14 Profits from Ecommerce* Other Video Print Tax & Interest Development Sep 15 listed assets entertainment* spend* * Development spend ref
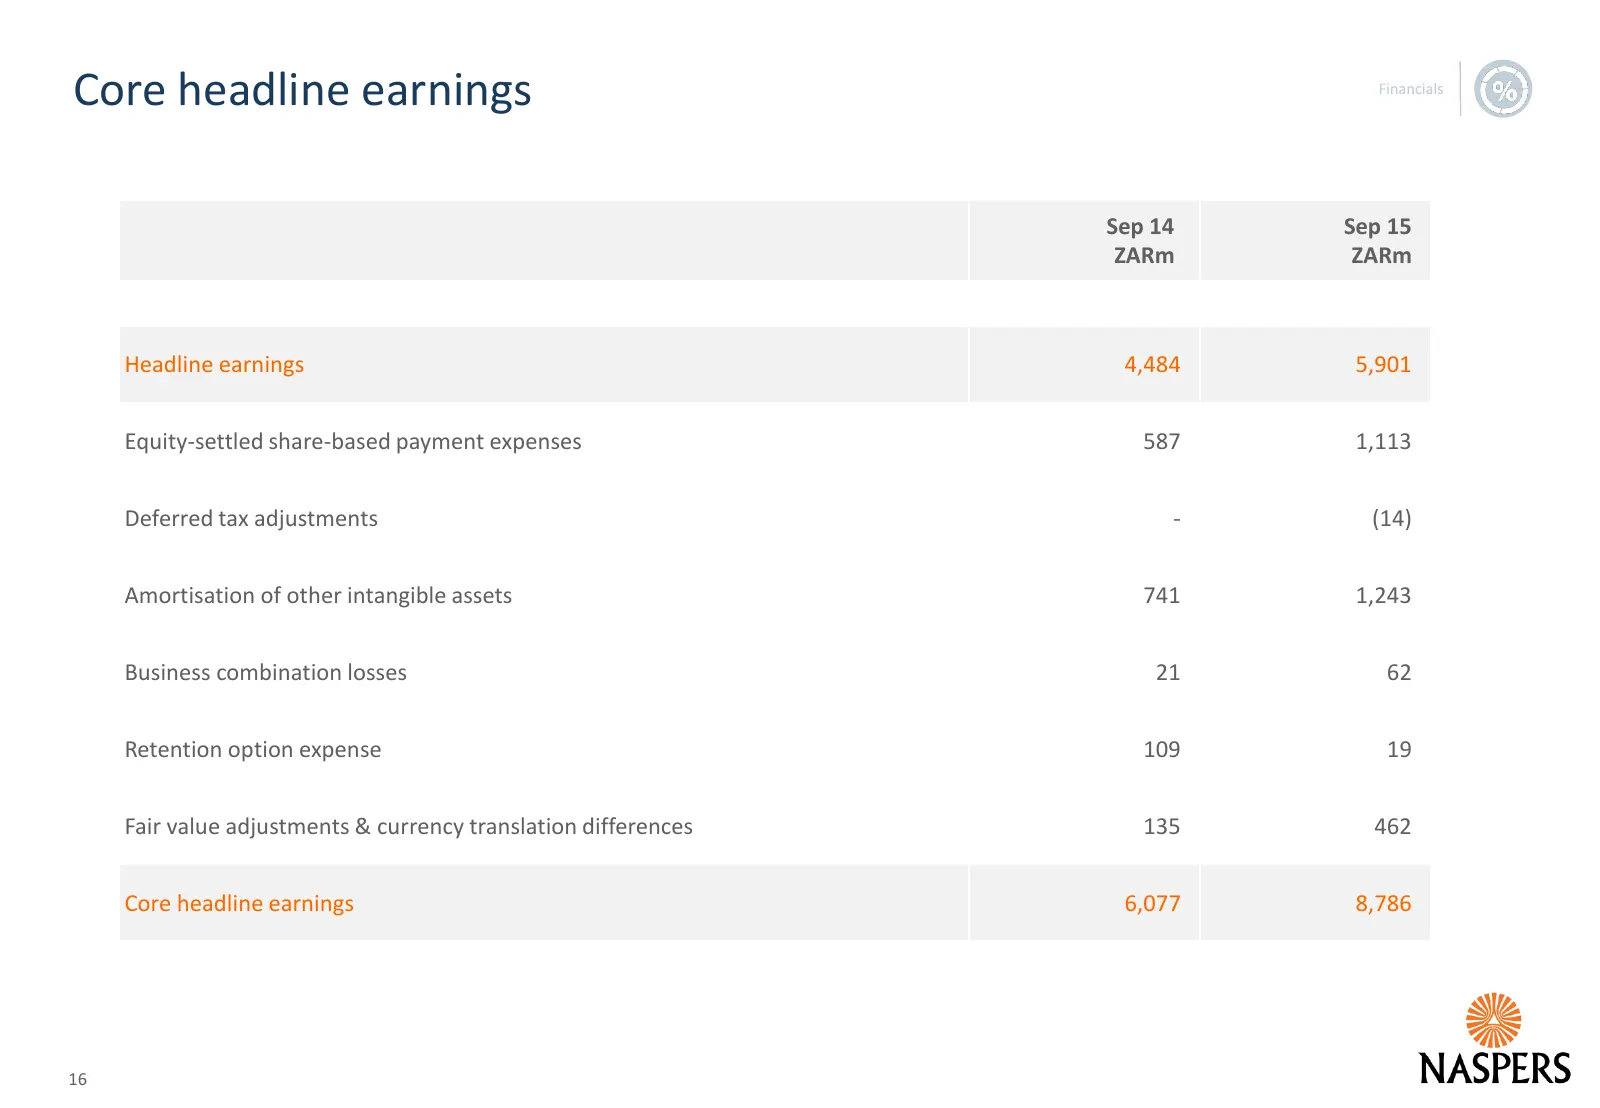
Slide 16: Core headline earnings
Core headline earnings Sep 14 Sep 15 ZARm ZARm Headline earnings 4,484 5,901 Equity-settled share-based payment expenses 587 1,113 Deferred tax adjustments - (14) Amortisation of other intangible assets 741 1,243 Business combination losses 21 62 Retention option expense 109 19 Fair value adjustment
Slide 17: Impact of currency movements
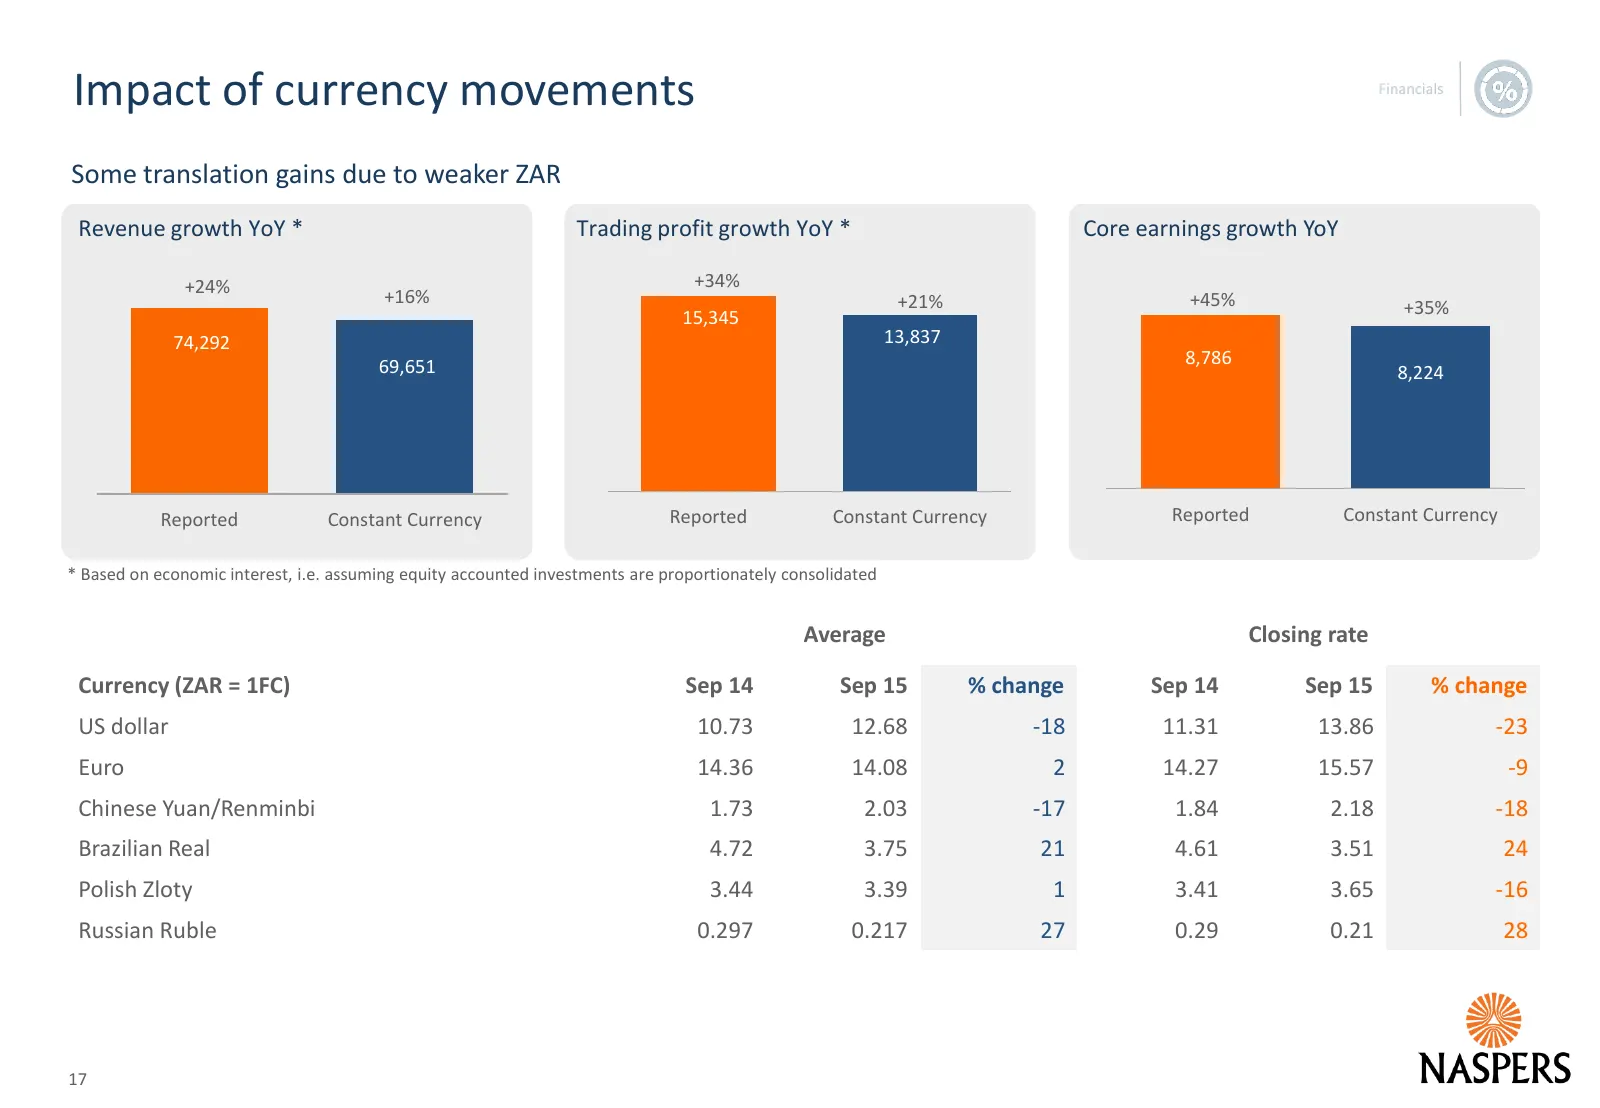
Impact of currency movements Some translation gains due to weaker ZAR Revenue growth YoY * Trading profit growth YoY * Core earnings growth YoY +24% +34% +16% +21% +45% 15,345 +35% 74,292 13,837 69,651 8,786 8,224 Reported Constant Currency Reported Constant Currency Reported Constant Currency * Bas
Slide 18: FX exposure: hedging to manage risk
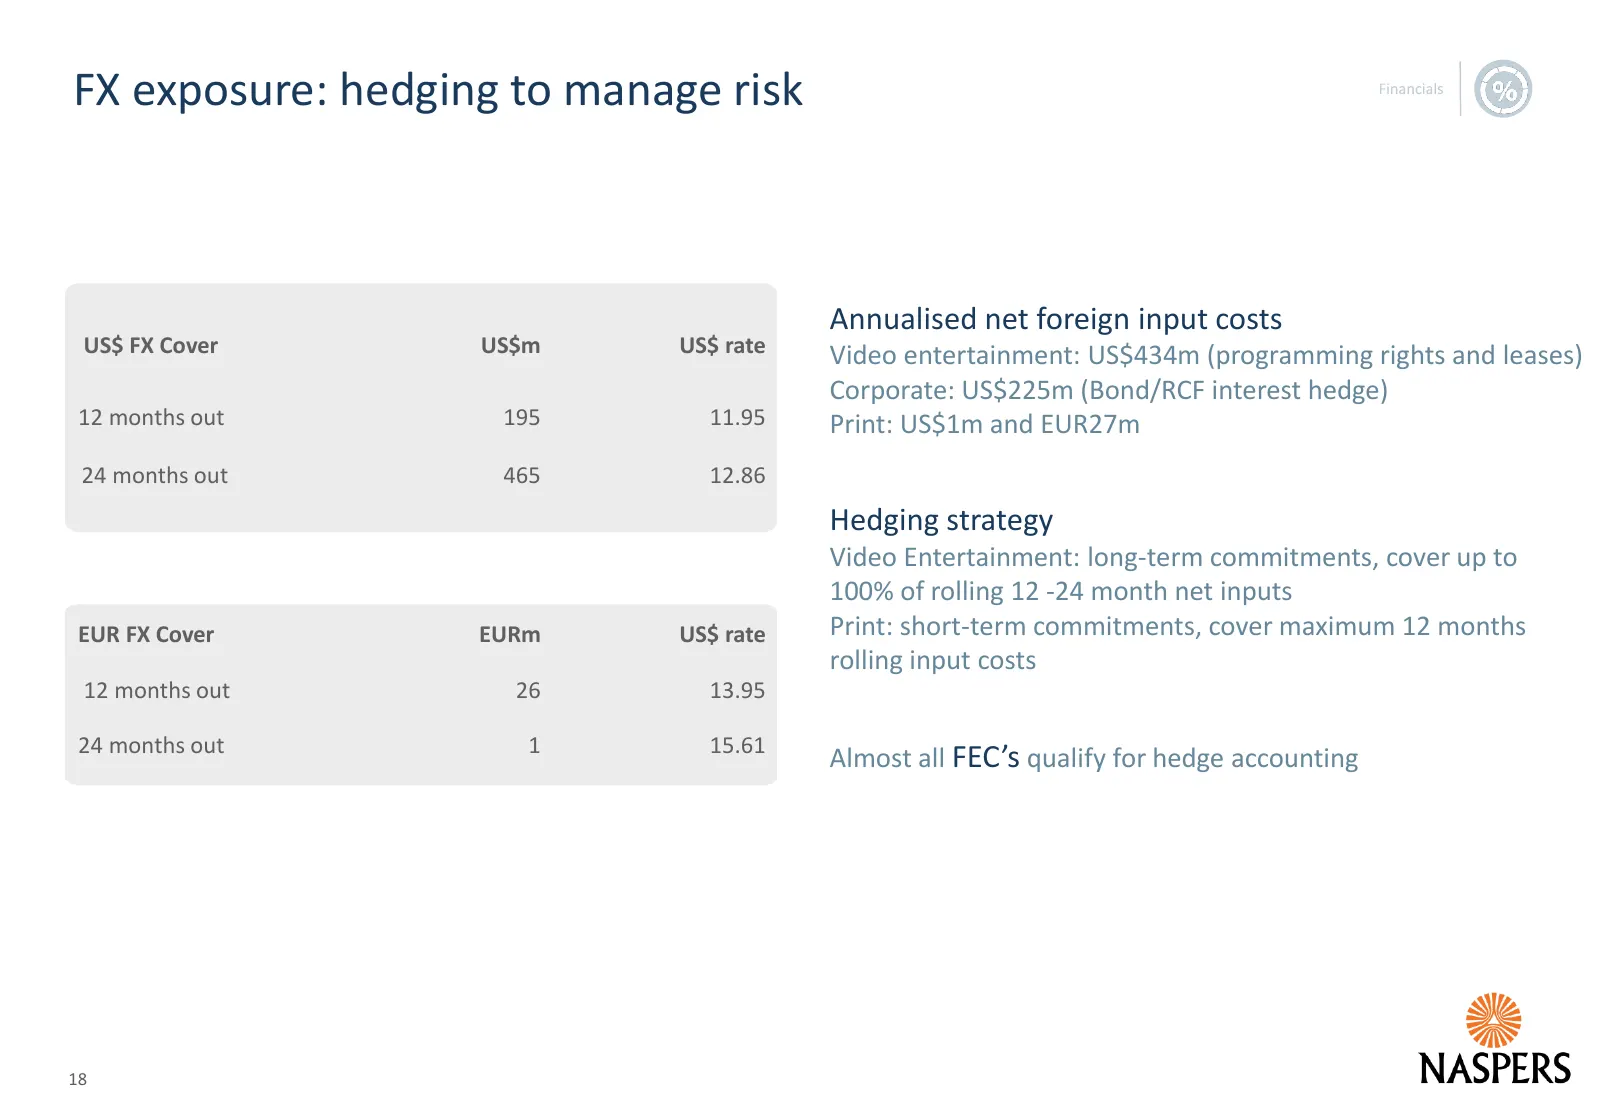
FX exposure: hedging to manage risk Annualised net foreign input costs US$ FX Cover US$m US$ rate Video entertainment: US$434m (programming rights and leases) Corporate: US$225m (Bond/RCF interest hedge) 12 months out 195 11.95 Print: US$1m and EUR27m 24 months out 465 12.86 Hedging strategy Video E
Slide 19: FCF benefits from lower capex and higher investment income
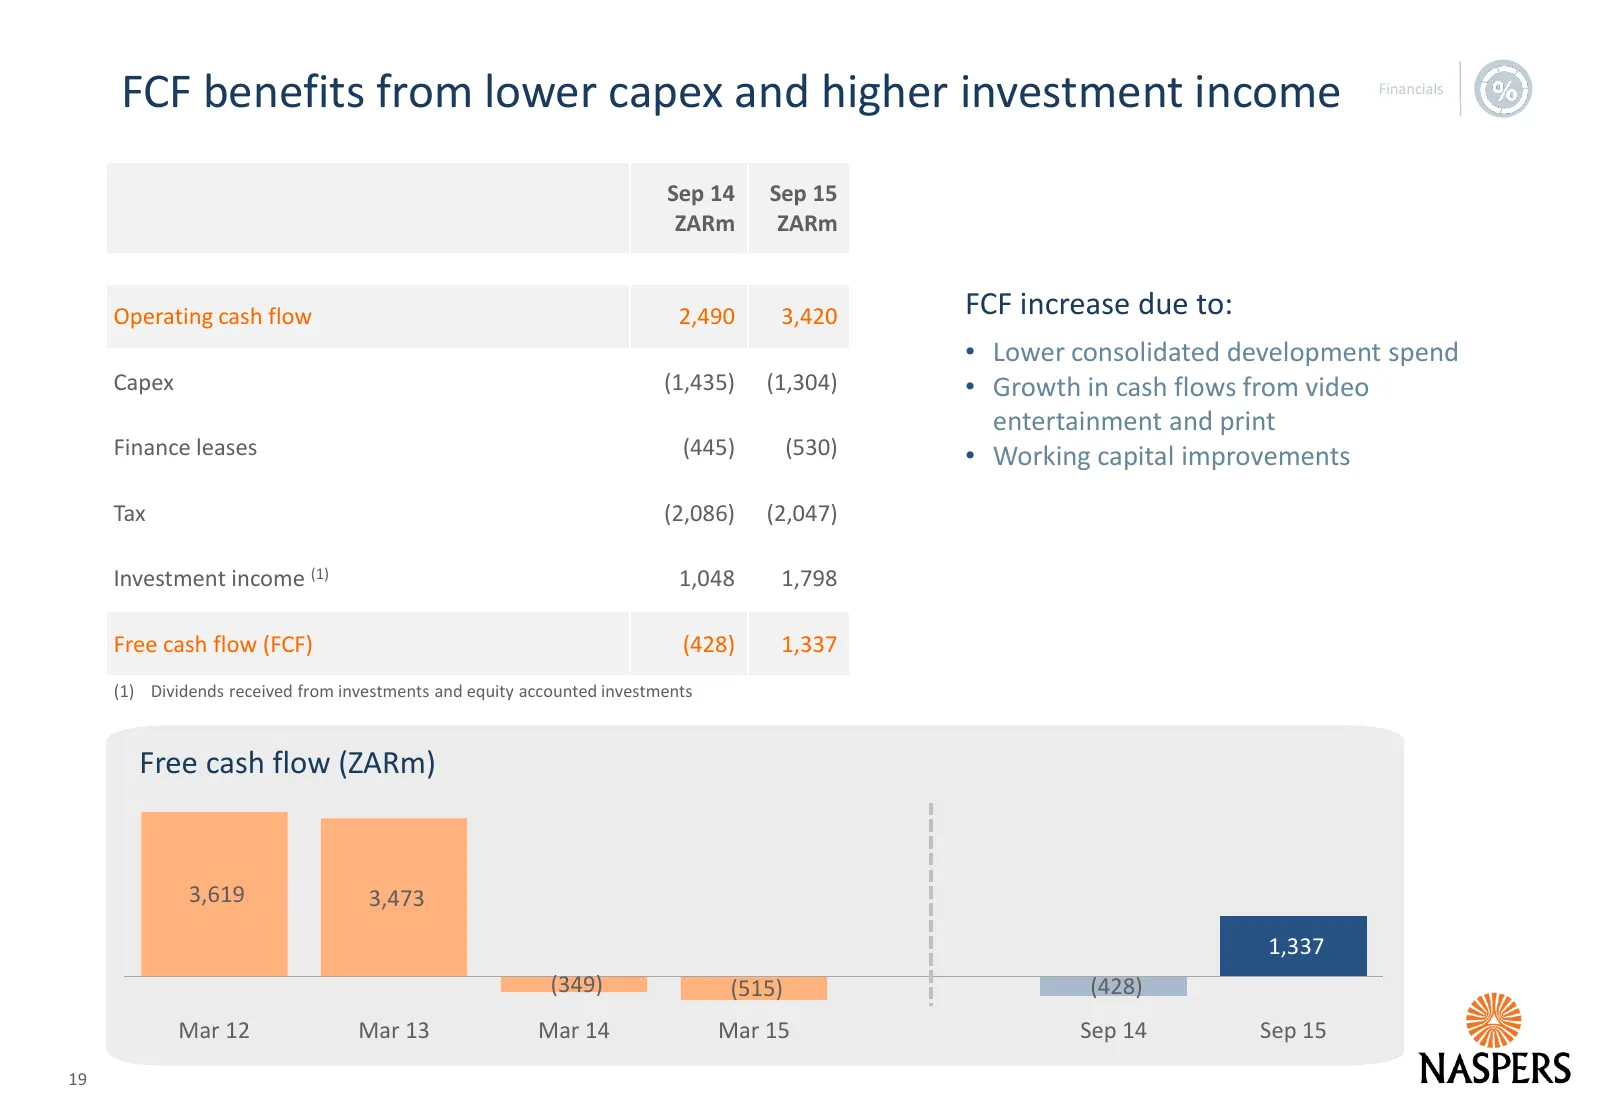
FCF benefits from lower capex and higher investment income Sep 14 Sep 15 ZARm ZARm Operating cash flow 2,490 3,420 FCF increase due to: • Lower consolidated development spend Capex (1,435) (1,304) • Growth in cash flows from video entertainment and print Finance leases (445) (530) • Working capital
Slide 20: Capital expenditure
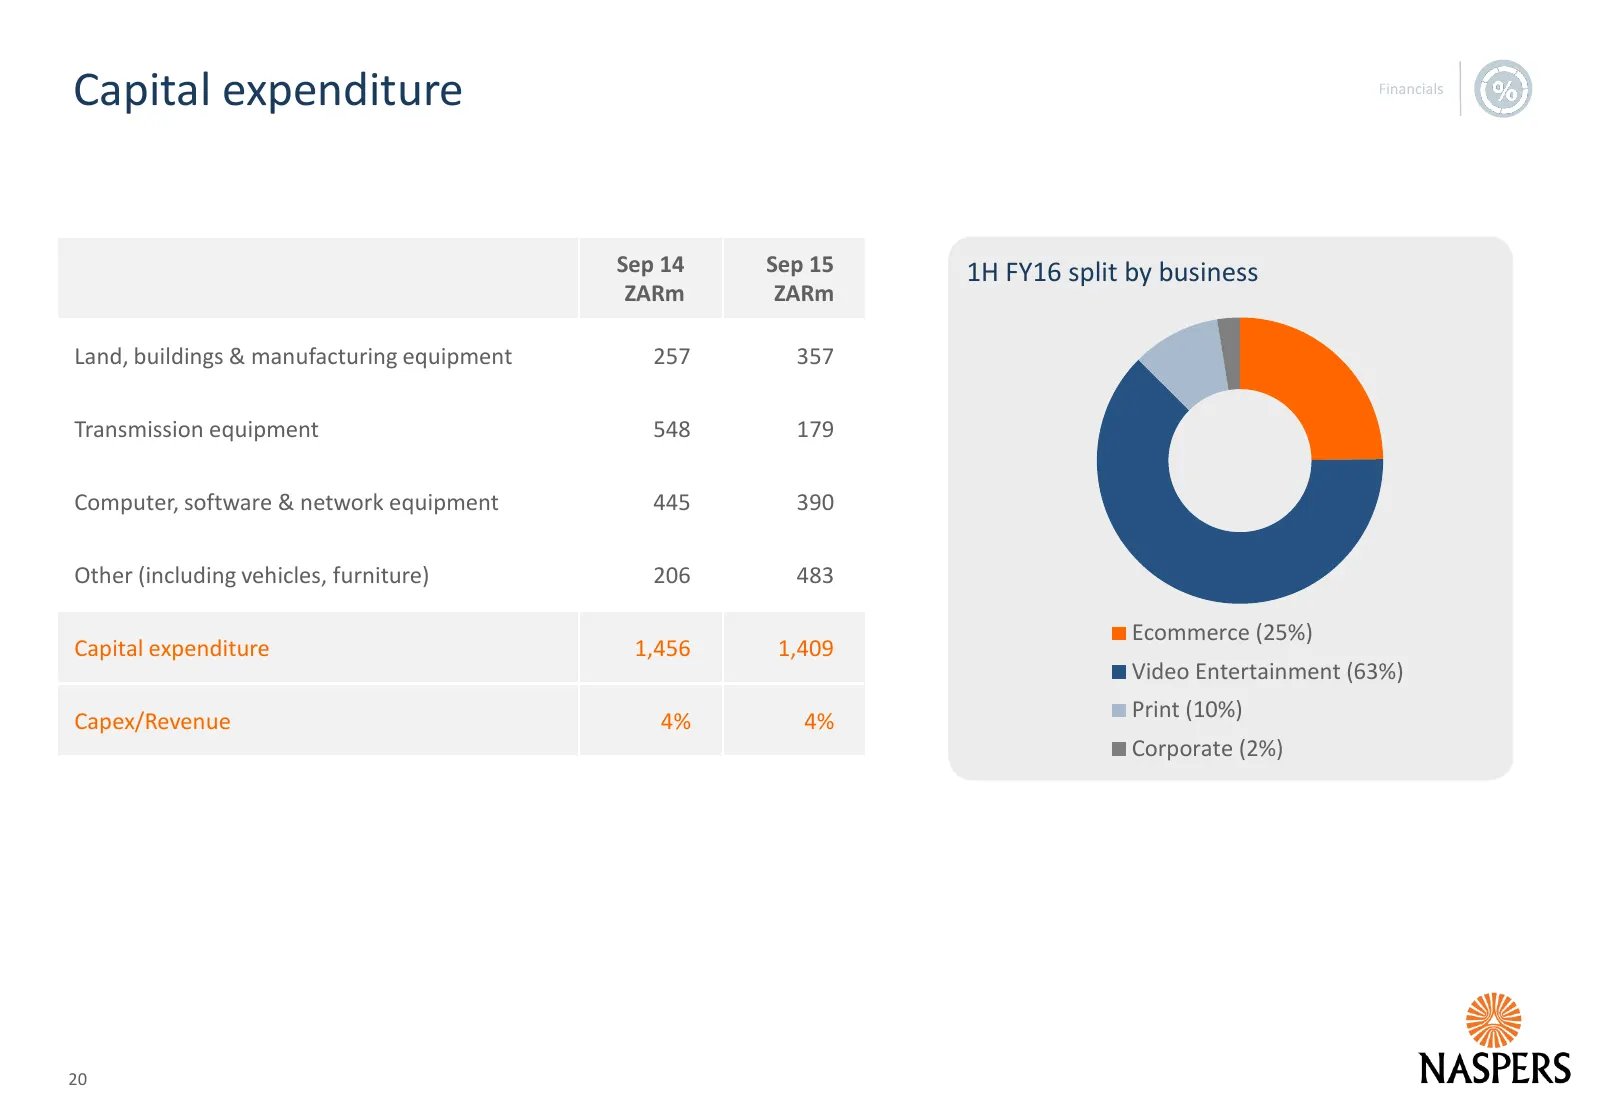
Capital expenditure Sep 14 Sep 15 1H FY16 split by business ZARm ZARm Land, buildings & manufacturing equipment 257 357 Transmission equipment 548 179 Computer, software & network equipment 445 390 Other (including vehicles, furniture) 206 483 Ecommerce (25%) Capital expenditure 1,456 1,409 Video En
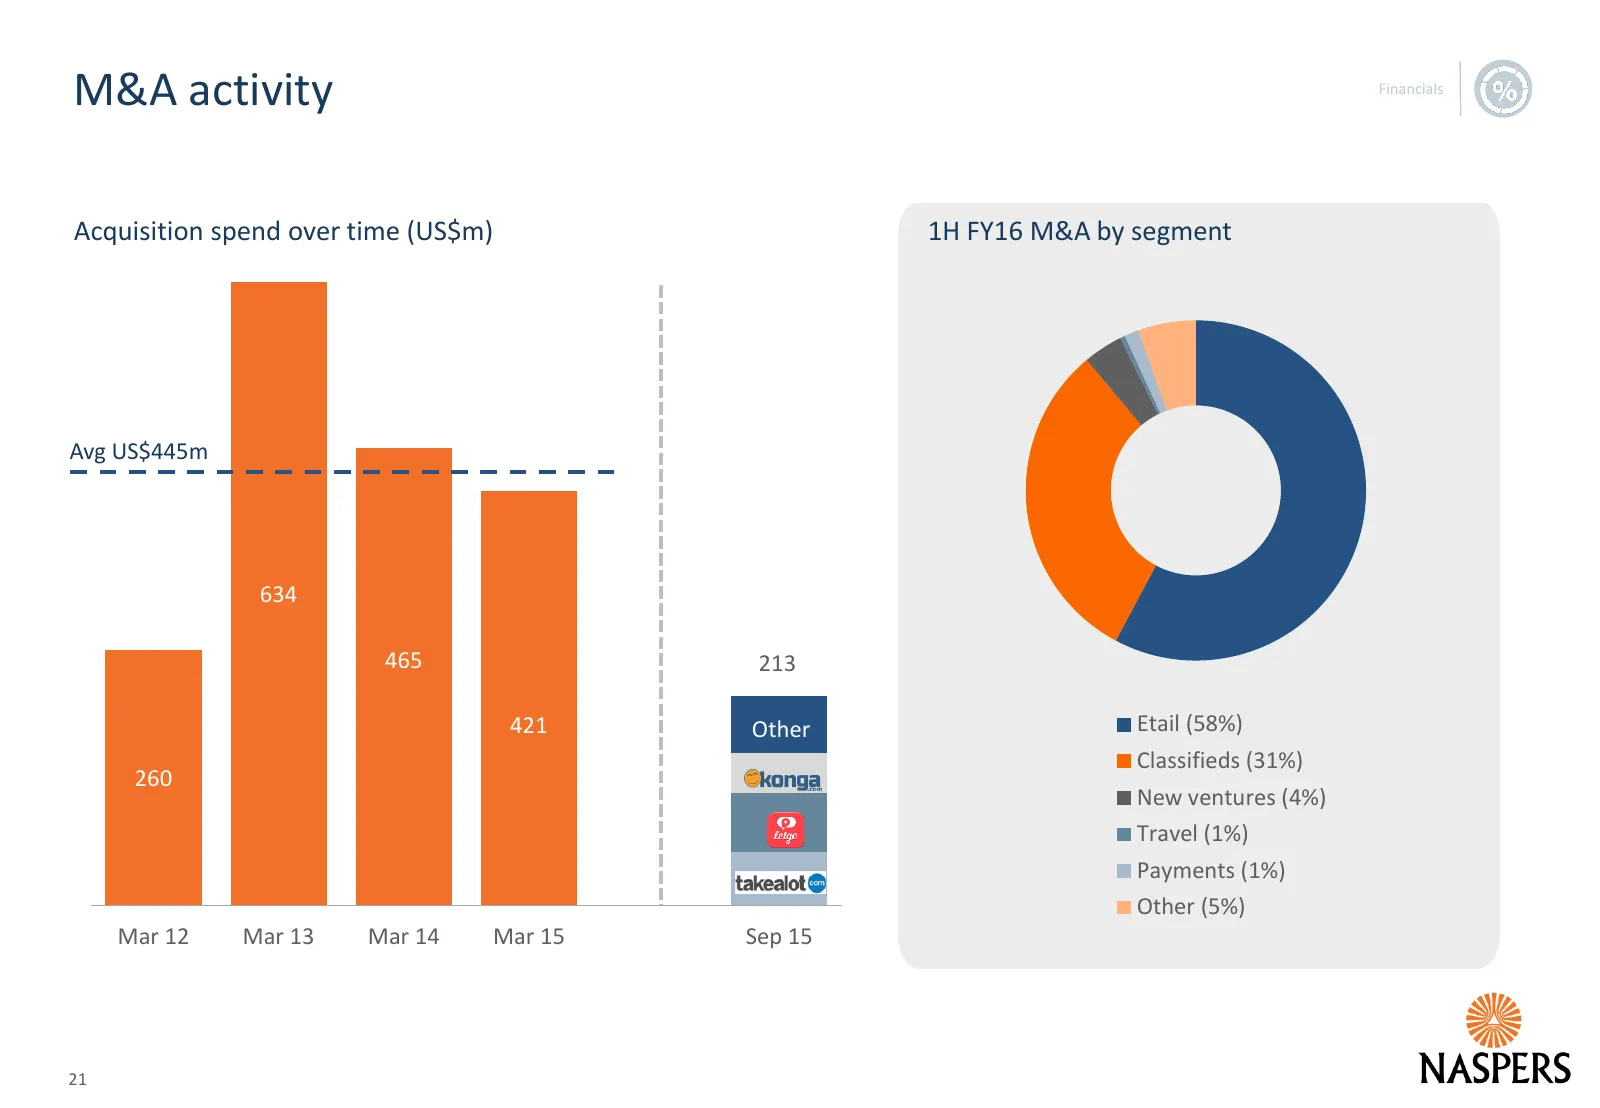
Slide 21: M&A activity
M&A activity Acquisition spend over time (US$m) 1H FY16 M&A by segment Avg US$445m 634 465 213 421 Other Etail (58%) Classifieds (31%) 260 New ventures (4%) Travel (1%) Payments (1%) Other Other (5%) Mar 12 Mar 13 Mar 14 Mar 15 Sep 15 21
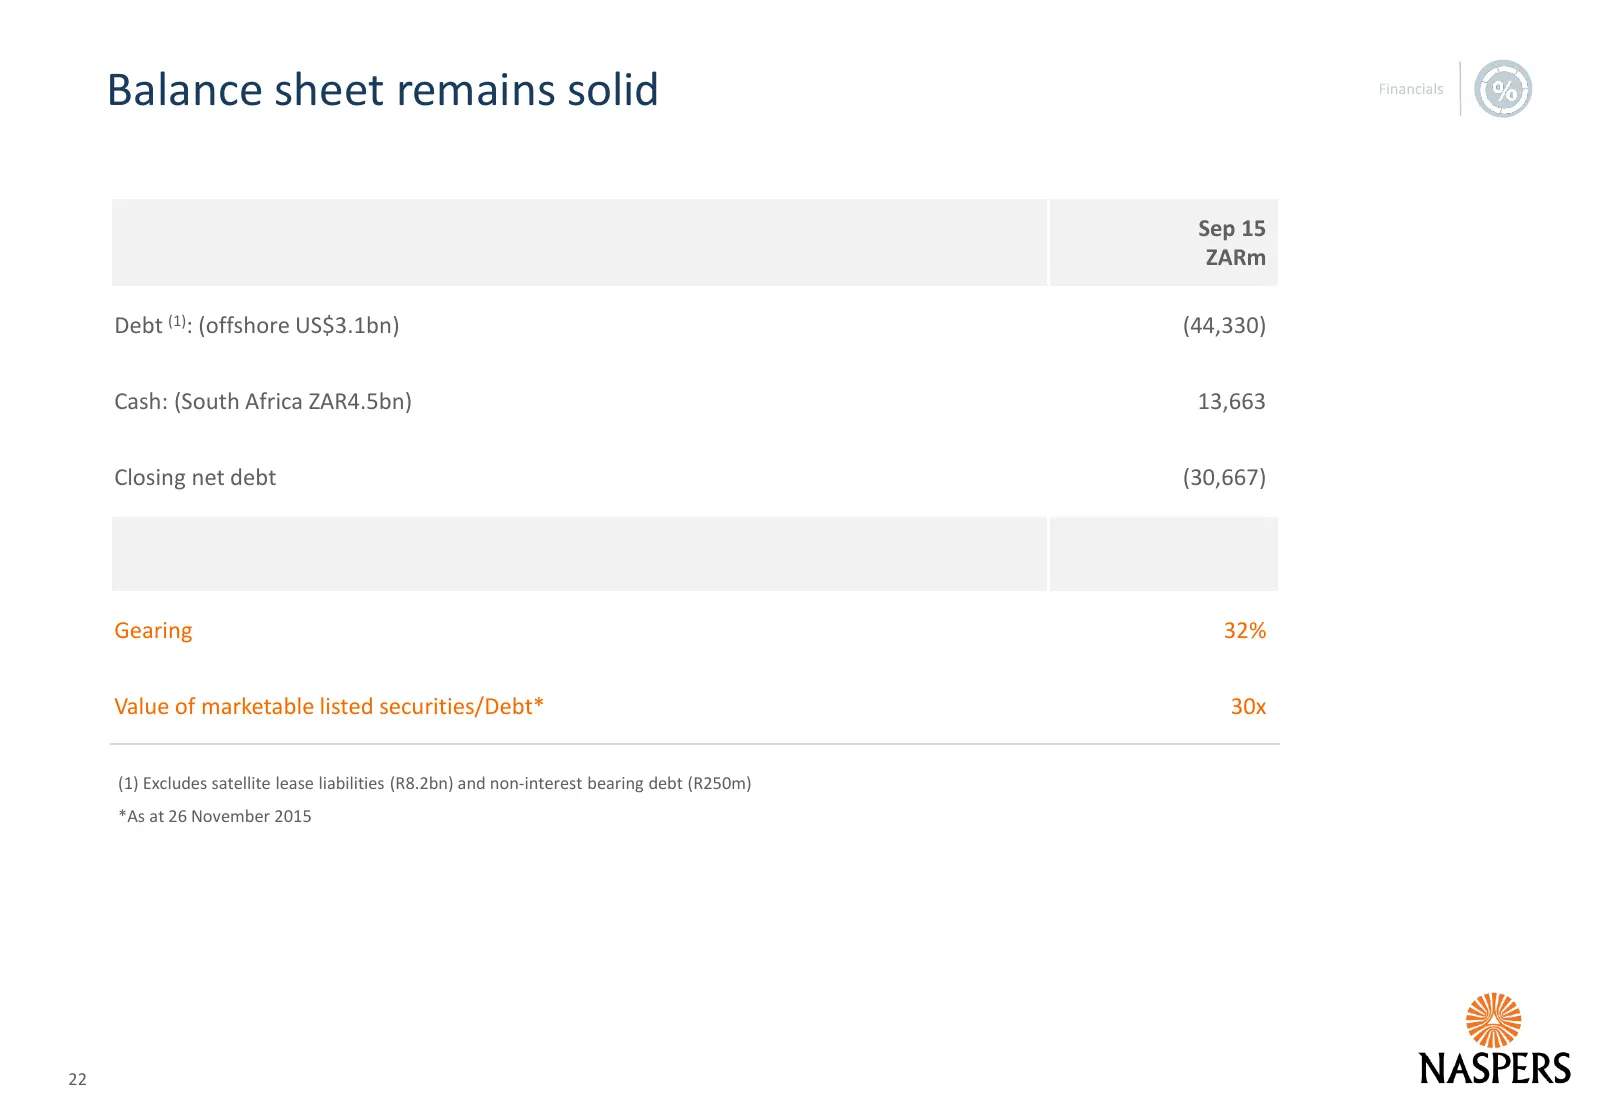
Slide 22: Balance sheet remains solid
Balance sheet remains solid Sep 15 ZARm Debt (1): (offshore US$3.1bn) (44,330) Cash: (South Africa ZAR4.5bn) 13,663 Closing net debt (30,667) Gearing 32% Value of marketable listed securities/Debt* 30x (1) Excludes satellite lease liabilities (R8.2bn) and non-interest bearing debt (R250m) *As at 26
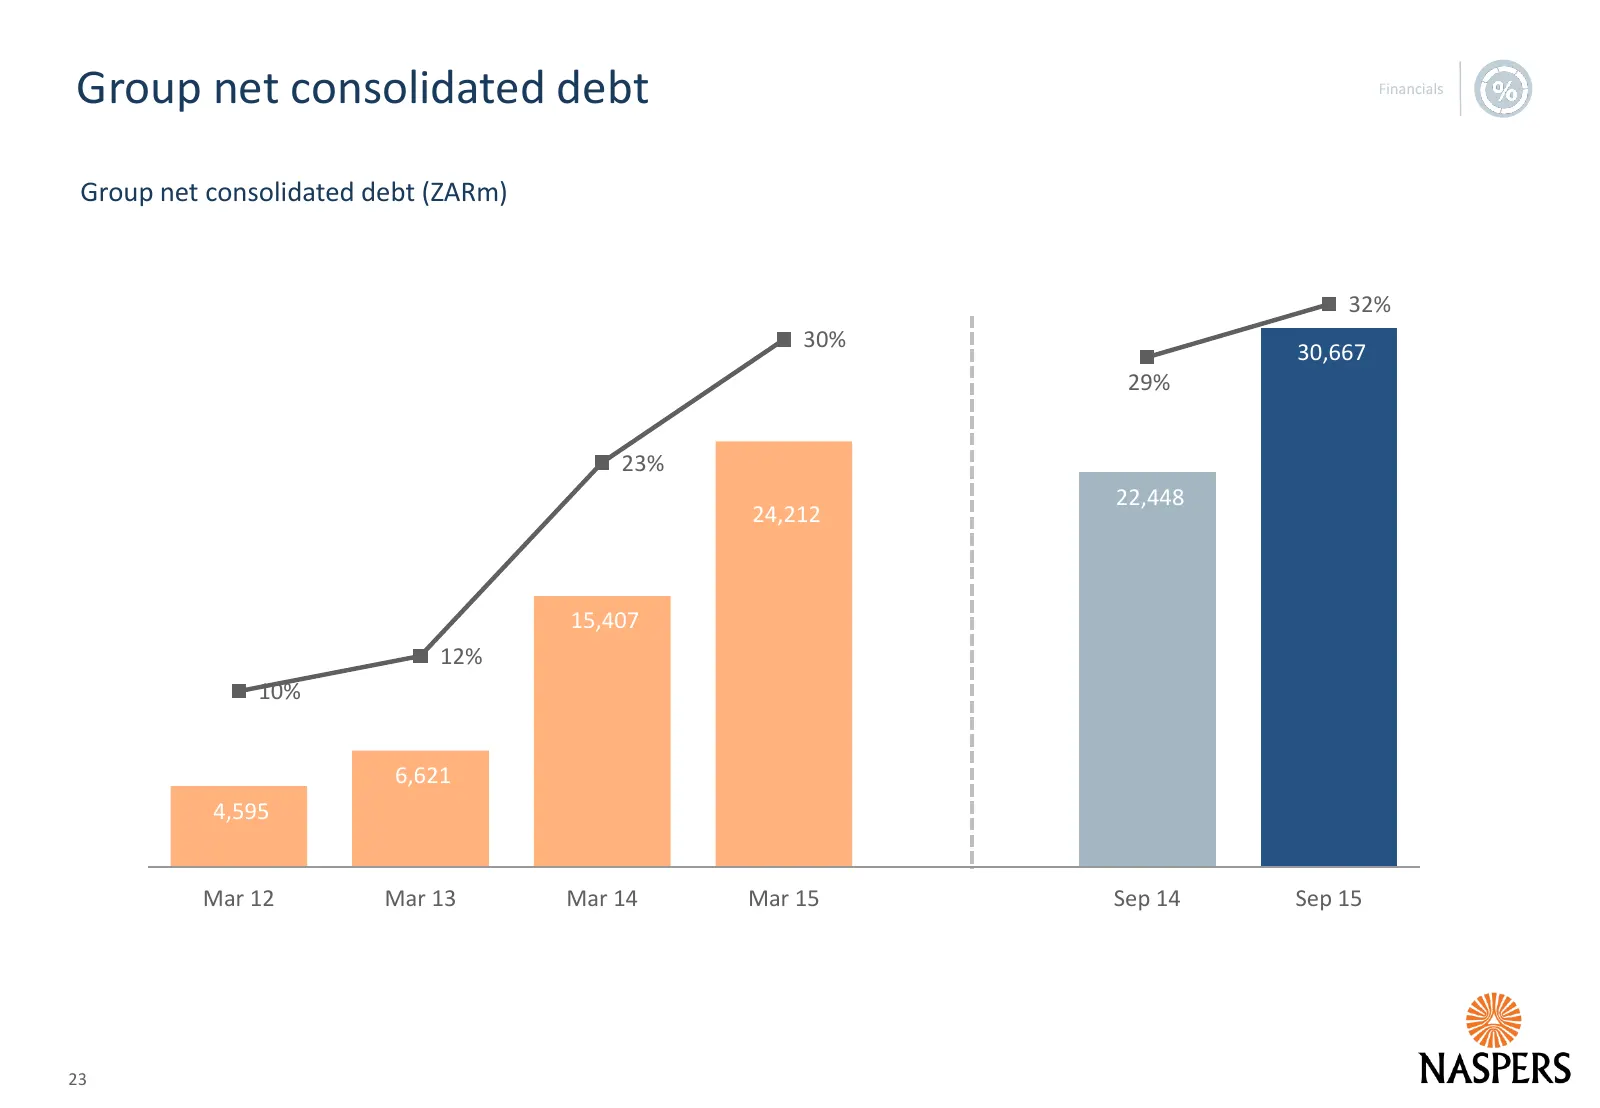
Slide 23: Group net consolidated debt
Group net consolidated debt Group net consolidated debt (ZARm) 35% 32% 30% 30% 30,667 29% 25,000 25% 23% 22,448 24,212 20% 15% 15,407 12% 10% 10% 6,621 5% 4,595 - 0% Mar 12 Mar 13 Mar 14 Mar 15 Sep 14 Sep 15 23
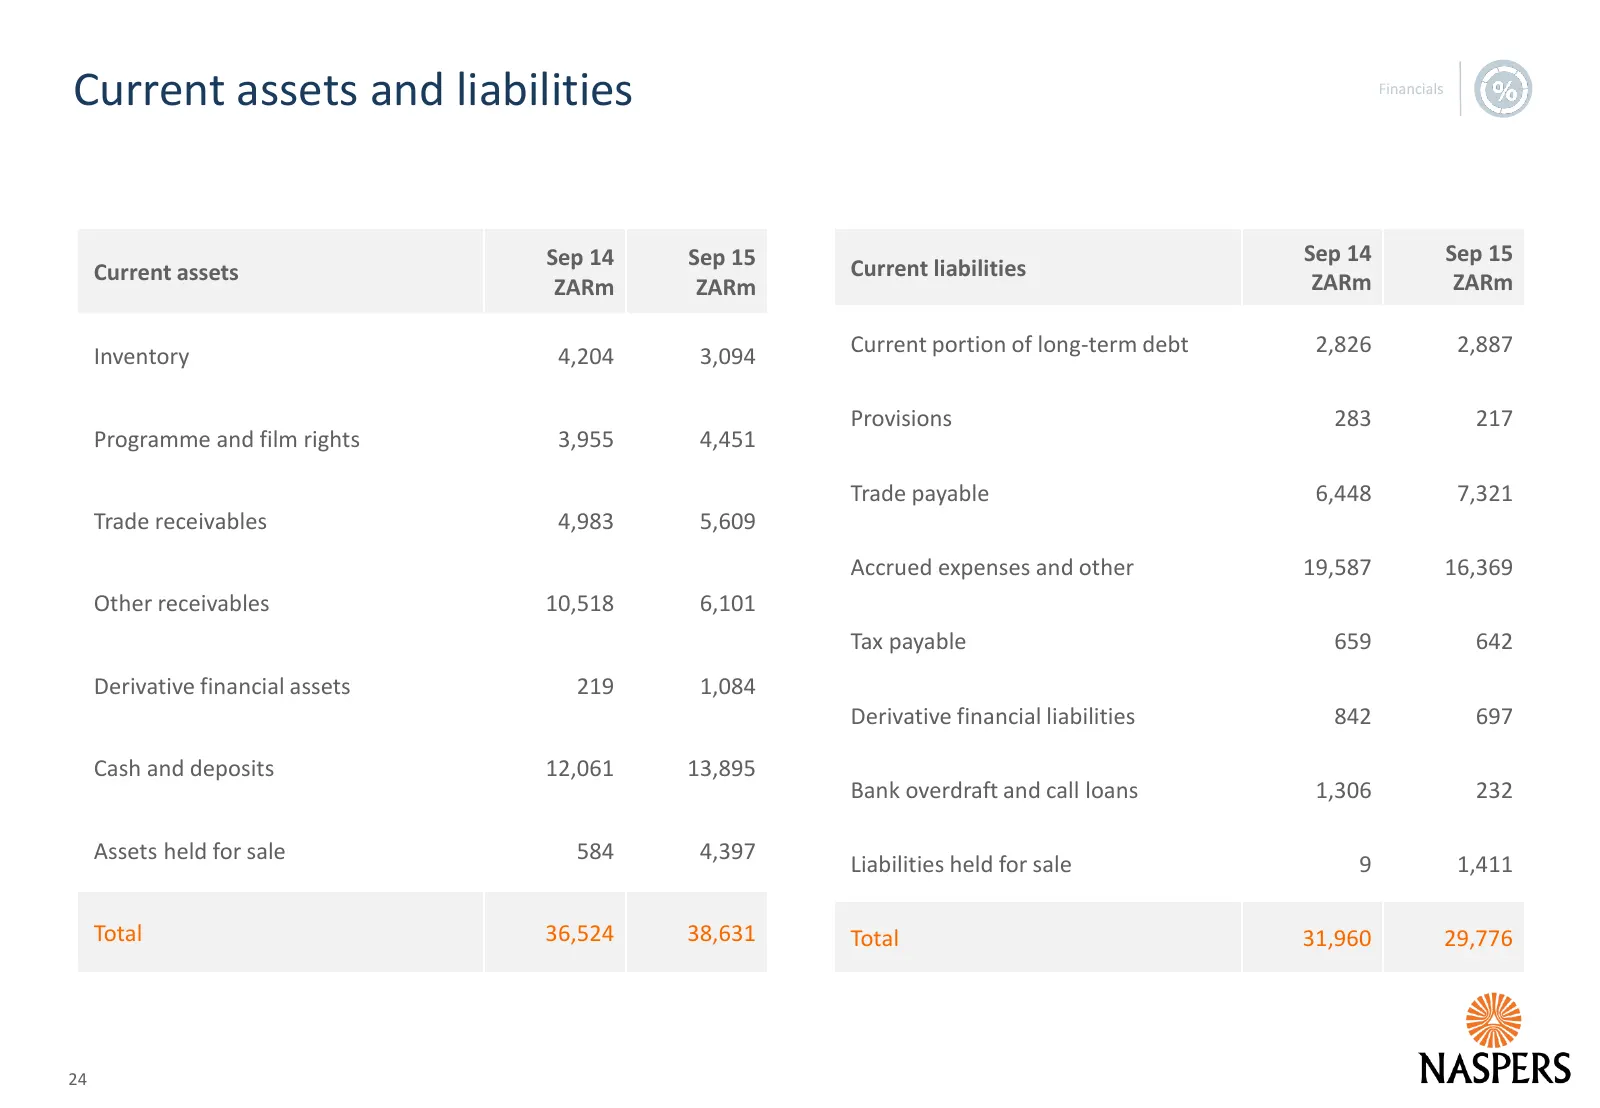
Slide 24: Current assets and liabilities
Current assets and liabilities Sep 14 Sep 15 Sep 14 Sep 15 Current assets Current liabilities ZARm ZARm ZARm ZARm Inventory 4,204 3,094 Current portion of long-term debt 2,826 2,887 Provisions 283 217 Programme and film rights 3,955 4,451 Trade payable 6,448 7,321 Trade receivables 4,983 5,609 Accru
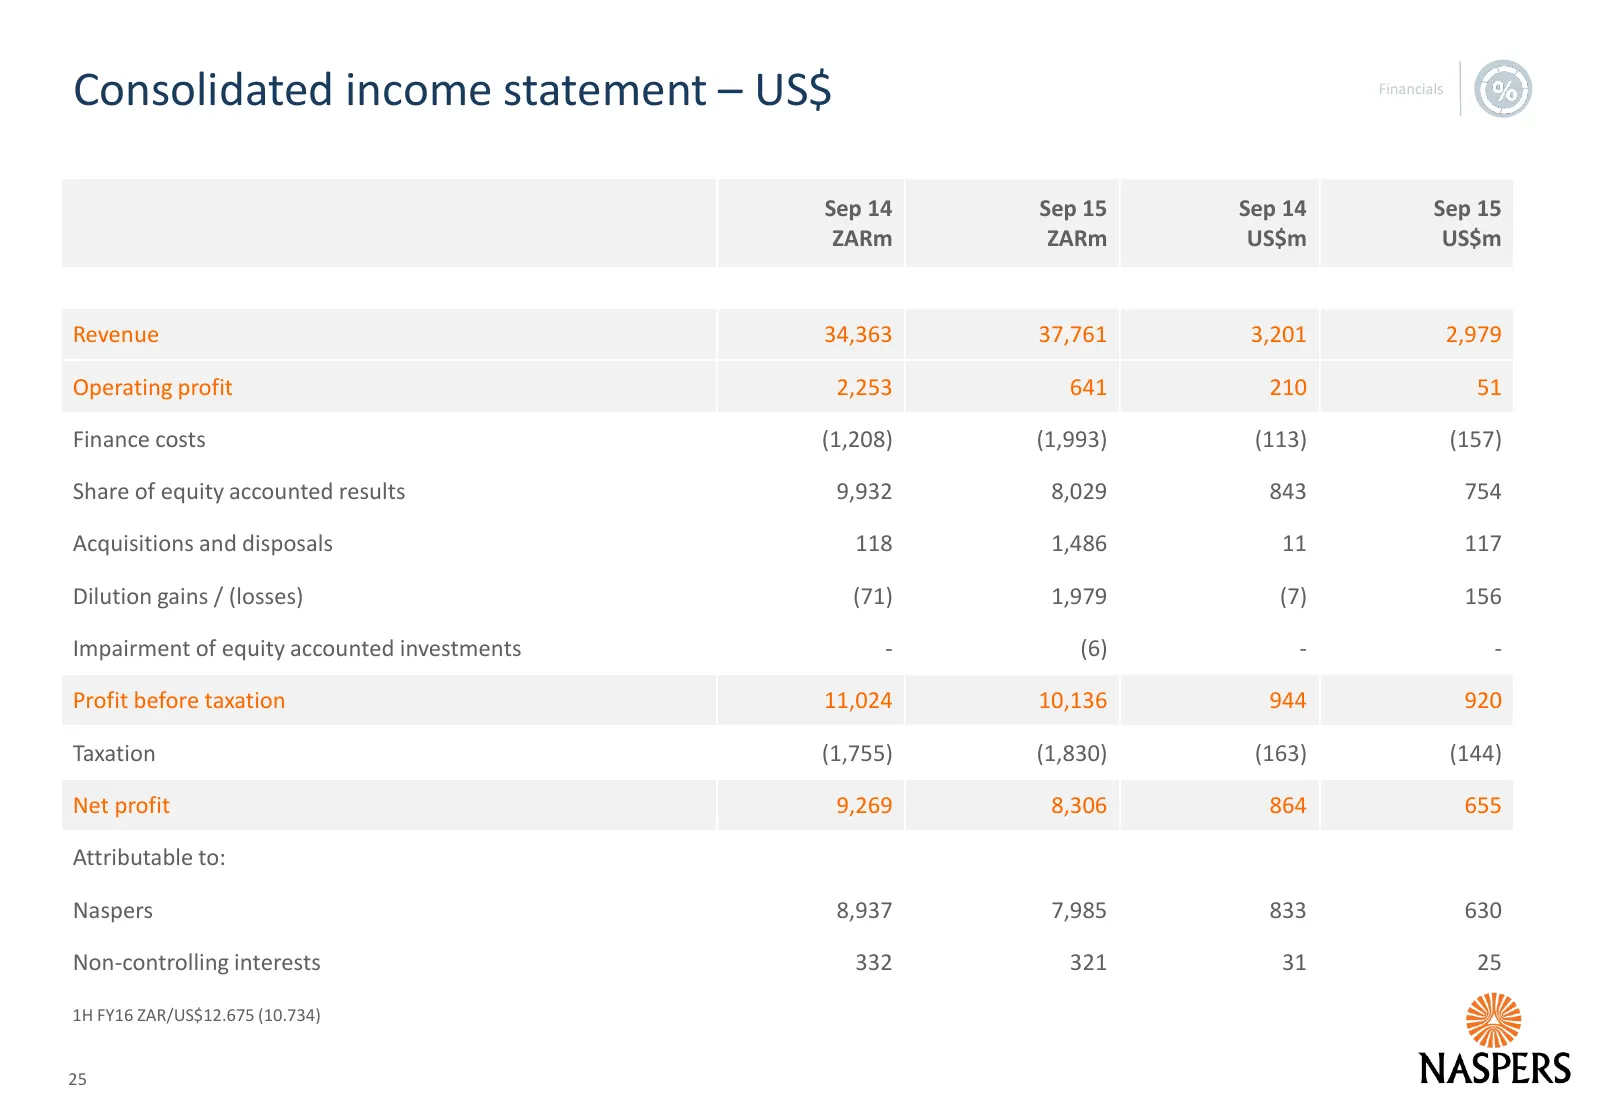
Slide 25: Consolidated income statement – US$
Consolidated income statement – US$ Sep 14 Sep 15 Sep 14 Sep 15 ZARm ZARm US$m US$m Revenue 34,363 37,761 3,201 2,979 Operating profit 2,253 641 210 51 Finance costs (1,208) (1,993) (113) (157) Share of equity accounted results 9,932 8,029 843 754 Acquisitions and disposals 118 1,486 11 117 Dilution
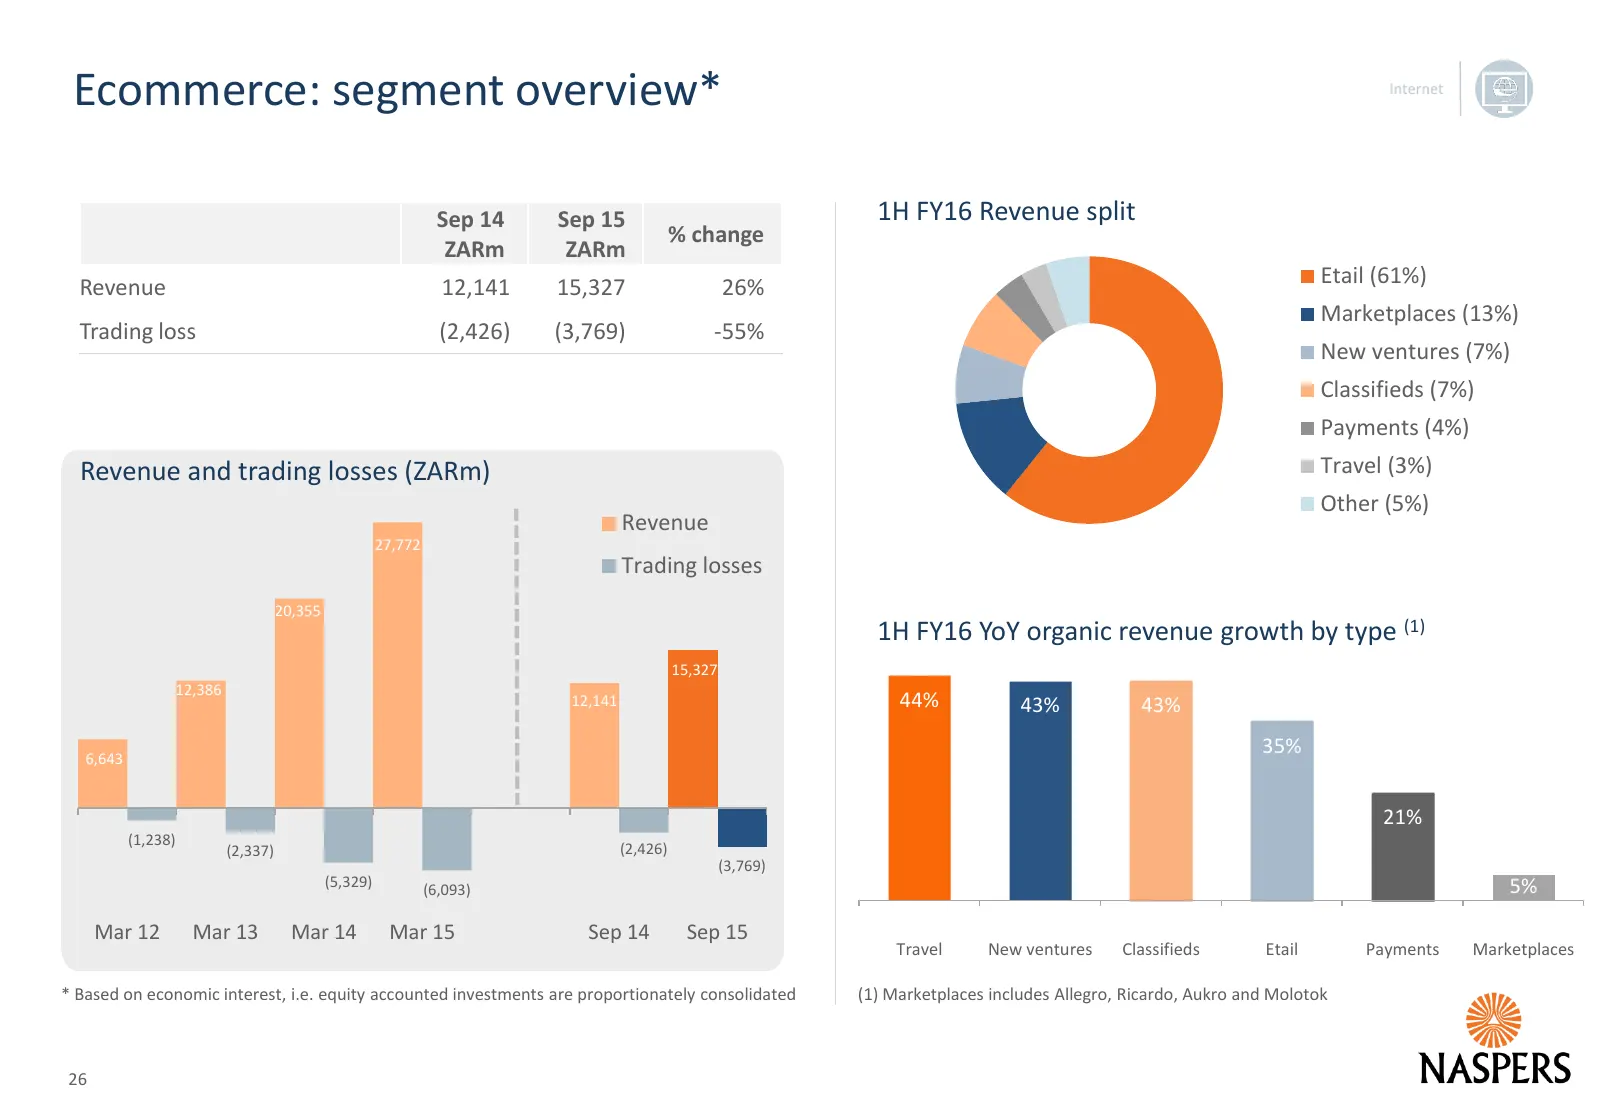
Slide 26: Ecommerce: segment overview
Ecommerce: segment overview* Sep 14 Sep 15 1H FY16 Revenue split % change ZARm ZARm Revenue 12,141 15,327 26% Etail (61%) Marketplaces (13%) Trading loss (2,426) (3,769) -55% New ventures (7%) Classifieds (7%) Payments (4%) Revenue and trading losses (ZARm) Travel (3%) Other (5%) Revenue 27,772 Trad
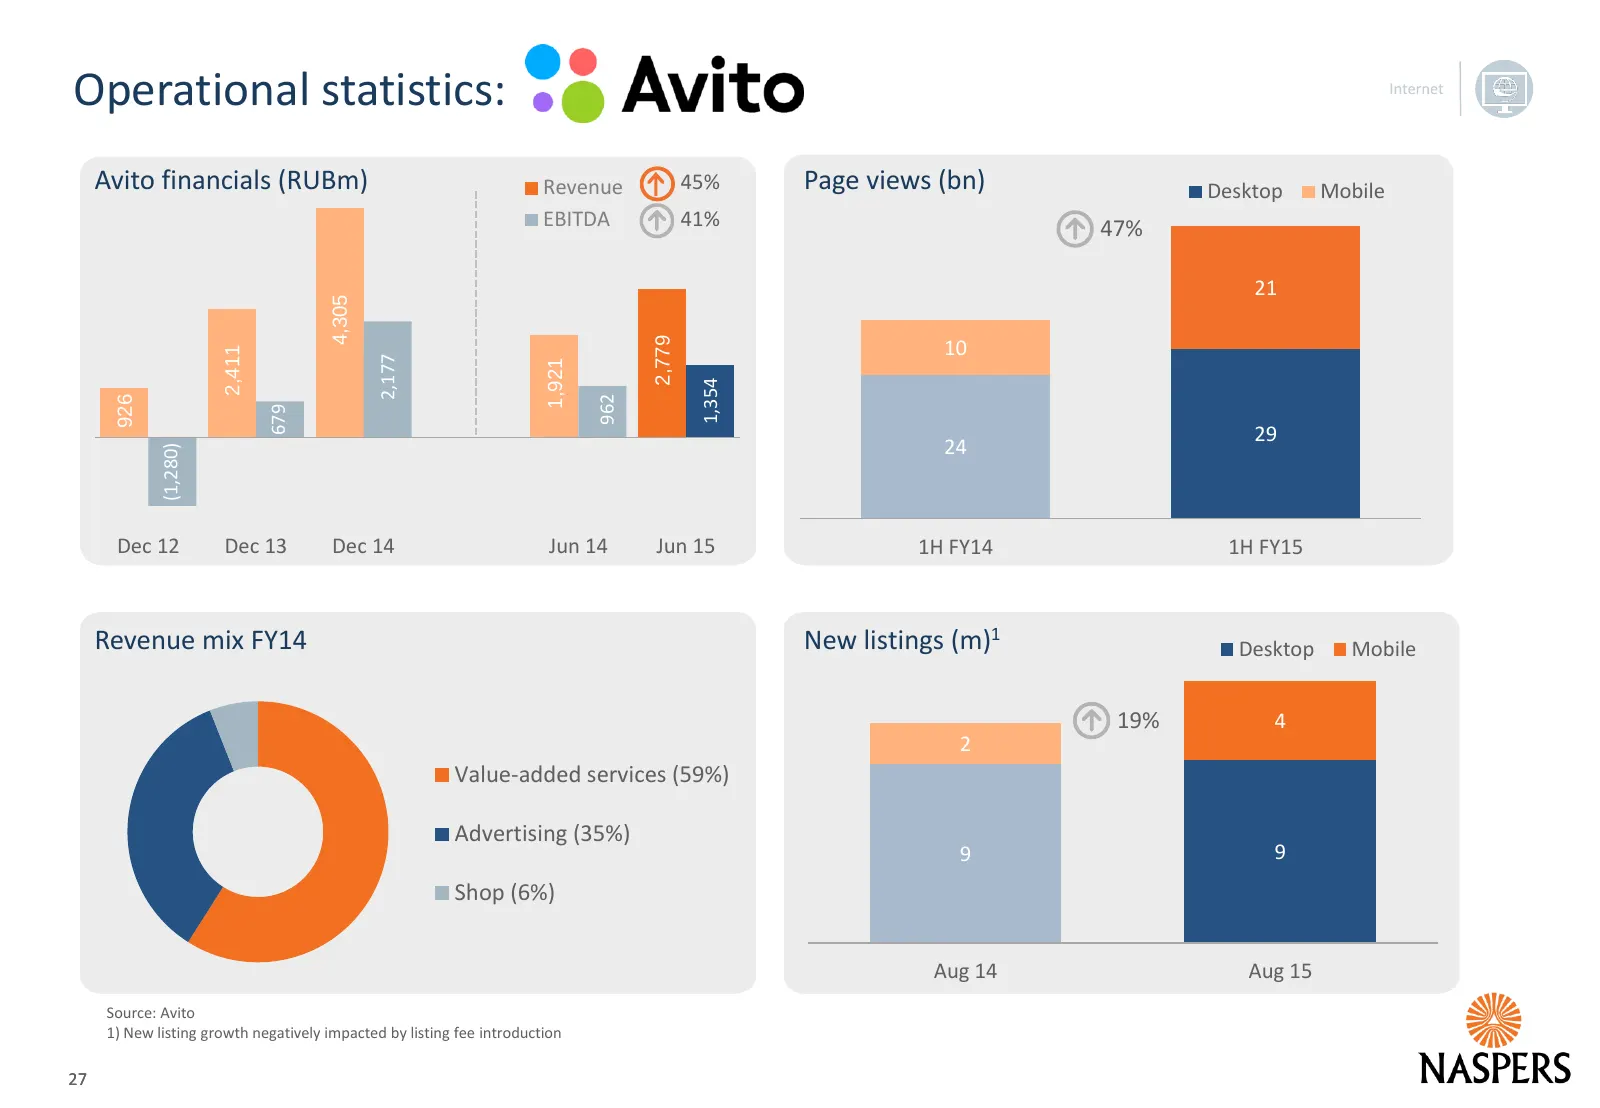
Slide 27: Operational statistics: Avito
Operational statistics: Avito financials (RUBm) Revenue 45% Page views (bn) Desktop Mobile EBITDA 41% 47% 21 4,305 2,779 10 2,411 2,177 1,921 1,354 962 926 679 29 24 (1,280) Dec 12 Dec 13 Dec 14 Jun 14 Jun 15 1H FY14 1H FY15 Revenue mix FY14 New listings (m)1 Desktop Mobile 19% 4 2 Value-added servi
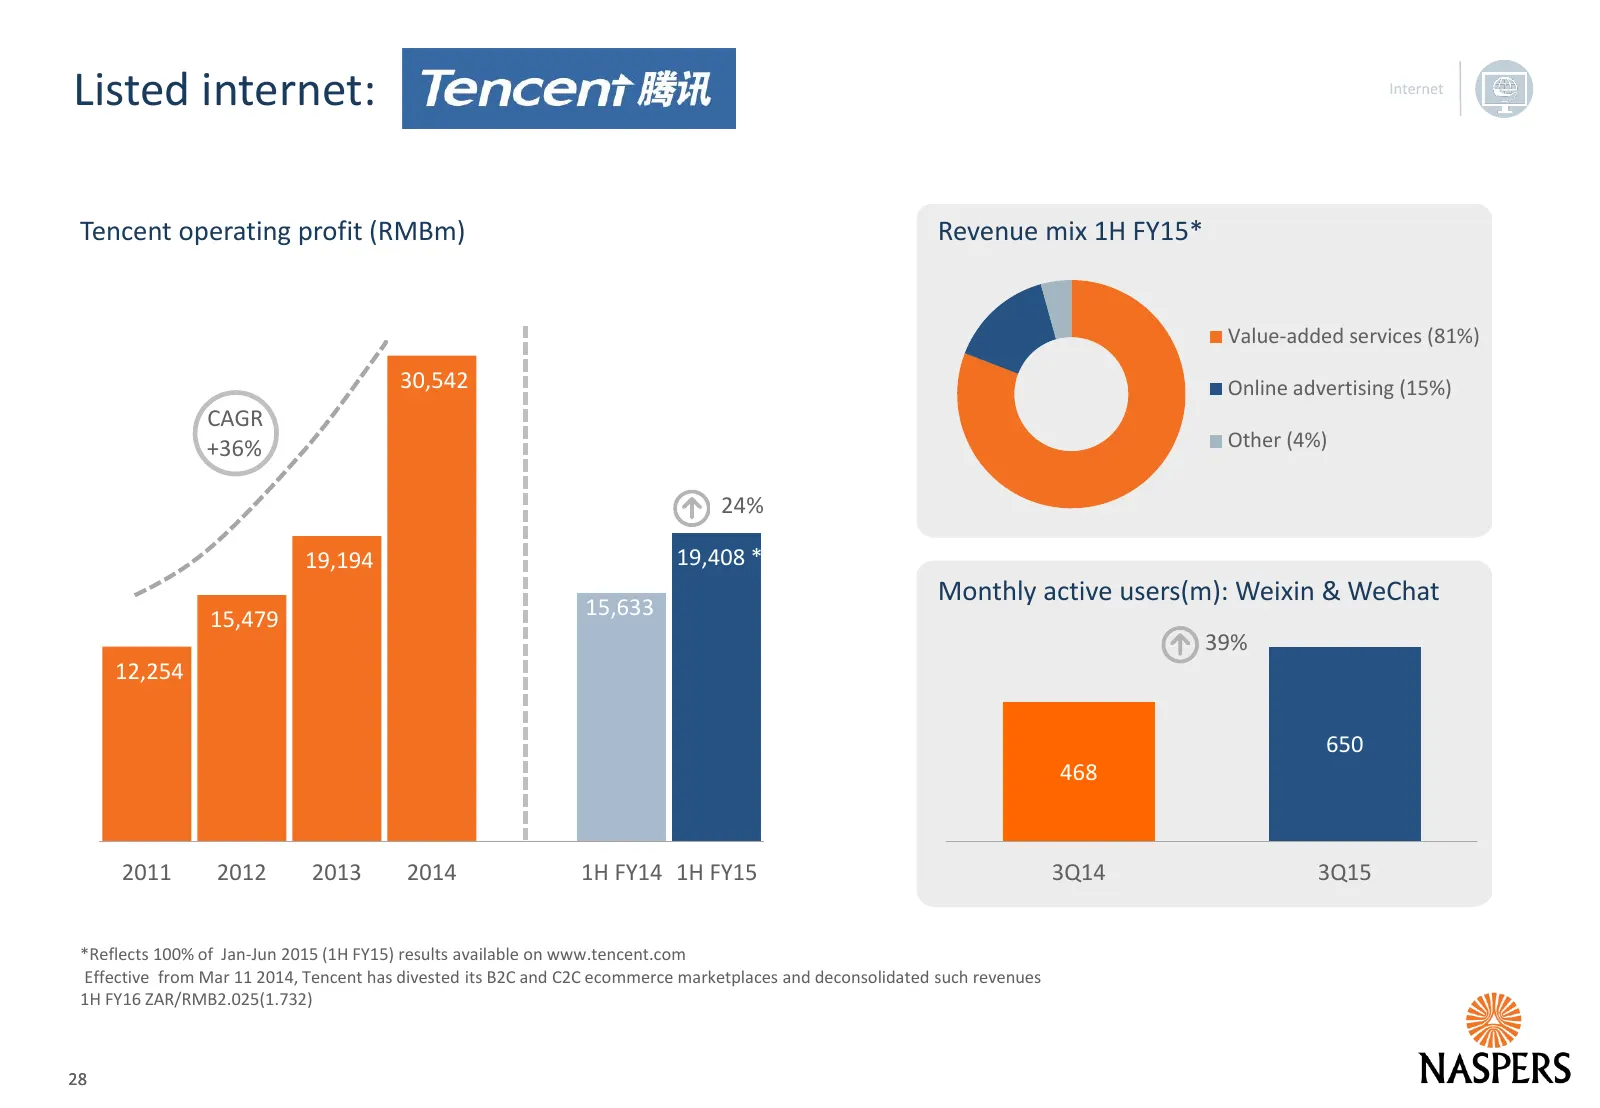
Slide 28: Listed internet: Tencent
Listed internet: Tencent operating profit (RMBm) Revenue mix 1H FY15* Value-added services (81%) 30,542 Online advertising (15%) CAGR +36% Other (4%) 24% 19,194 19,408 * Monthly active users(m): Weixin & WeChat 15,633 15,479 39% 12,254 650 468 2011 2012 2013 2014 1H FY14 1H FY15 3Q14 3Q15 *Reflects
Slide 29: Listed internet: Mail.ru
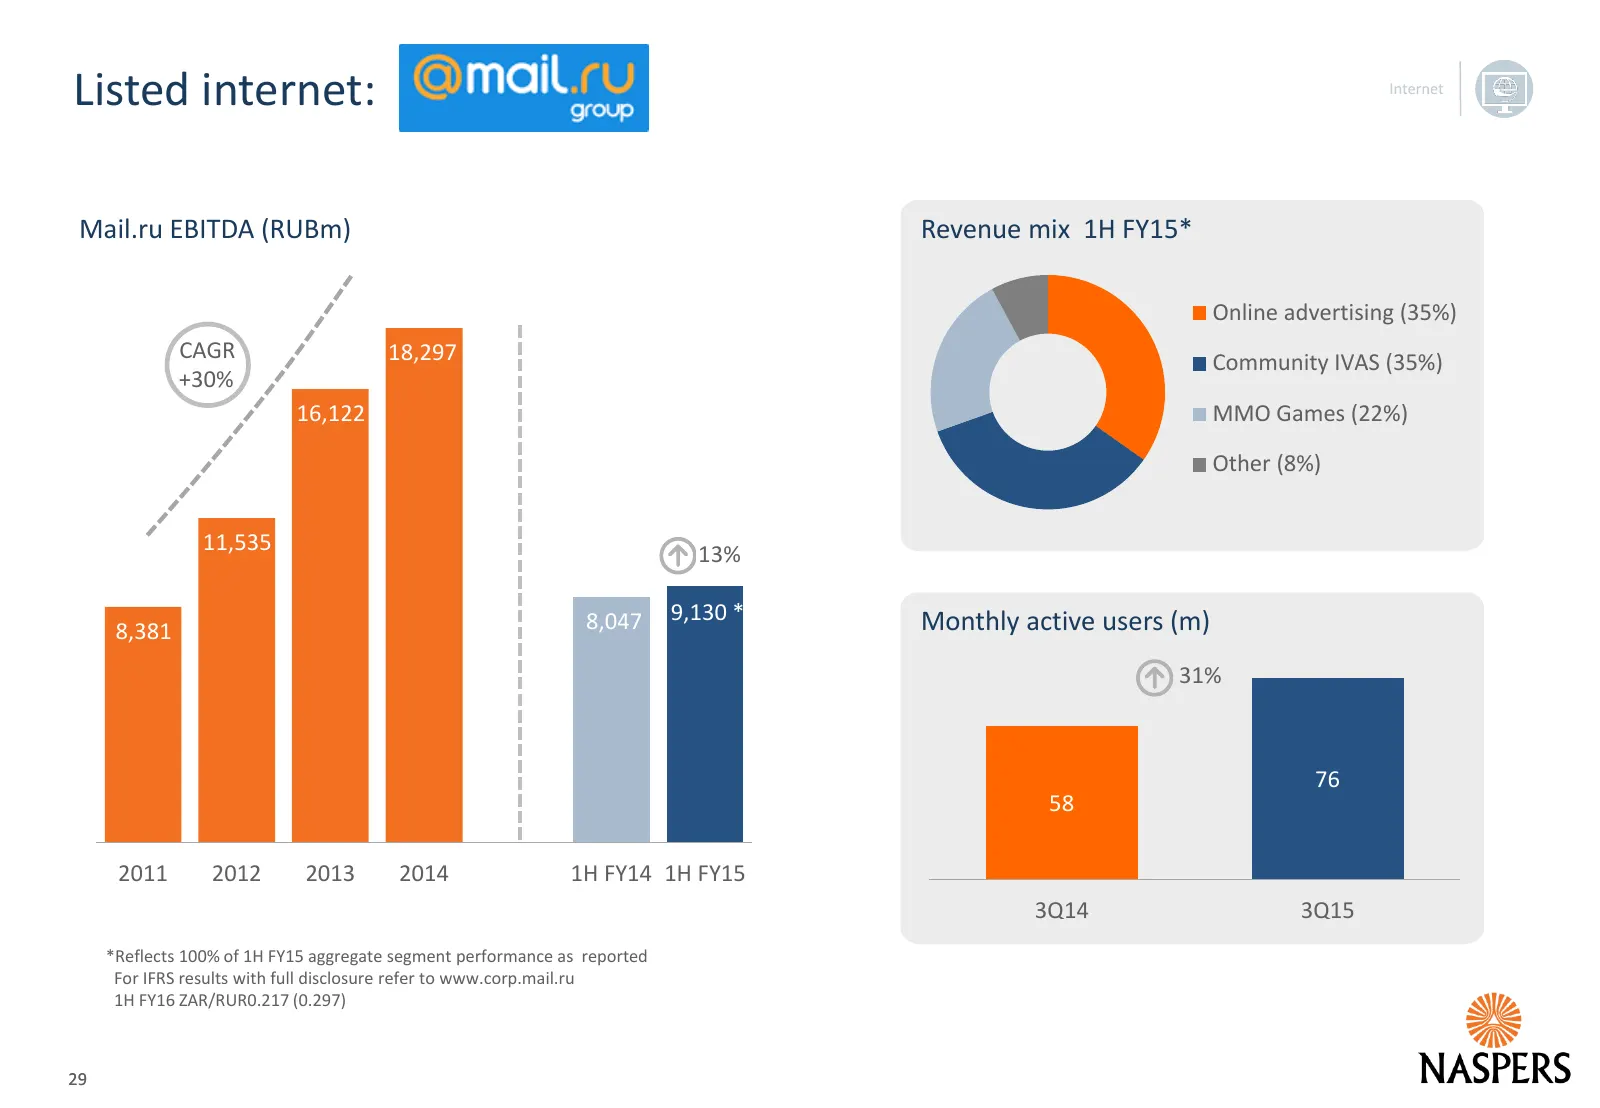
Listed internet: Mail.ru EBITDA (RUBm) Revenue mix 1H FY15* Online advertising (35%) CAGR 18,297 Community IVAS (35%) +30% 16,122 MMO Games (22%) Other (8%) 11,535 13% 8,047 9,130 * Monthly active users (m) 8,381 31% 76 58 2011 2012 2013 2014 1H FY14 1H FY15 3Q14 3Q15 *Reflects 100% of 1H FY15 aggre
Slide 30: Video entertainment: navigating economic realities
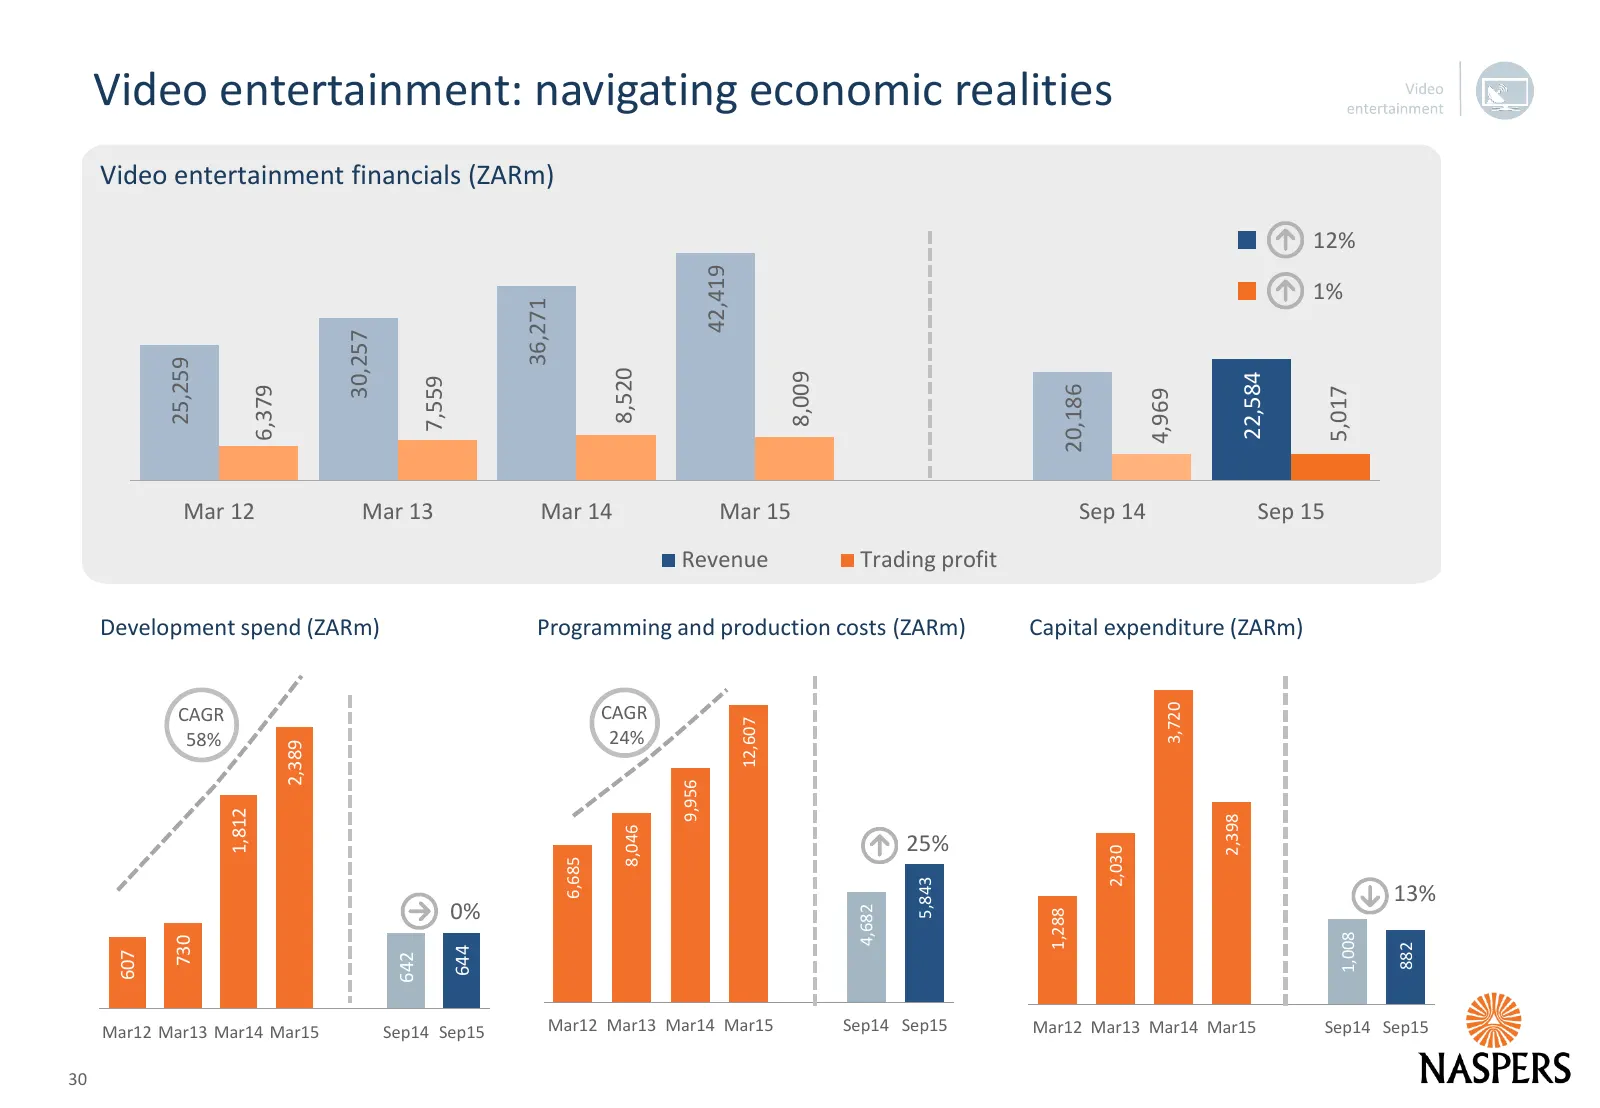
Video entertainment: navigating economic realities Video entertainment financials (ZARm) 12% 42,419 1% 36,271 30,257 25,259 8,520 8,009 22,584 7,559 20,186 6,379 5,017 4,969 Mar 12 Mar 13 Mar 14 Mar 15 Sep 14 Sep 15 Revenue Trading profit Development spend (ZARm) Programming and production costs (ZA
Slide 31: Print media
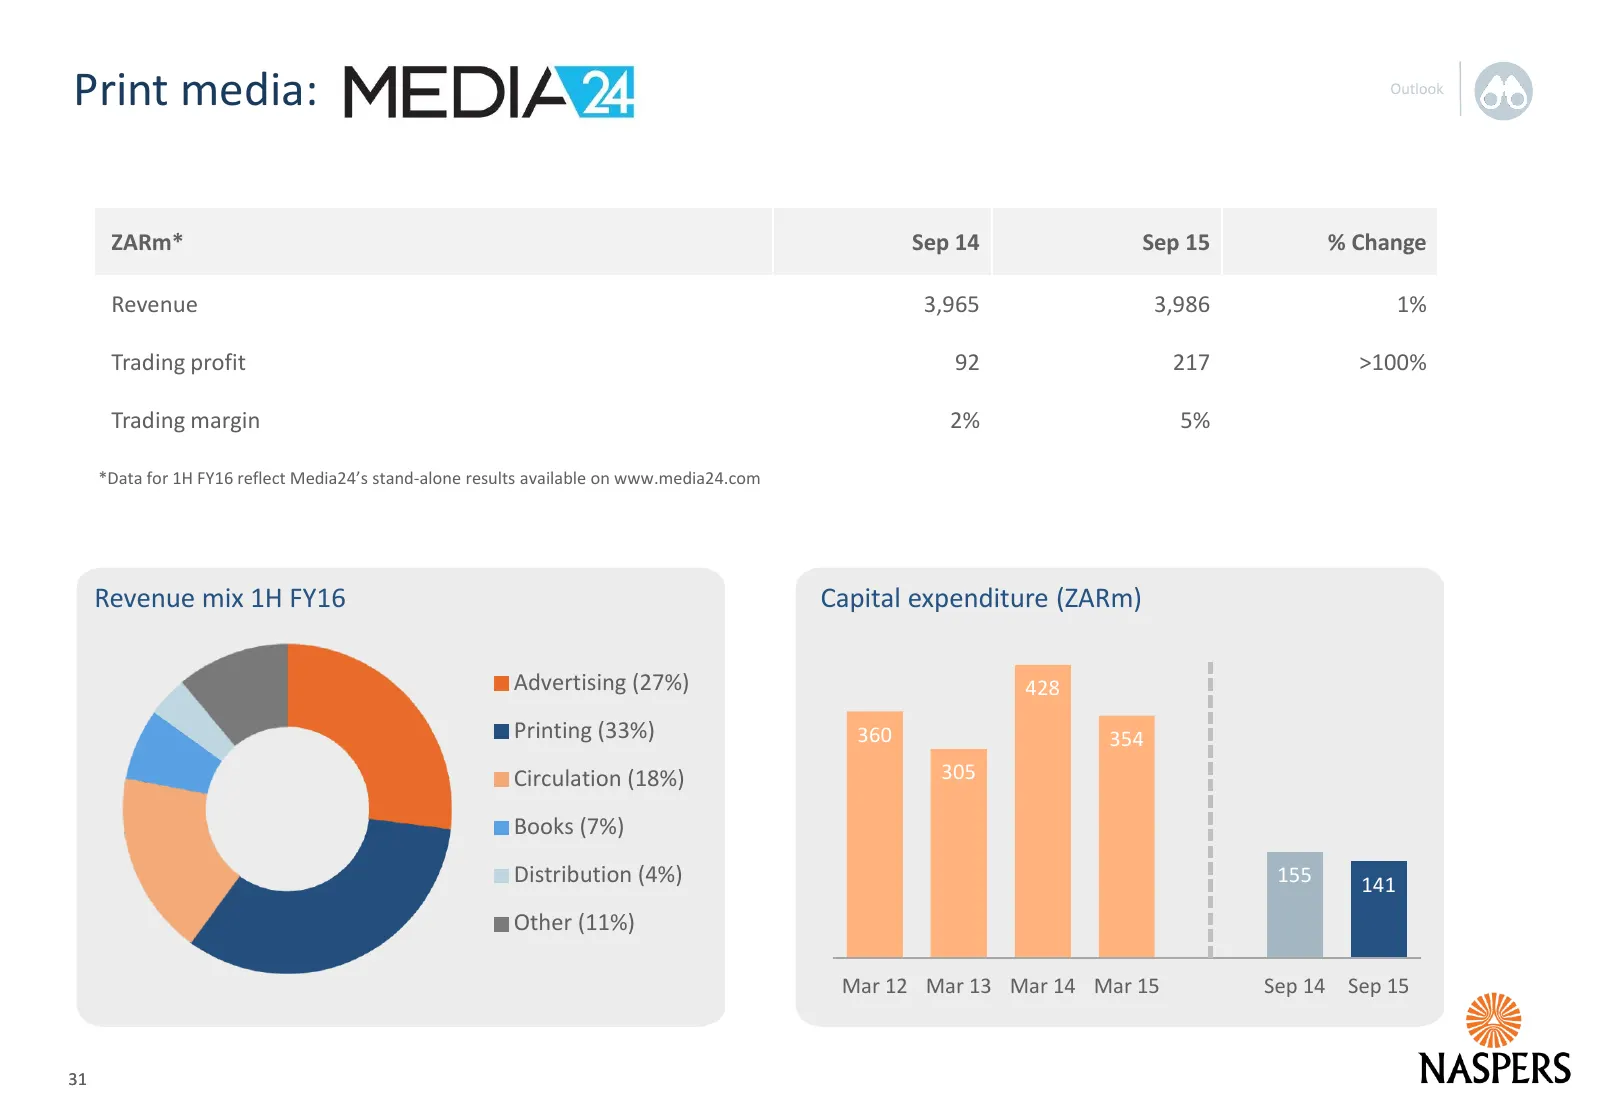
Print media: ZARm* Sep 14 Sep 15 % Change Revenue 3,965 3,986 1% Trading profit 92 217 >100% Trading margin 2% 5% *Data for 1H FY16 reflect Media24’s stand-alone results available on www.media24.com Revenue mix 1H FY16 Capital expenditure (ZARm) Advertising (27%) 428 Printing (33%) 360 354 Circulati
Slide 32: Glossary of terms
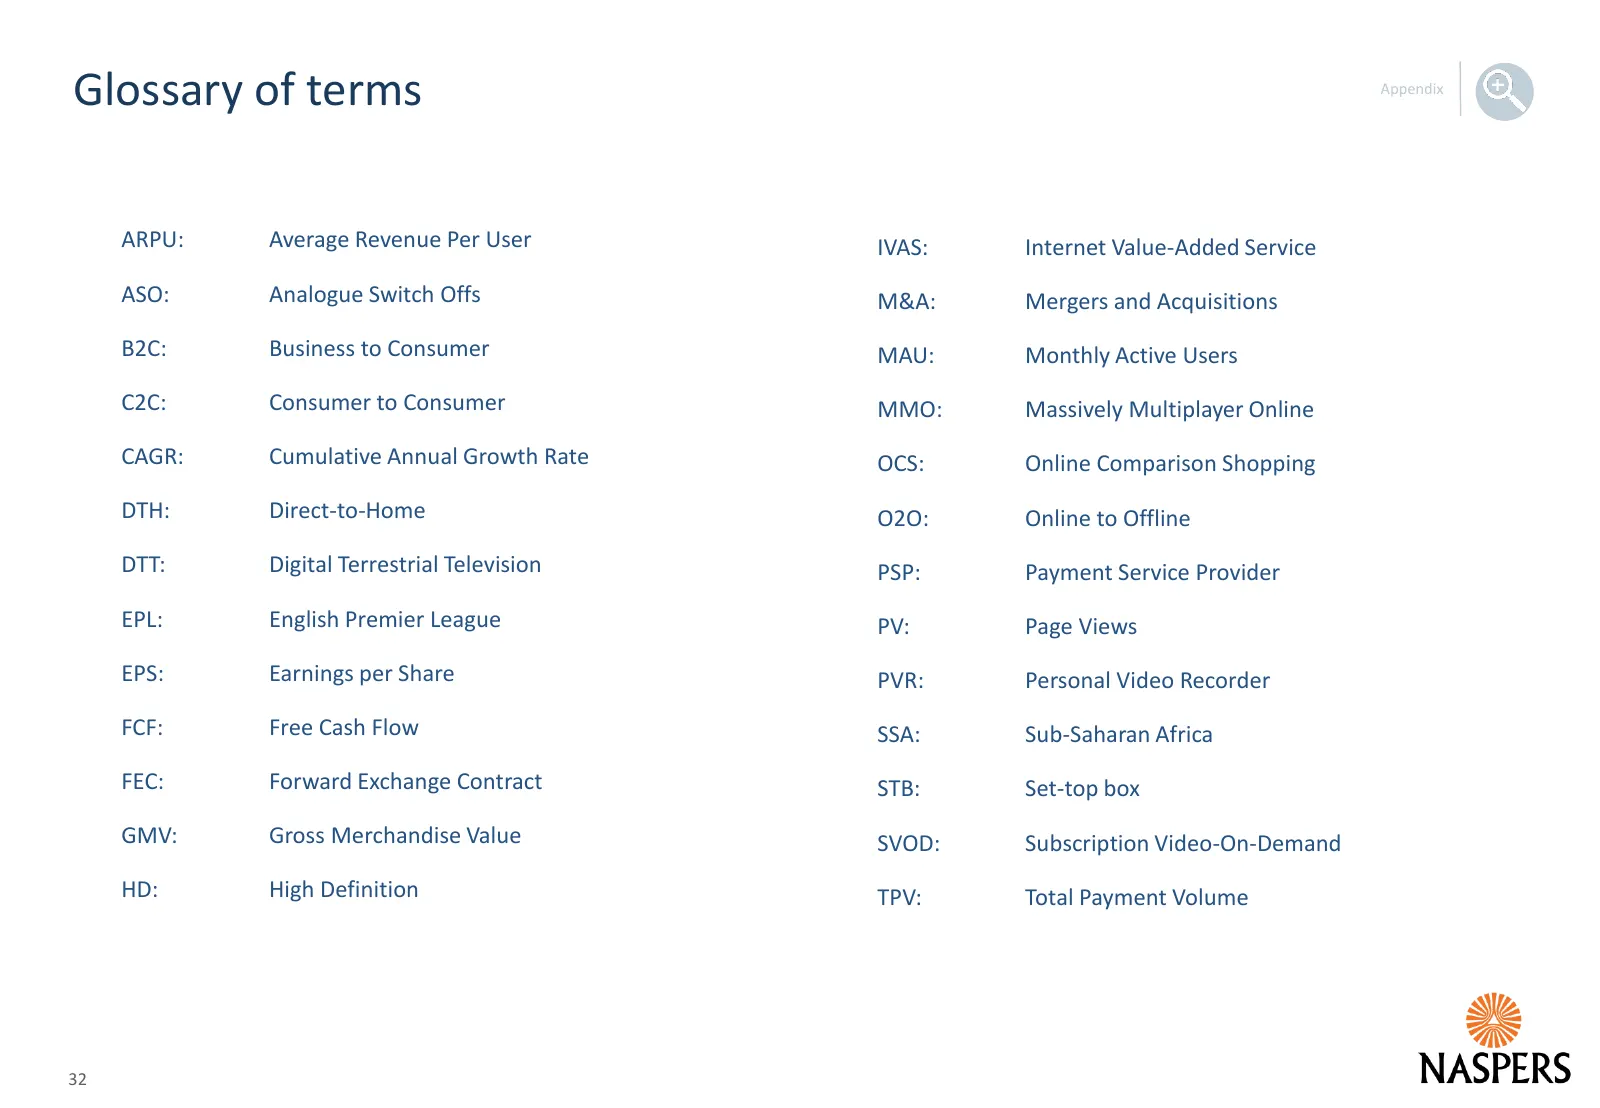
Glossary of terms ARPU: Average Revenue Per User IVAS: Internet Value-Added Service ASO: Analogue Switch Offs M&A: Mergers and Acquisitions B2C: Business to Consumer MAU: Monthly Active Users C2C: Consumer to Consumer MMO: Massively Multiplayer Online CAGR: Cumulative Annual Growth Rate OCS: Online
Slide 33: Investor Relations
Investor Relations Meloy Horn Office: +27 11 289 3320 Mobile: +27 82 7727 123 E-mail: InvestorRelations@naspers.com Website: www.naspers.com 33 33
Source: Internet Archive copy of naspers.com
More decks from Naspers Limited Class N
 FY2026 Earnings Presentation60 slides · Jun 29, 2026
 FY2026 Earnings Presentation17 slides · Mar 31, 2026
 H1 2026 Earnings Presentation64 slides · Nov 24, 2025
 H1 FY26 Earnings Presentation17 slides · November 2025
 FY2025 Earnings Presentation51 slides · June 2025
 FY2025 Earnings Presentation17 slides · 2025