PVR Inox Limited · NSE:PVRINOX
PVR Inox — PVR — Q4 FY2013-14 Earnings Presentation
22 slides from PVR Inox's earnings presentation, Aug 2, 2014
Slide 1: Investor Update Q-4 & 12 Months FY 2013-14
Investor Update Q-4 & 12 Months FY 2013-14
Slide 2: Safe Harbor
Safe Harbor: - Some information in this report may contain forward-looking statements. We have based these forward looking statements on our current beliefs, expectations and intentions as to facts, actions and events that will or may occur in the future. Such statements generally are identified by
Slide 3: Contents
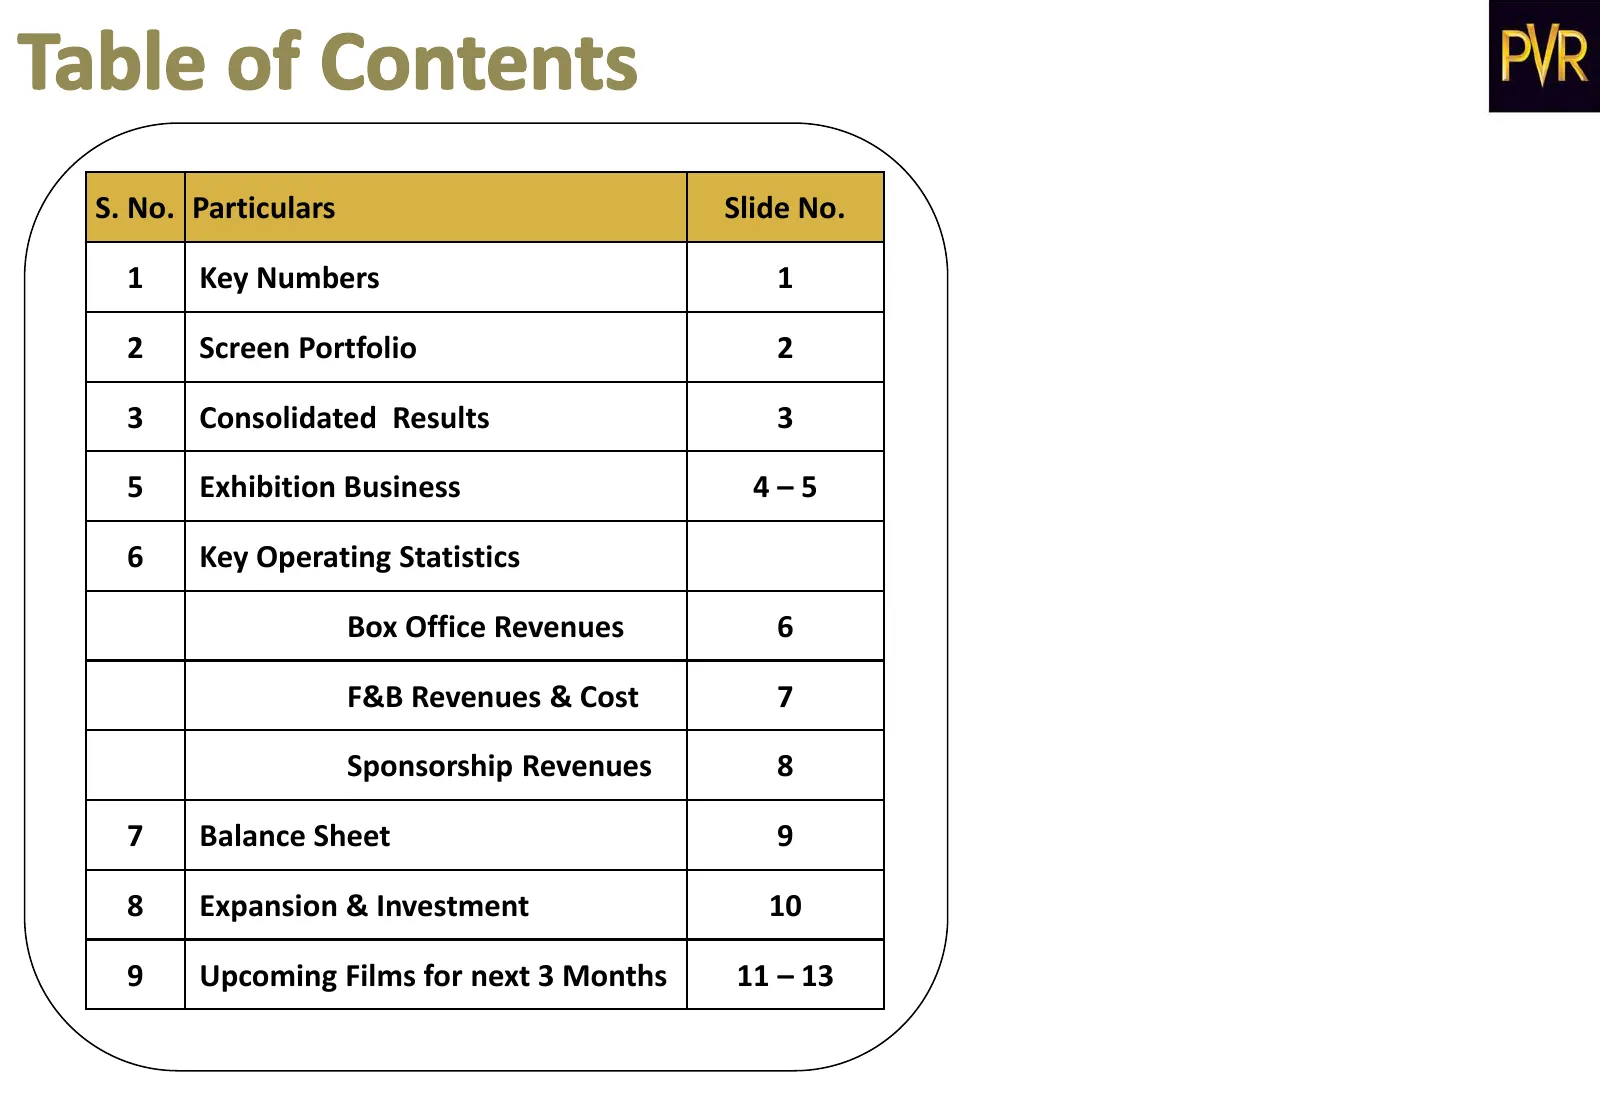
S. No. Particulars Slide No. 1 Key Numbers 1 2 Screen Portfolio 2 3 Consolidated Results 3 5 Exhibition Business 4–5 6 Key Operating Statistics Box Office Revenues 6 F&B Revenues & Cost 7 Sponsorship Revenues 8 7 Balance Sheet 9 8 Expansion & Investment 10 9 Upcoming Films for next 3 Months 11 – 13
Slide 4: Key Numbers
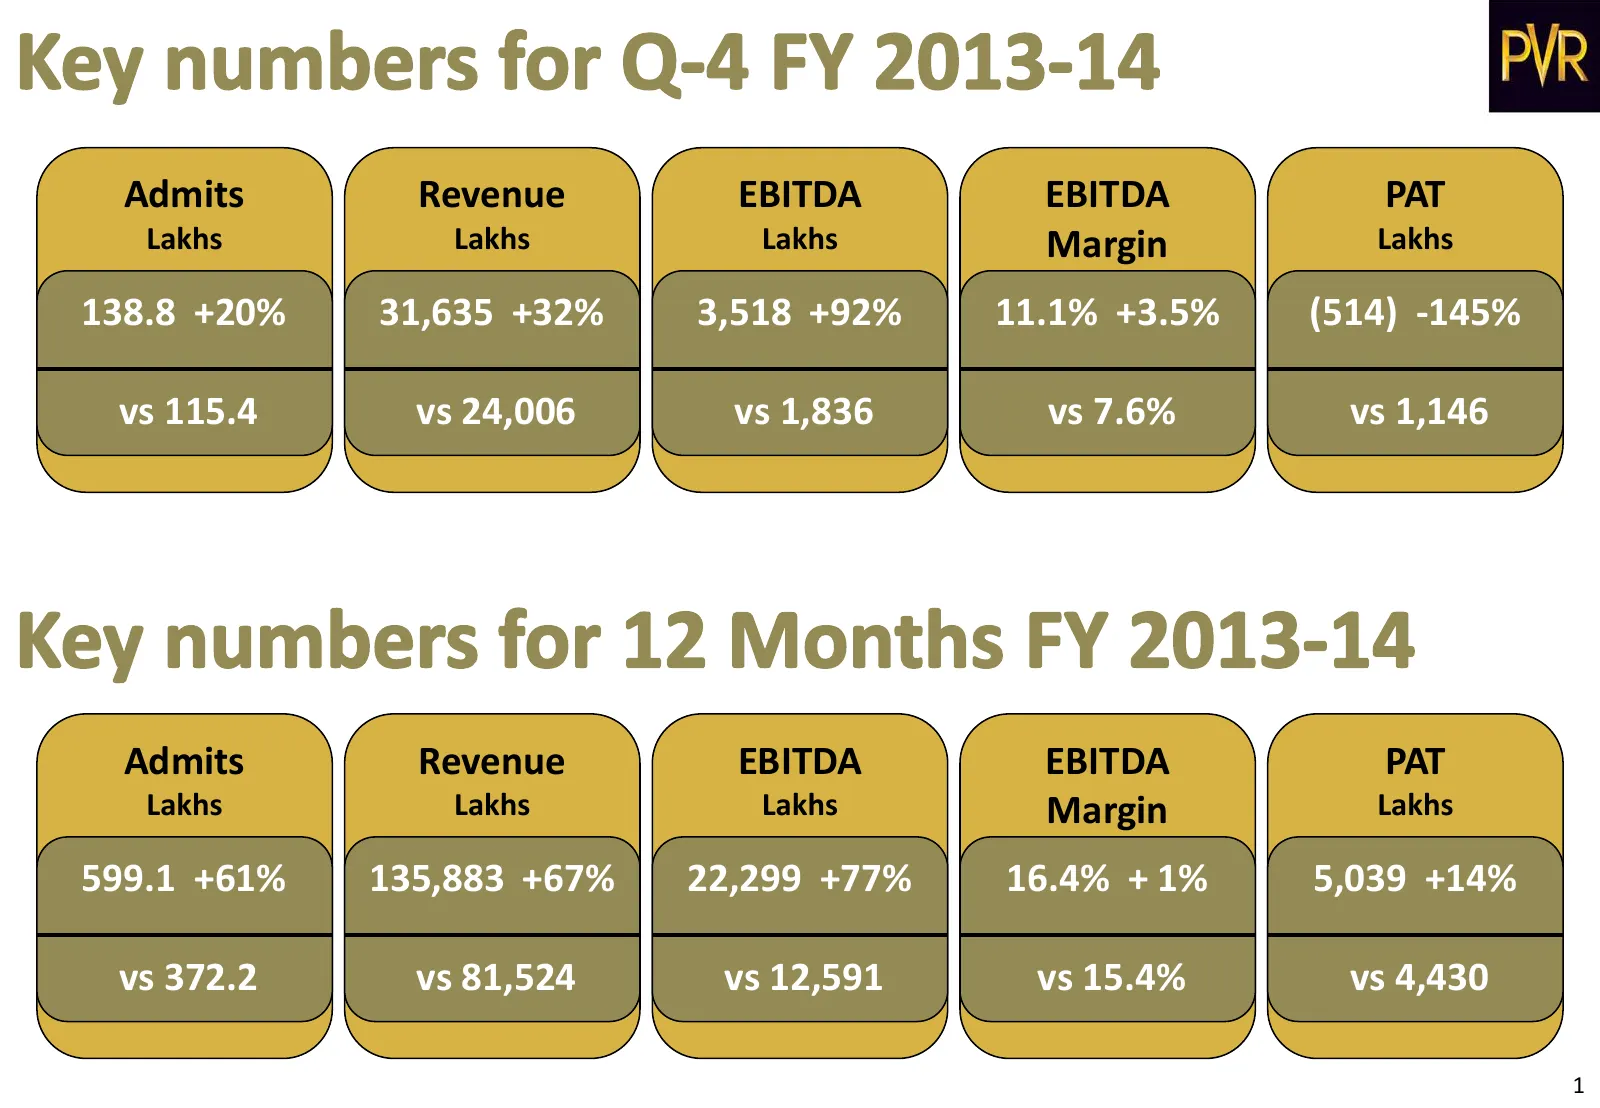
Admits Revenue EBITDA EBITDA PAT Lakhs Lakhs Lakhs Margin Lakhs 138.8 +20% 31,635 +32% 3,518 +92% 11.1% +3.5% (514) -145% vs 115.4 vs 24,006 vs 1,836 vs 7.6% vs 1,146 Admits Revenue EBITDA EBITDA PAT Lakhs Lakhs Lakhs Margin Lakhs 599.1 +61% 135,883 +67% 22,299 +77% 16.4% + 1% 5,039 +14% vs 372.2 vs
Slide 5: Screen Portfolio
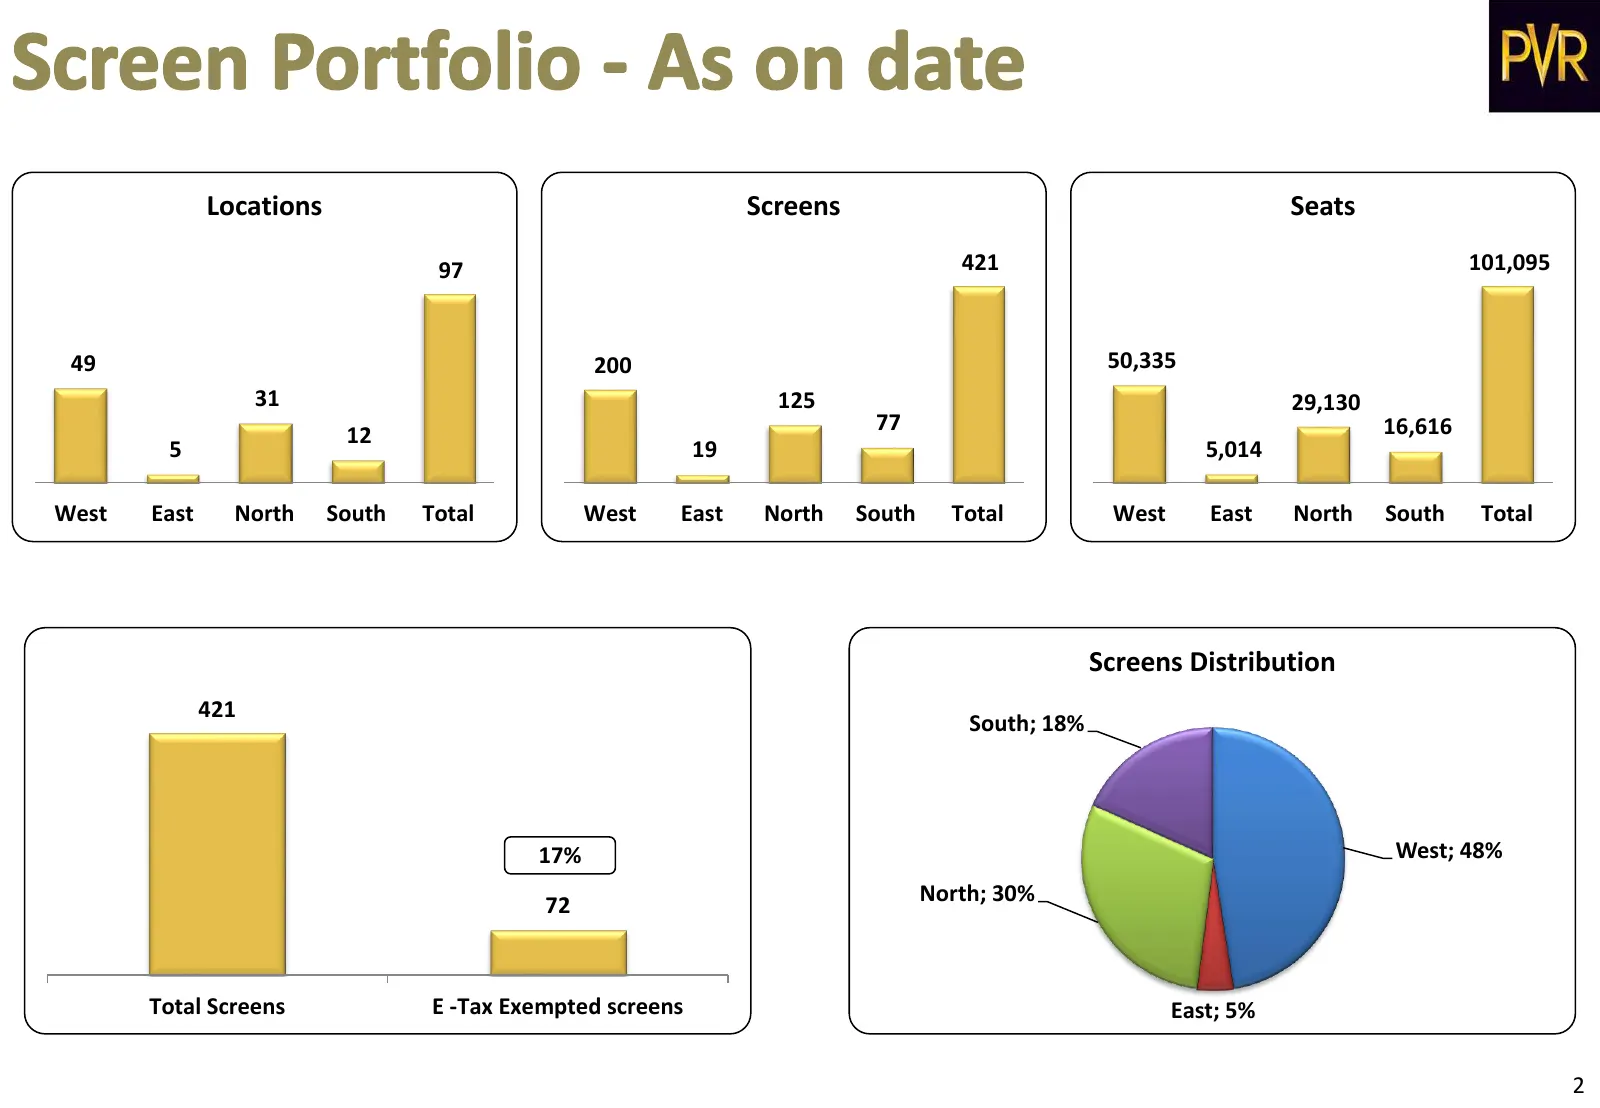
Locations Screens Seats 97 421 101,095 49 200 50,335 31 125 29,130 77 16,616 12 5 19 5,014 West East North South Total West East North South Total West East North South Total Screens Distribution 421 South; 18% 17% West; 48% 72 North; 30% Total Screens E -Tax Exempted screens East; 5% 2
Slide 6: Consolidated Results
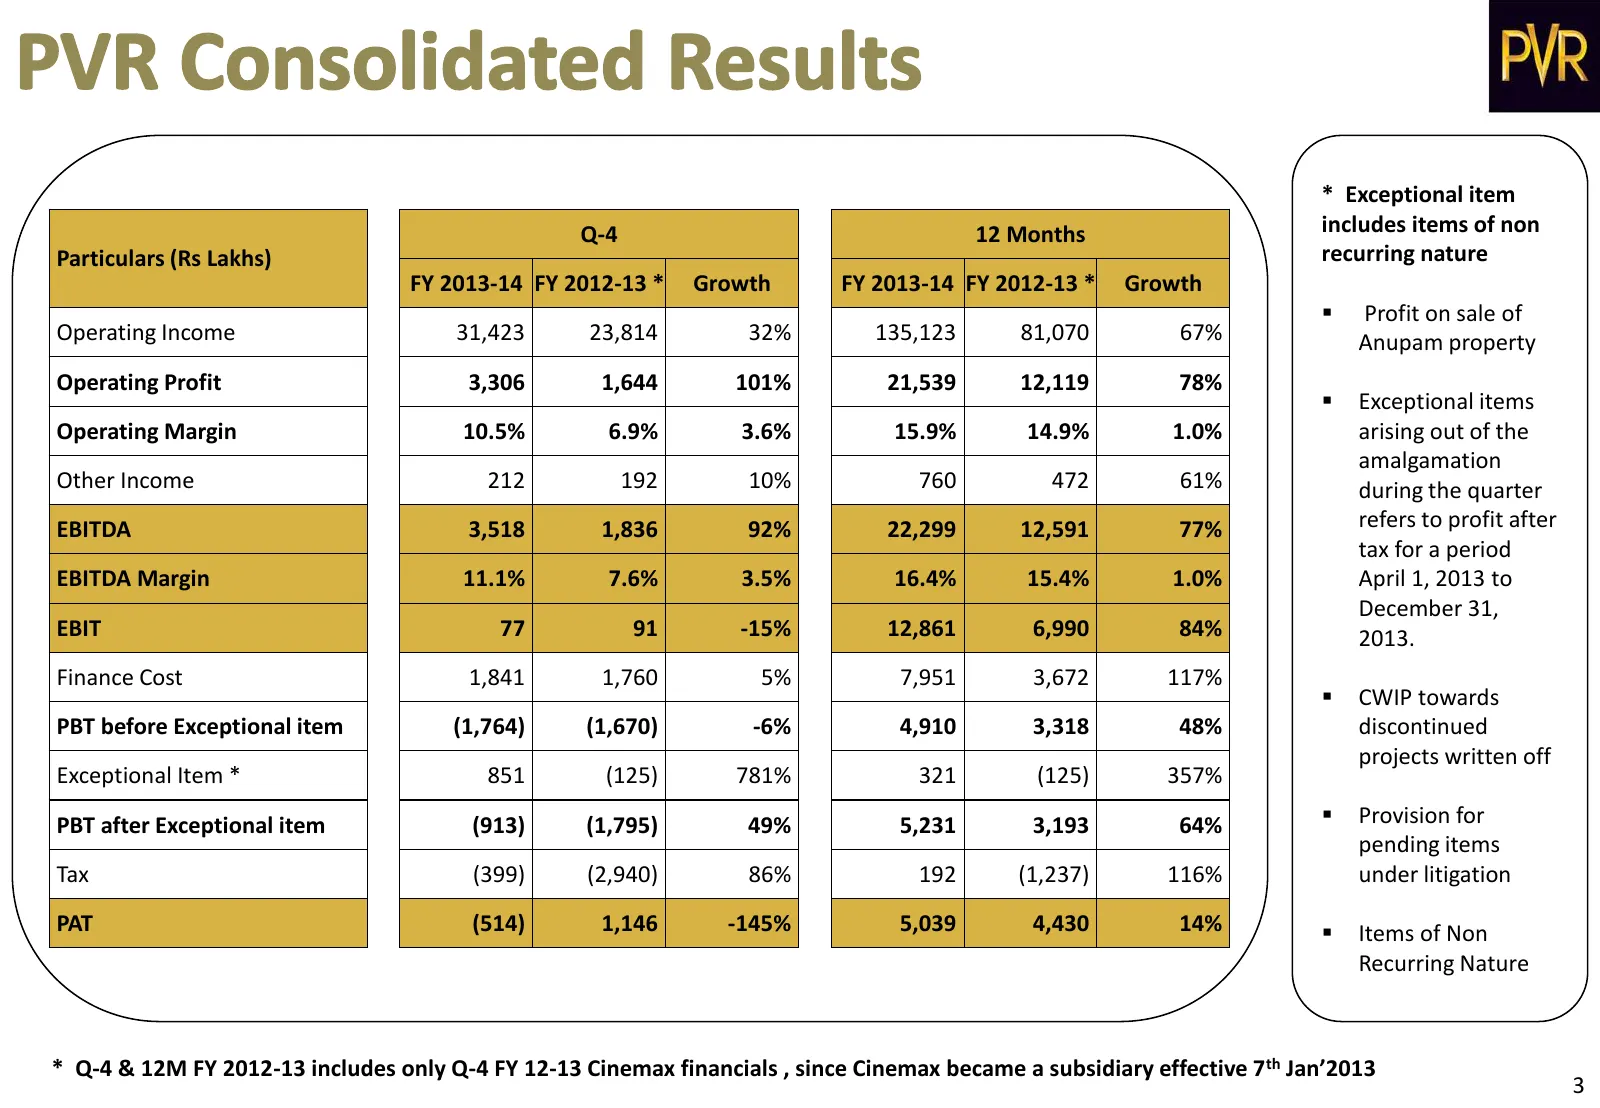
* Exceptional item Q-4 12 Months includes items of non Particulars (Rs Lakhs) recurring nature FY 2013-14 FY 2012-13 * Growth FY 2013-14 FY 2012-13 * Growth Profit on sale of Operating Income 31,423 23,814 32% 135,123 81,070 67% Anupam property Operating Profit 3,306 1,644 101% 21,539 12,119 78%

Slide 7: Exhibition Business
Exhibition Business
Slide 8: Exhibition Business Results
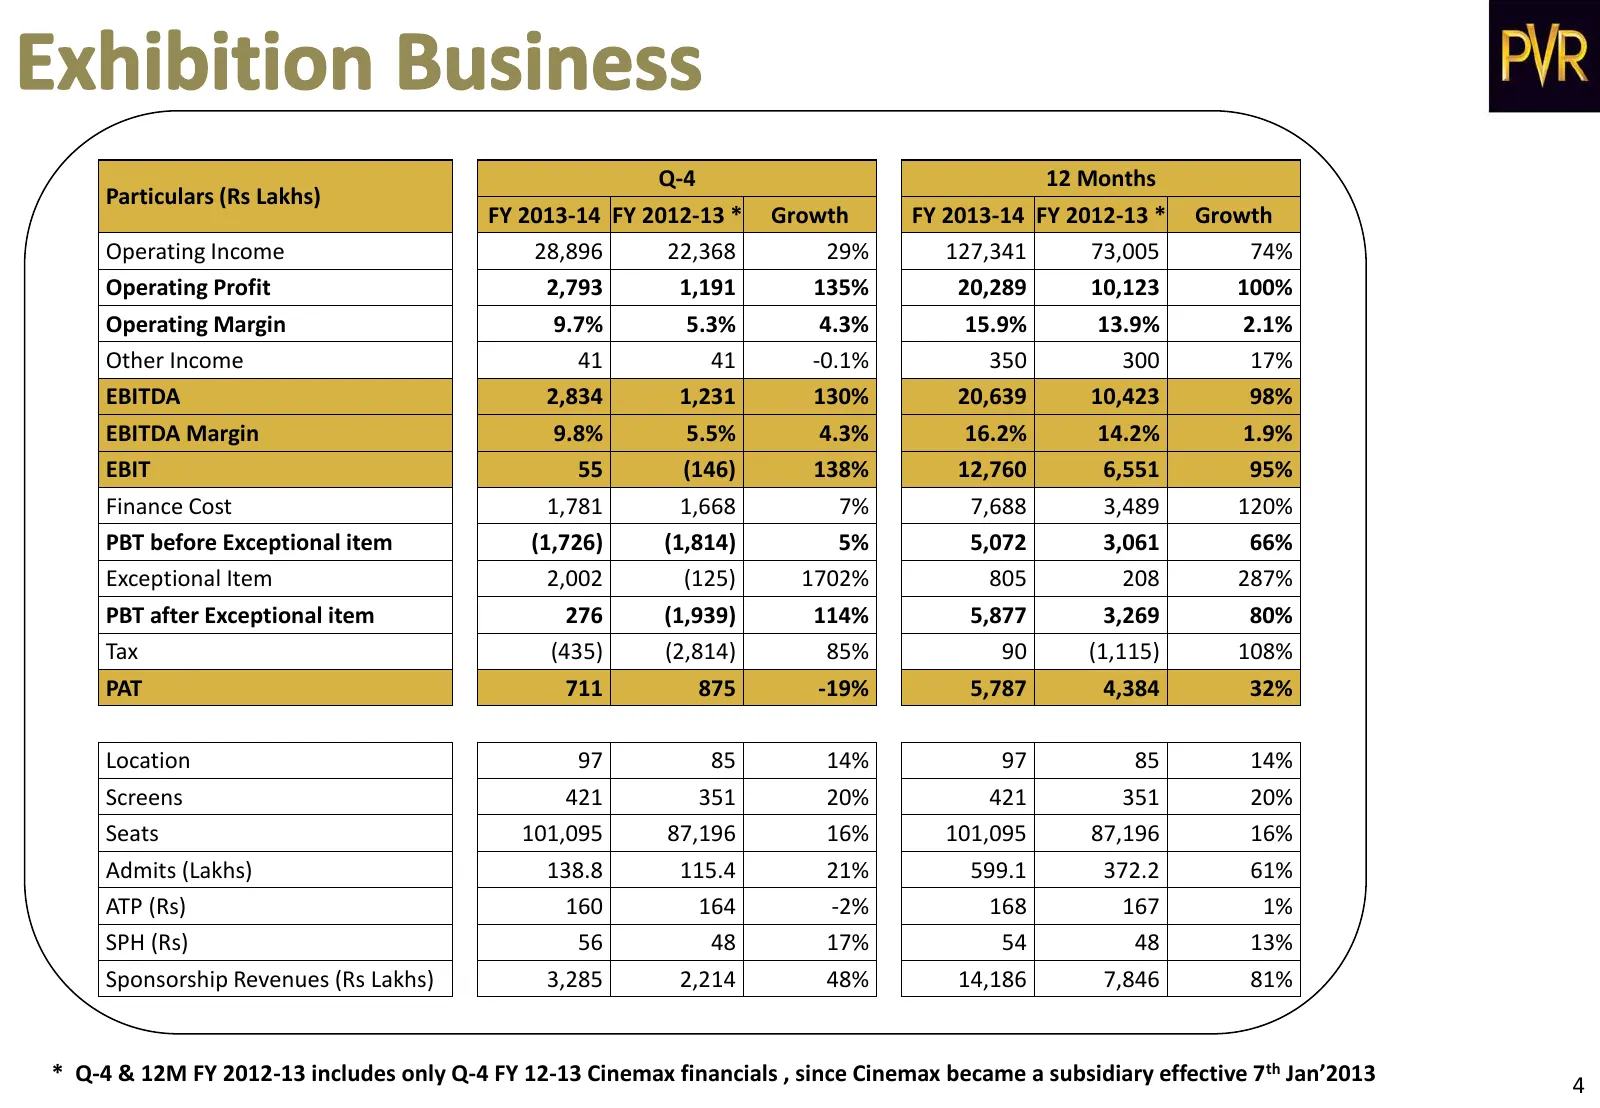
Q-4 12 Months Particulars (Rs Lakhs) FY 2013-14 FY 2012-13 * Growth FY 2013-14 FY 2012-13 * Growth Operating Income 28,896 22,368 29% 127,341 73,005 74% Operating Profit 2,793 1,191 135% 20,289 10,123 100% Operating Margin 9.7% 5.3% 4.3% 15.9% 13.9% 2.1% Other Income 41 41 -0.1% 350 300 17% EBITDA 2
Slide 9: Exhibition Business Cost Ratios
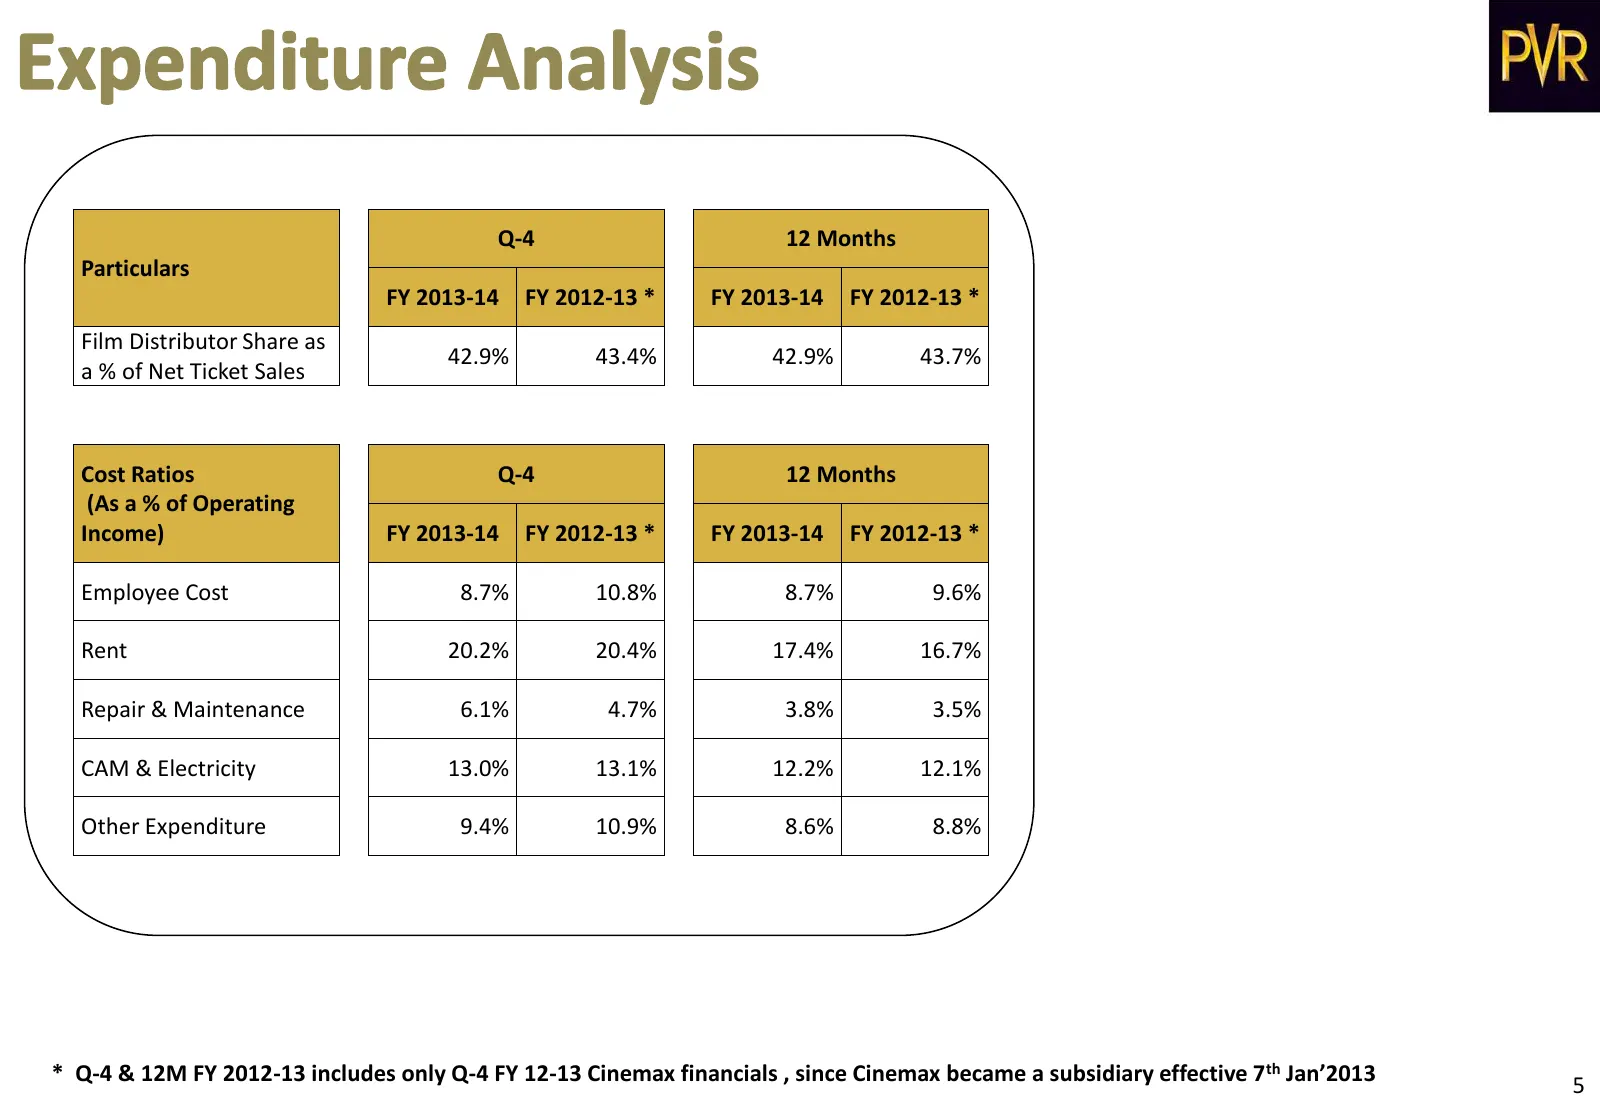
Q-4 12 Months Particulars FY 2013-14 FY 2012-13 * FY 2013-14 FY 2012-13 * Film Distributor Share as 42.9% 43.4% 42.9% 43.7% a % of Net Ticket Sales Cost Ratios Q-4 12 Months (As a % of Operating Income) FY 2013-14 FY 2012-13 * FY 2013-14 FY 2012-13 * Employee Cost 8.7% 10.8% 8.7% 9.6% Rent 20.2% 20.
Slide 10: Key Operating Statistics
Key Operating Statistics
Slide 11: Box Office Revenues
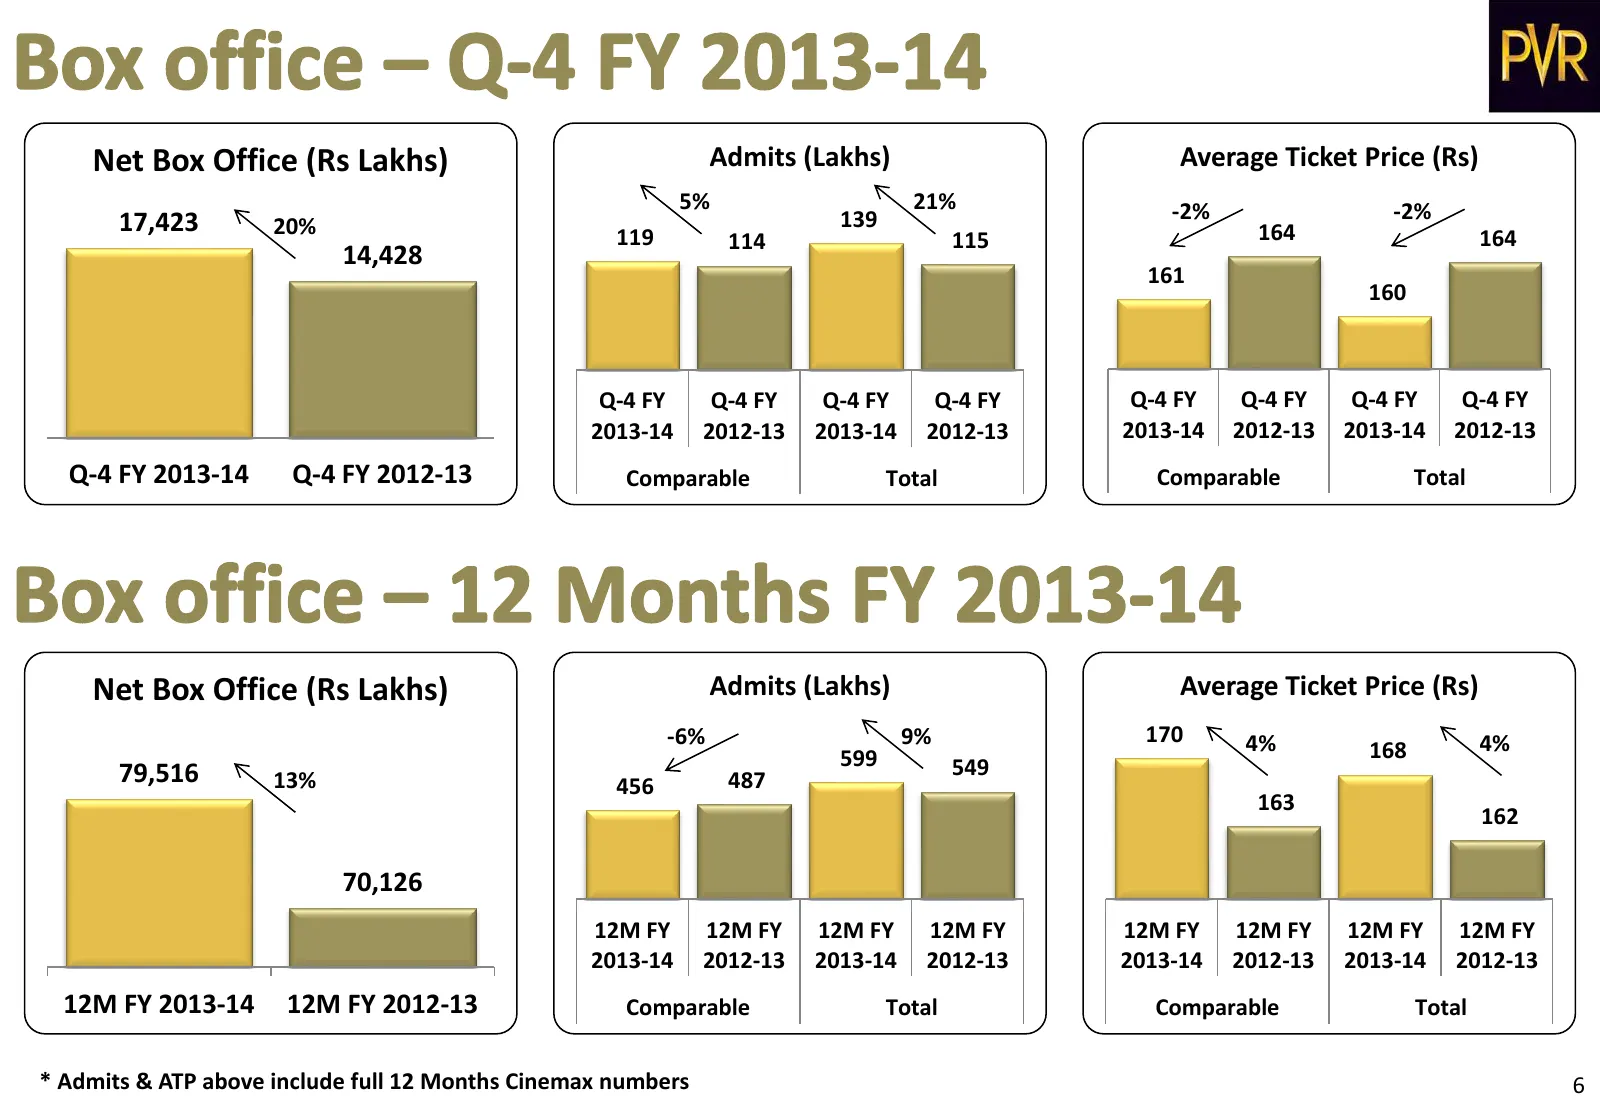
Net Box Office (Rs Lakhs) Admits (Lakhs) Average Ticket Price (Rs) 5% 21% -2% -2% 17,423 20% 139 119 114 115 164 164 14,428 161 160 Q-4 FY Q-4 FY Q-4 FY Q-4 FY Q-4 FY Q-4 FY Q-4 FY Q-4 FY 2013-14 2012-13 2013-14 2012-13 2013-14 2012-13 2013-14 2012-13 Q-4 FY 2013-14 Q-4 FY 2012-13 Comparable Total C
Slide 12: F&B Revenues & Cost
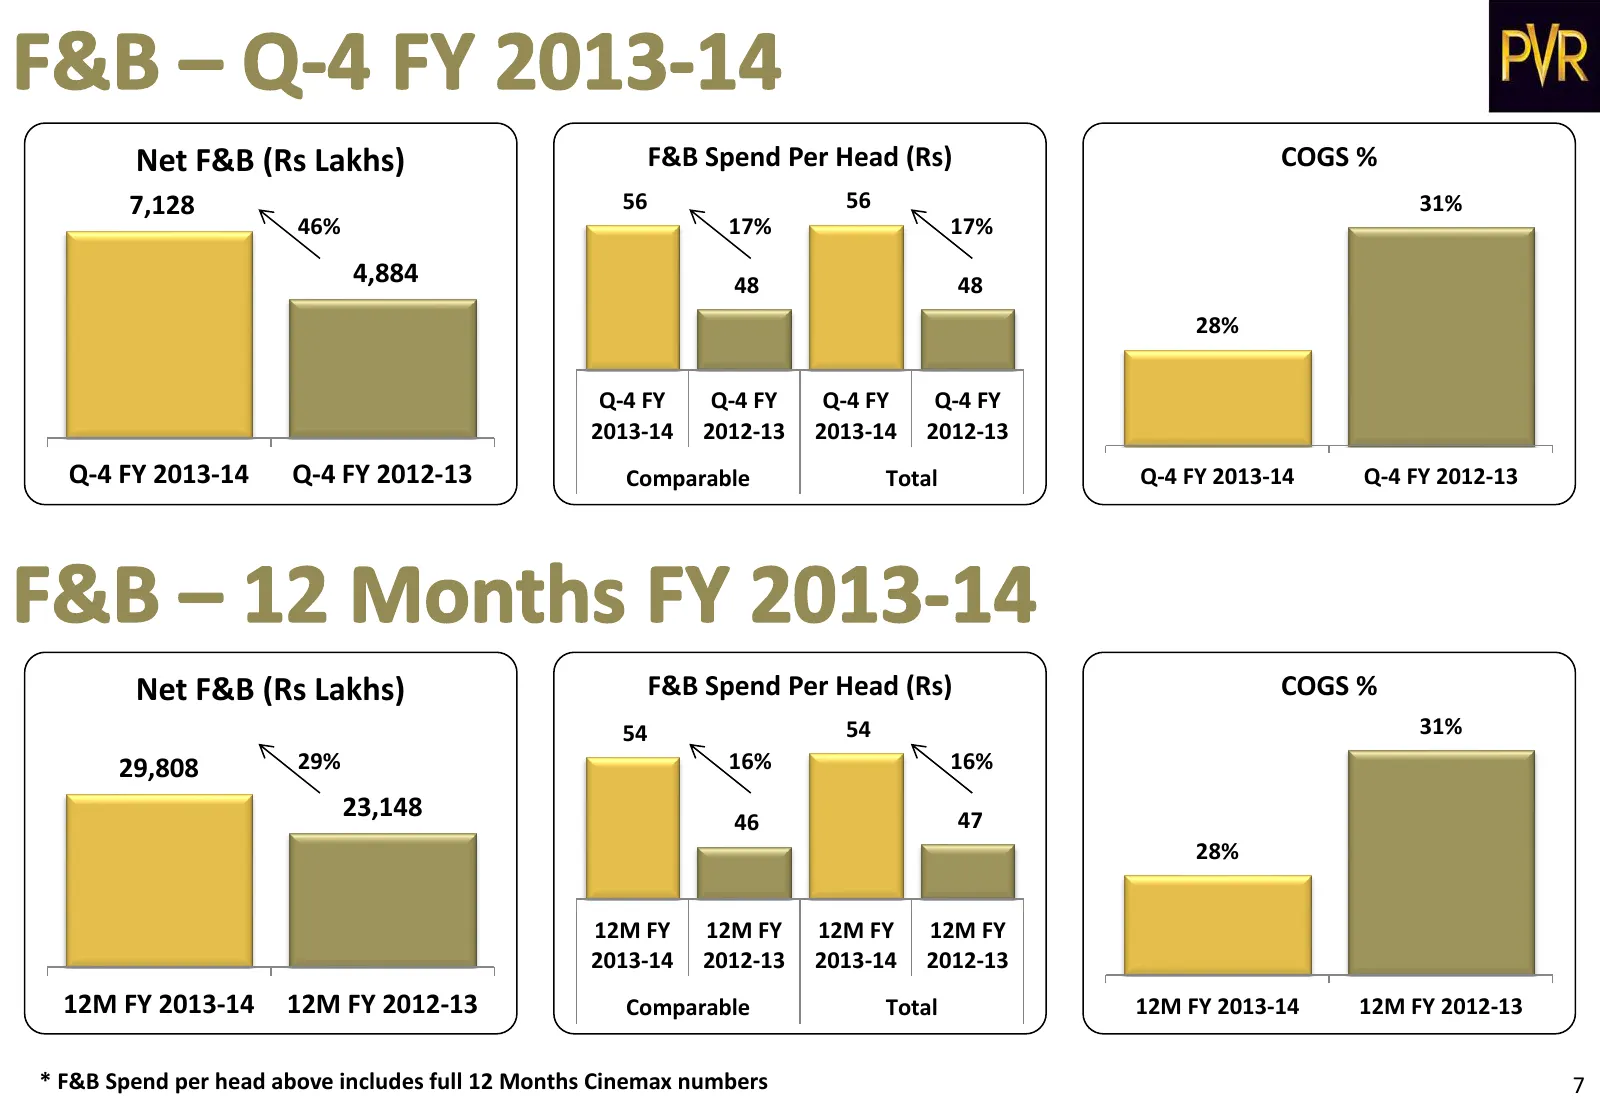
Net F&B (Rs Lakhs) F&B Spend Per Head (Rs) COGS % 7,128 56 56 31% 46% 17% 17% 4,884 48 48 28% Q-4 FY Q-4 FY Q-4 FY Q-4 FY 2013-14 2012-13 2013-14 2012-13 Q-4 FY 2013-14 Q-4 FY 2012-13 Comparable Total Q-4 FY 2013-14 Q-4 FY 2012-13 Net F&B (Rs Lakhs) F&B Spend Per Head (Rs) COGS % 54 54 31% 29,808 29
Slide 13: Sponsorship Revenues
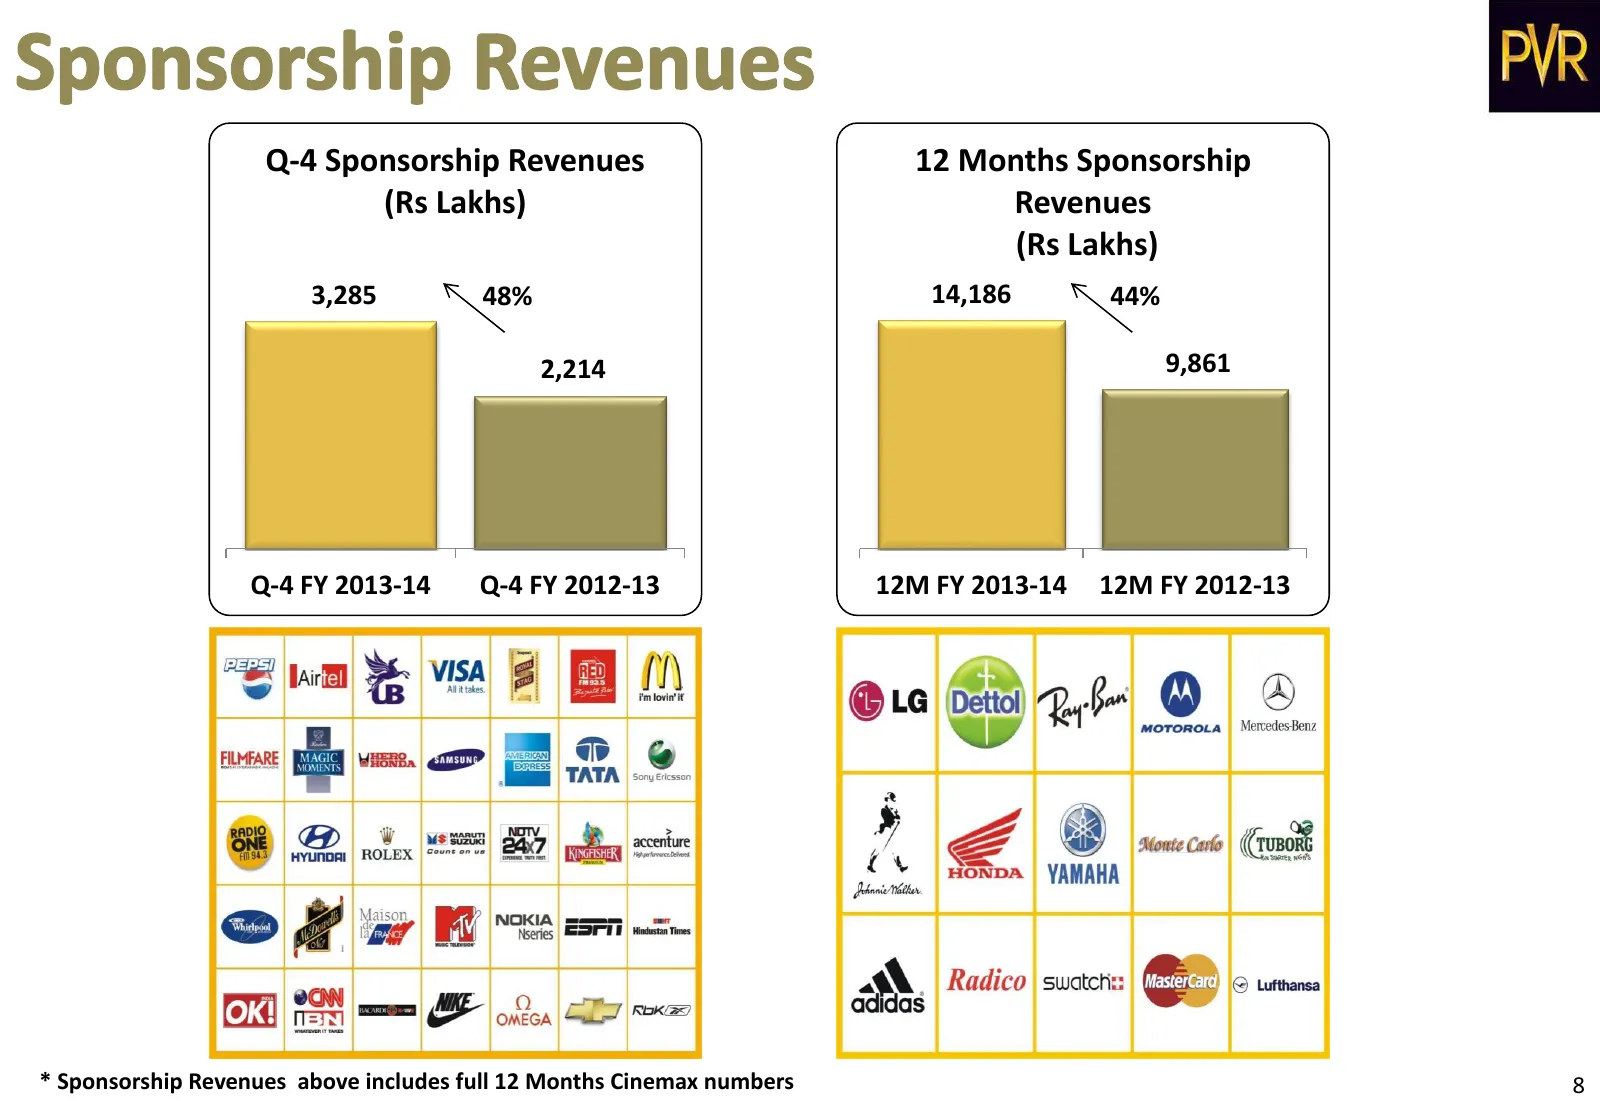
Q-4 Sponsorship Revenues 12 Months Sponsorship (Rs Lakhs) Revenues (Rs Lakhs) 3,285 48% 14,186 44% 2,214 9,861 Q-4 FY 2013-14 Q-4 FY 2012-13 12M FY 2013-14 12M FY 2012-13 * Sponsorship Revenues above includes full 12 Months Cinemax numbers 8
Slide 14: Balance Sheet
Balance Sheet
Slide 15: Balance Sheet March 31, 2014
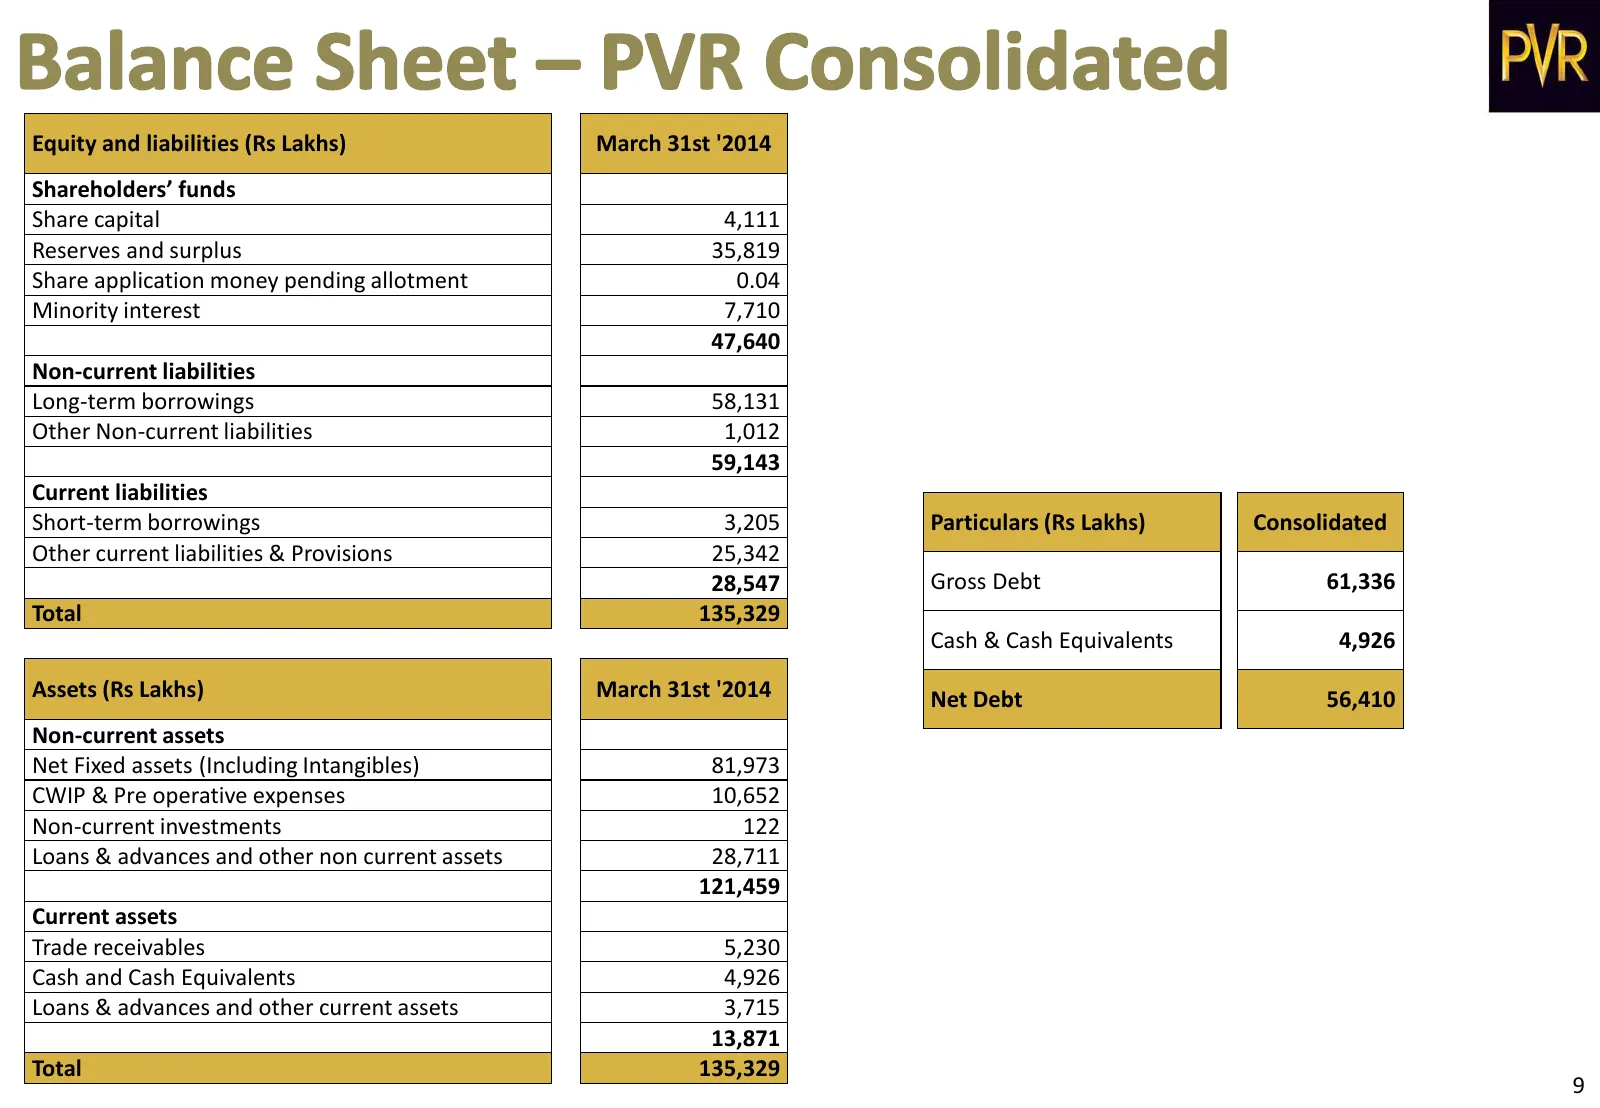
Equity and liabilities (Rs Lakhs) March 31st '2014 “hareholders’ fu ds Share capital 4,111 Reserves and surplus 35,819 Share application money pending allotment 0.04 Minority interest 7,710 47,640 Non-current liabilities Long-term borrowings 58,131 Other Non-current liabilities 1,012 59,143 Current
Slide 16: Expansion & Investment
Expansion & Investment
Slide 17: Expansion Plan: Properties, Screens, Seats
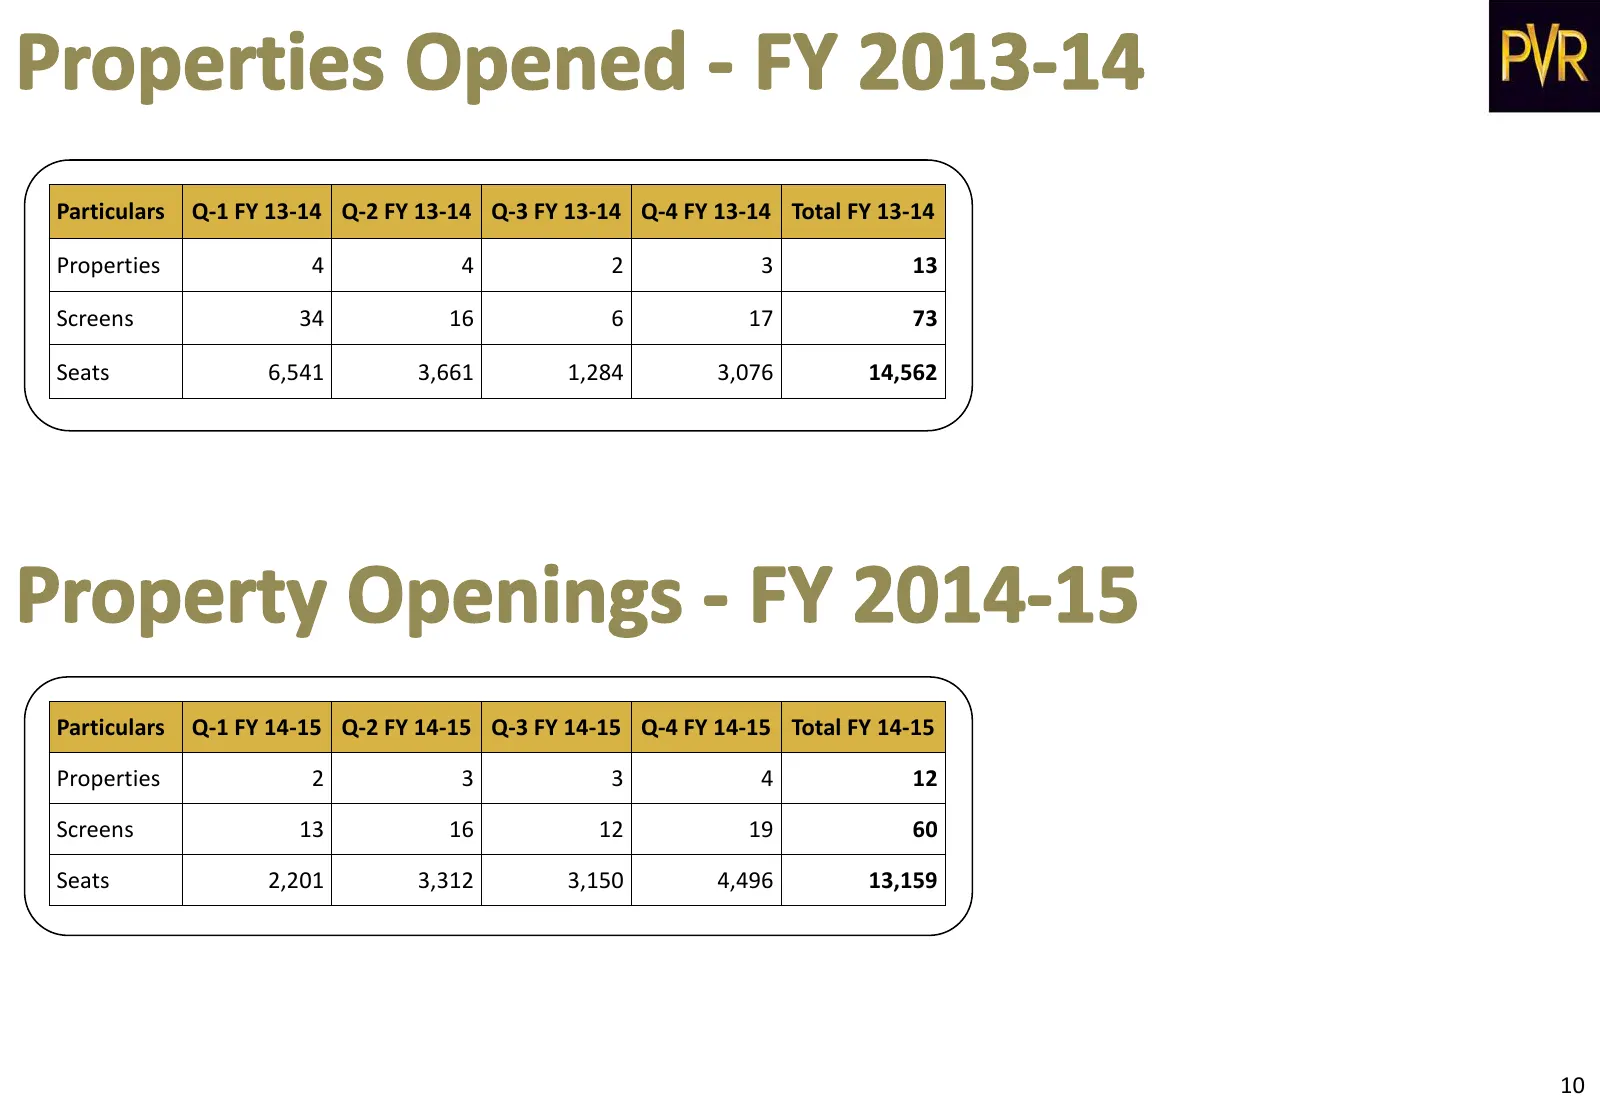
Particulars Q-1 FY 13-14 Q-2 FY 13-14 Q-3 FY 13-14 Q-4 FY 13-14 Total FY 13-14 Properties 4 4 2 3 13 Screens 34 16 6 17 73 Seats 6,541 3,661 1,284 3,076 14,562 Particulars Q-1 FY 14-15 Q-2 FY 14-15 Q-3 FY 14-15 Q-4 FY 14-15 Total FY 14-15 Properties 2 3 3 4 12 Screens 13 16 12 19 60 Seats 2,201 3,31

Slide 18: Upcoming Films for Next 3 Months
Upcoming Films for Next 3 Months
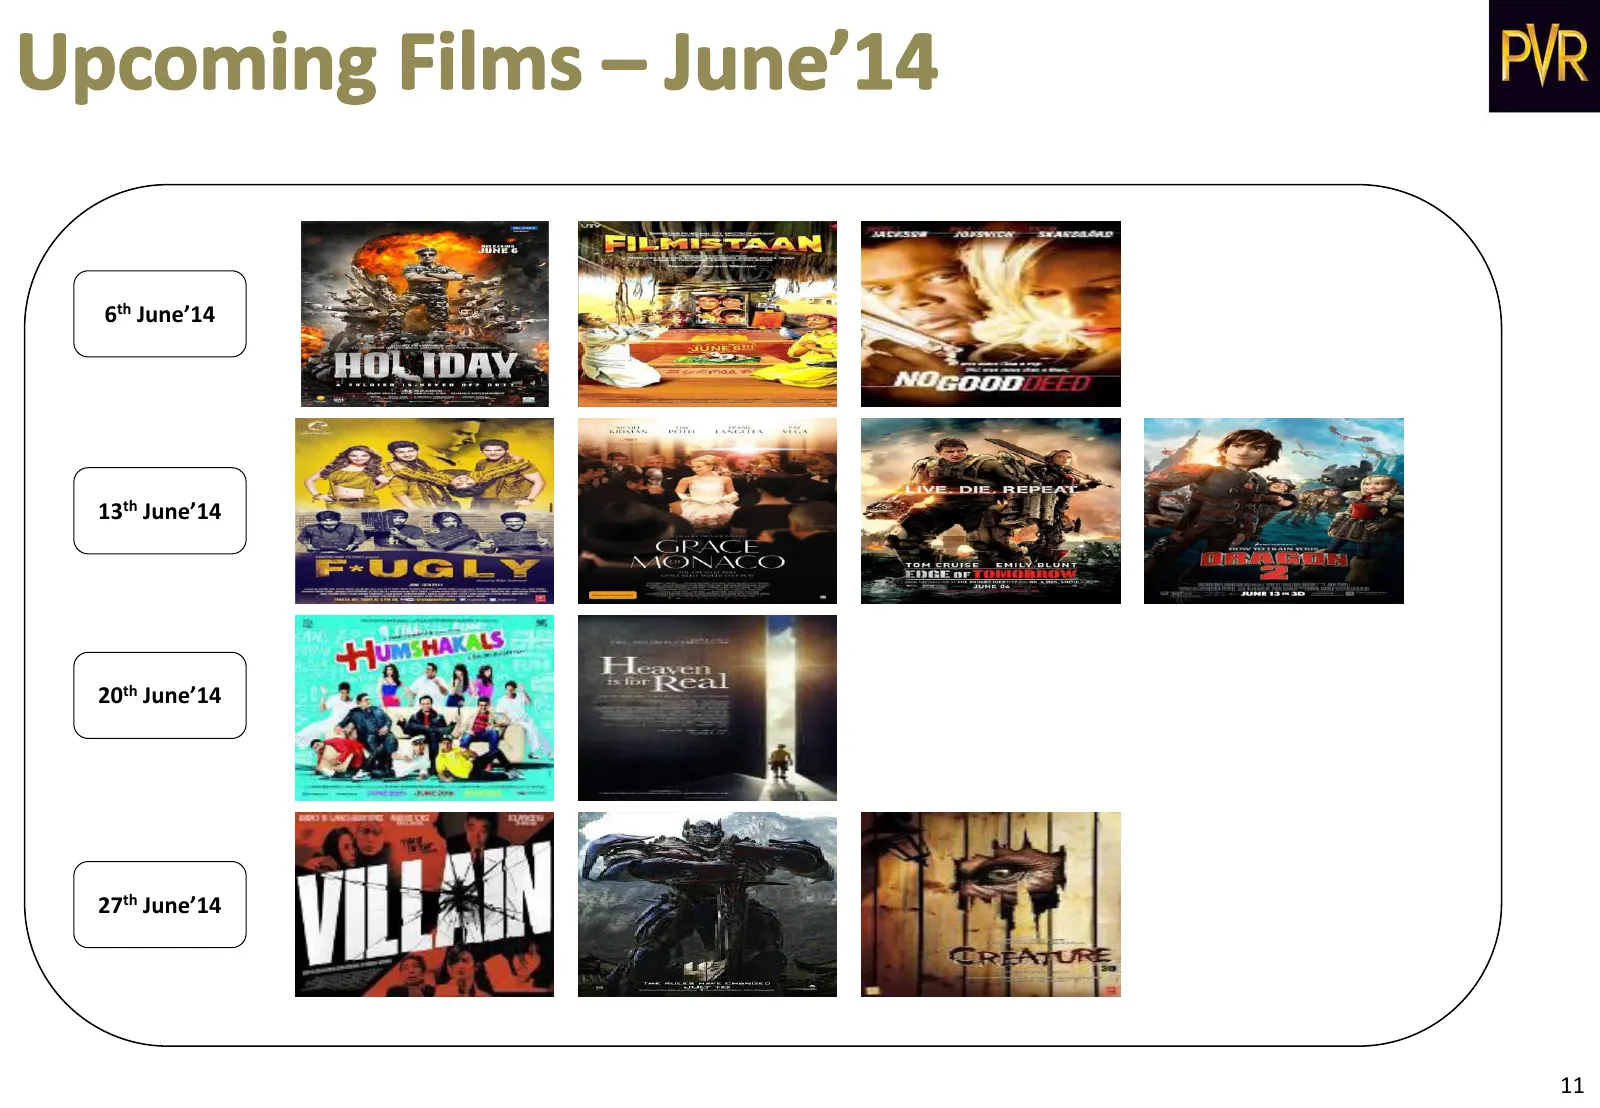
Slide 19: Upcoming Films June
6th Ju e’ 13th Ju e’ 20th Ju e’ 27th Ju e’ 11
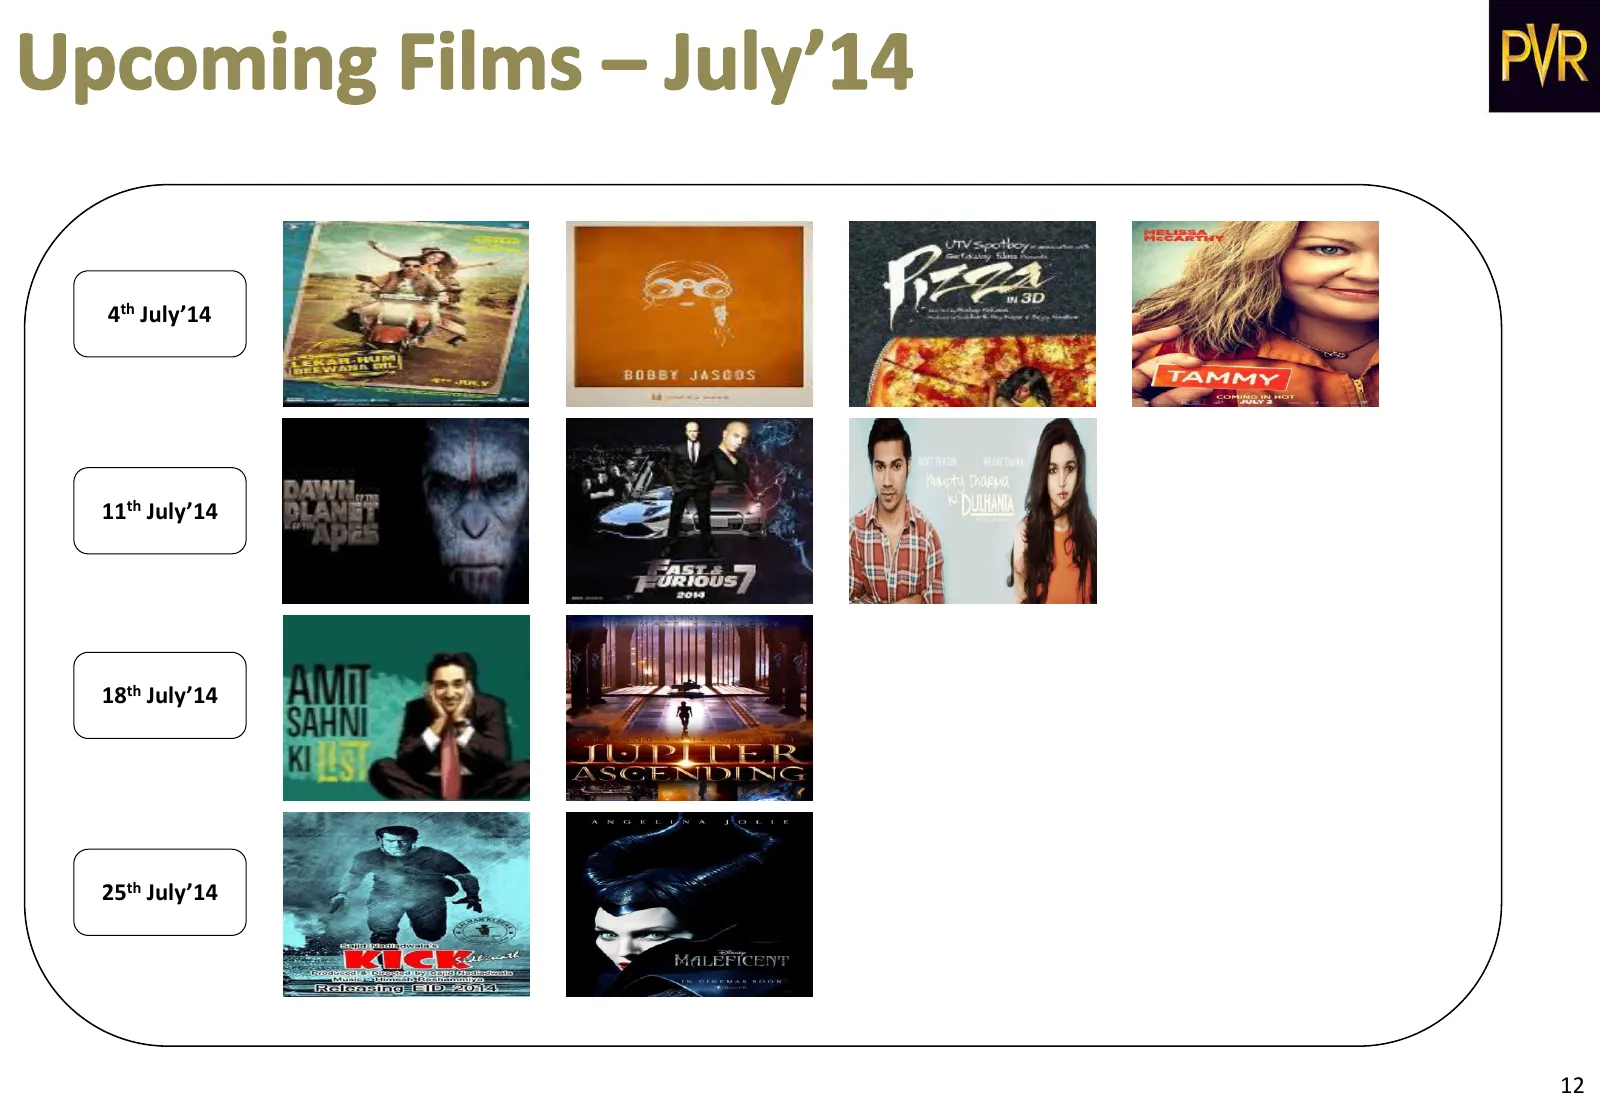
Slide 20: Upcoming Films July
4th Jul ’ 11th Jul ’ 18th Jul ’ 25th Jul ’ 12
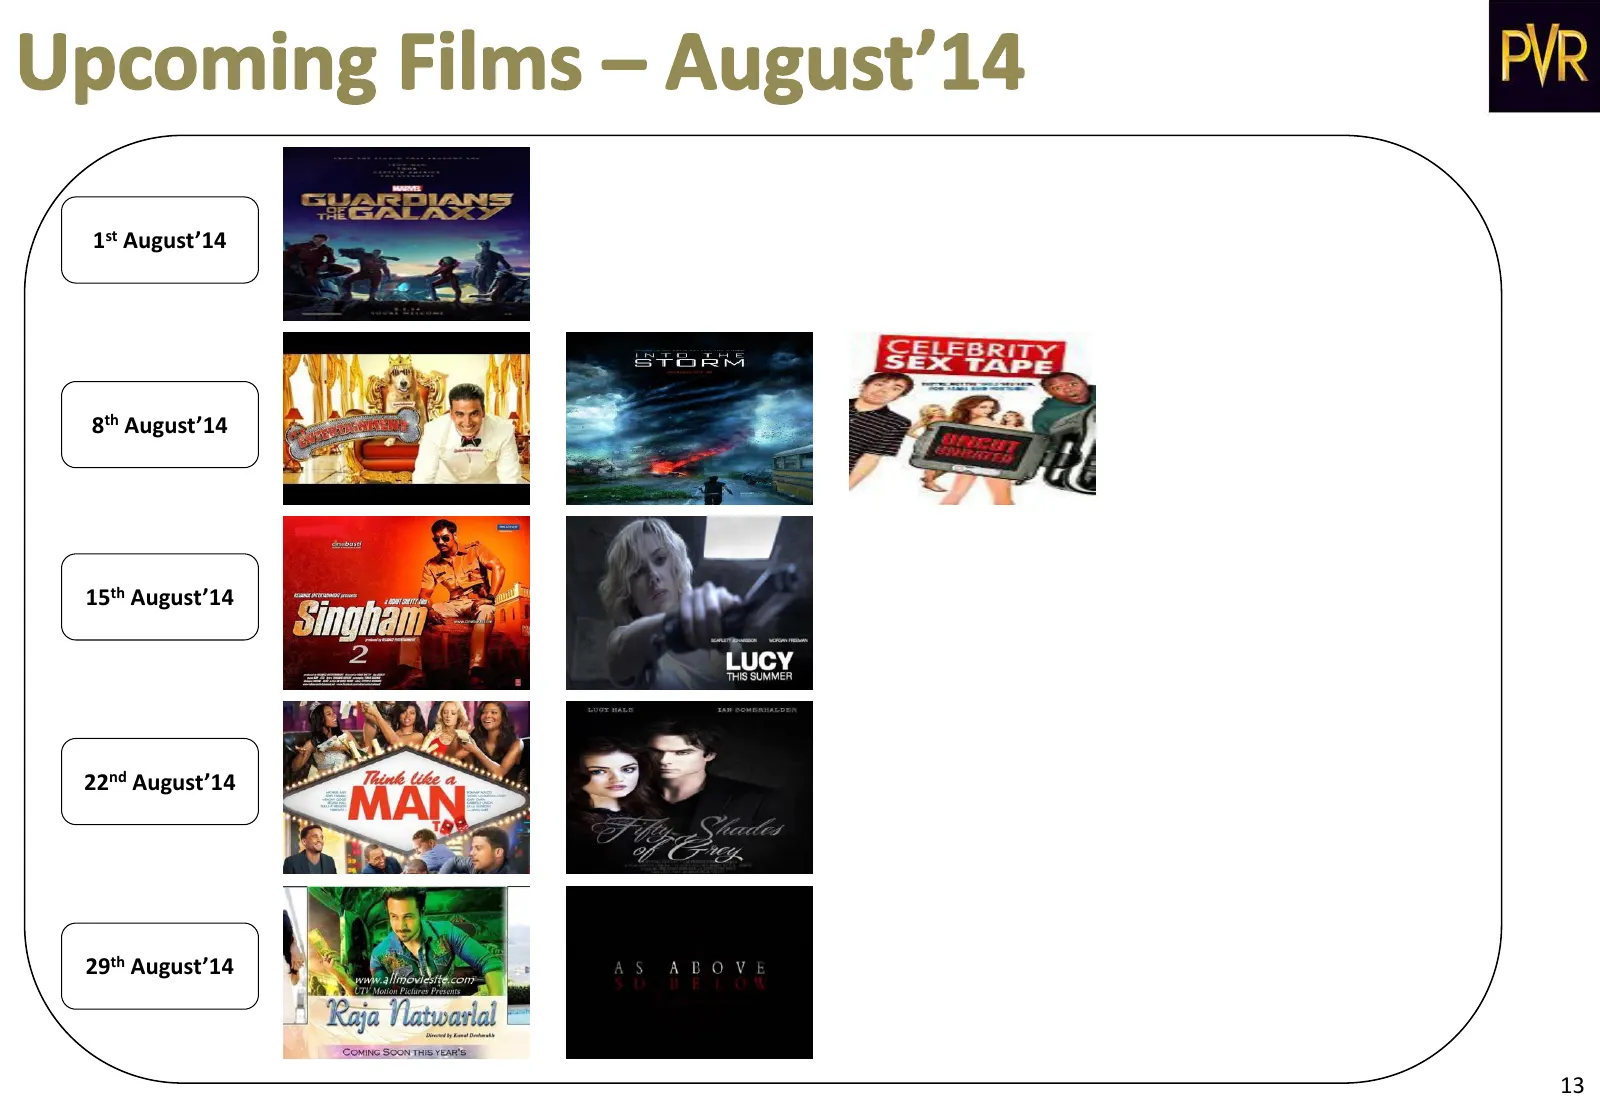
Slide 21: Upcoming Films August
1st August’ 8th August’ 15th August’ 22nd August’ 29th August’ 13
Slide 22: Contact
For any further information and queries please feel free to contact: Nitin Sood Saurabh Gupta Chief Financial Officer Vice President – Finance nitin.sood@pvrcinemas.com saurabh.gupta@pvrcinemas.com PVR Limited Block A, 4th Floor, Building No 9, DLF Cyber city Phase II Gurgaon, Haryana – 122002 Ph :
Source: Internet Archive copy of static.pvrcinemas.com
More decks from PVR Inox Limited
 Q2 FY2027 Earnings Presentation38 slides · Oct 28, 2026
 Q1 FY2027 Earnings Presentation29 slides · Jul 23, 2026
 Q4 FY2026 Earnings Presentation42 slides · May 11, 2026
 Q3 FY2026 Earnings Presentation45 slides · Feb 5, 2026
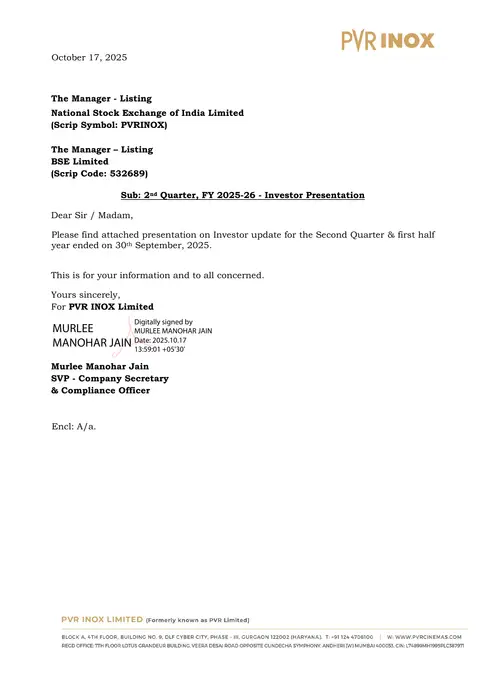 Q2 FY2026 Earnings Presentation35 slides · Oct 17, 2025
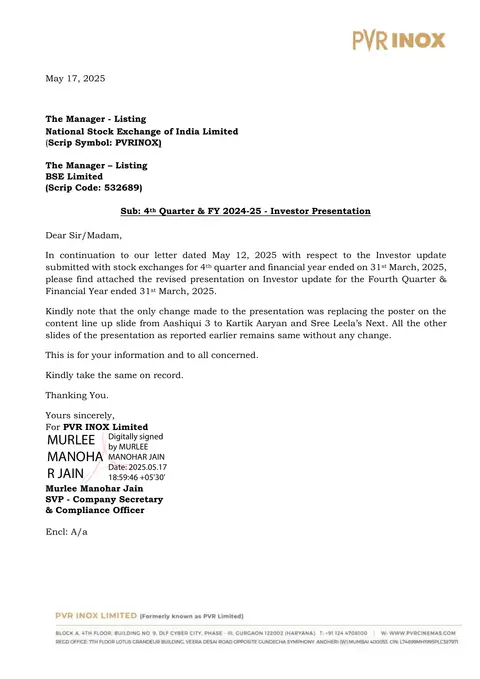 Q4 FY2025 Earnings Presentation32 slides · May 17, 2025