Alpha Natural Resources — J.P. Morgan Global High Yield and Leveraged Finance Conference 2012
26 slides from Alpha Natural Resources's conference presentation, Feb 27, 2012

Slide 1: J.P. Morgan Global High Yield and Leveraged Finance Conference 2012
J.P. Morgan Global High Yield and Leveraged Finance Conference 2012 Frank Wood Chief Financial Officer
Slide 2: Forward-Looking Statements
A Alpha Natural Resources £ Ipha Forward-Looking Statements Statements in this presentation which are not statements of historical fact are “forward-looking statements” within the Safe Harbor provision of the Private Securities Litigation Reform Act of 1995. Such statements are not guarantees of fut
Slide 3: Alpha Natural Resources Highlights
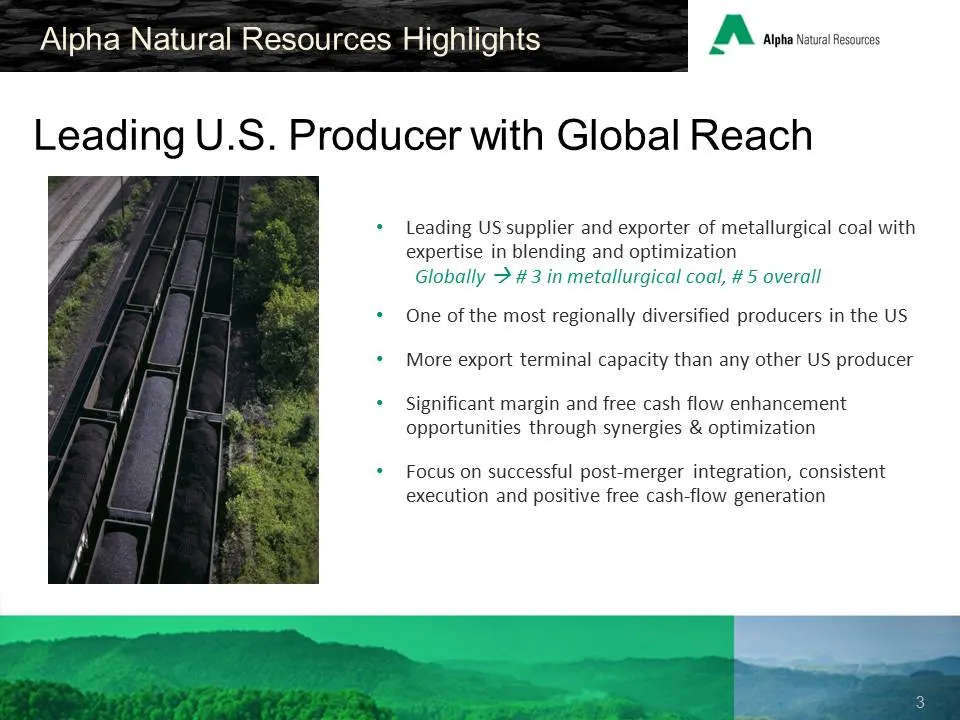
Alpha Natural Resources Highlights AM sn recaeone Leading U.S. Producer with Global Reach * Leading US supplier and exporter of metallurgical coal with expertise in blending and optimization Globally > #3 in metallurgical coal, #5 overall * One of the most regionally diversified producers in the US

Slide 4: BRICs Drive Global Growth
BRICs Drive Glob ] BR Growth ww
Slide 5: Global Outlook
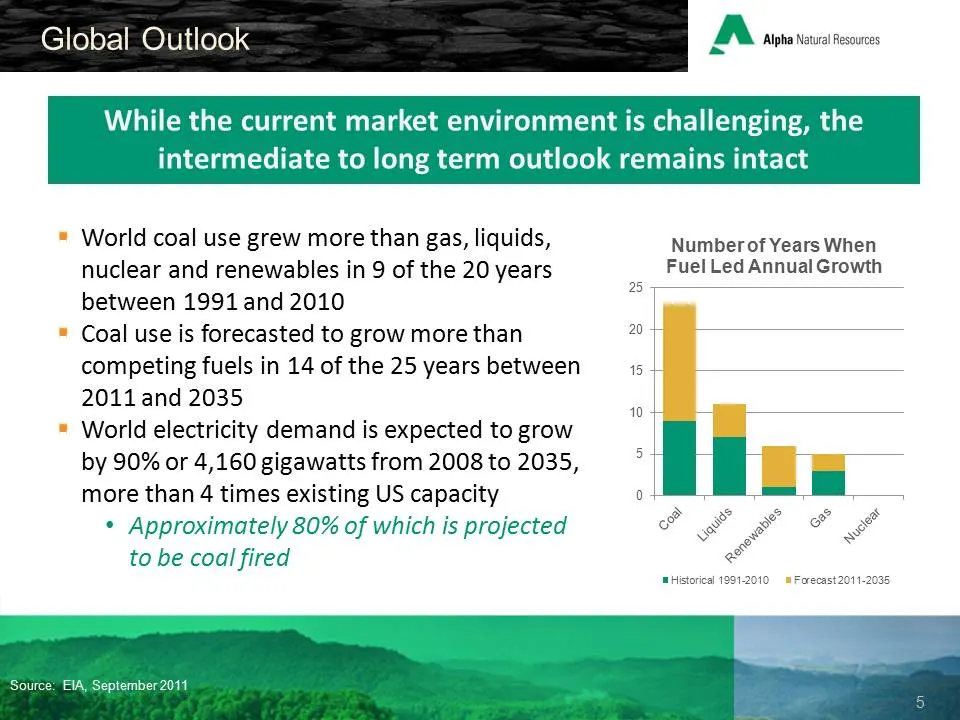
Global Outlook A ‘Alpha Natural Resources While the current market environment is challenging, the intermediate to long term outlook remains intact = World coal use grew more than gas, liquids, Number of Years When nuclear and renewables in 9 of the 20 years Fuel Led Annual Growth between 1991 and 2
Slide 6: BRIC Nations to Dominate Growth
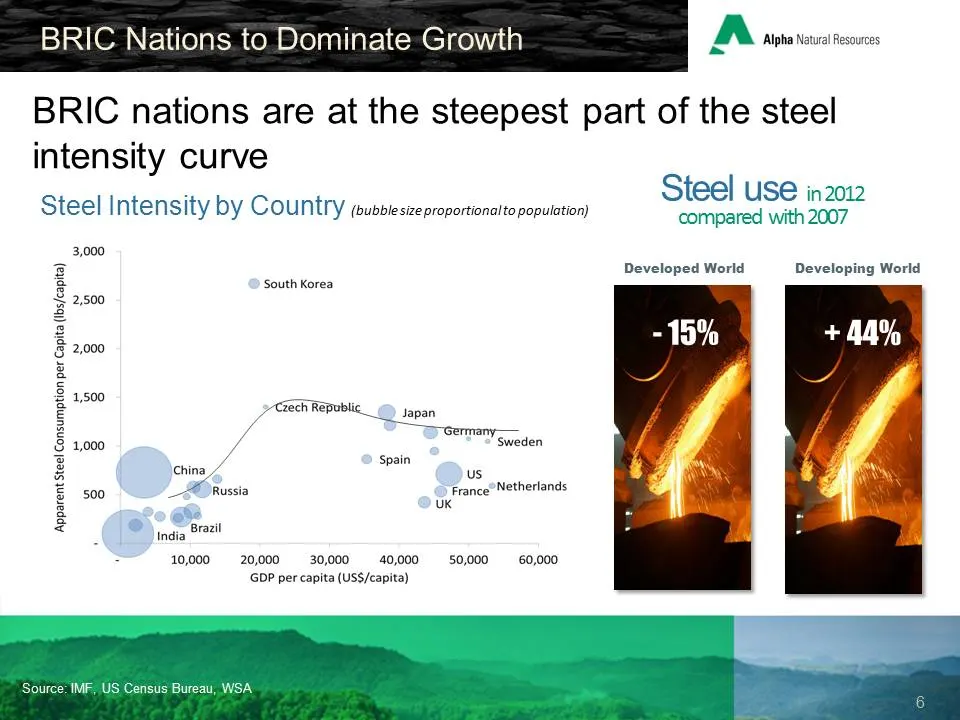
BRIC Nations to Dominate Growth A syncs BRIC nations are at the steepest part of the steel intensity curve Steel Intensity by COUNtrY (eubbiesiz proportionaito population) Steel use inzo2 compared with 2007 3,000 Developed World Developing World South Korea 2,500 2,000 1,500 — y/ Cech Repoblic_© sap
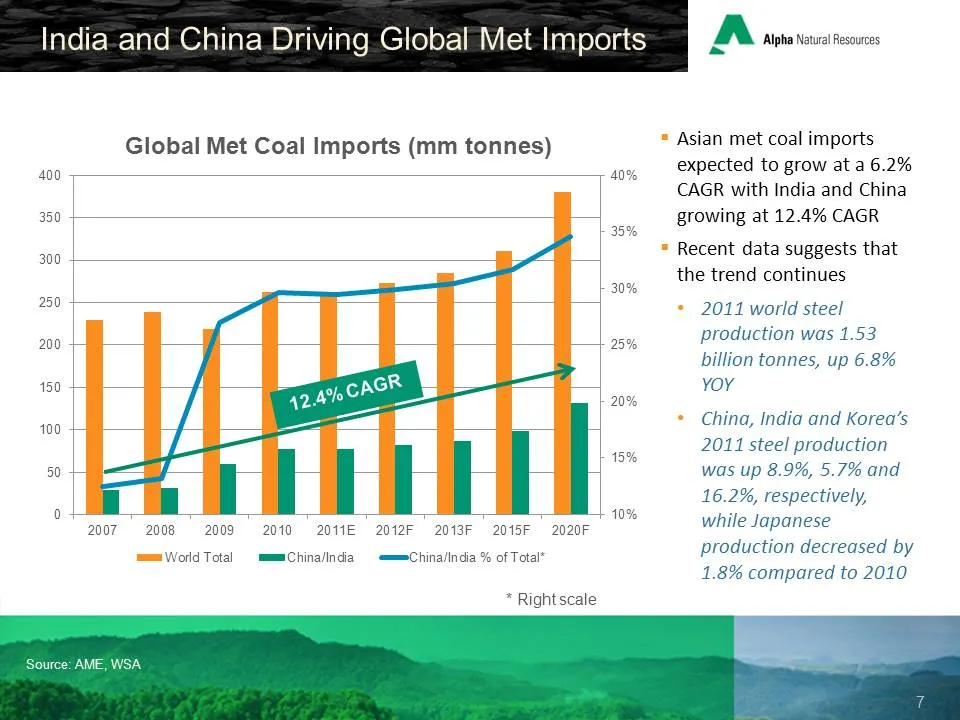
Slide 7: India and China Driving Global Met Imports
India-and China Driving. Global Met Imports Global Met Coal Imports (mm tonnes) 400 350 300 250 200 150 100 50 2007 Source: AME, WSA 40% 30% 15% 10% 2008 = 2009-2010 2011E--2012F« 2013F 2015F ~2020F World Total mmmChina/India- <mm=China/india % of Total” * Right scale A Alpha Natural Resources ~ Asi
Slide 8: Overview
Alpha Natural Resources Overview REY
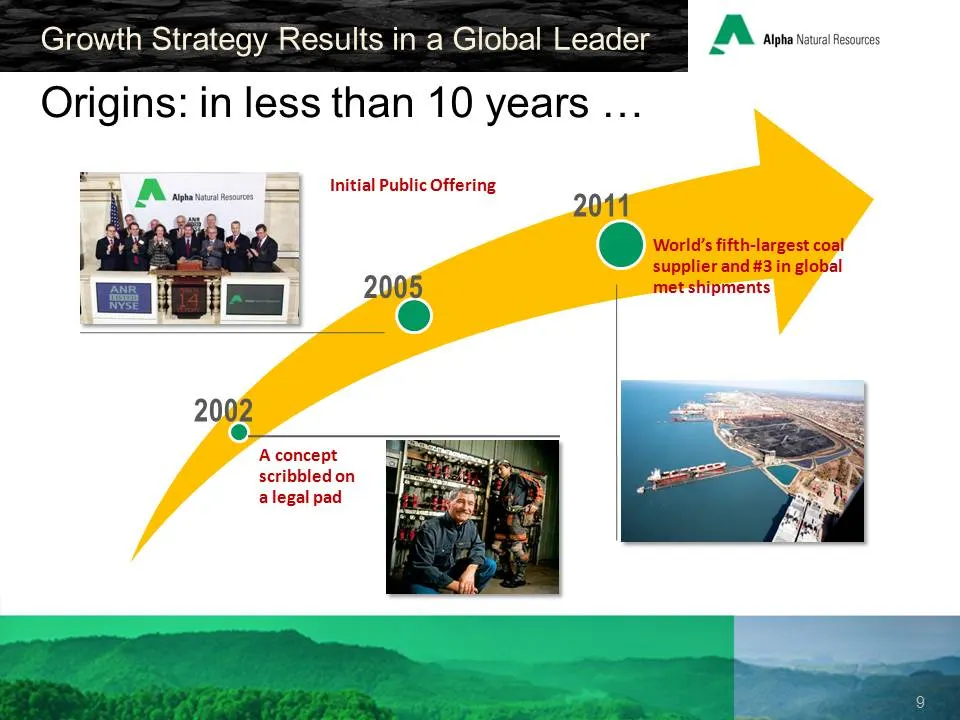
Slide 9: Growth Strategy Results in a Global Leader
Growth Strategy.Results ina Global Leader A Alpha Not Resouces Origins: in less than 10 years ... Initial Public Offering 2011 World’s fifth-largest coal supplier and #3 in global 2005, met shipments @ 2002 O Aconcept scribbled on alegal pad
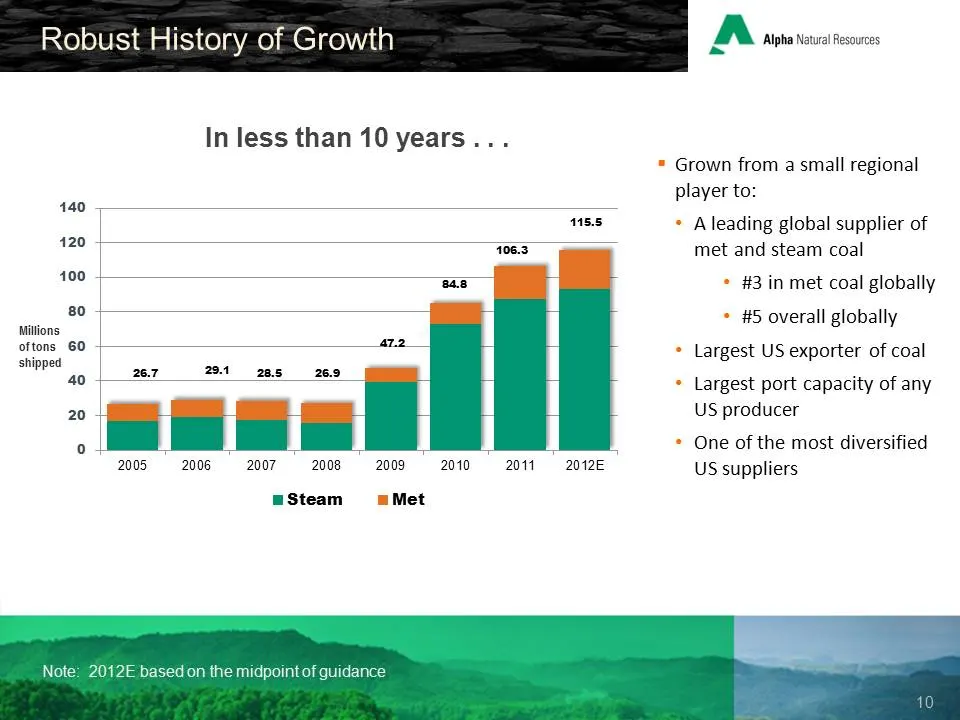
Slide 10: Robust History of Growth
Robust History of Growth A Aha Nal Resouces In less than 10 years... = Grown from a small regional player to: 140 115.5 * Aleading global supplier of 420, met and steam coal 100 * #3 in met coal globally 80 * #5 overall globally Mitions oftons 60 * Largest US exporter of coal shipped 40 * Largest po
Slide 11: Decisive Action in Market
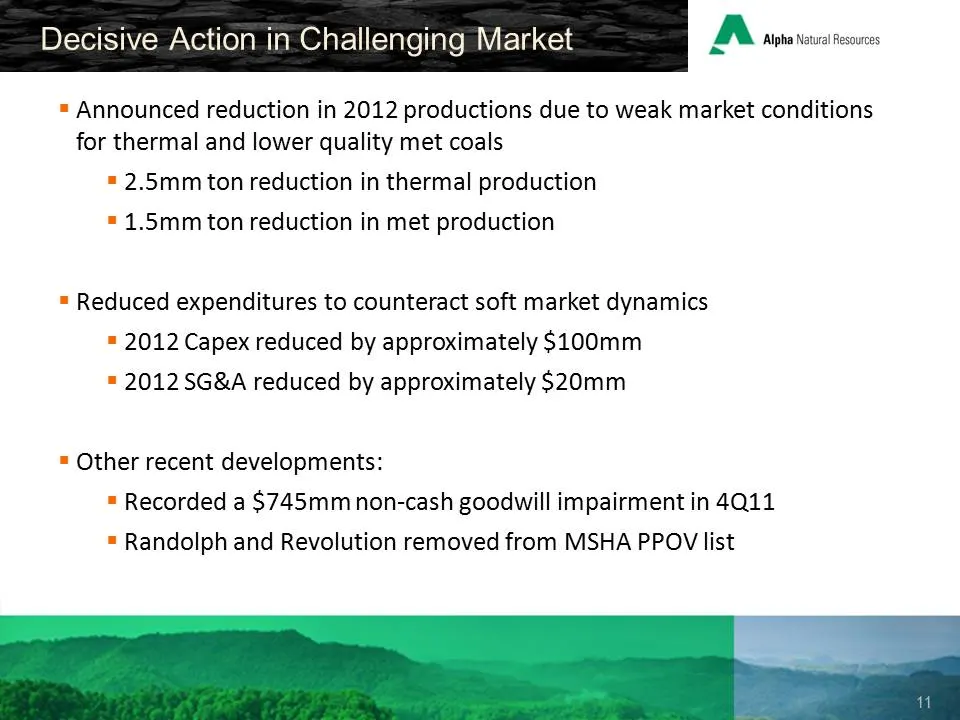
Decisive Action in Market sire seit = Announced reduction in 2012 productions due to weak market conditions for thermal and lower quality met coals = 2.5mm ton reduction in thermal production = 1.5mm ton reduction in met production = Reduced expenditures to counteract soft market dynamics = 2012 Cap
Slide 12: Create
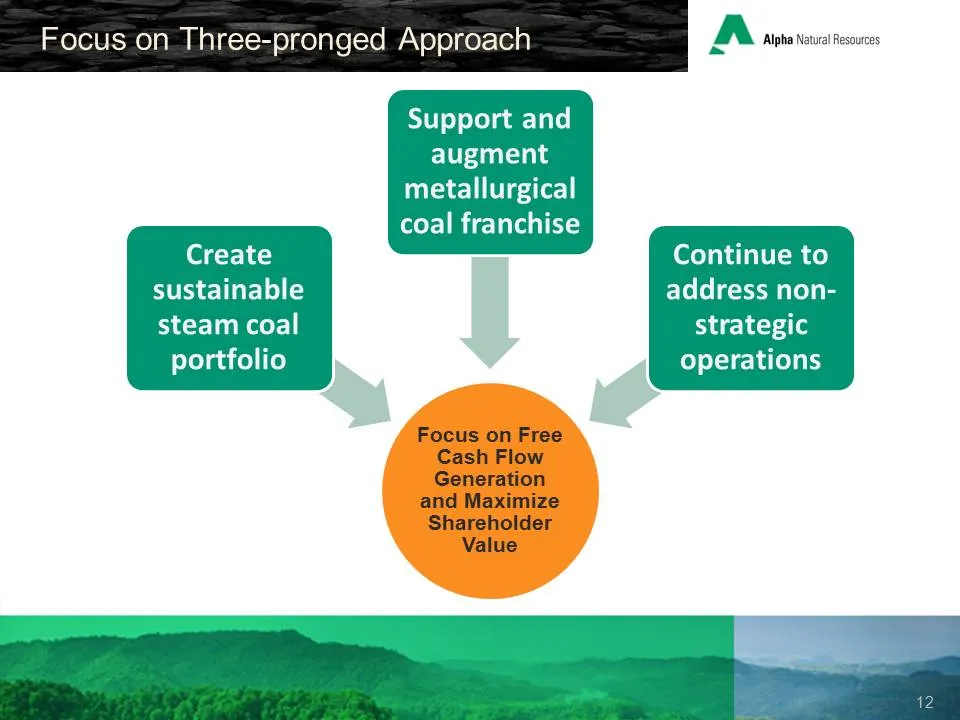
Create sustainable steam coal portfolio Support and augment metallurgical coal franchise Focus on Free Cash Flow Generation and Maximize Shareholder Value A Alpha Natural Resources ~ Continue to address non- strategic operations
Slide 13: Multiple Organic Met Coal Opportunities
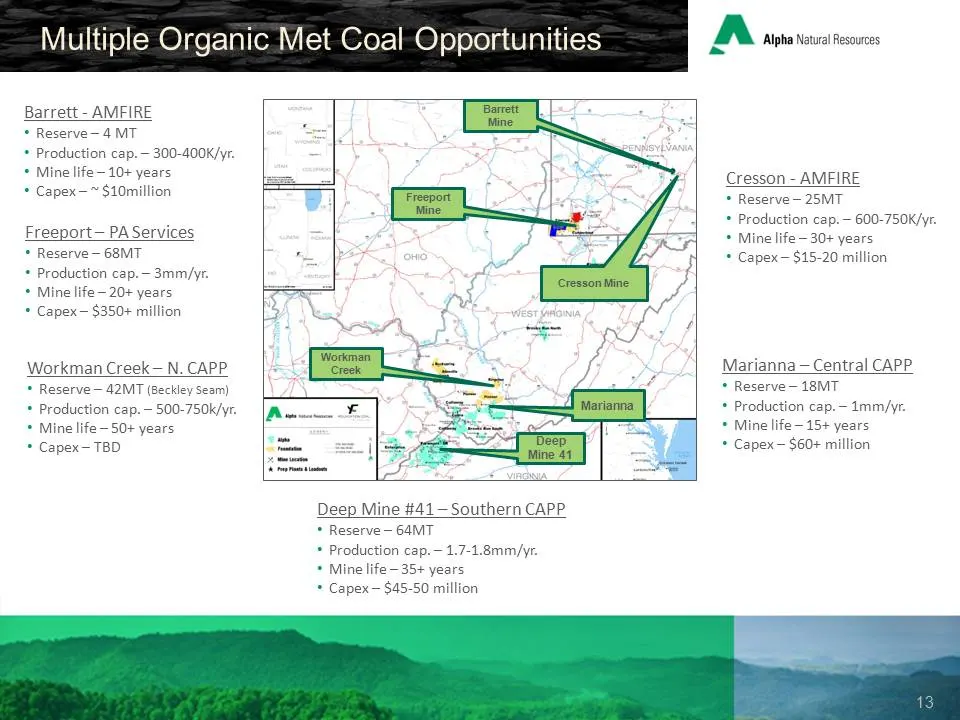
Multiple Organic. Met Coal Opportunities Barrett - AMFIRE * Reserve 4 MT * Production cap.— 300-400K/yr. * Mine life- 10+ years * Capex-~$10million Freeport— PA Services * Reserve— 68MT * Production cap.— 3mm/yr. * Mine life-20+ years * Capex — $350+ million Workman Creek — N. CAPP * Reserve — 42MT
Slide 14: Leading Global Supplier
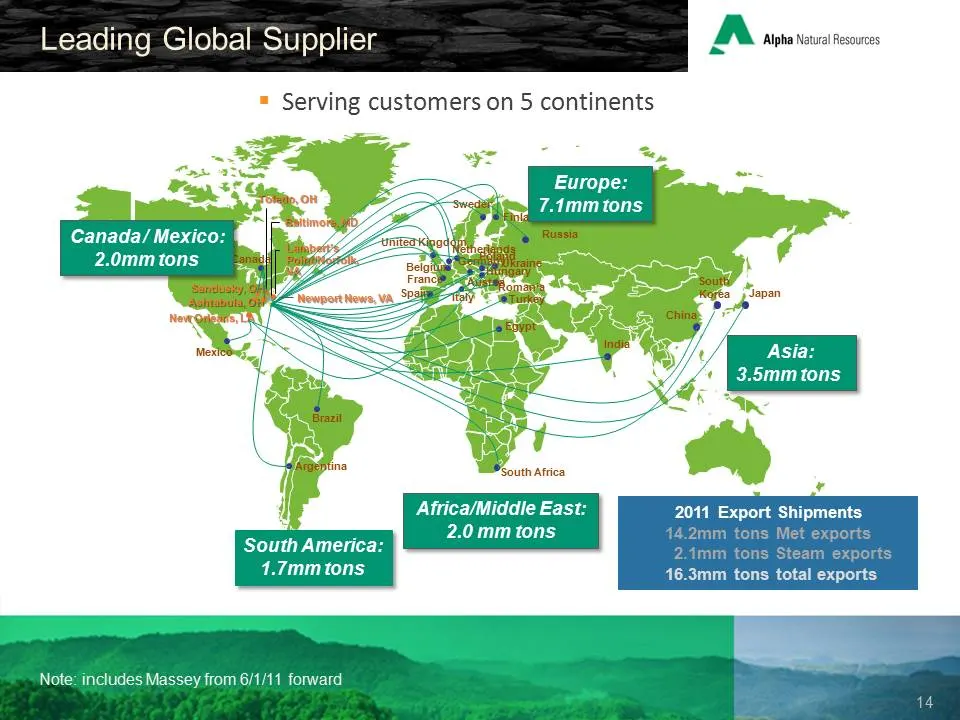
Leading Global Supplier A Aha Nal Resouces = Serving customers on 5 continents Canada/ Mexico: 2.0mm tons 2011 Export Shipments ee 5 oe Note: includes Massey from 6/1/11 forward
Slide 15: Port Diversity
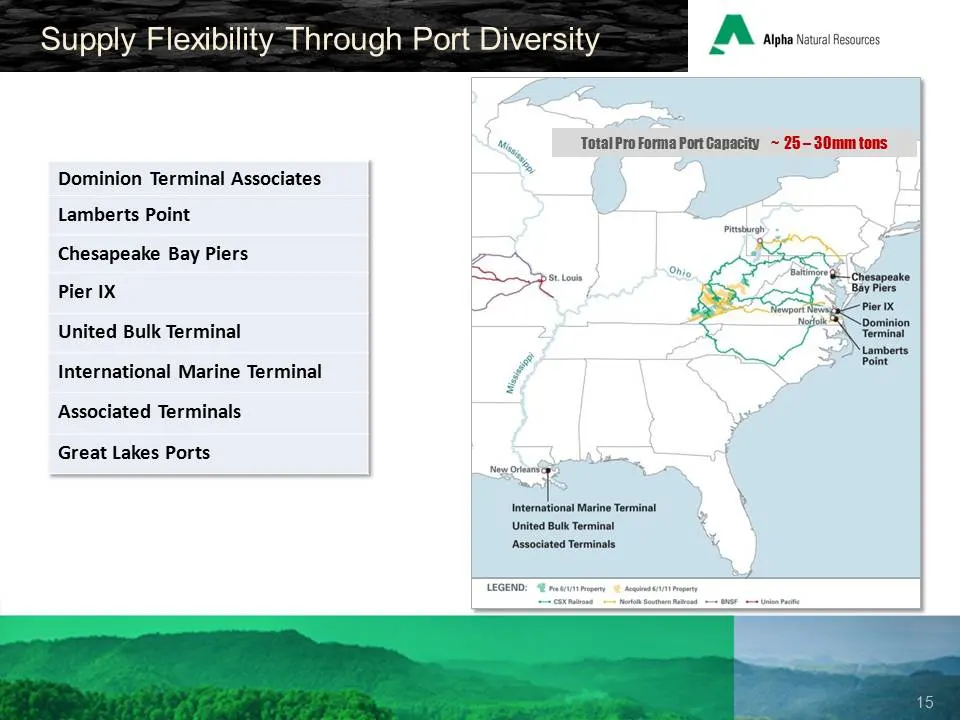
Dominion Terminal Associates Lamberts Point Chesapeake Bay Piers Pier IX United Bulk Terminal International Marine Terminal Associated Terminals Great Lakes Ports gh Port Diversity A Alpha Natural Resources ~ Mm, Total Pro Forma Port Ganacity ~ 25-30mm tons ~ Ae on, aati Ge OL sveake Bay Plers Sepon
Slide 16: Operational Diversification
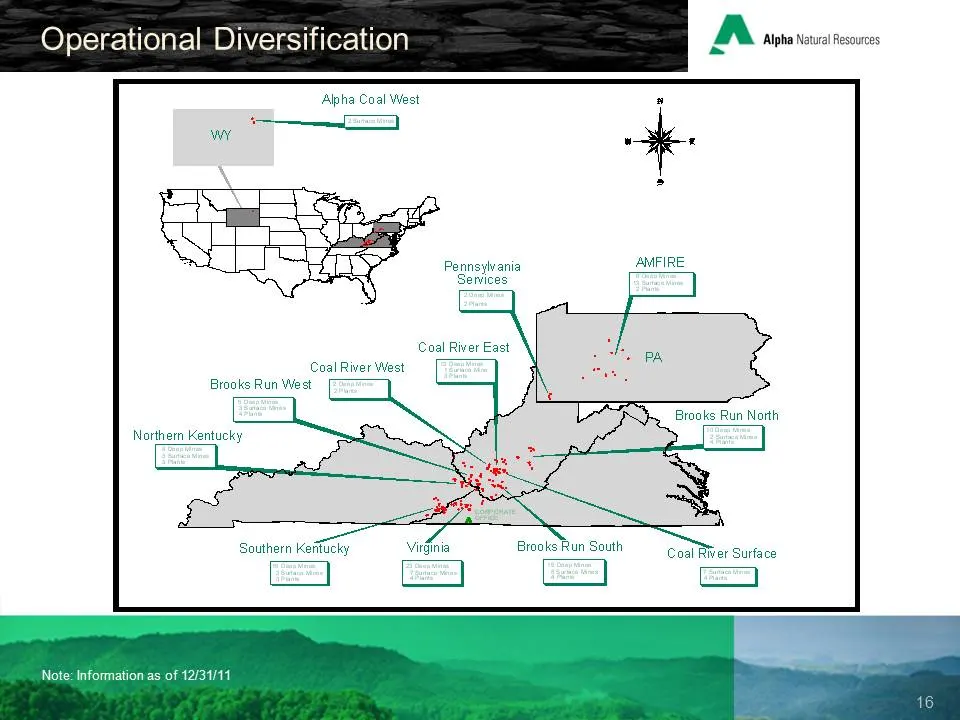
Operational Diversification Alpha Coal West | Pennsylvania Services Coal River East Coal River West Brooks Run West [==] Northern Kentucky A Alpha Natural Resources - Brooks Run North Southern Keftucky Virginia Brooks Run South Coal RWver Surface Note: Information as of 12/31/11
Slide 17: Integration Progressing Well
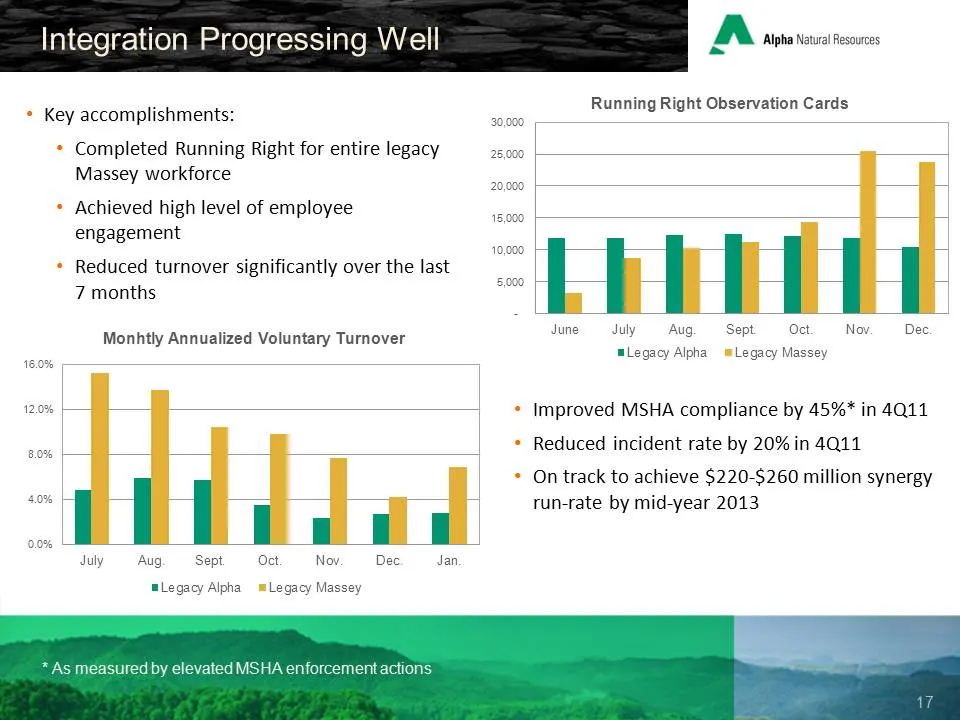
Integration Progressing Well A Alpha tel Resouces " Running Right Ob: ition Card: * Key accomplishments: 50080 unning Rig Servation Cards * Completed Running Right for entire legacy 25,000 Massey workforce * Achieved high level of employee engagement * Reduced turnover significantly over the last 7
Slide 18: Optimization Creates Sizeable FCF Upside
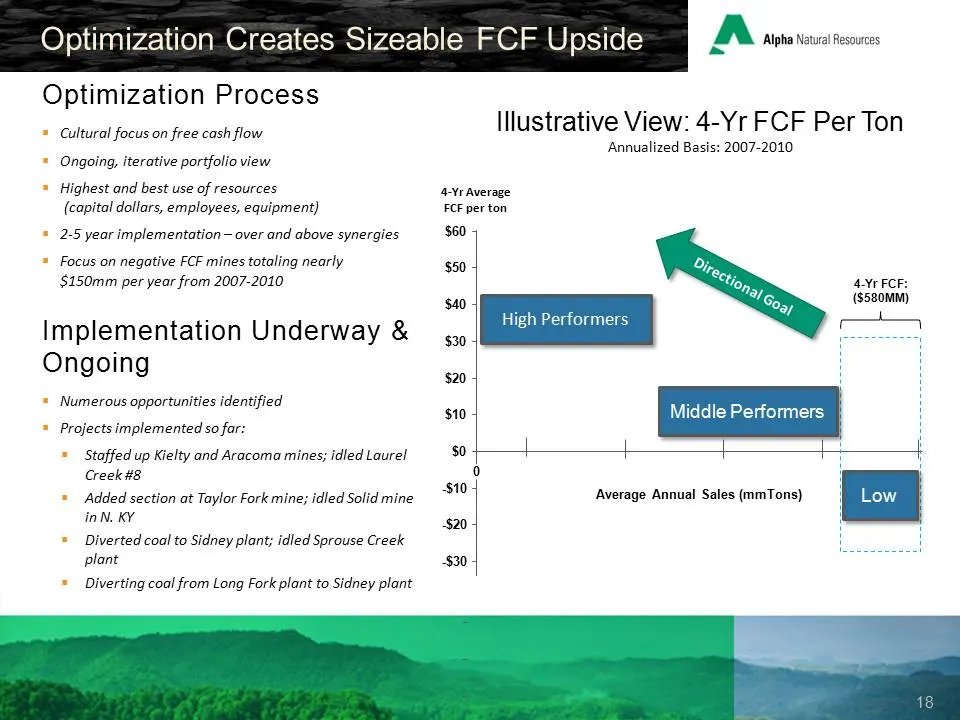
Optimization Creates Sizeable FCF Upside Optimization Process * Cultural focus on free cash flow * Ongoing, iterative portfolio view * Highest and best use of resources (copital dollars, employees, equipment) = 2.5 year implementation - over and above synergies = Focus on negative FCF mines totaling
Slide 19: Financial Overview
Financial Overview Resources to Enhance Shareholder Value
Slide 20: ANR: Financial Highlights
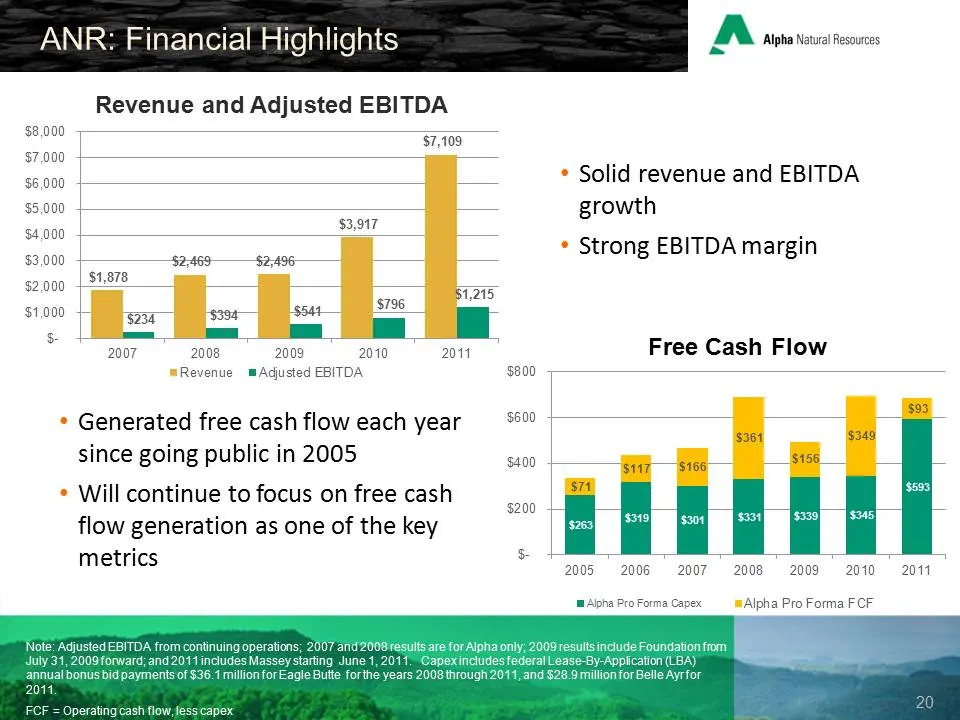
ANR: Financial Highlights A pesca Revenue and Adjusted EBITDA $8,000 | $7,108 $7,000 . $6,000 ¢ Solid revenue and EBITDA $5,000 | growth $4,000 Suet . | * Strong EBITDA margin a0 i aus jl ji ‘ 81.215 5796 Bs oS oe oo — | 2007 2008 2009 2010 2011 Free Cash Flow mRevenue mAdjusted EBITDA $800 $93 * Ge
Slide 21: Liquidity Remains Strong Post-Merger
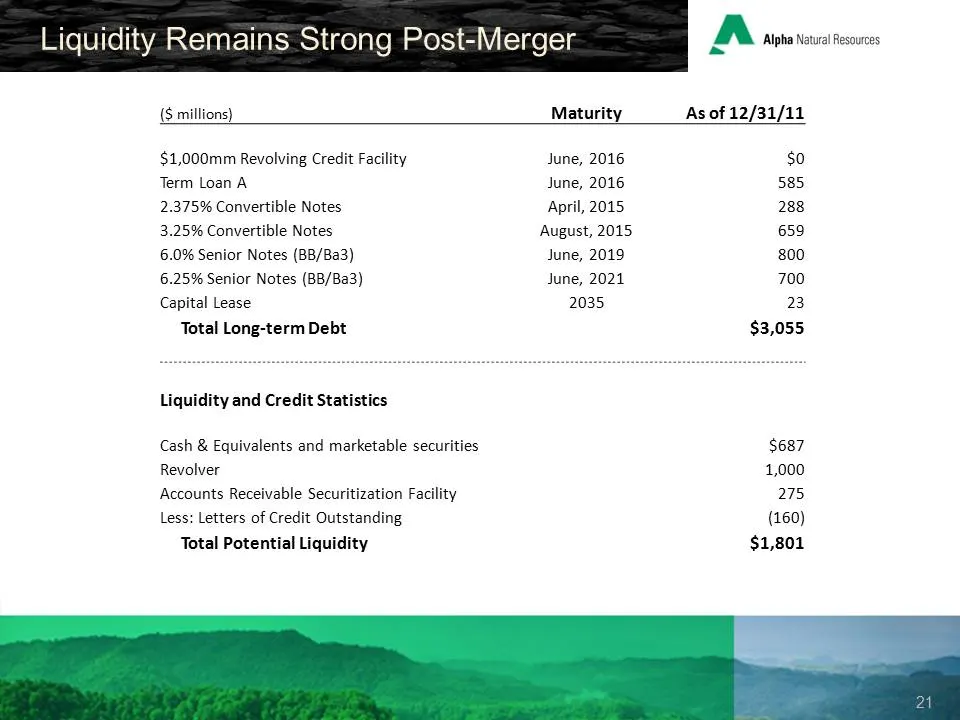
Liquidity Remains Strong Post-Merger A Alpha Nw Resouces {$ millions) Maturity As of 12/31/11 $1,000mm Revolving Credit Facility June, 2016 so Term Loan A June, 2016 585 2.375% Convertible Notes April, 2015 288 3.25% Convertible Notes August, 2015 659 6.0% Senior Notes (BB/Ba3) June, 2019 800 6.25%
Slide 22: Summary Highlights
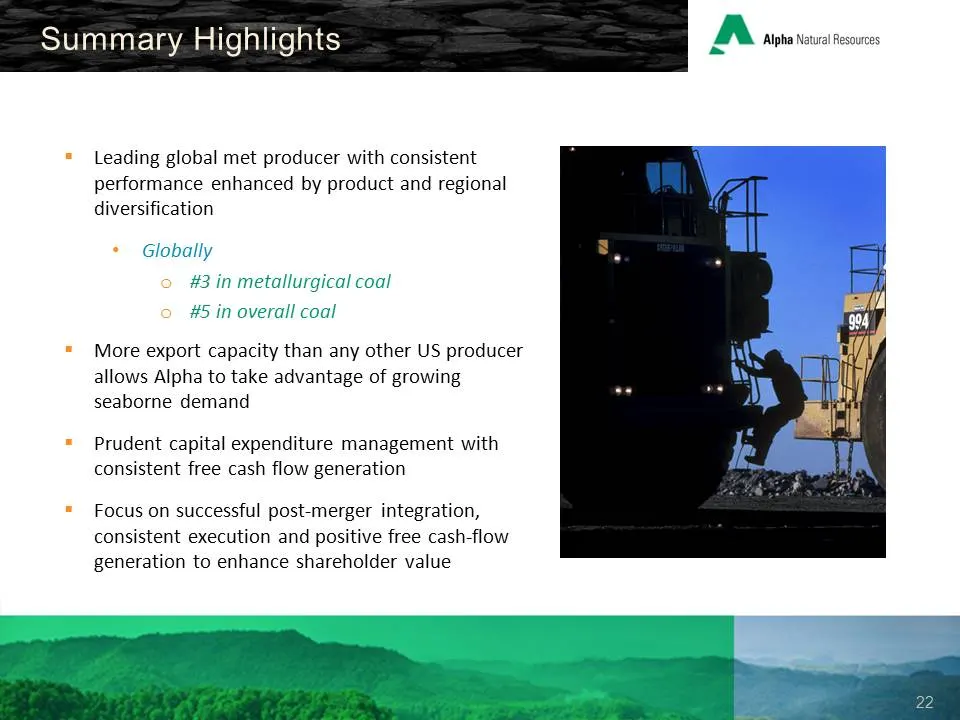
. 7 B Summary. Highlights 5 A Alpha Natural Resources Leading global met producer with consistent performance enhanced by product and regional diversification bally #3 in metal ical coal #5 in overall coal = More export capacity than any other US producer allows Alpha to take advantage of growing se
Slide 23: Appendices
A Alpha Natural Resources ~ A Alpha Natural Resources 7 ~ Appendices www.alphanr.com
Slide 24: Reconciliation
Reconciliation A Alpha Natural Resources Use of Non-GAAP Measures In addition to the results prepared in accordance with generally accepted accounting principles in the United States (GAAP) provided throughout this presentation, Alpha has presented the following non-GAAP financial measures, which ma
Slide 25: Reconciliation of Adjusted EBITDA
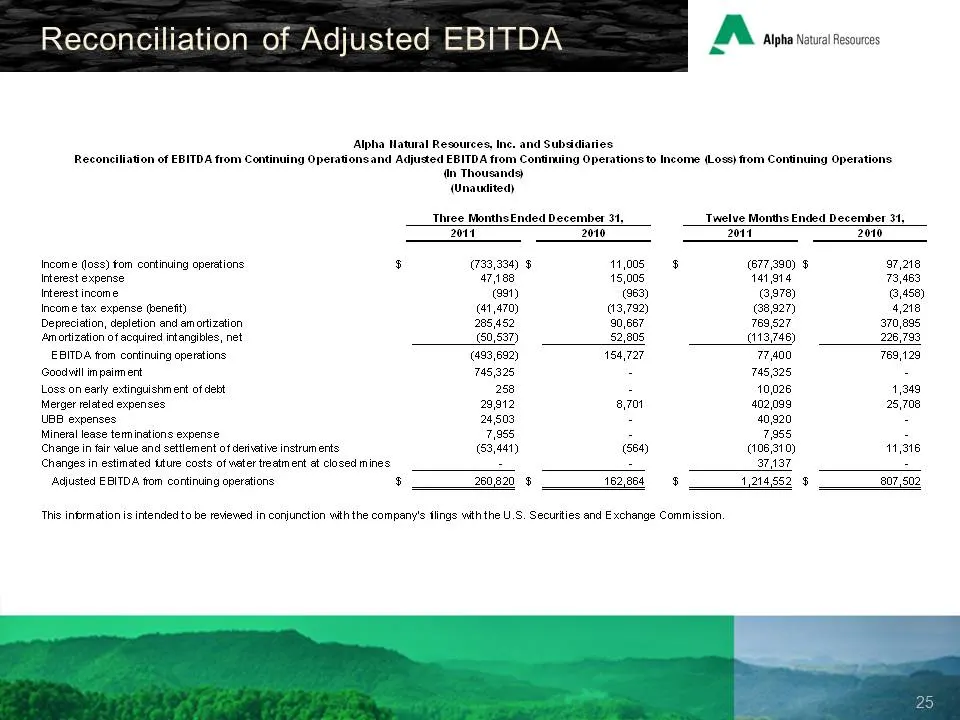
Reconciliation of Adjusted EBITDA A sporscstececs Alpha Hatural Resources, Ine. and Subsidiaries \9 Opetationsand Adjusted EBITDA from Continuing Operations to Income (Loss) from Continuing Operations dn Thousands) (Wnaualited) Reconciliation of EBITDA from Con Three MonthsEnded December 31, Twelve
Slide 26: Reconciliation of Adjusted Income
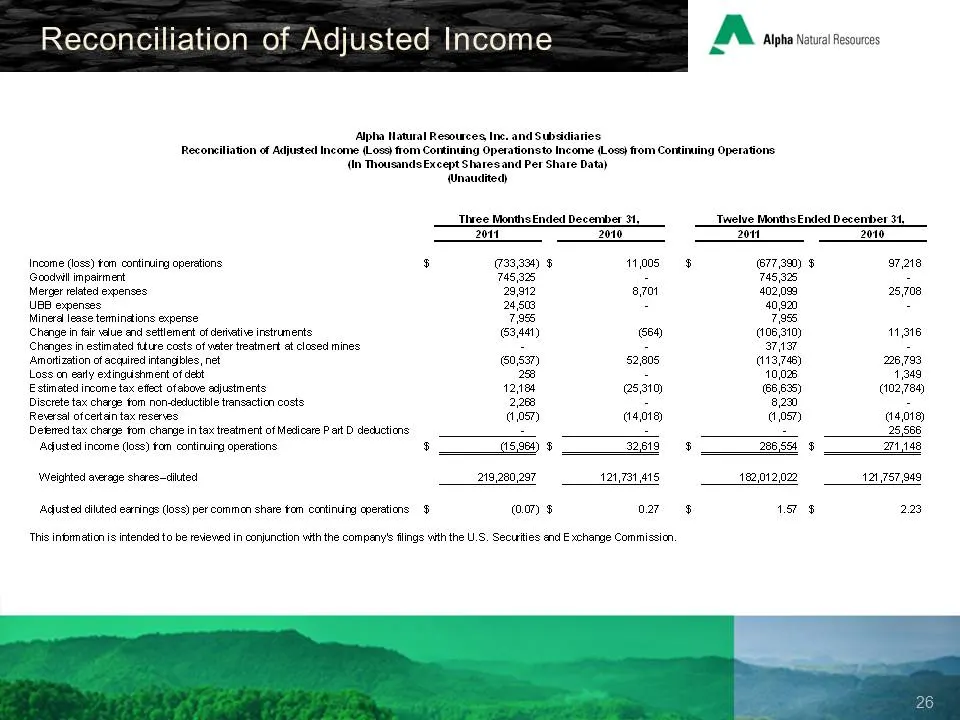
Reconciliation of Adjusted Income A Alpha tel Resouces ‘Alpha Hatural Resources Ine. and Subsidiaries Reconeiliation of Adjusted Income (Loss) from Continuing Opetationsto Income (Loss) from Conti (ln Thousands Except Sharesand Per Share Data) Unaudited) ‘Thvee Months Ended December 31. ‘Twelve Mont
Source: SEC EDGAR · 8-K filed Feb 27, 2012
More decks from Alpha Natural Resources Inc
 J.P. Morgan Global High Yield & Leveraged Finance Conference (February 2015)36 slides · Feb 23, 2015
 Barclays CEO Energy-Power Conference 201435 slides · Sep 2, 2014
 2014 BMO 23rd Global Metals and Mining Conference; Sterne Agee 2014 Boston Executive Summi33 slides · Jun 17, 2014
 2014 BMO 23rd Global Metals and Mining Conference / Brean Capital 2014 Global Resources &30 slides · May 28, 2014
 2014 BMO 23rd Global Metals and Mining Conference30 slides · Feb 24, 2014
 Tuohy Brothers' 4th Annual Energy Conference (August 2013)26 slides · Aug 5, 2013