Encore Bancshares — Investor Presentation (February 2009)
24 slides from Encore Bancshares's investor presentation, Feb 25, 2009

Slide 1: Investor Presentation February 2009
NASDAQ: EBTX Investor Presentation February 2009 Exhibit 99.1
Slide 2: Forward-Looking Statements
Forward-Looking Statements • This presentation may include forward-looking statements. These forward-looking statements include comments with respect to assumptions relating to projected growth, earnings, earnings per share and other financial performance measures, as well as management’s short-term

Slide 3: Encore Profile
Encore Profile • Company Type: Financial Holding Company and Wealth Management Organization • Headquarters: Houston, Texas • Total Assets: $1.6 billion • Total Loans: $1.2 billion • Total Deposits: $1.1 billion • Total Equity: $186 million • Tier 1 Risked-Based Capital: • Assets Under Management: $2

Slide 4: Operating Philosophy
Operating Philosophy • Focus on professional firms, privately-owned businesses, investors and affluent individuals • Individual clients generally have a net worth of between $500,000 and $20 million • Highly personalized service through private banker or relationship manager • Hire and retain experi
Slide 5: Total Loans & Deposits
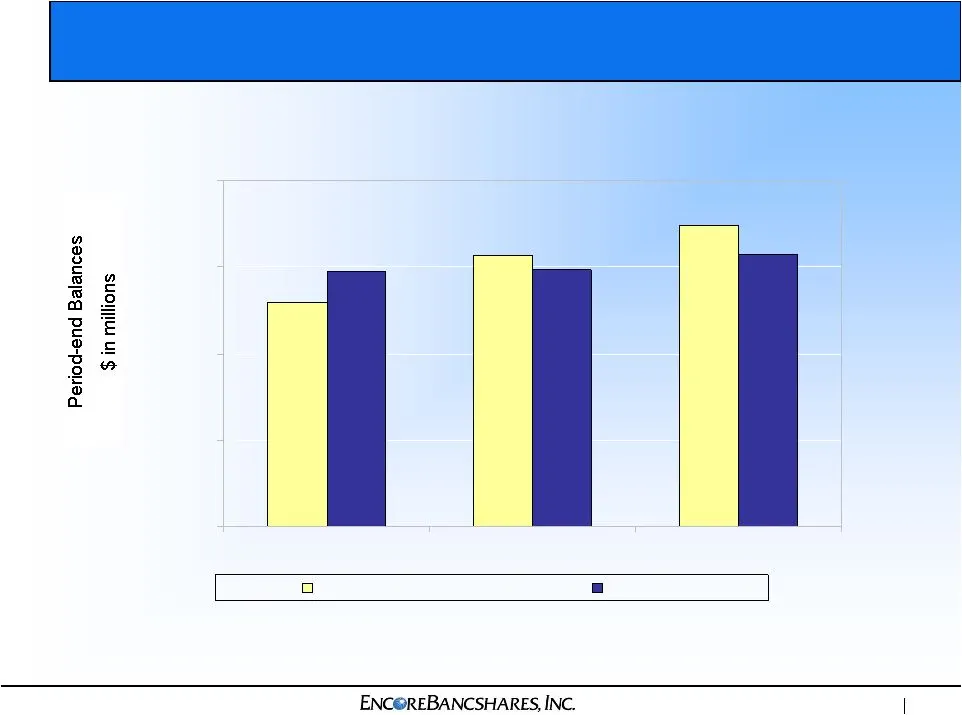
Total Loans & Deposits 1,097 1,031 1,218 1,041 1,101 1,050 1,400 Total Loans Deposits
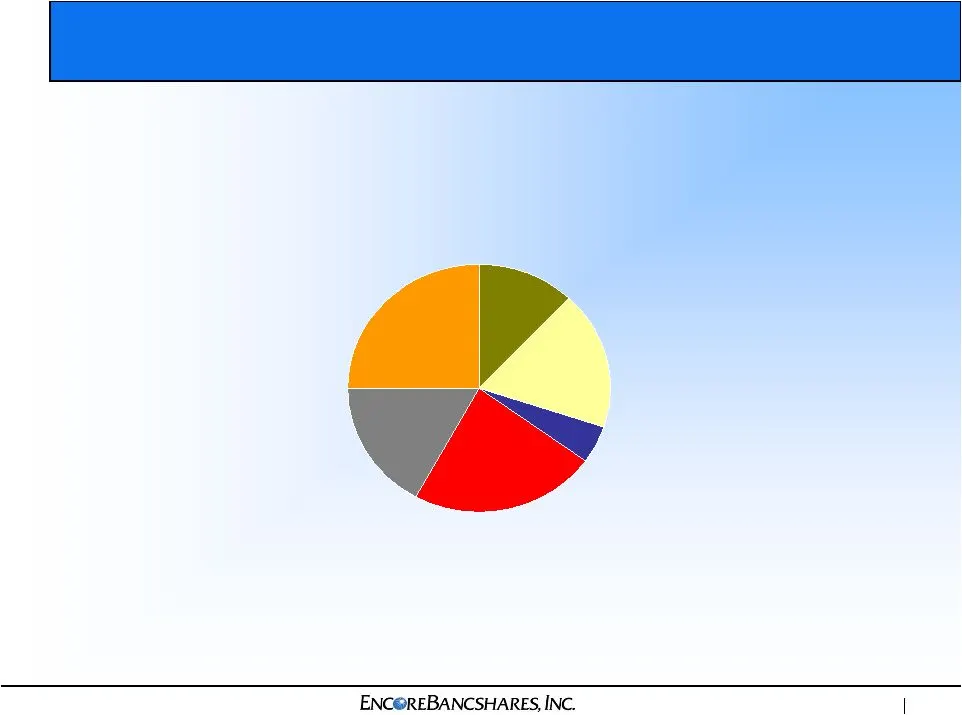
Slide 6: Diversified Loan Mix
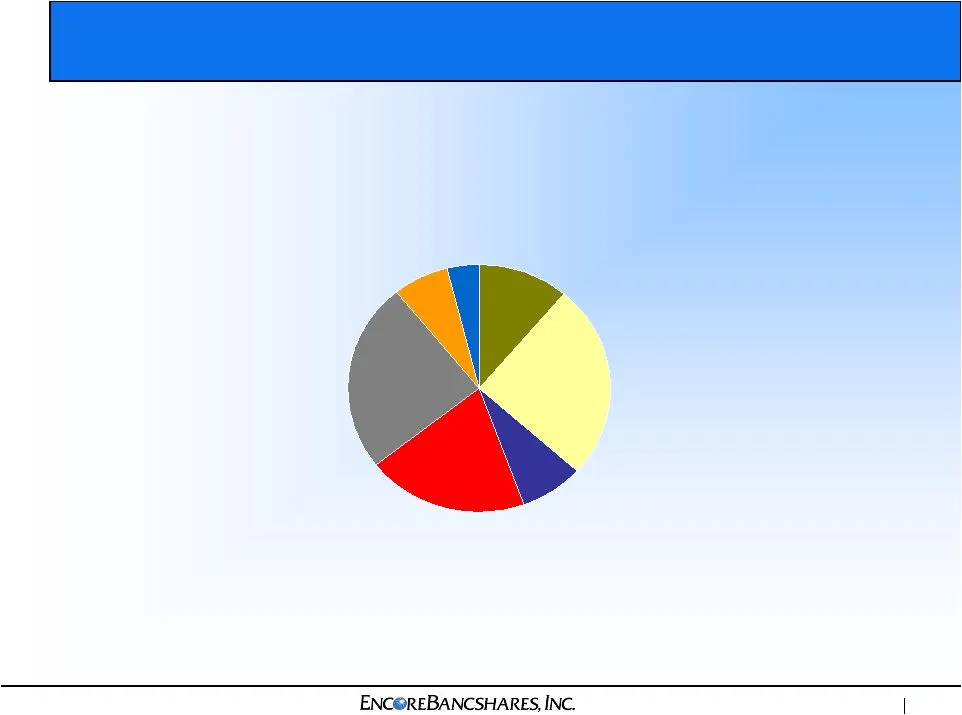
Diversified Loan Mix Consumer Residential 2nd lien Commercial Home equity lines Commercial real estate Real estate construction Residential 1st lien Total Loans: $1.2 billion December 31, 2008
Slide 7: Loan Portfolio Concentrations – Real Estate
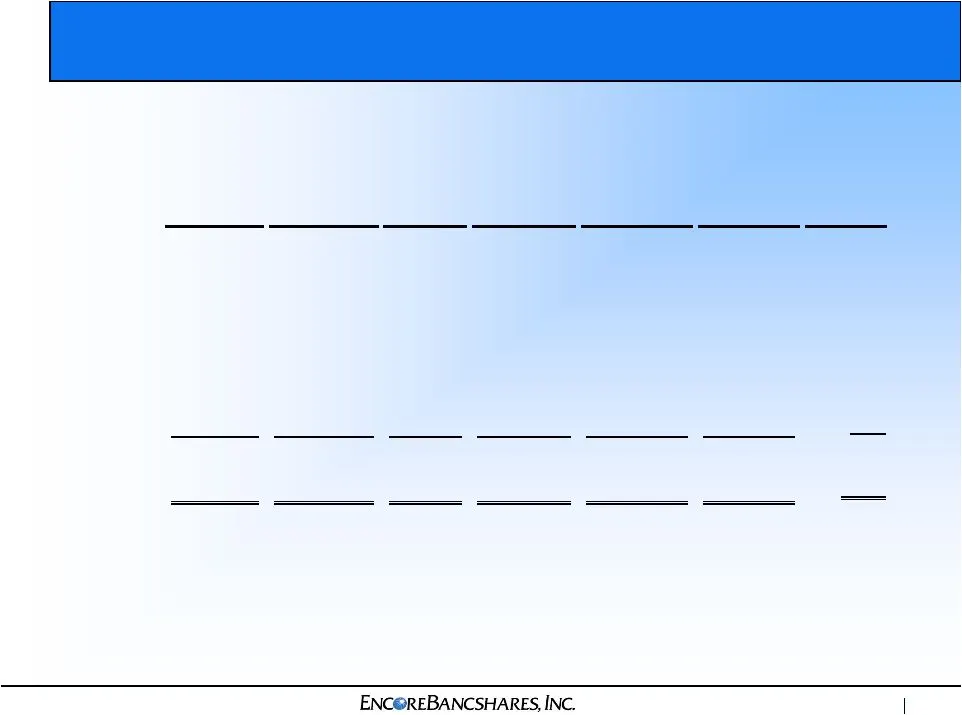
Loan Portfolio Concentrations – Real Estate ($ in thousands) As of Dec 31, 2008 * Loans in any other individual state do not exceed 1.0% of total loans. Residential Residential Home Percent of Mortgage- Mortgage- Equity Commercial Real Estate Total First Lien Second Lien Lines Real Estate Constructi
Slide 8: Deposit Mix
Deposit Mix Money market and savings Brokered deposits Interest checking Time deposits $100,000 and greater Noninterest- bearing deposits Time deposits less than $100,000 Total Deposits $1.1 billion December 31,2008

Slide 9: Earnings
Earnings Fourth Quarter 2008 Earnings Include: • $6.0 million (pre-tax) charge-off of a loan to a high net worth professional • $10.5 million (pre-tax) increase to loan loss reserves, resulting in an allowance for loan losses to total loans of 2.06% • $2.0 million (pre-tax) impairment charge of a CR
Slide 10: Encore Bancshares, Inc.
ENC@REBANCSHARES, INC.
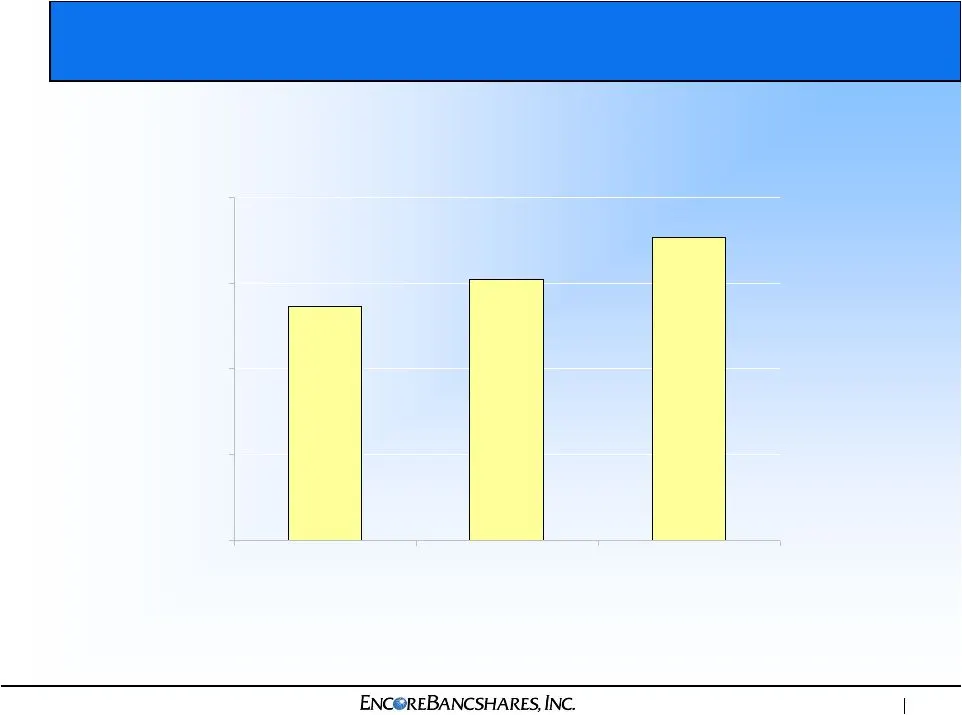
Slide 11: Net Interest Income
Net Interest Income 44,274 34,175 30,173 12,500 25,000 37,500 50,000
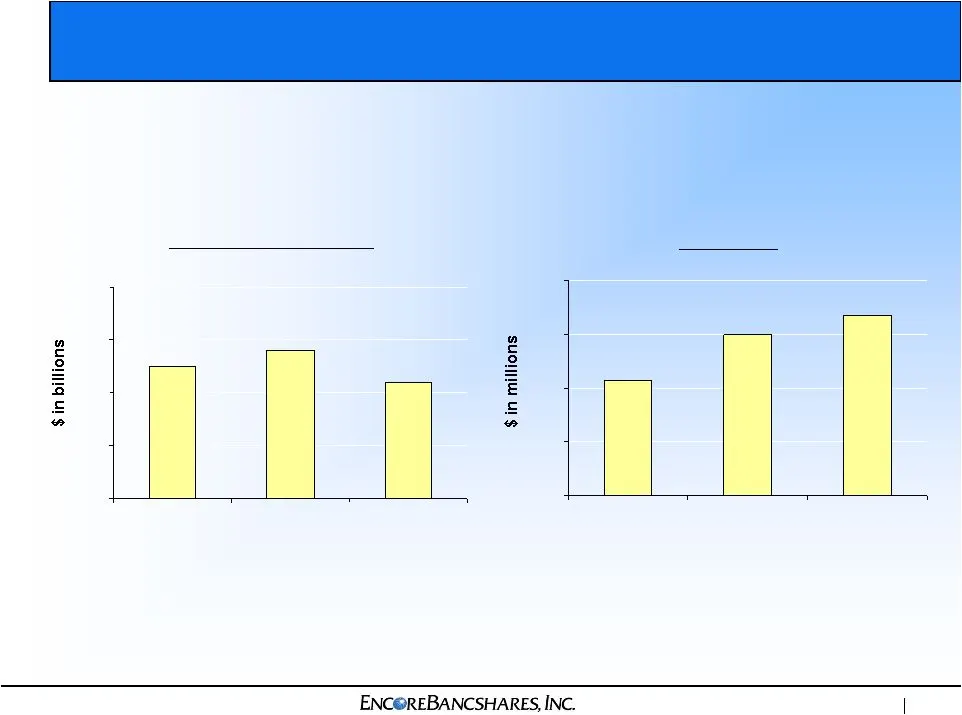
Slide 12: Wealth Management Business
Wealth Management Business 2.7 4.2 3.7 0.0 1.3 2.5 3.8 5.0 Net Earnings 2.5 2.2 2.8 0.0 1.0 2.0 3.0 4.0 Assets Under Management
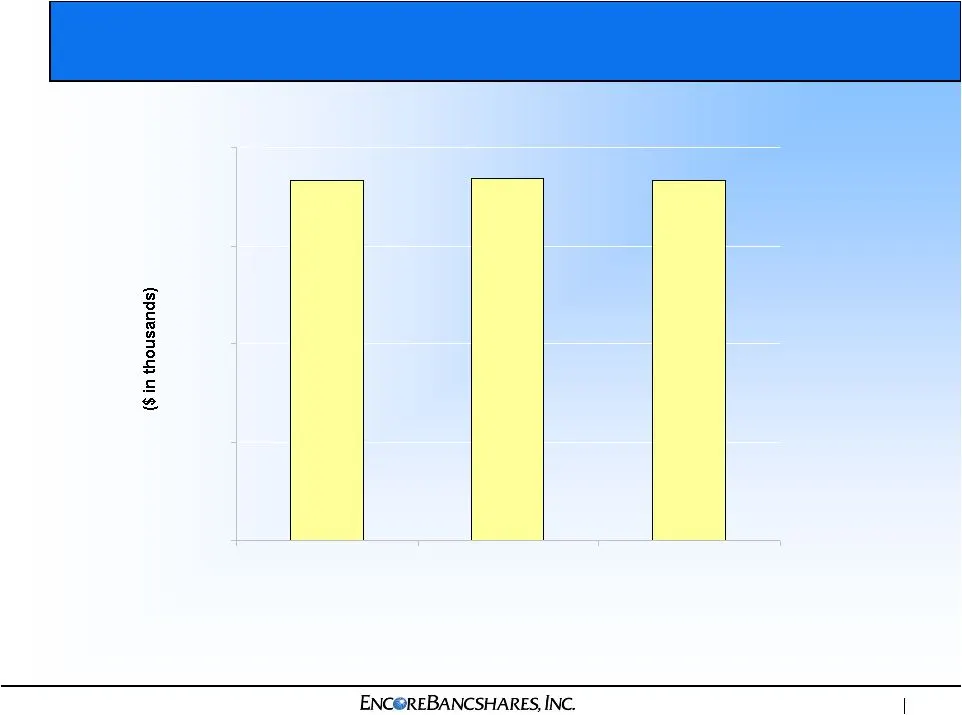
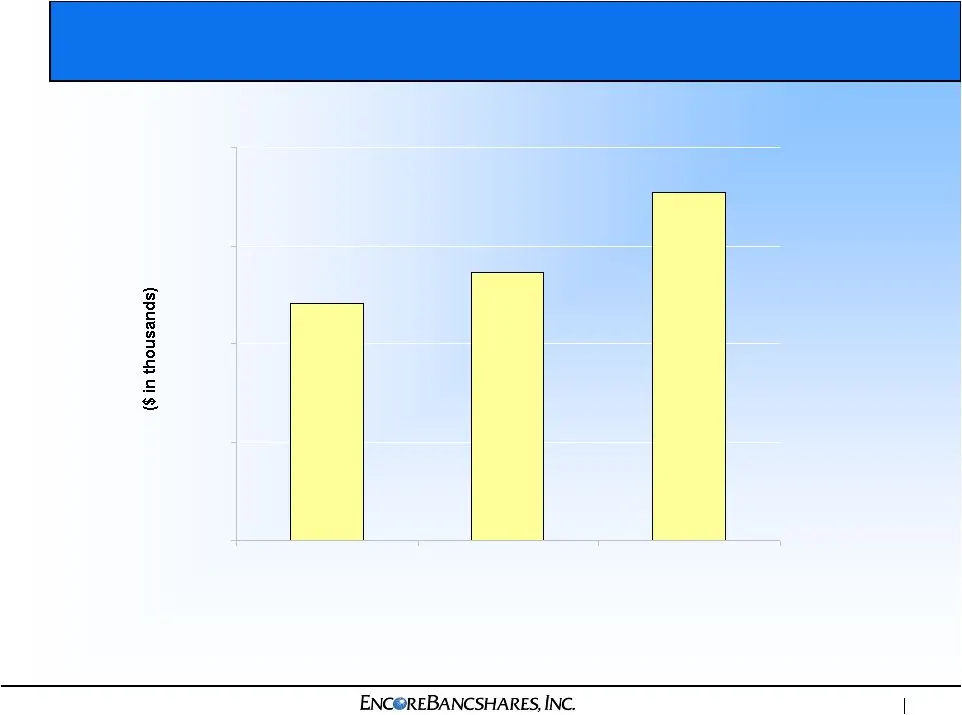
Slide 13: Noninterest Expenses
Noninterest Expenses 50,361 50,607 50,338 13,750 27,500 41,250 55,000
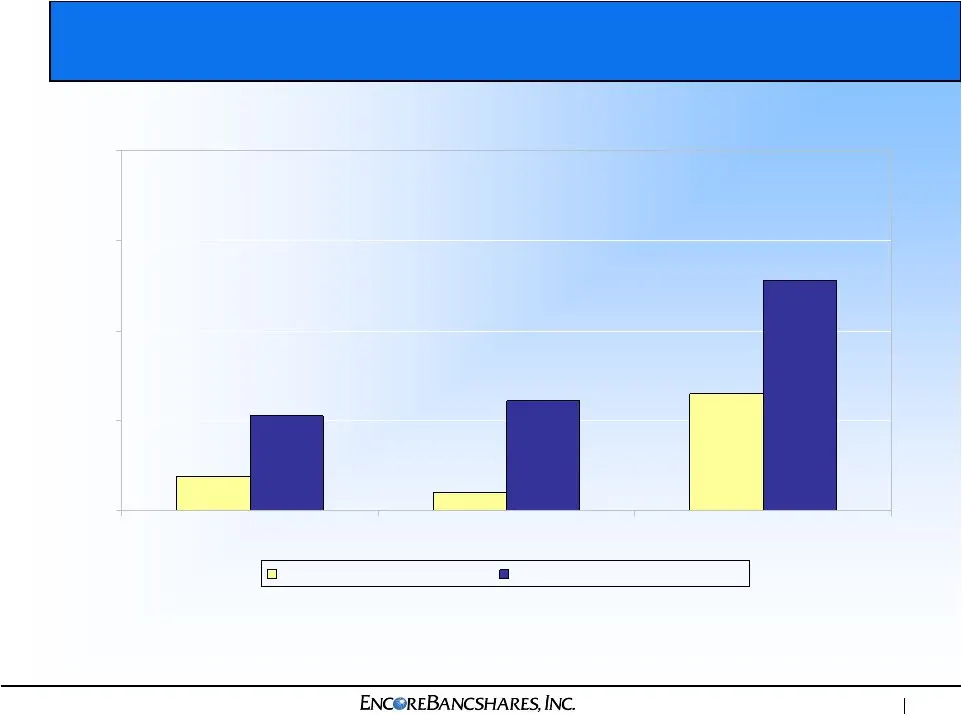
Slide 14: Asset Quality
Asset Quality Net Charge-offs/ Avg Loans Non-performing Loans/ Loans
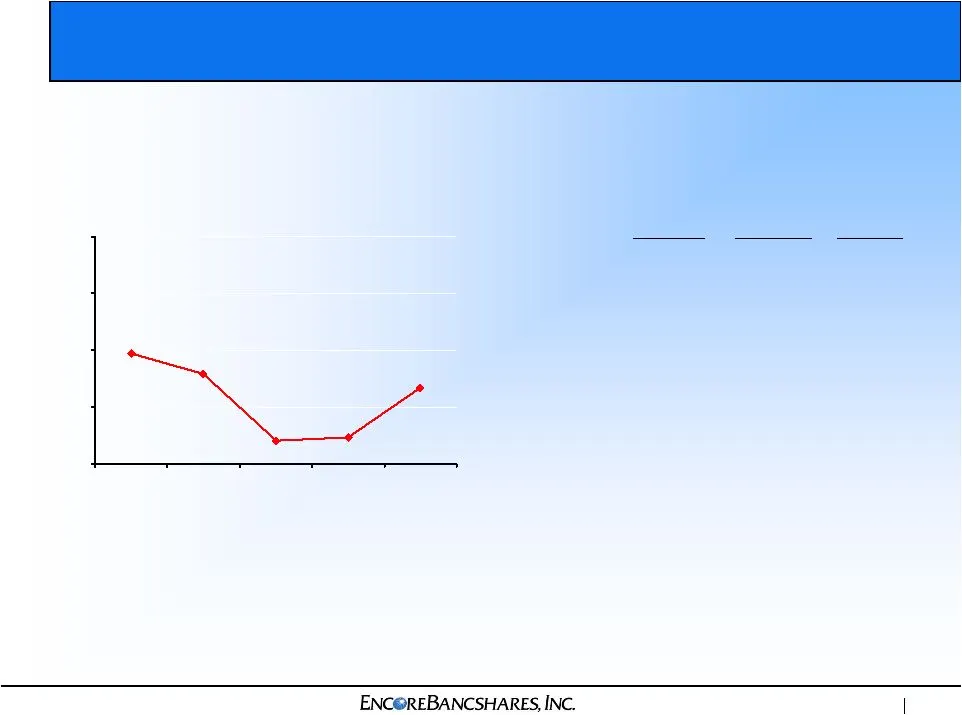
Slide 15: Commercial Loan Delinquencies
Commercial Loan Delinquencies Q4 07 Q1 08 Q2 08 Q3 08 Q4 08 30 Day + Delinquencies Trend 4Q08 3Q08 4Q07 EOP Portfolio $ 135,534 $ 130,484 $ 127,583 Net charge-offs ($) $ 5,839 $ $ (20) Net charge-offs (%) -0.07% Nonperforming ($) $ 5,643 $ 1,050 $ 7,615 Nonperforming (%)
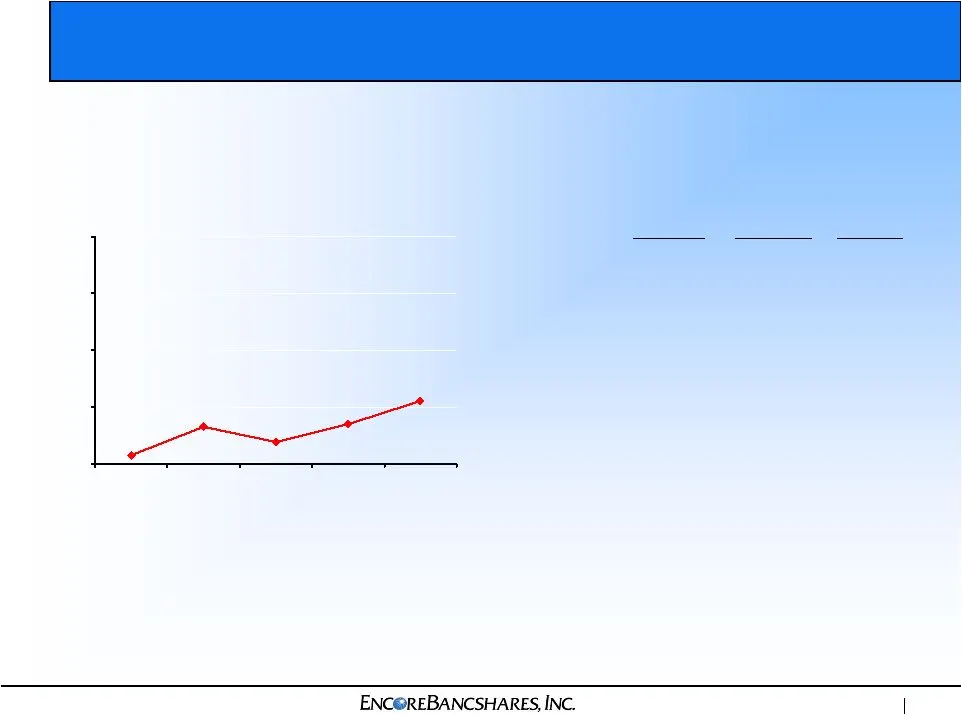
Slide 16: Commercial Real Estate Loan Delinquencies
Commercial Real Estate Loan Delinquencies Q4 07 Q1 08 Q2 08 Q3 08 Q4 08 30 Day + Delinquencies Trend 4Q08 3Q08 4Q07 EOP Portfolio $ 311,909 $ 305,570 $ 277,047 Net charge-offs ($) $ $ $ Net charge-offs (%) Nonperforming ($) $ 11,267 $ 7,695 $ Nonperforming (%)
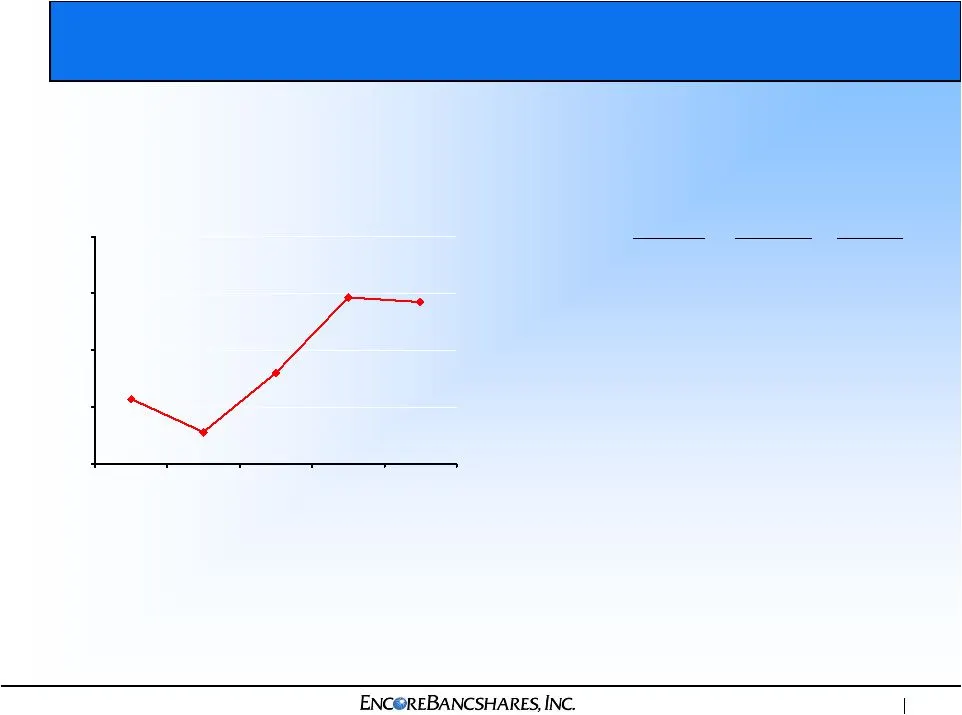
Slide 17: Construction Loan Delinquencies
Construction Loan Delinquencies Q4 07 Q1 08 Q2 08 Q3 08 Q4 08 30 Day + Delinquencies Trend 4Q08 3Q08 4Q07 EOP Portfolio $ 95,668 $ 96,450 $ 100,975 Net charge-offs ($) $ $ $ Net charge-offs (%) Nonperforming ($) $ 9,878 $ 9,122 $ 2,661 Nonperforming (%)
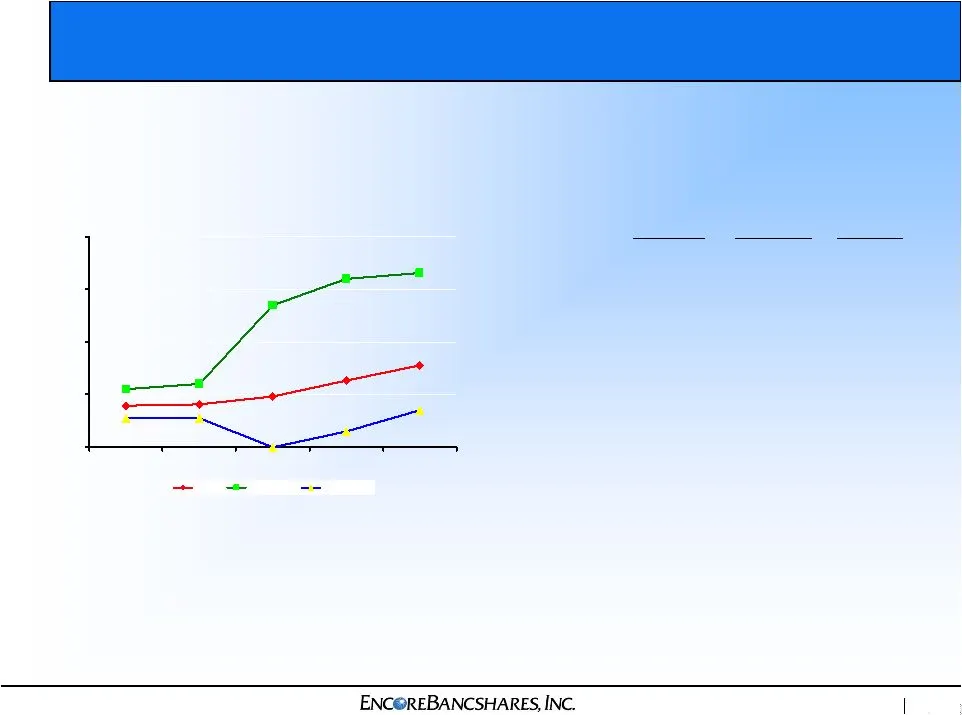
Slide 18: Residential First Mortgage Loan Delinquencies
Residential First Mortgage Loan Delinquencies Q4 07 Q1 08 Q2 08 Q3 08 Q4 08 1st Mtg 1st Mtg SBO 1st Mtg Orig 30 Day + Delinquencies Trend 4Q08 3Q08 4Q07 EOP Portfolio $ 241,969 $ 247,765 $ 271,346 Net charge-offs ($) $ $ $ Net charge-offs (%) Nonperforming ($) $ 3,581 $ 2,812 $ 1,978 Nonperforming (
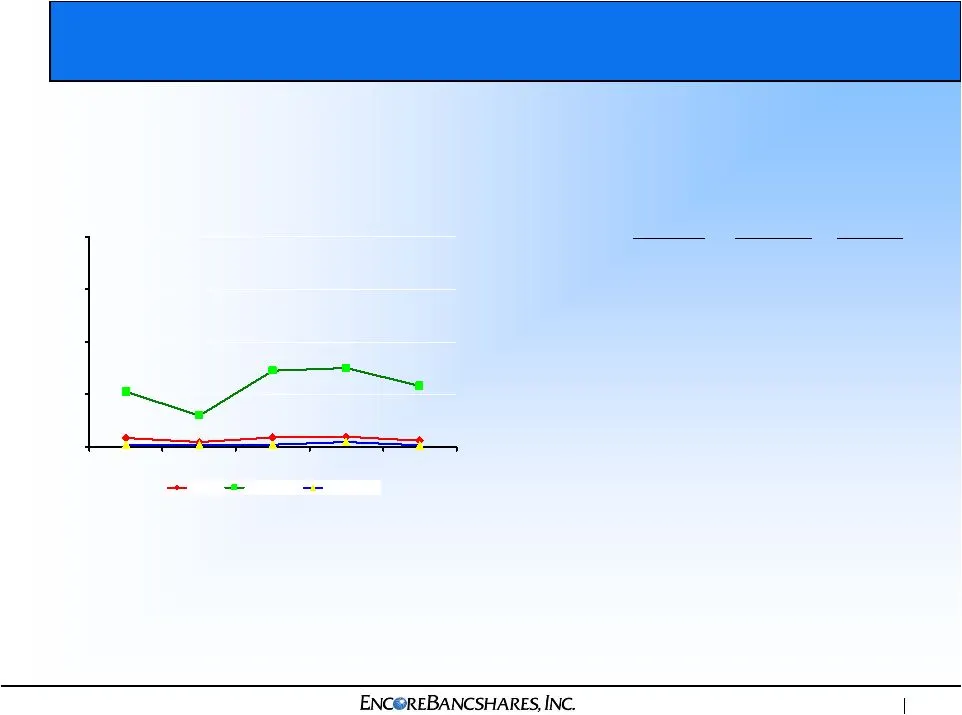
Slide 19: Residential Second Mortgage Loan Delinquencies
Residential Second Mortgage Loan Delinquencies Q4 07 Q1 08 Q2 08 Q3 08 Q4 08 2nd Mtg 2nd Mtg SBO 2nd Mtg Orig 30 Day + Delinquencies Trend 4Q08 3Q08 4Q07 EOP Portfolio $ 302,141 $ 291,933 $ 195,583 Net charge-offs ($) $ $ $ Net charge-offs (%) Nonperforming ($) $ $ $ Nonperforming (%)
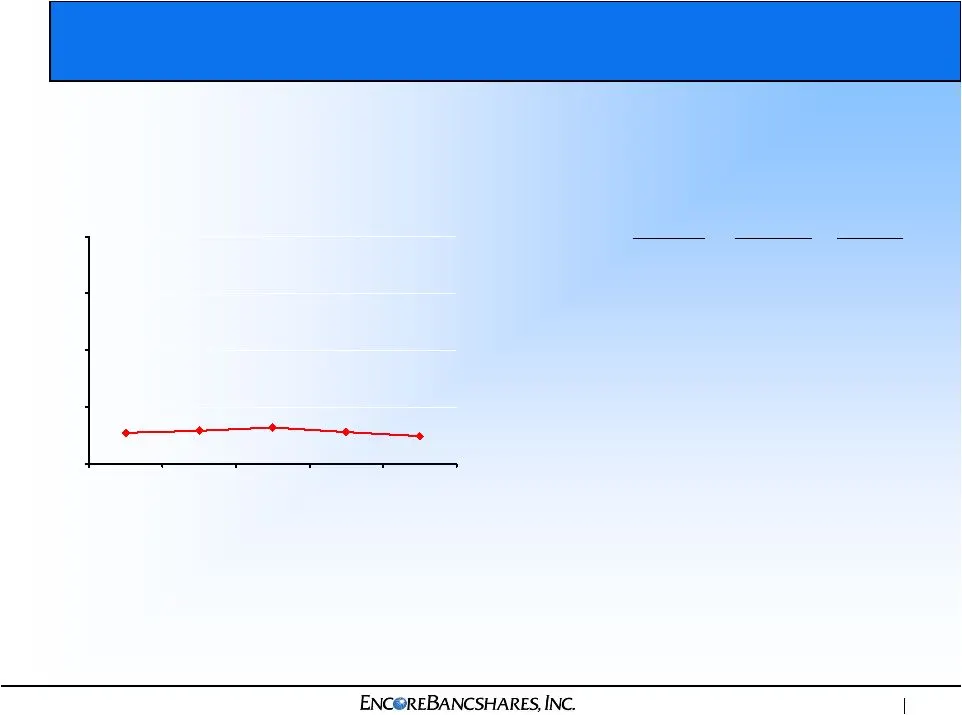
Slide 20: Home Equity Lines of Credit Delinquencies
Home Equity Lines of Credit Delinquencies Q4 07 Q1 08 Q2 08 Q3 08 Q4 08 30 Day + Delinquencies Trend 4Q08 3Q08 4Q07 EOP Portfolio $ 82,555 $ 79,888 $ 79,023 Net charge-offs ($) $ $ $ Net charge-offs (%) Nonperforming ($) $ $ $ Nonperforming (%)
Slide 21: Allowance By Loan Category
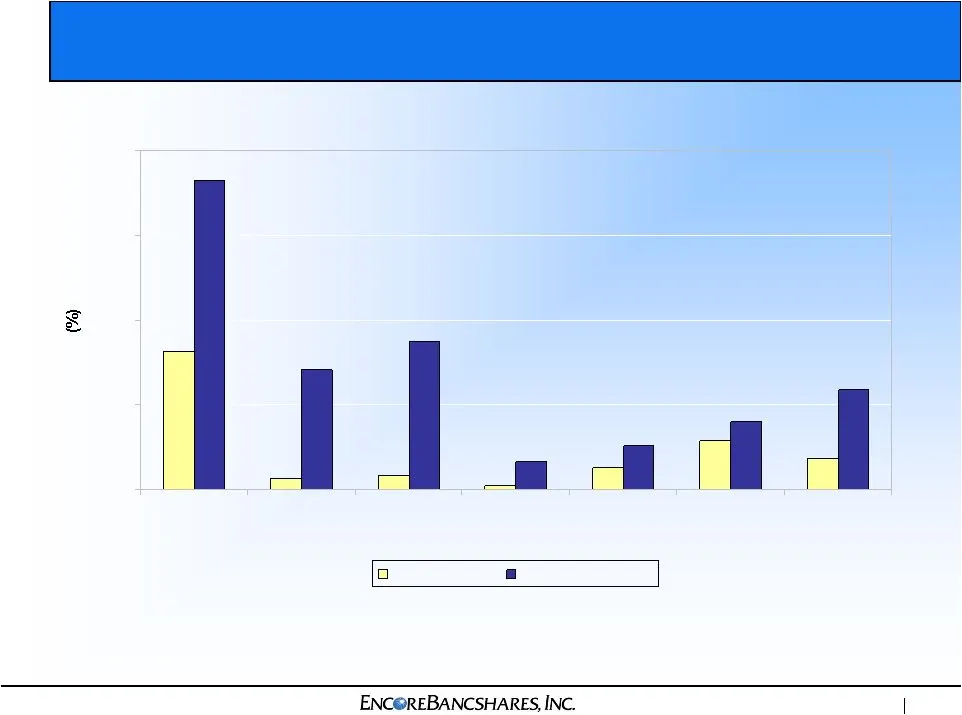
Allowance By Loan Category 0.22 0.28 0.45 1.00 0.63 2.47 0.91 1.40 2.06 0.09 2.85 3.06 0.58 6.38 0.00 1.75 3.50 5.25 7.00 Commercial Commercial RE Construction Res 1st Lien Res 2nd Lien HELOC Total 3-Yr Avg Loss Allowance/Loans
Slide 22: Capital Ratios
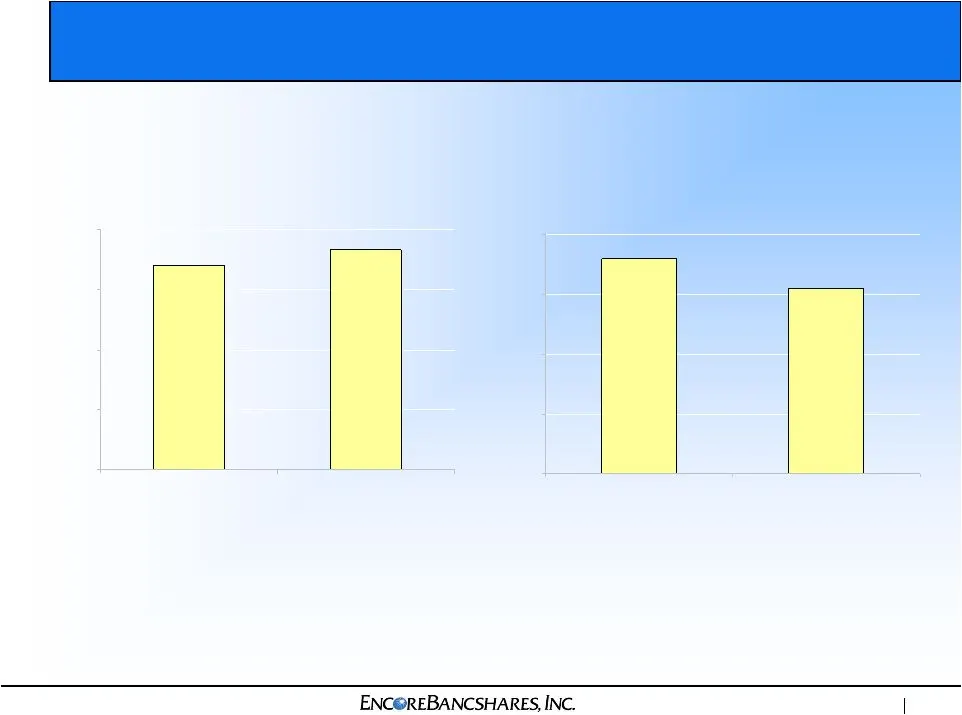
Capital Ratios Tier 1 Risked Based Capital Tangible Common Equity to Tangible Assets Tangible common equity: $120.5 million
Slide 23: Summary
Summary • Improving earnings metrics • Growing attractive franchise • Maintaining strong capital • Managing credit quality • Solid noninterest income

Slide 24: Encore Bancshares, Inc.
ENC@REBANCSHARES, INC.
Source: SEC EDGAR · 8-K filed Feb 25, 2009
More decks from Encore Bancshares Inc
 Gulf South Bank Conference 201127 slides · May 10, 2011
 Investor Presentation (March 2011)24 slides · Mar 3, 2011
 KBW Texas Field Trip (February 2011)24 slides · Feb 8, 2011
 Macquarie Small & Mid Cap Conference 201021 slides · Jun 16, 2010
 Gulf South Bank Conference (May 2010)21 slides · May 5, 2010
 KBW Texas Field Trip (February 2010)26 slides · Feb 9, 2010