INX — Raymond James 2008 IT Supply Chain Conference
39 slides from INX's conference presentation, Nov 18, 2008
Slide 1: Raymond James 2008 IT Supply Chain Conference
1 Raymond James 2008 IT Supply Chain Conference Jim Long, Chairman & CEO Brian Fontana, CFO INX Inc. Nasdaq: INXI November 18, 2008 www.INXI.com
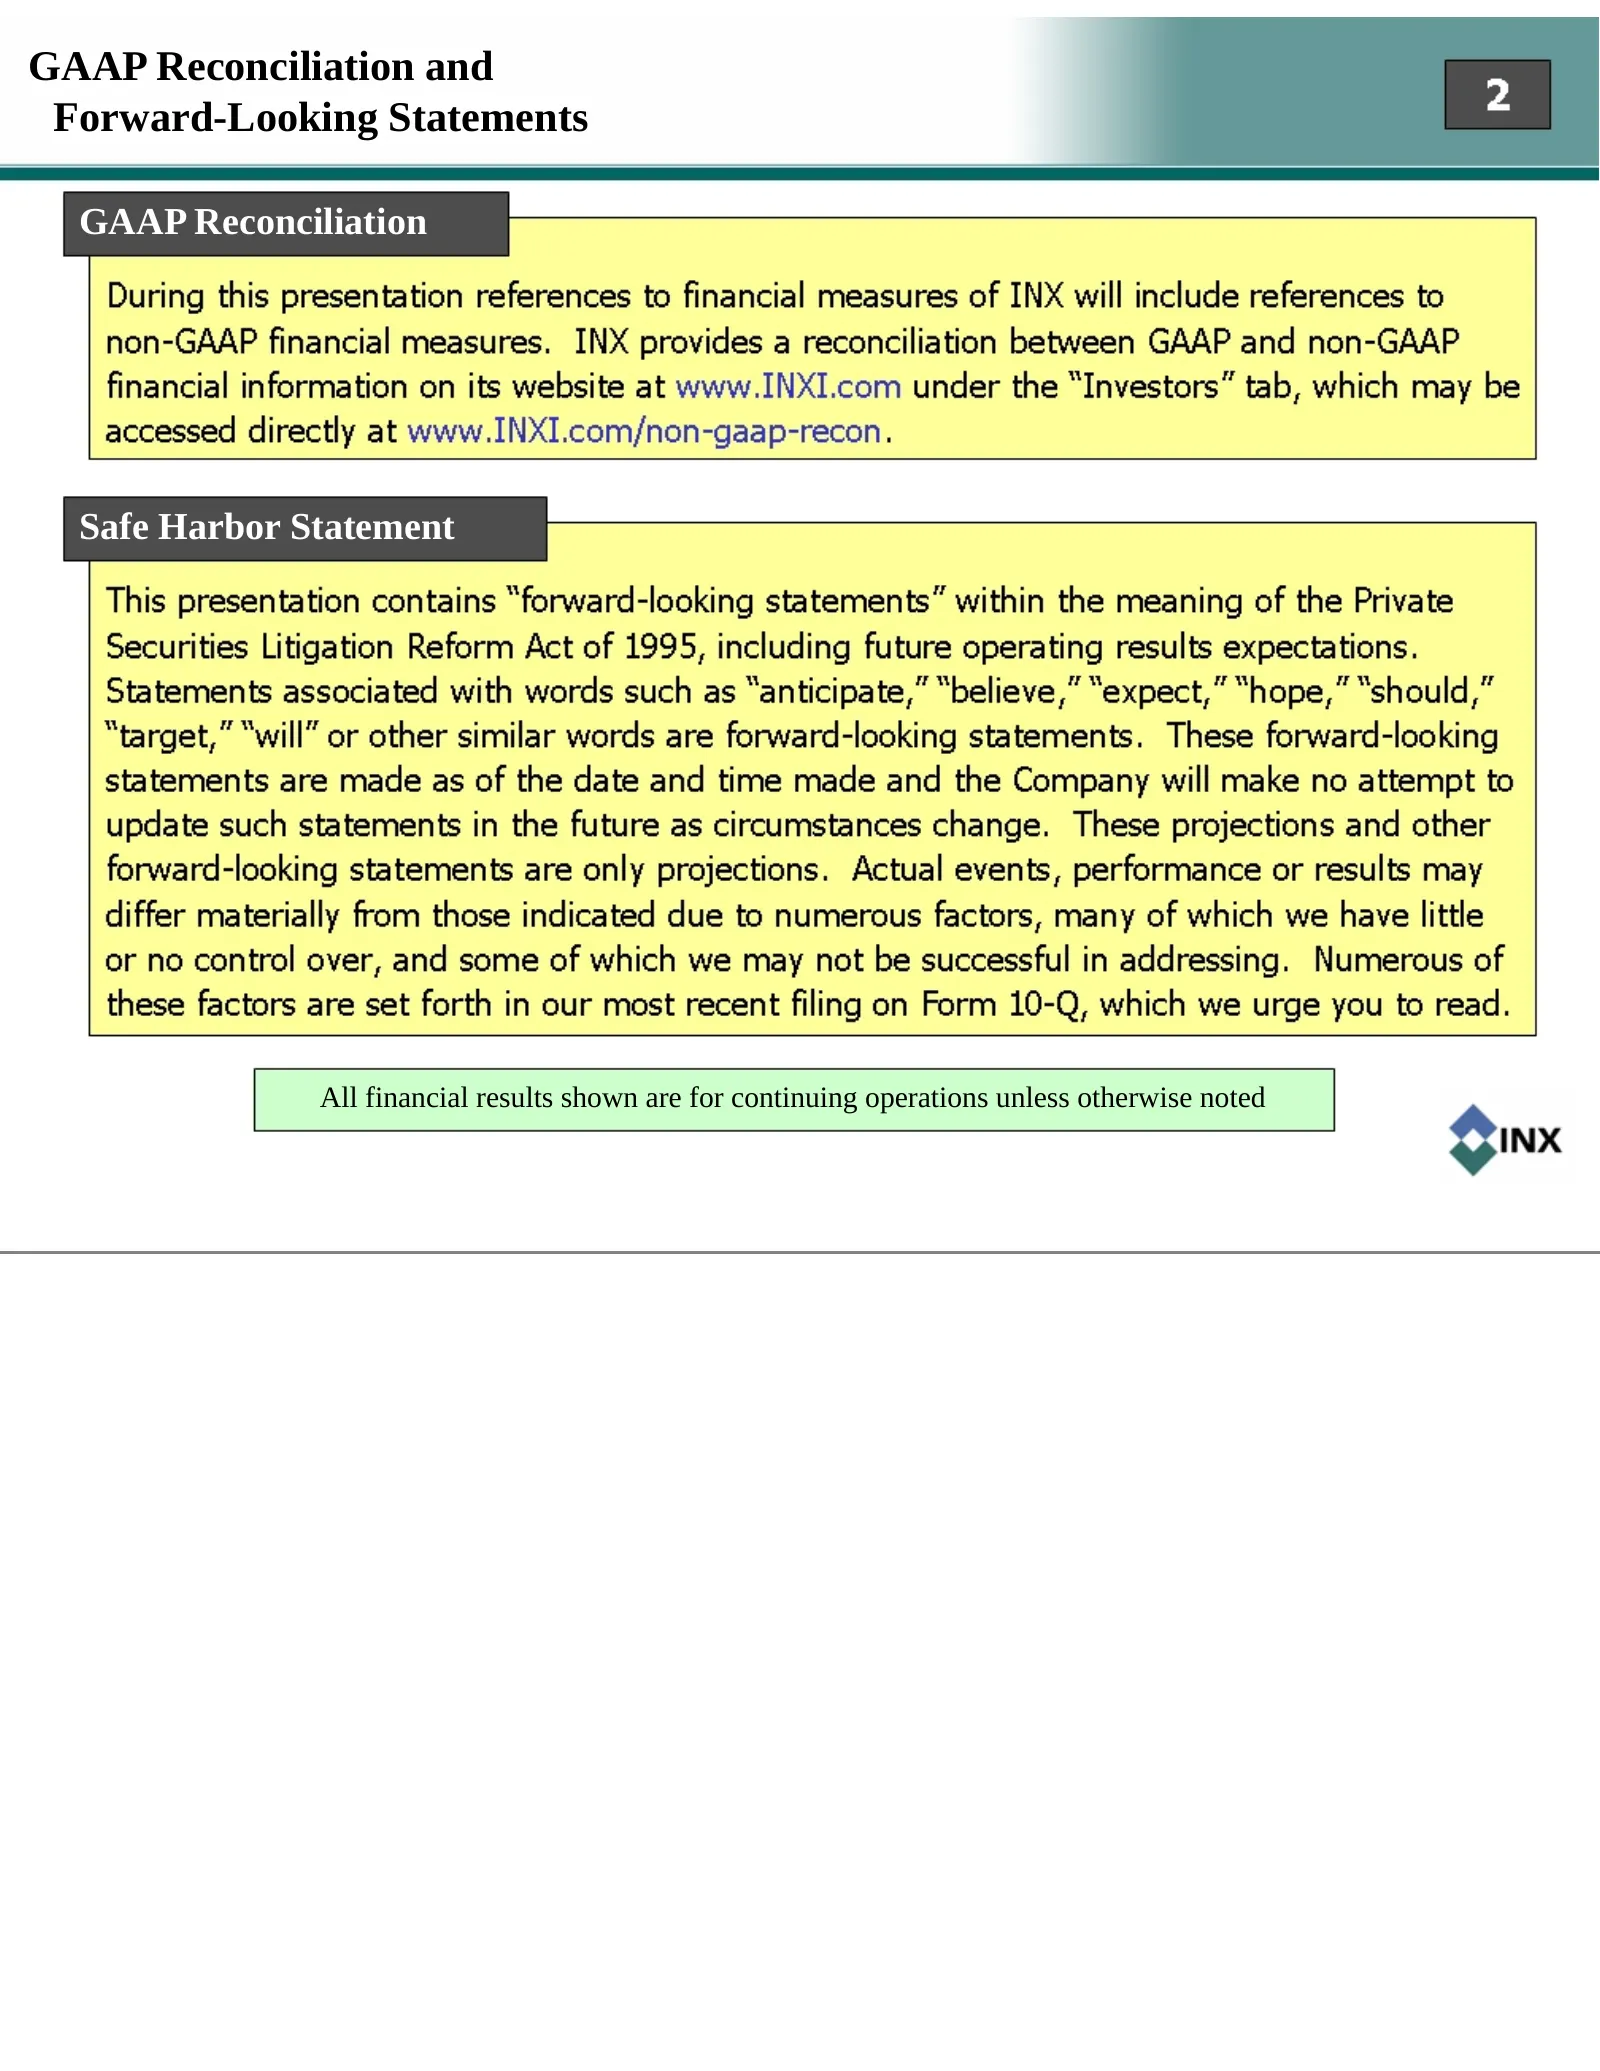
Slide 2: GAAP Reconciliation and Forward-Looking Statements
GAAP Reconciliation and Forward-Looking Statements GAAP Reconciliation Safe Harbor Statement All financial results shown are for continuing operations unless otherwise noted
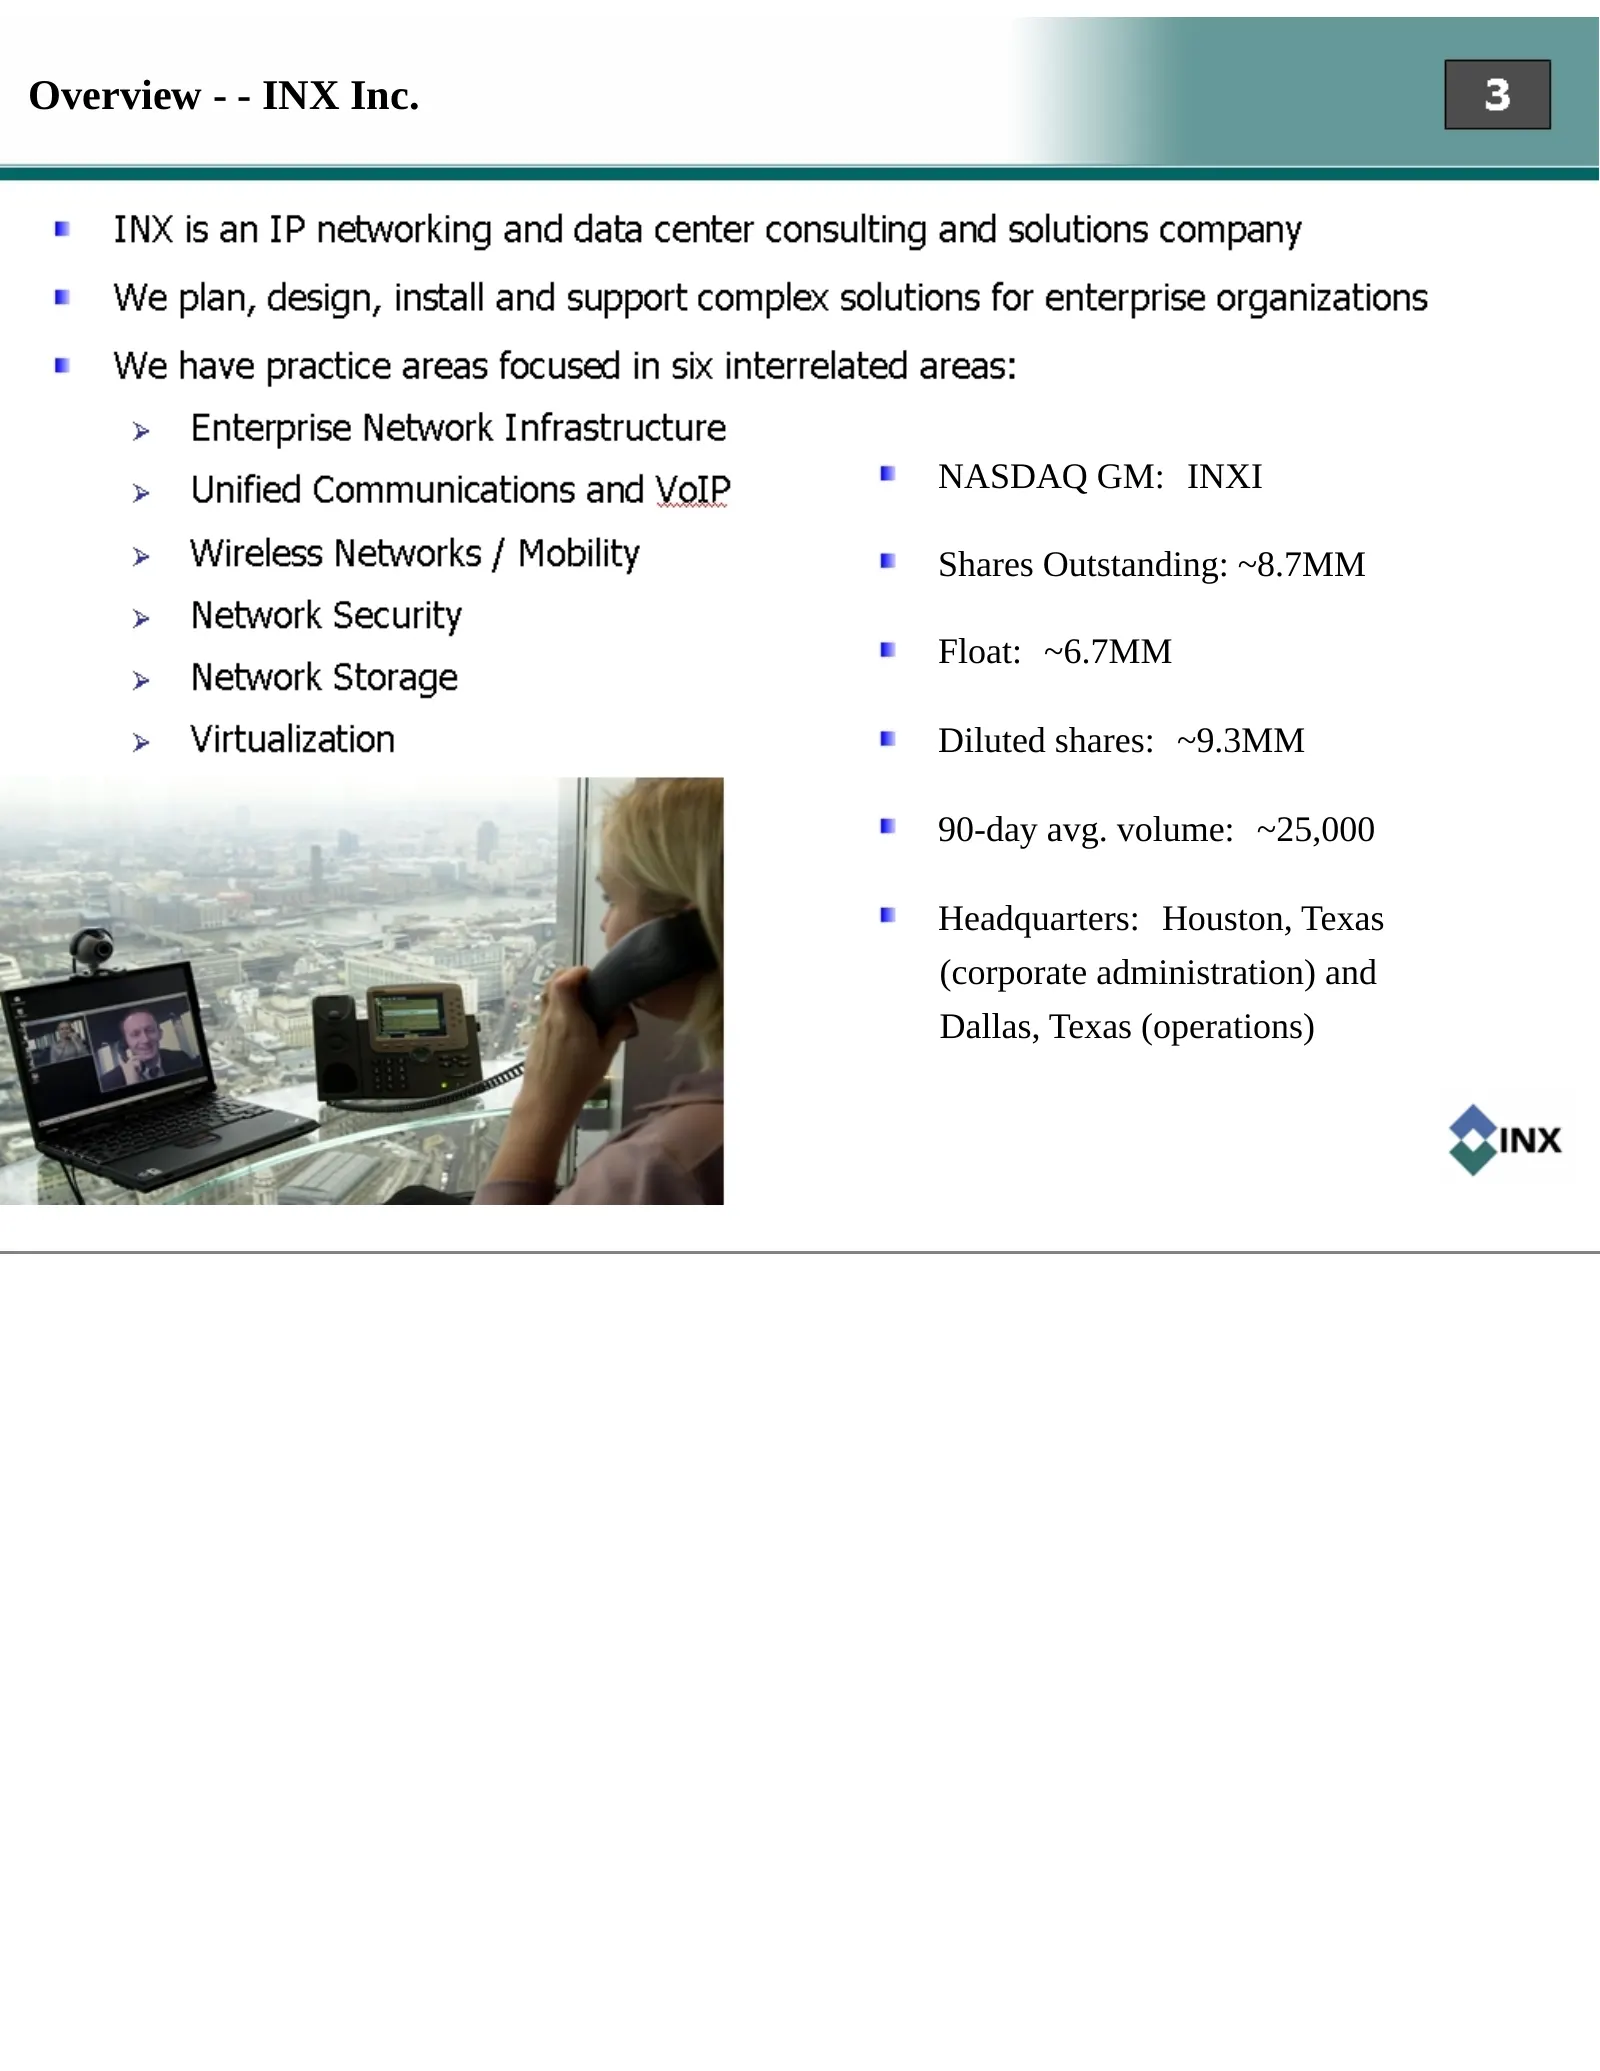
Slide 3: Overview - INX Inc.
Overview - - INX Inc. NASDAQ GM: INXI Shares Outstanding: ~8.7MM Float: ~6.7MM Diluted shares: ~9.3MM 90-day avg. volume: ~25,000 Headquarters: Houston, Texas (corporate administration) and Dallas, Texas (operations)
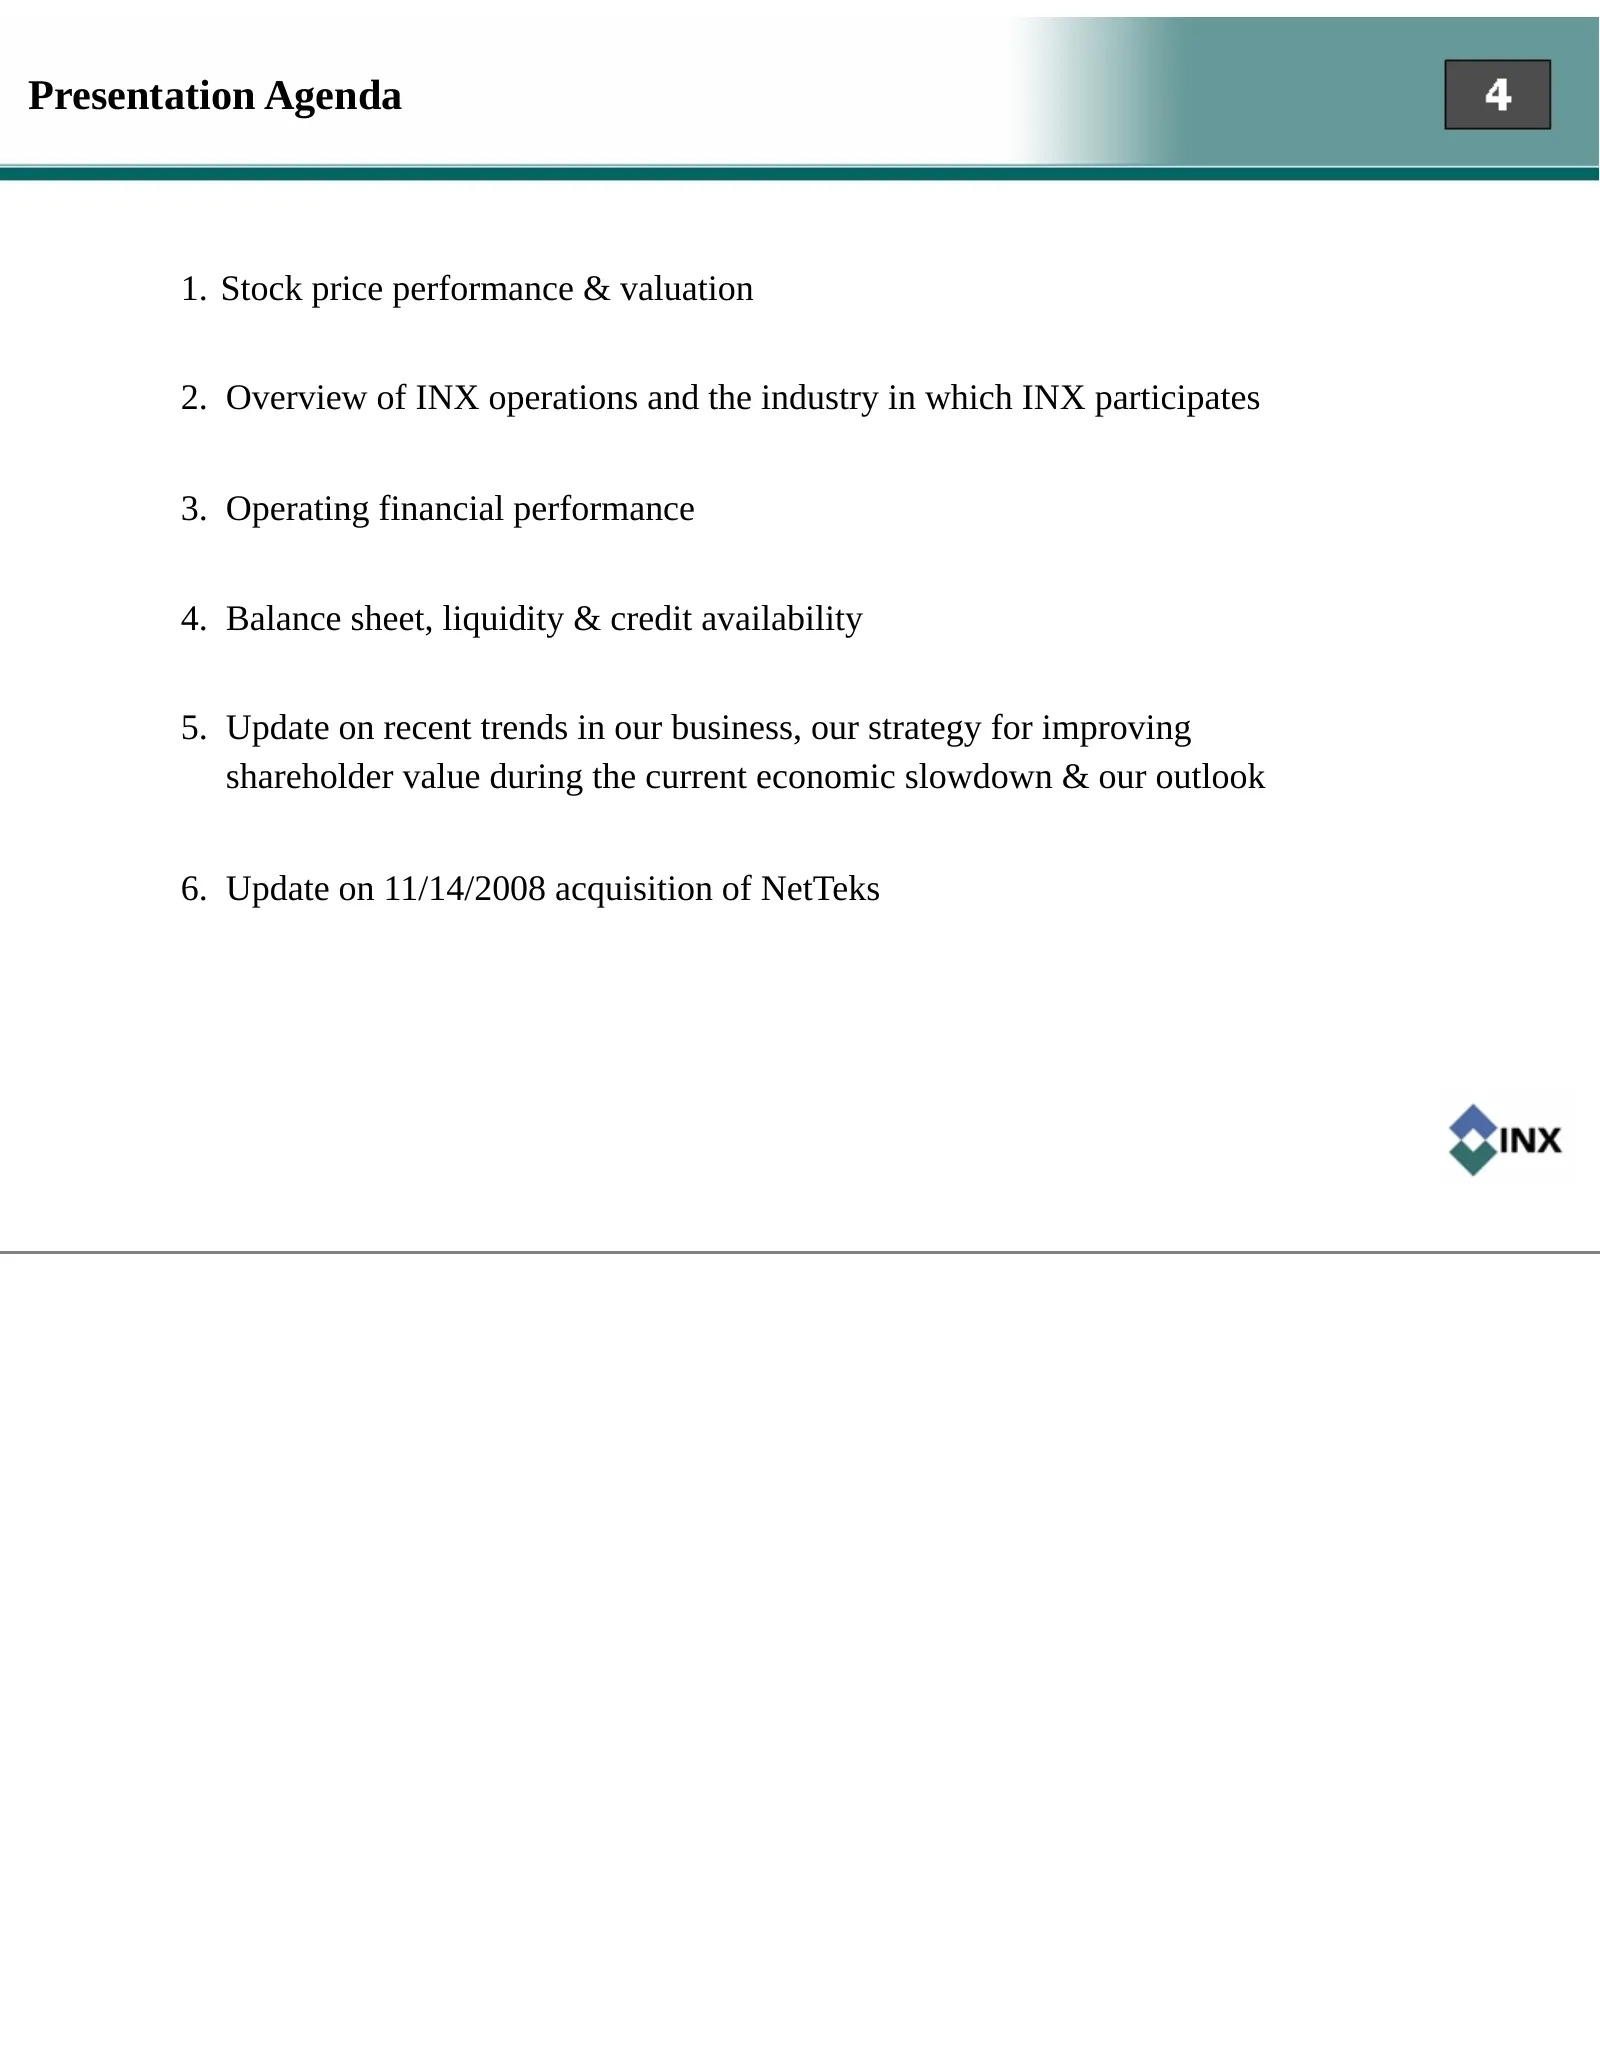
Slide 4: Presentation Agenda
Presentation Agenda 1. Stock price performance & valuation 2. Overview of INX operations and the industry in which INX participates 3. Operating financial performance 4. Balance sheet, liquidity & credit availability 5. Update on recent trends in our business, our strategy for improving shareholder
Slide 5: Stock Price Performance & Valuation
Stock Price Performance & Valuation
Slide 6: 2-Year INX Daily Stock Graph
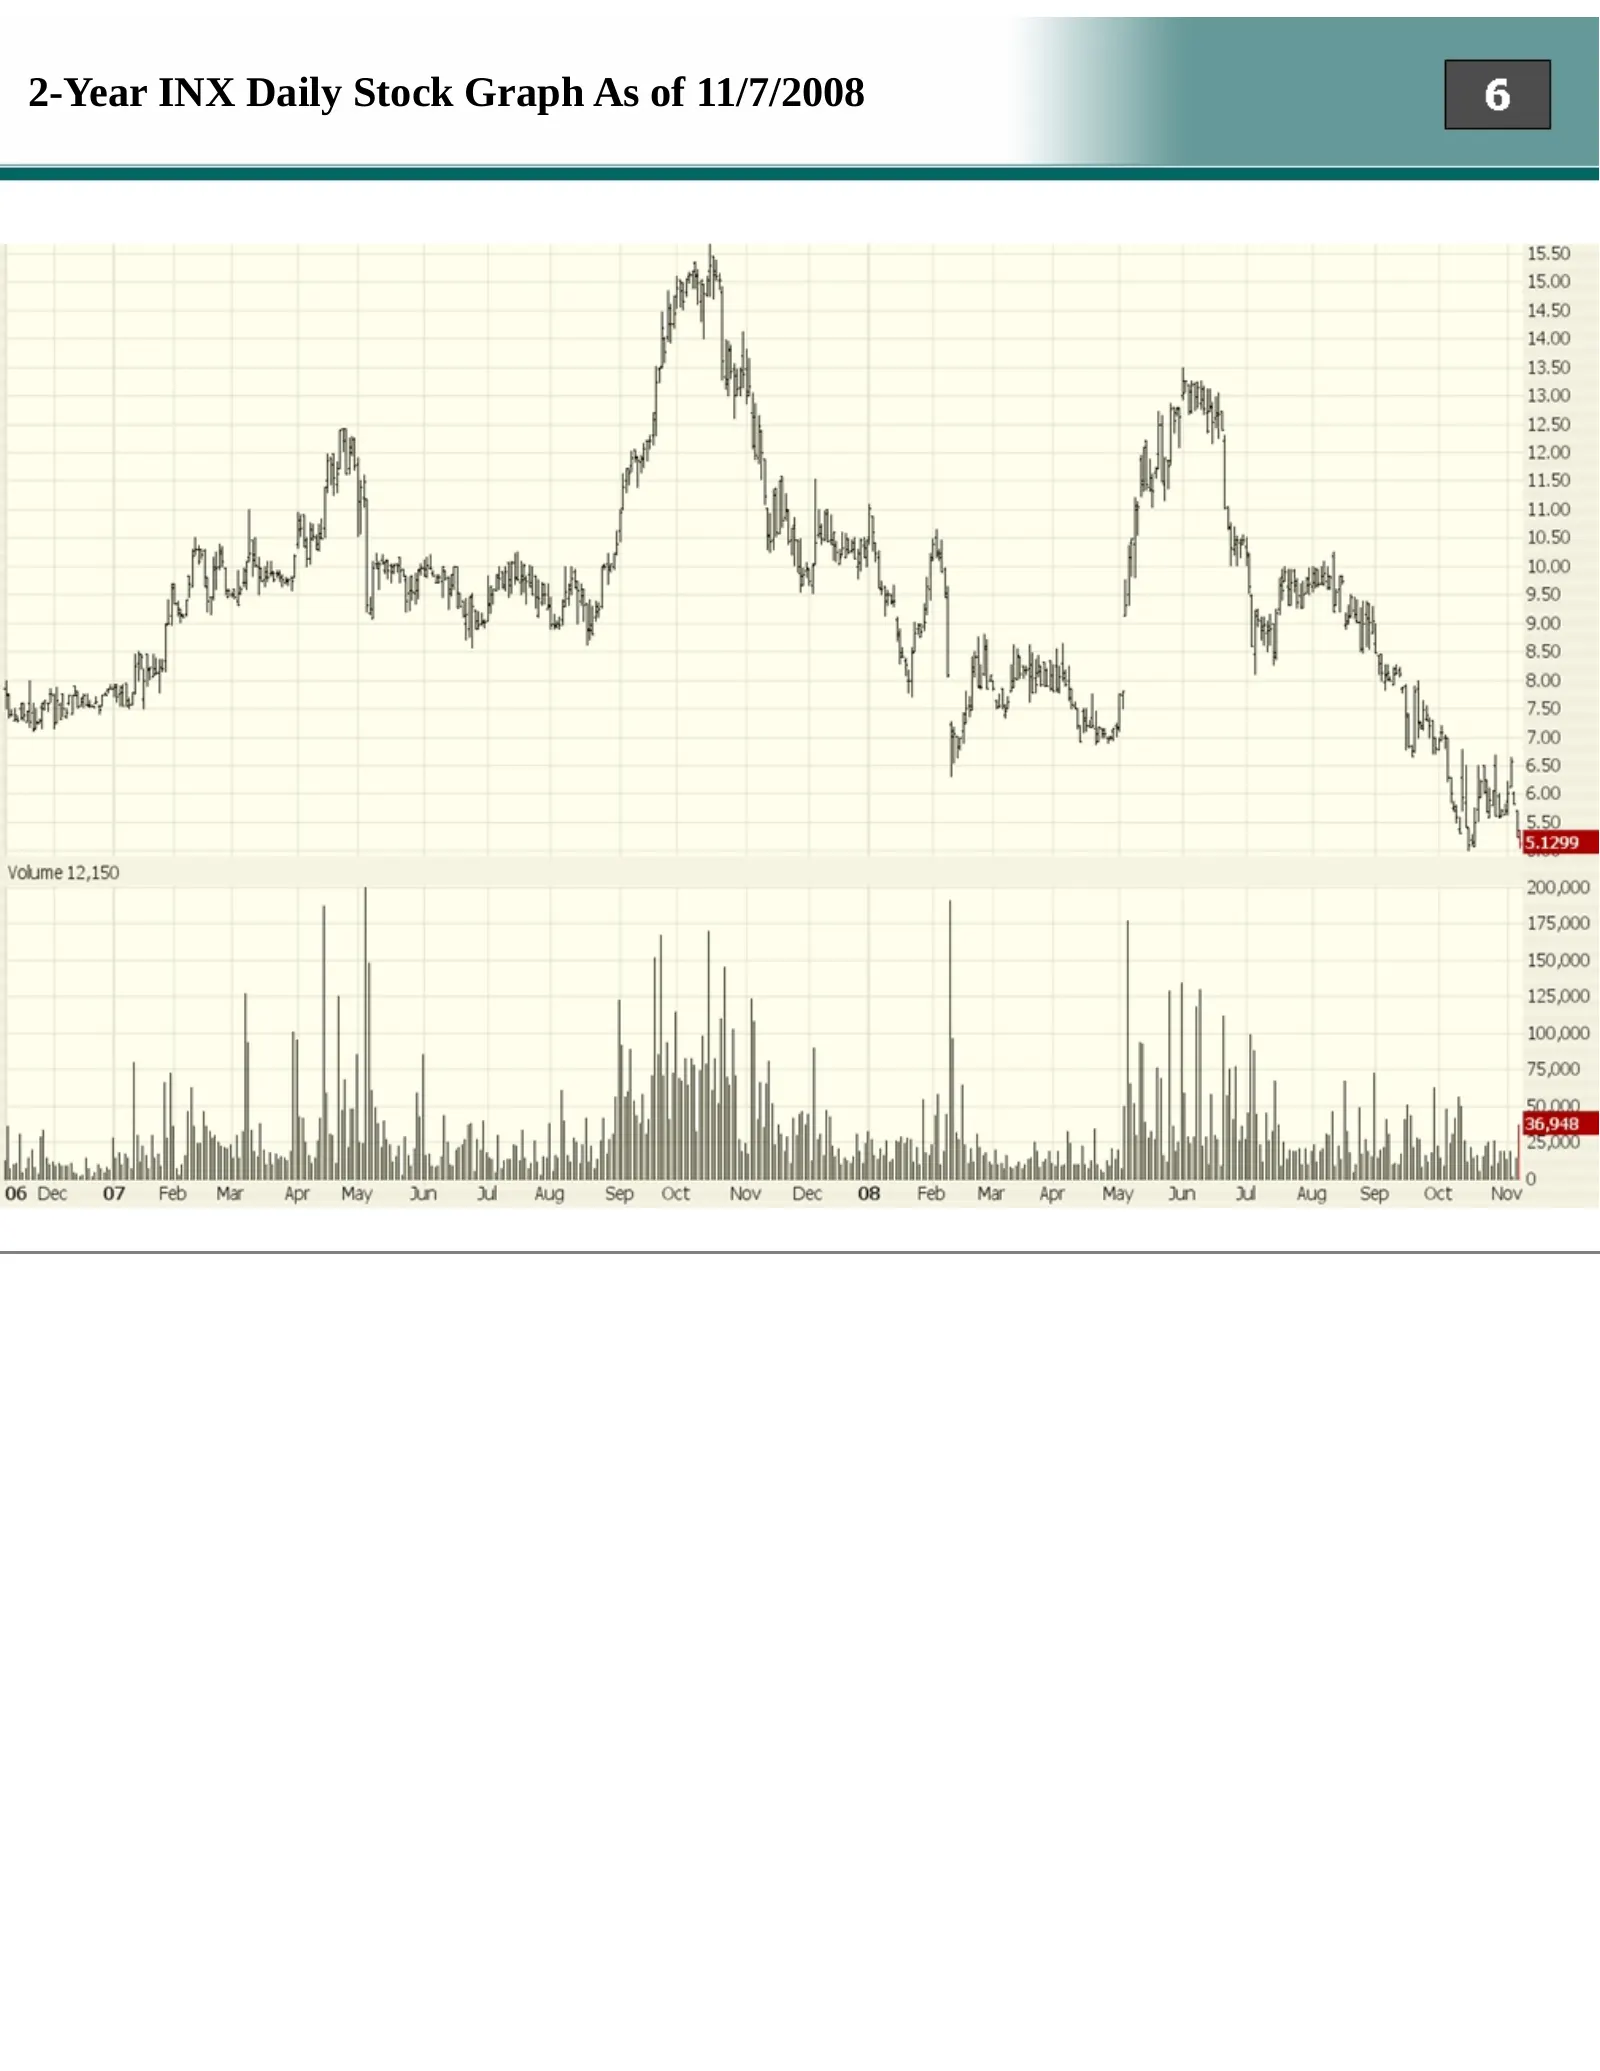
2-Year INX Daily Stock Graph As of 11/7/2008
Slide 7: INX Enterprise Value / Operating Income
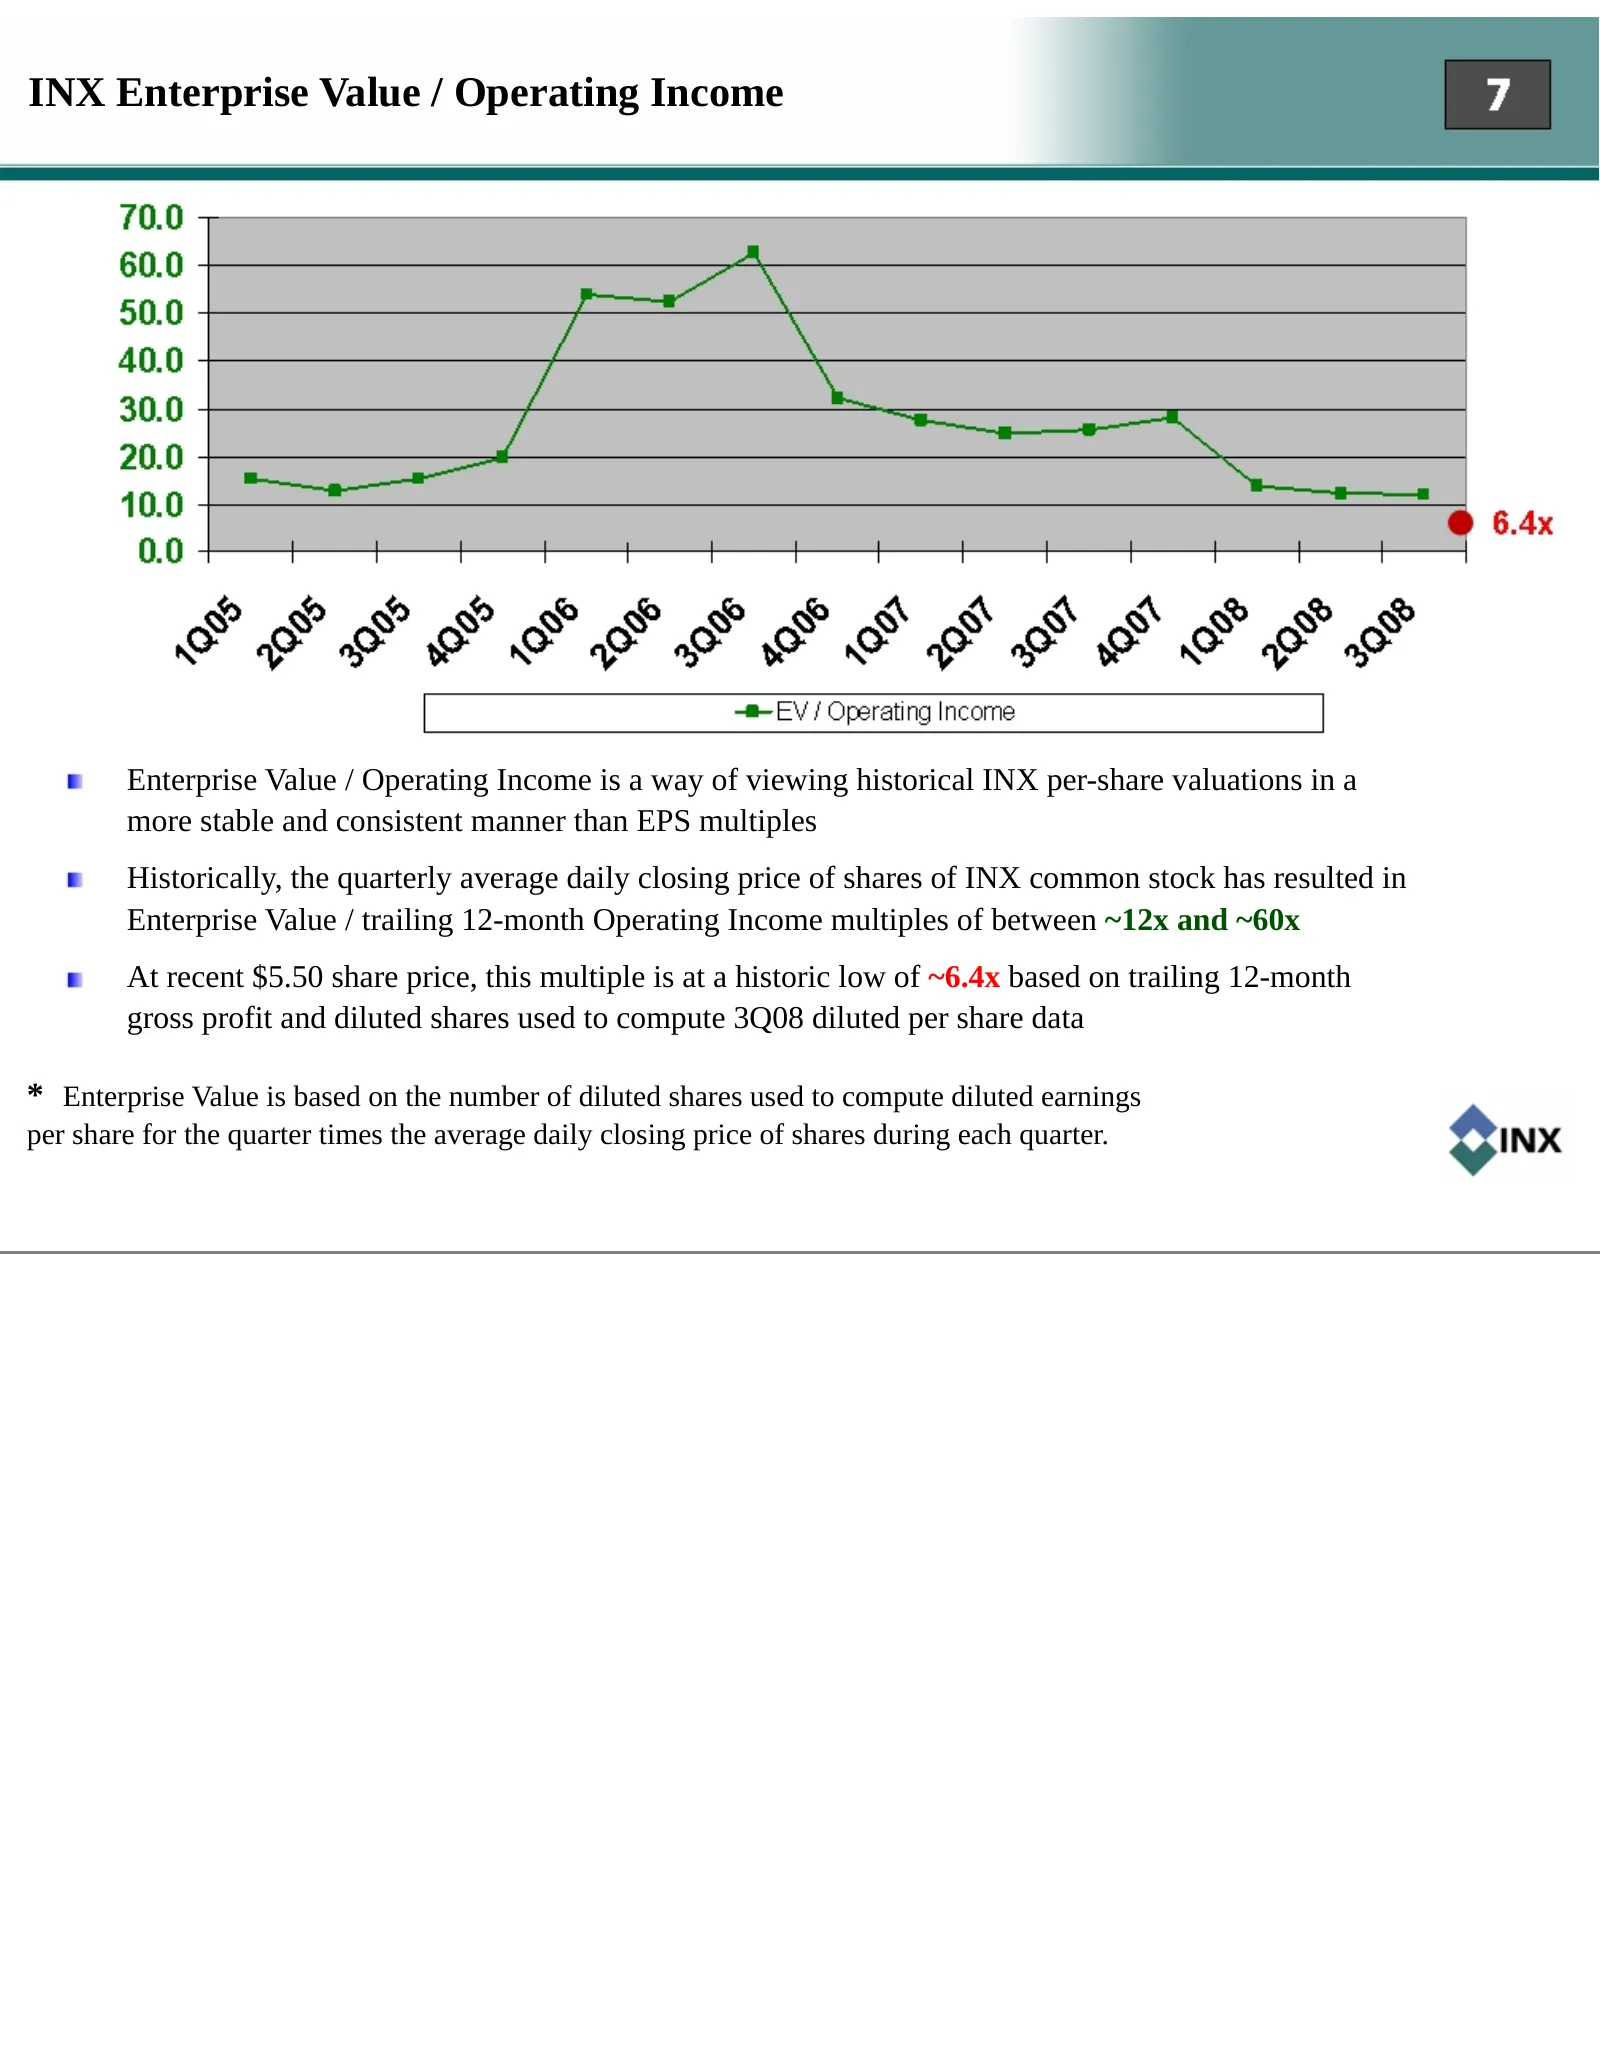
INX Enterprise Value / Operating Income Enterprise Value / Operating Income is a way of viewing historical INX per-share valuations in a more stable and consistent manner than EPS multiples Historically, the quarterly average daily closing price of shares of INX common stock has resulted in Enterpri
Slide 8: INX Enterprise Value / Revenue
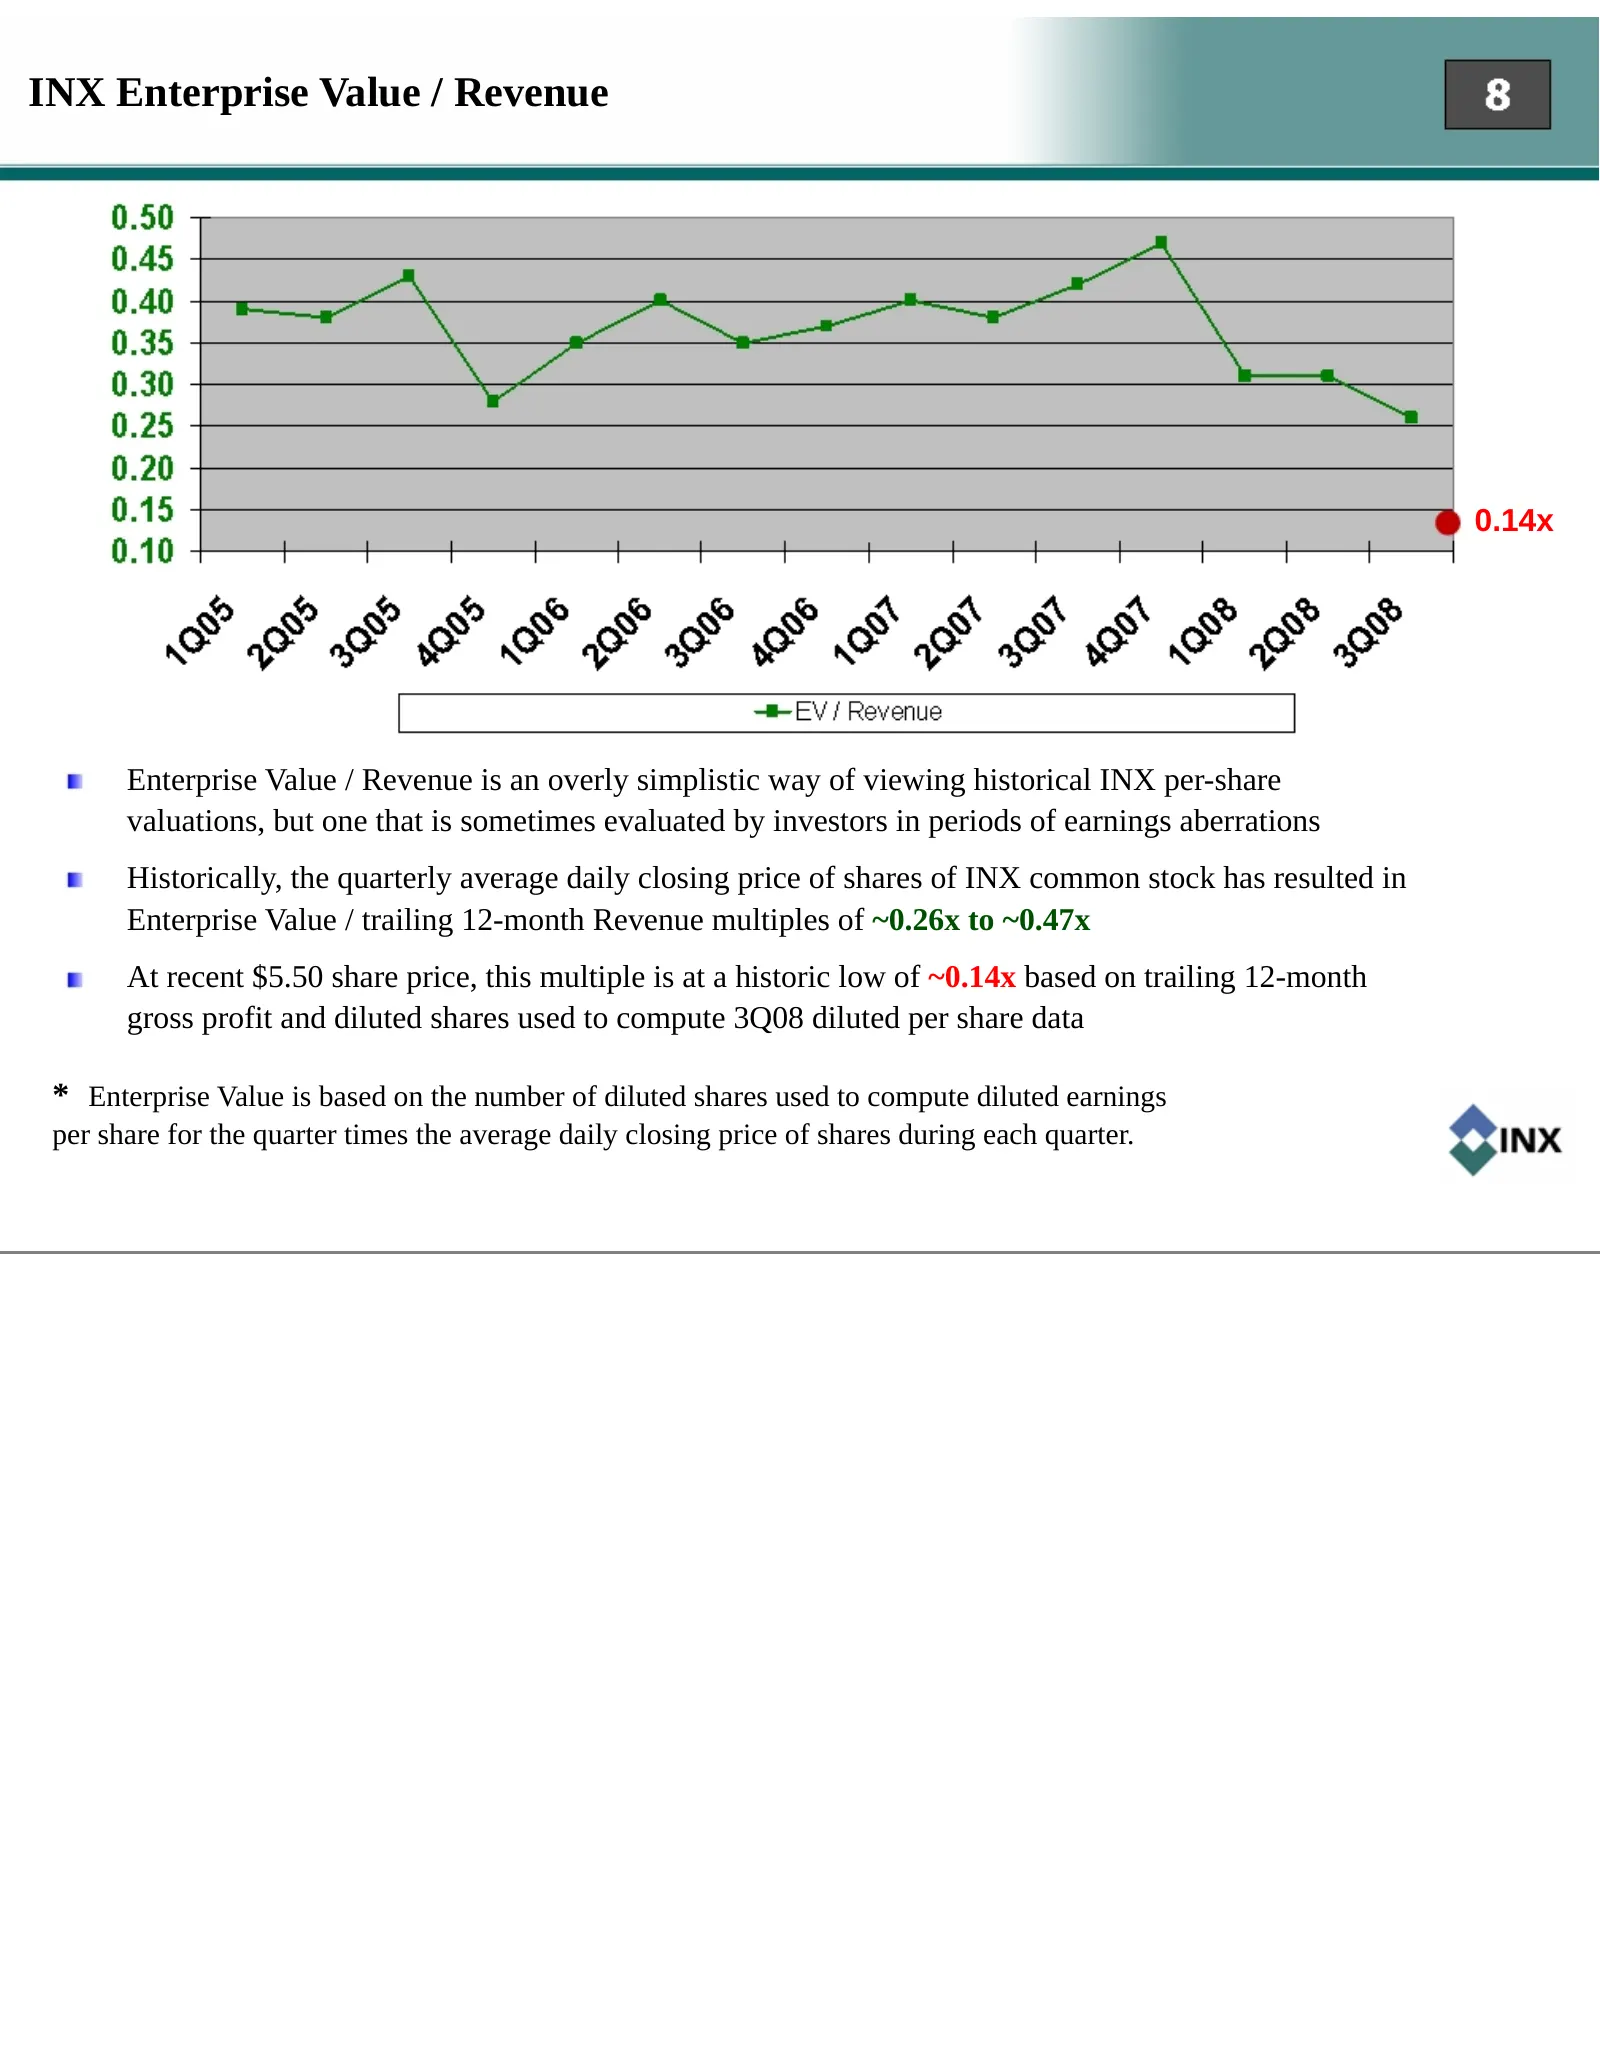
INX Enterprise Value / Revenue 0.14x Enterprise Value / Revenue is an overly simplistic way of viewing historical INX per-share valuations, but one that is sometimes evaluated by investors in periods of earnings aberrations Historically, the quarterly average daily closing price of shares of INX com
Slide 9: INX Enterprise Value / Gross Profit
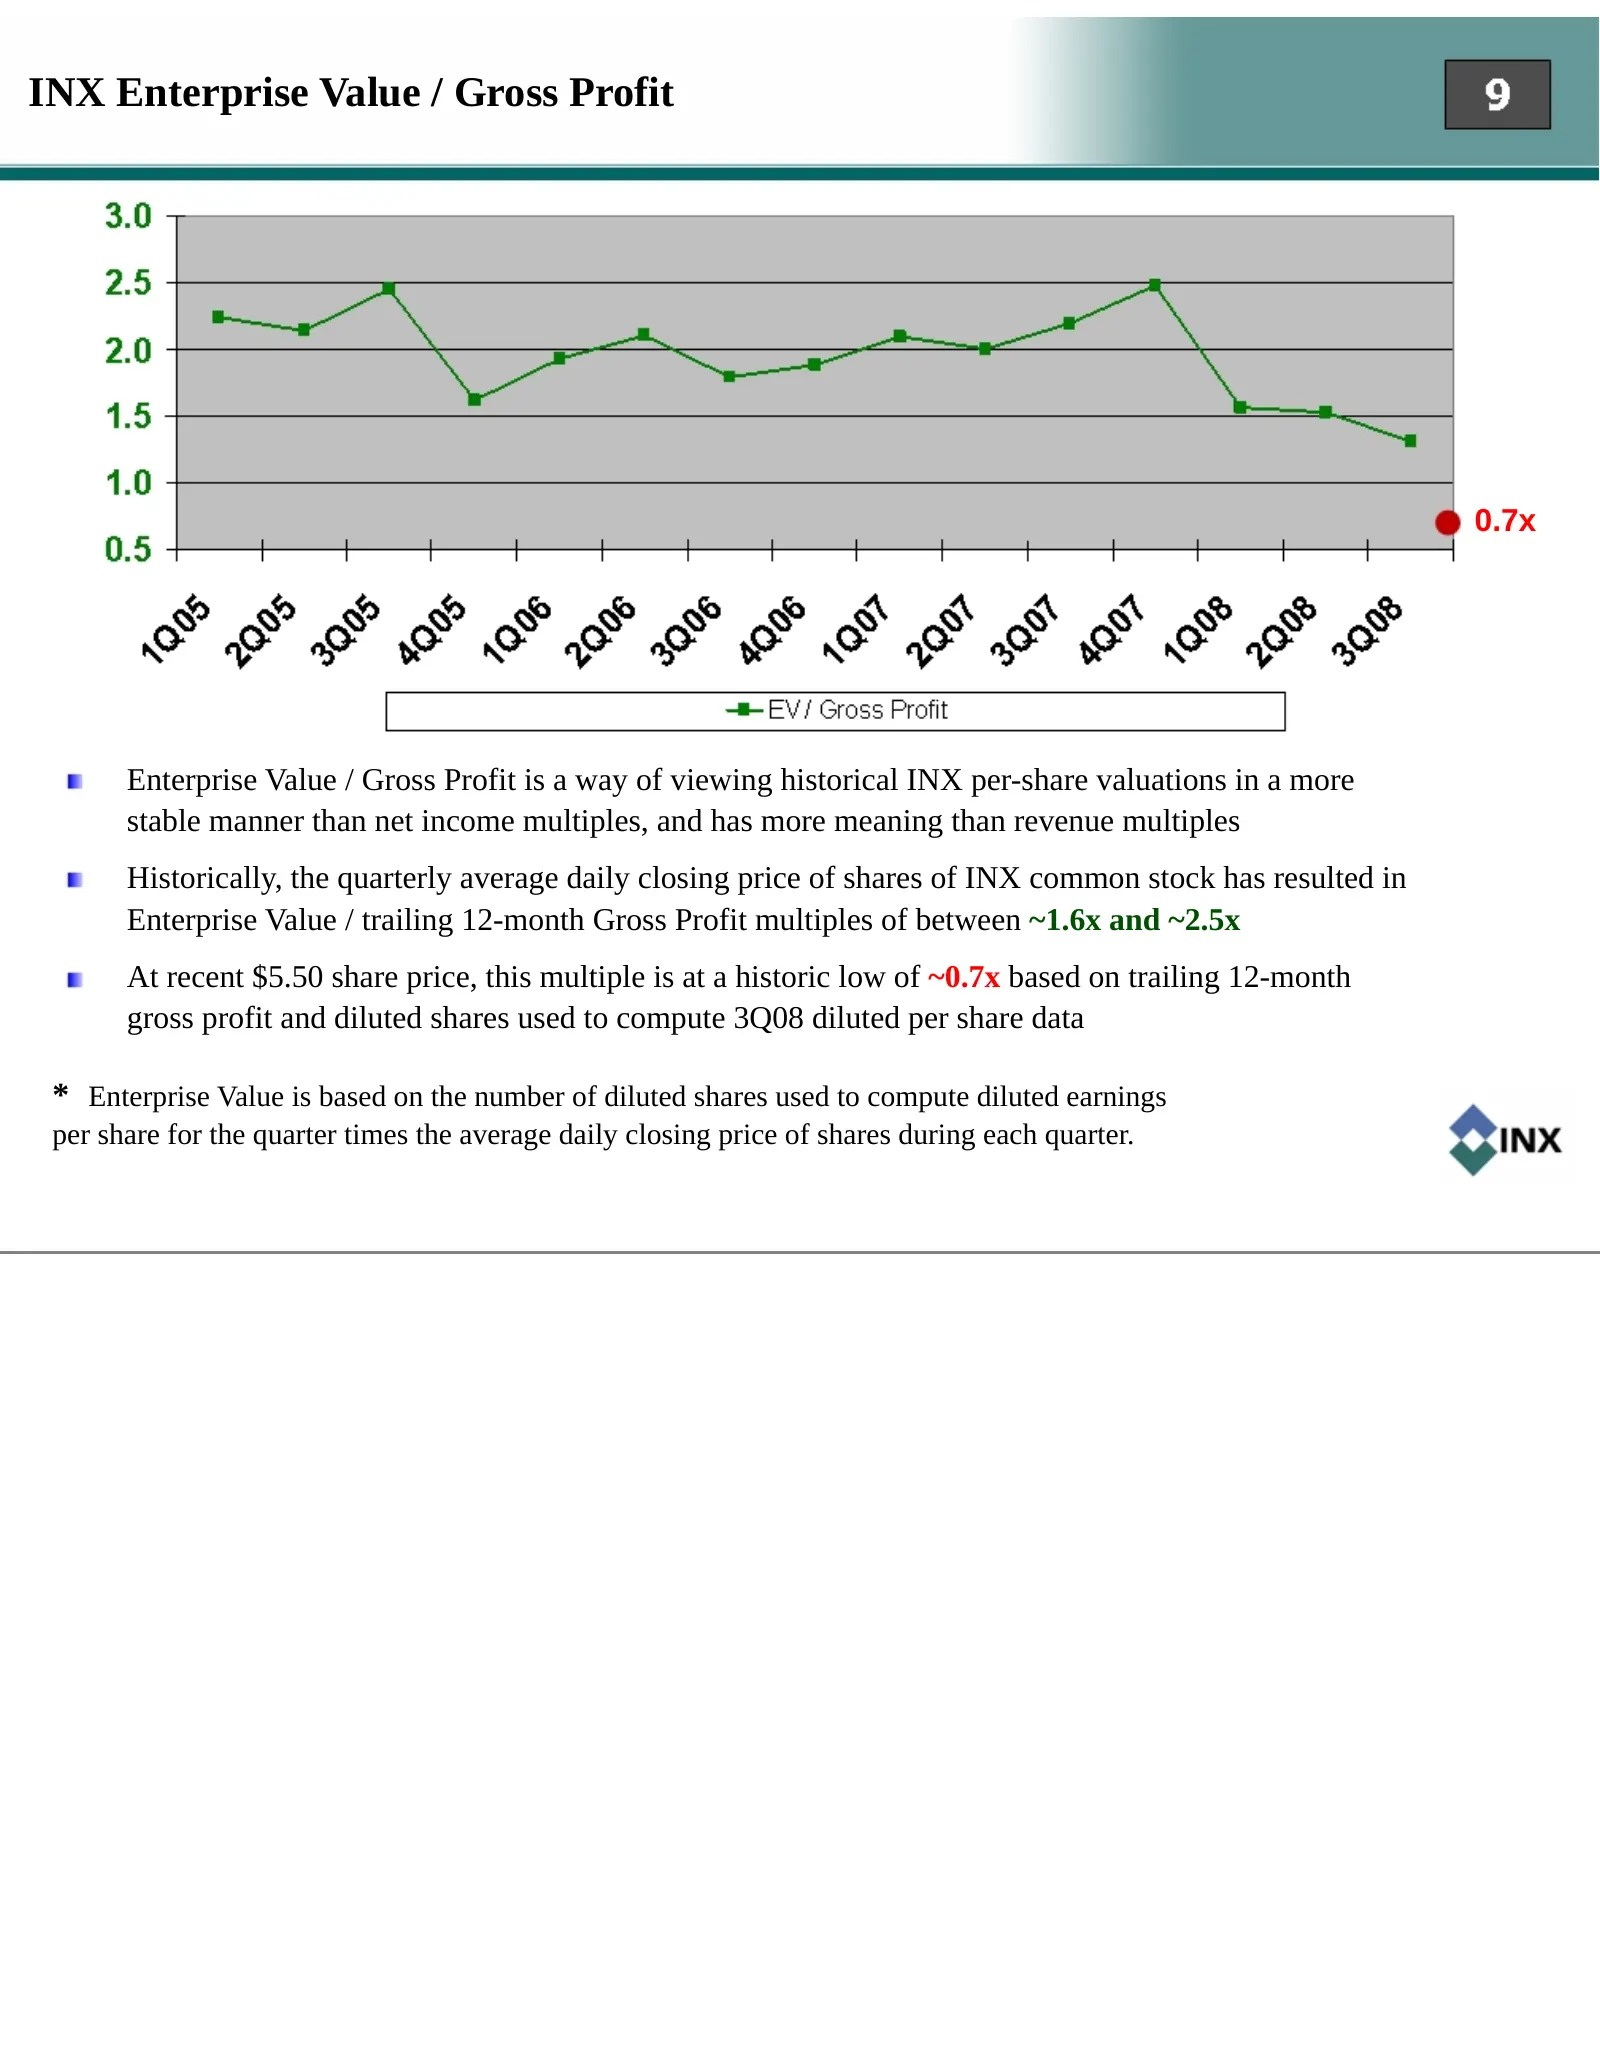
INX Enterprise Value / Gross Profit 0.7x Enterprise Value / Gross Profit is a way of viewing historical INX per-share valuations in a more stable manner than net income multiples, and has more meaning than revenue multiples Historically, the quarterly average daily closing price of shares of INX com
Slide 10: Operations & Industry
Operations & Industry
Slide 11: The INX Solutions Set
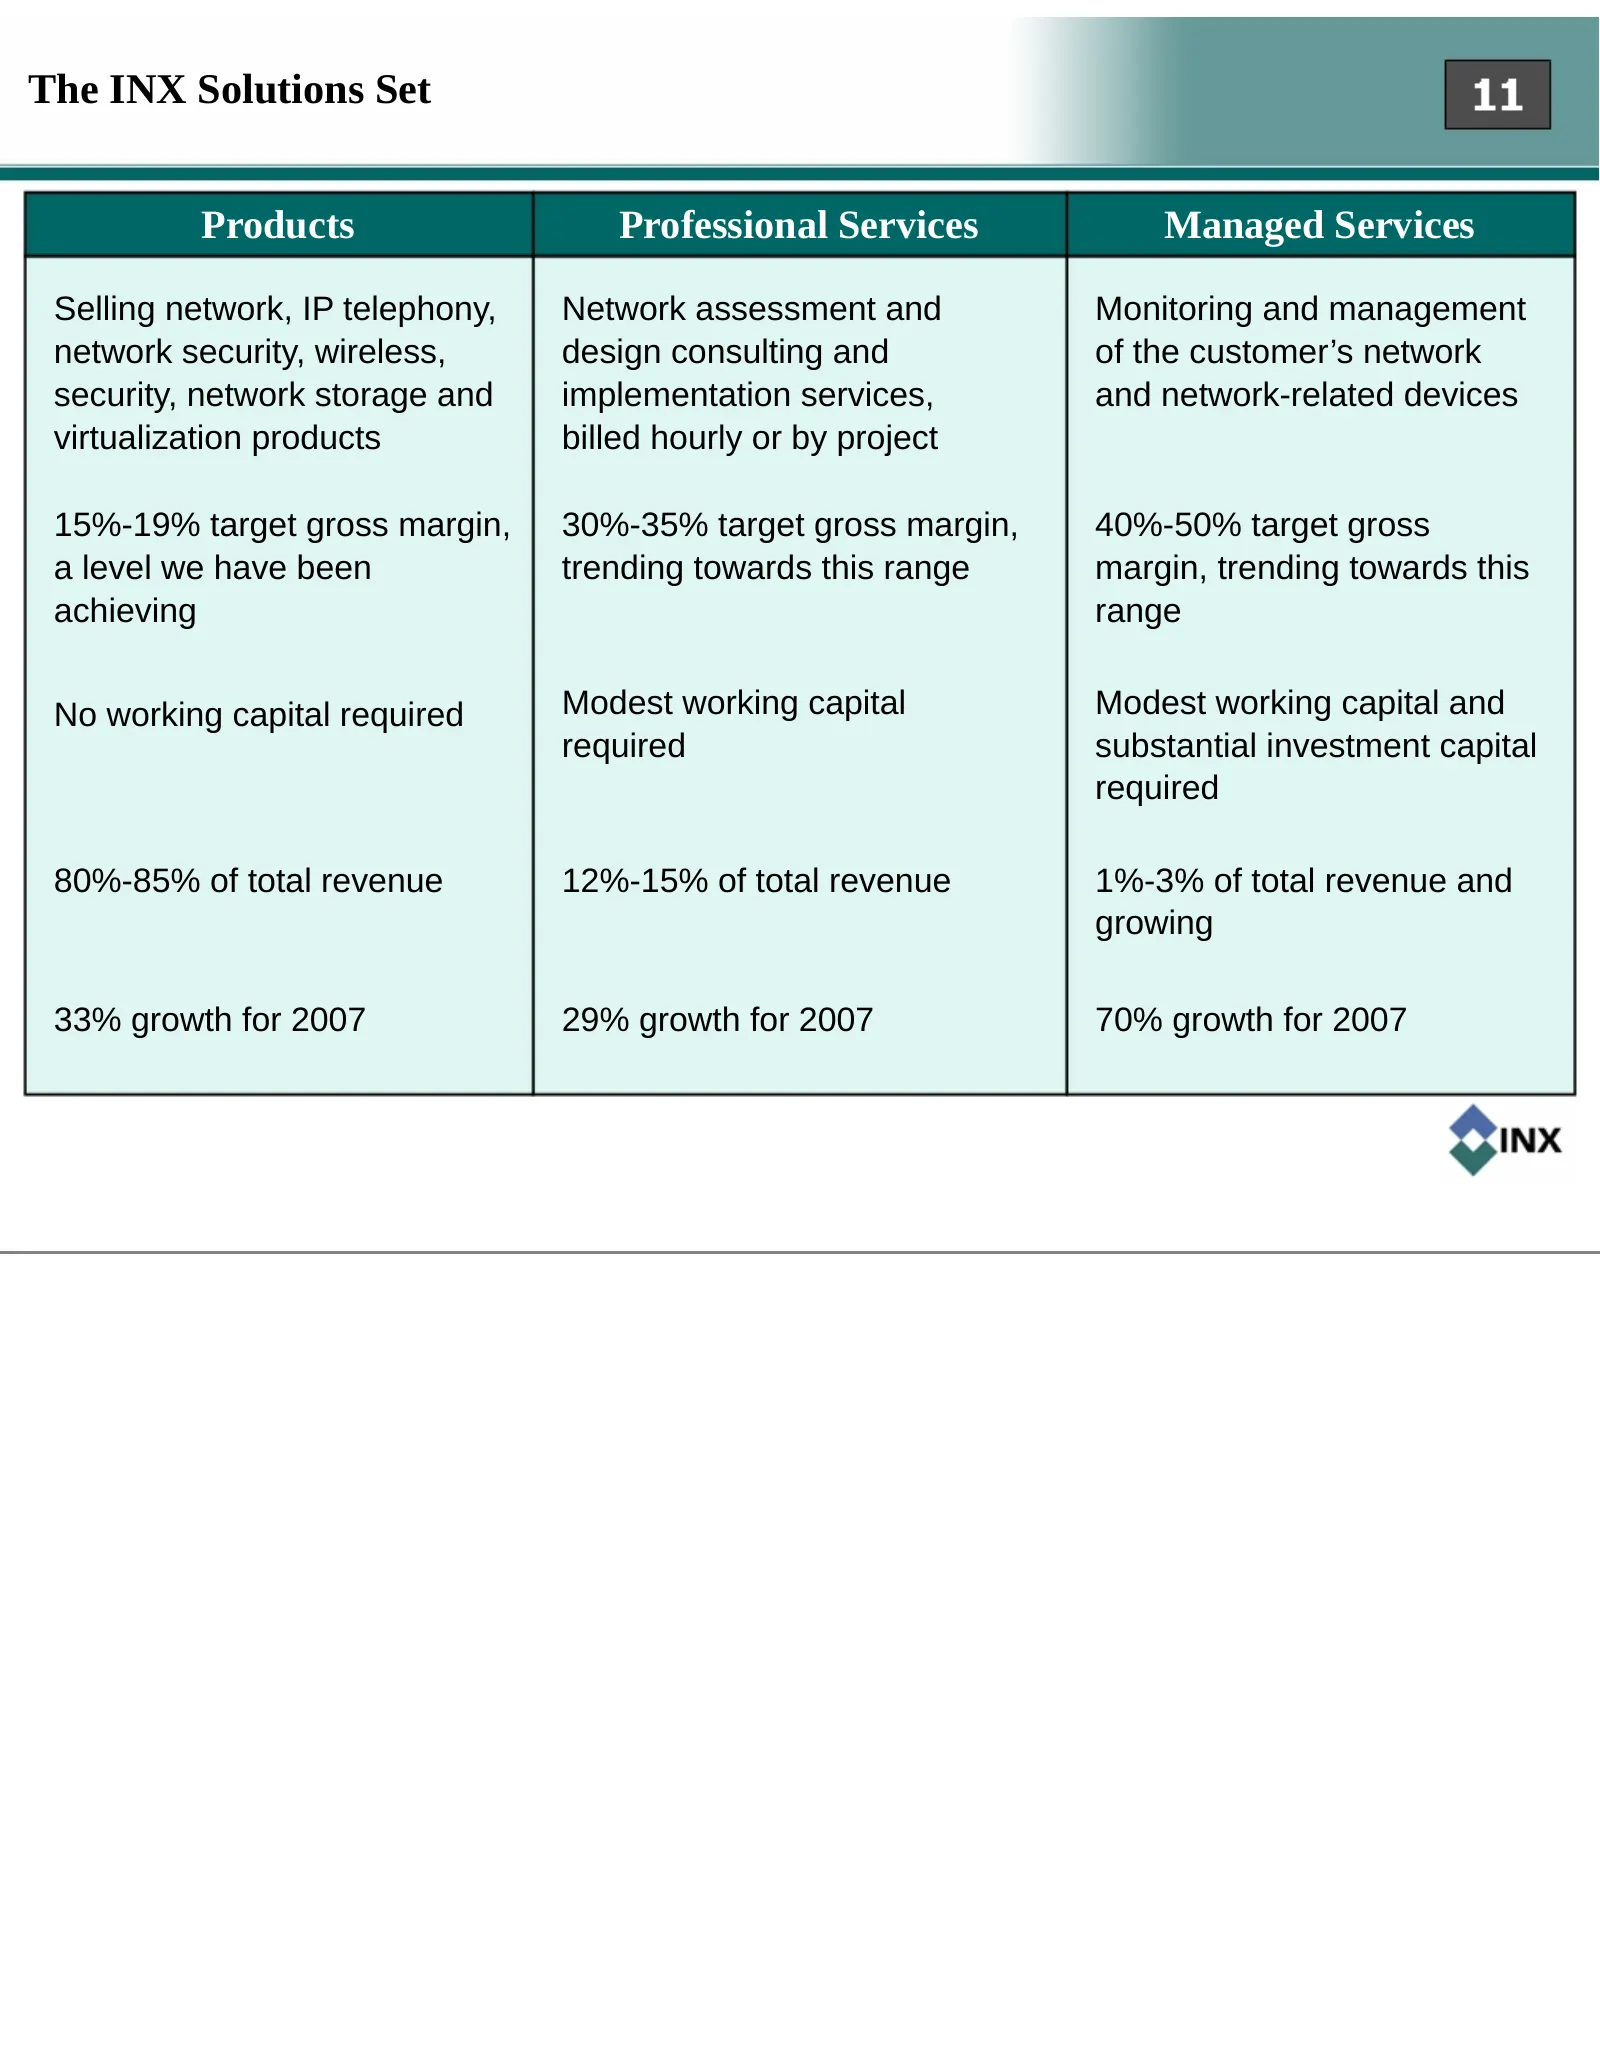
The INX Solutions Set Products Professional Services Managed Services Selling network, IP telephony, Network assessment and Monitoring and management network security, wireless, design consulting and of the customer’s network security, network storage and implementation services, and network-related
Slide 12: Increasing IP Network Importance & Complexity
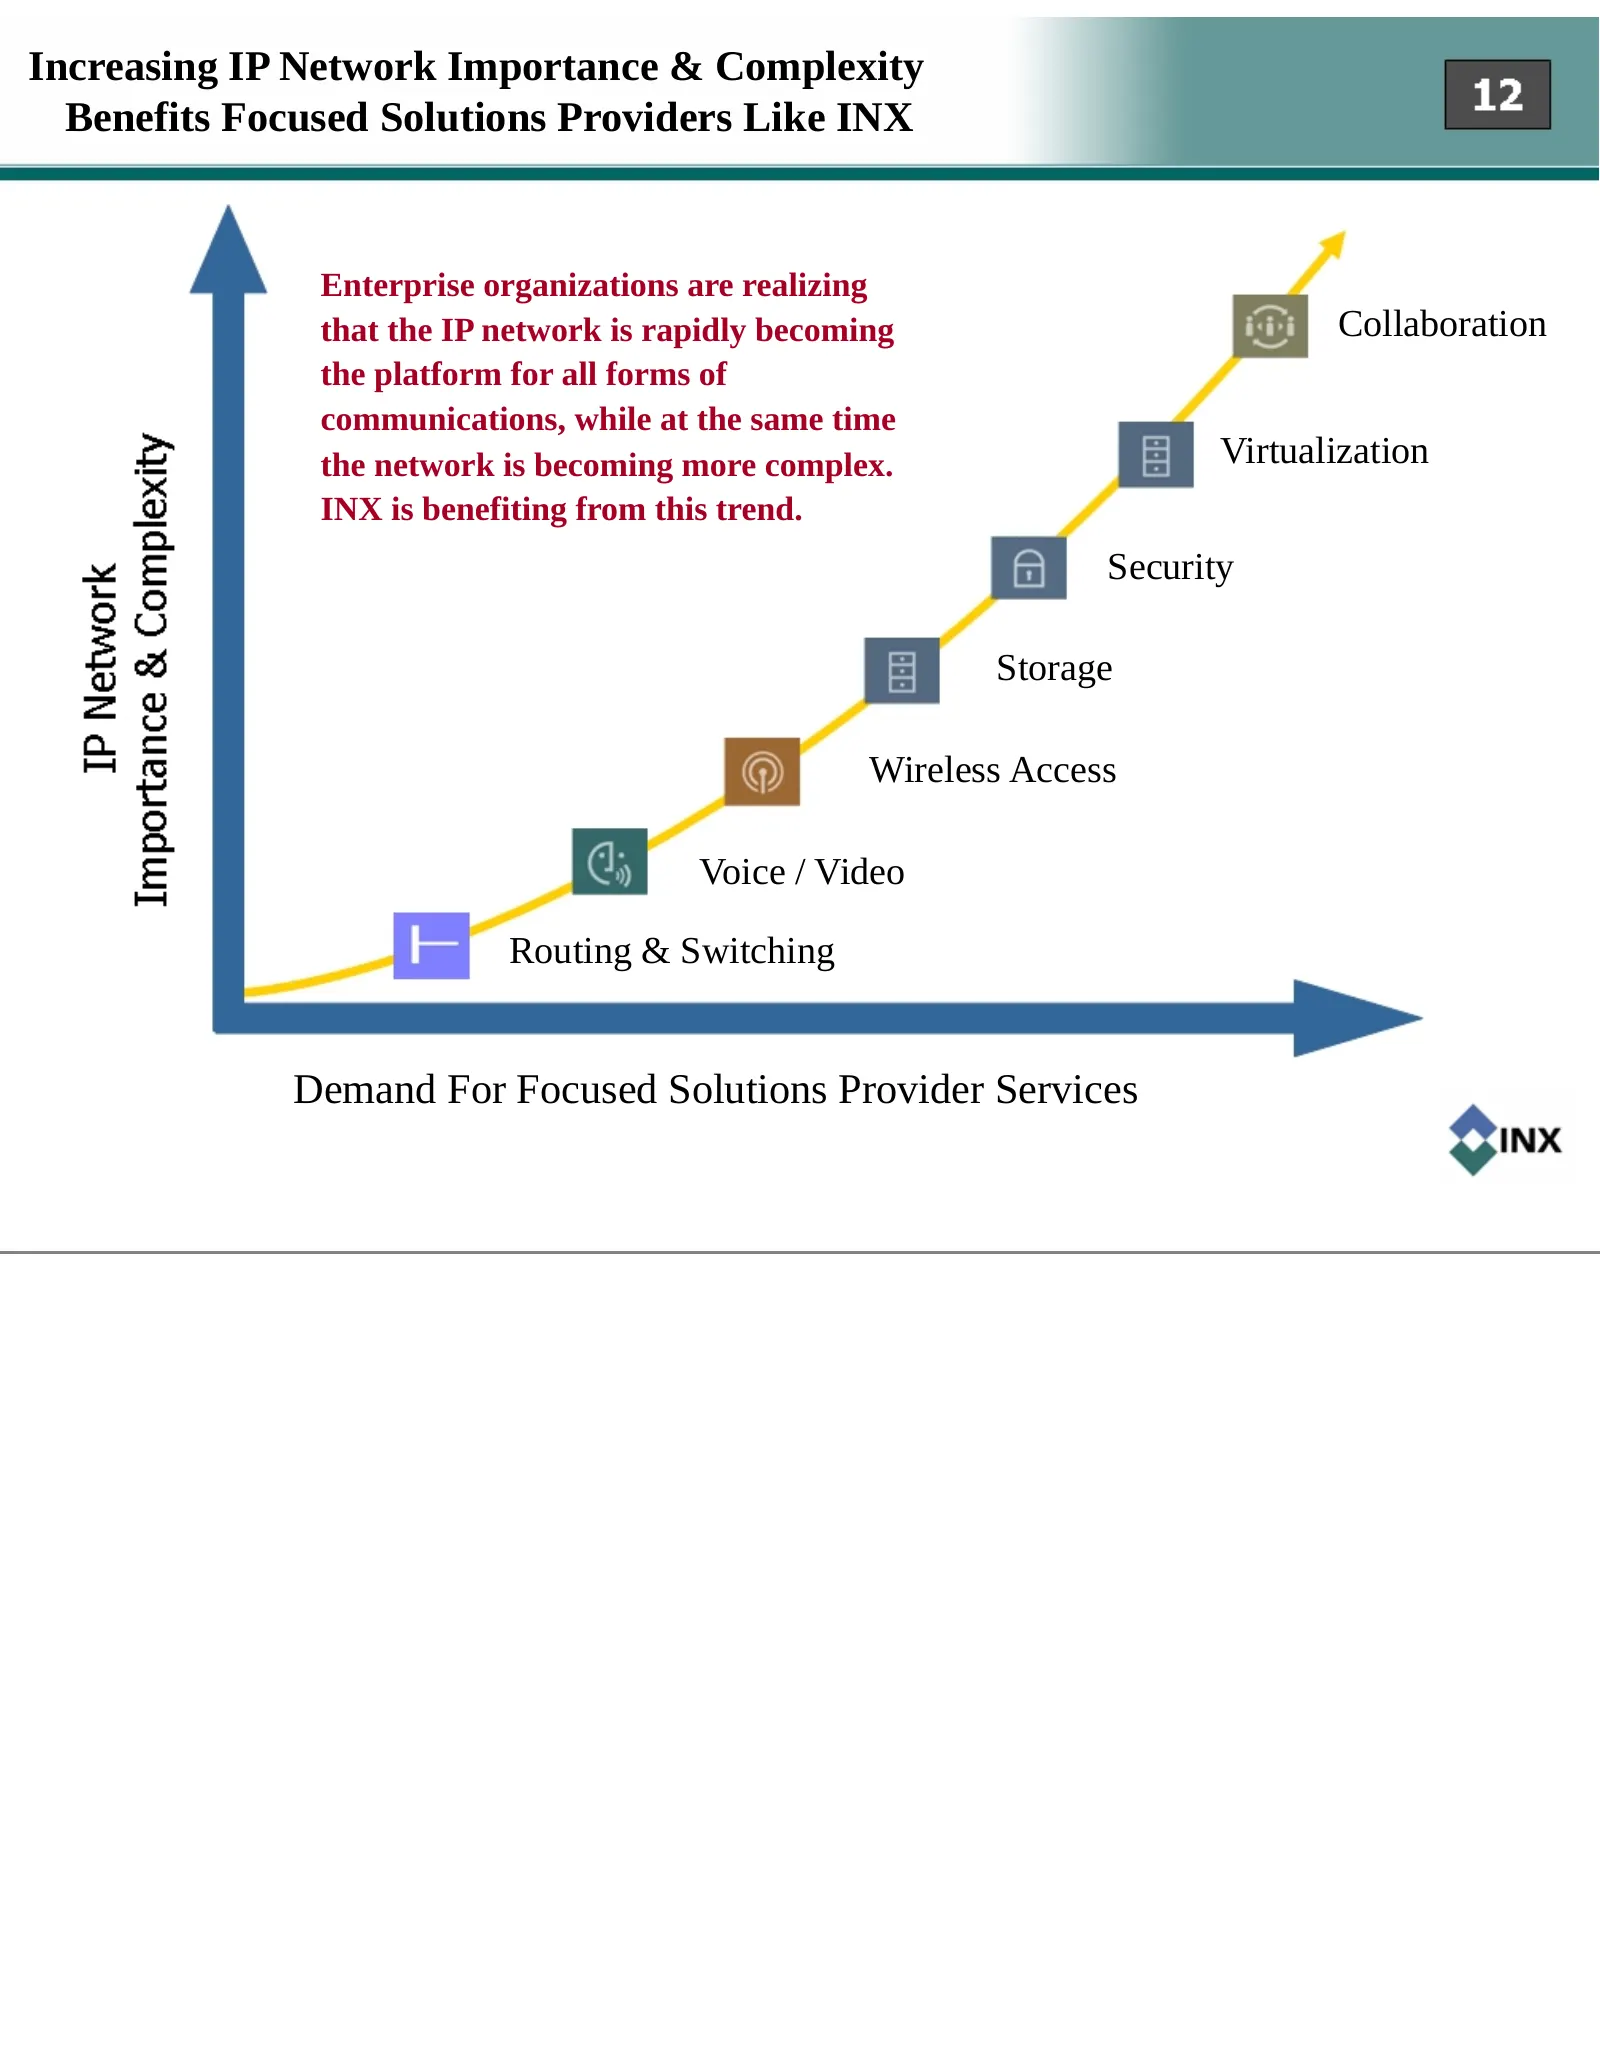
Increasing IP Network Importance & Complexity Benefits Focused Solutions Providers Like INX Enterprise organizations are realizing that the IP network is rapidly becoming Collaboration the platform for all forms of communications, while at the same time the network is becoming more complex. Virtuali
Slide 13: Growth Strategies
Growth Strategies Geographic expansion Grow both the number and the size of clients Make selective, strategic, accretive acquisitions Expand into select, complementary categories of technology such as recent additions of network security, network storage and virtualization as focused practice areas
Slide 14: Geographic Expansion - 3X Growth Since Mid-2005
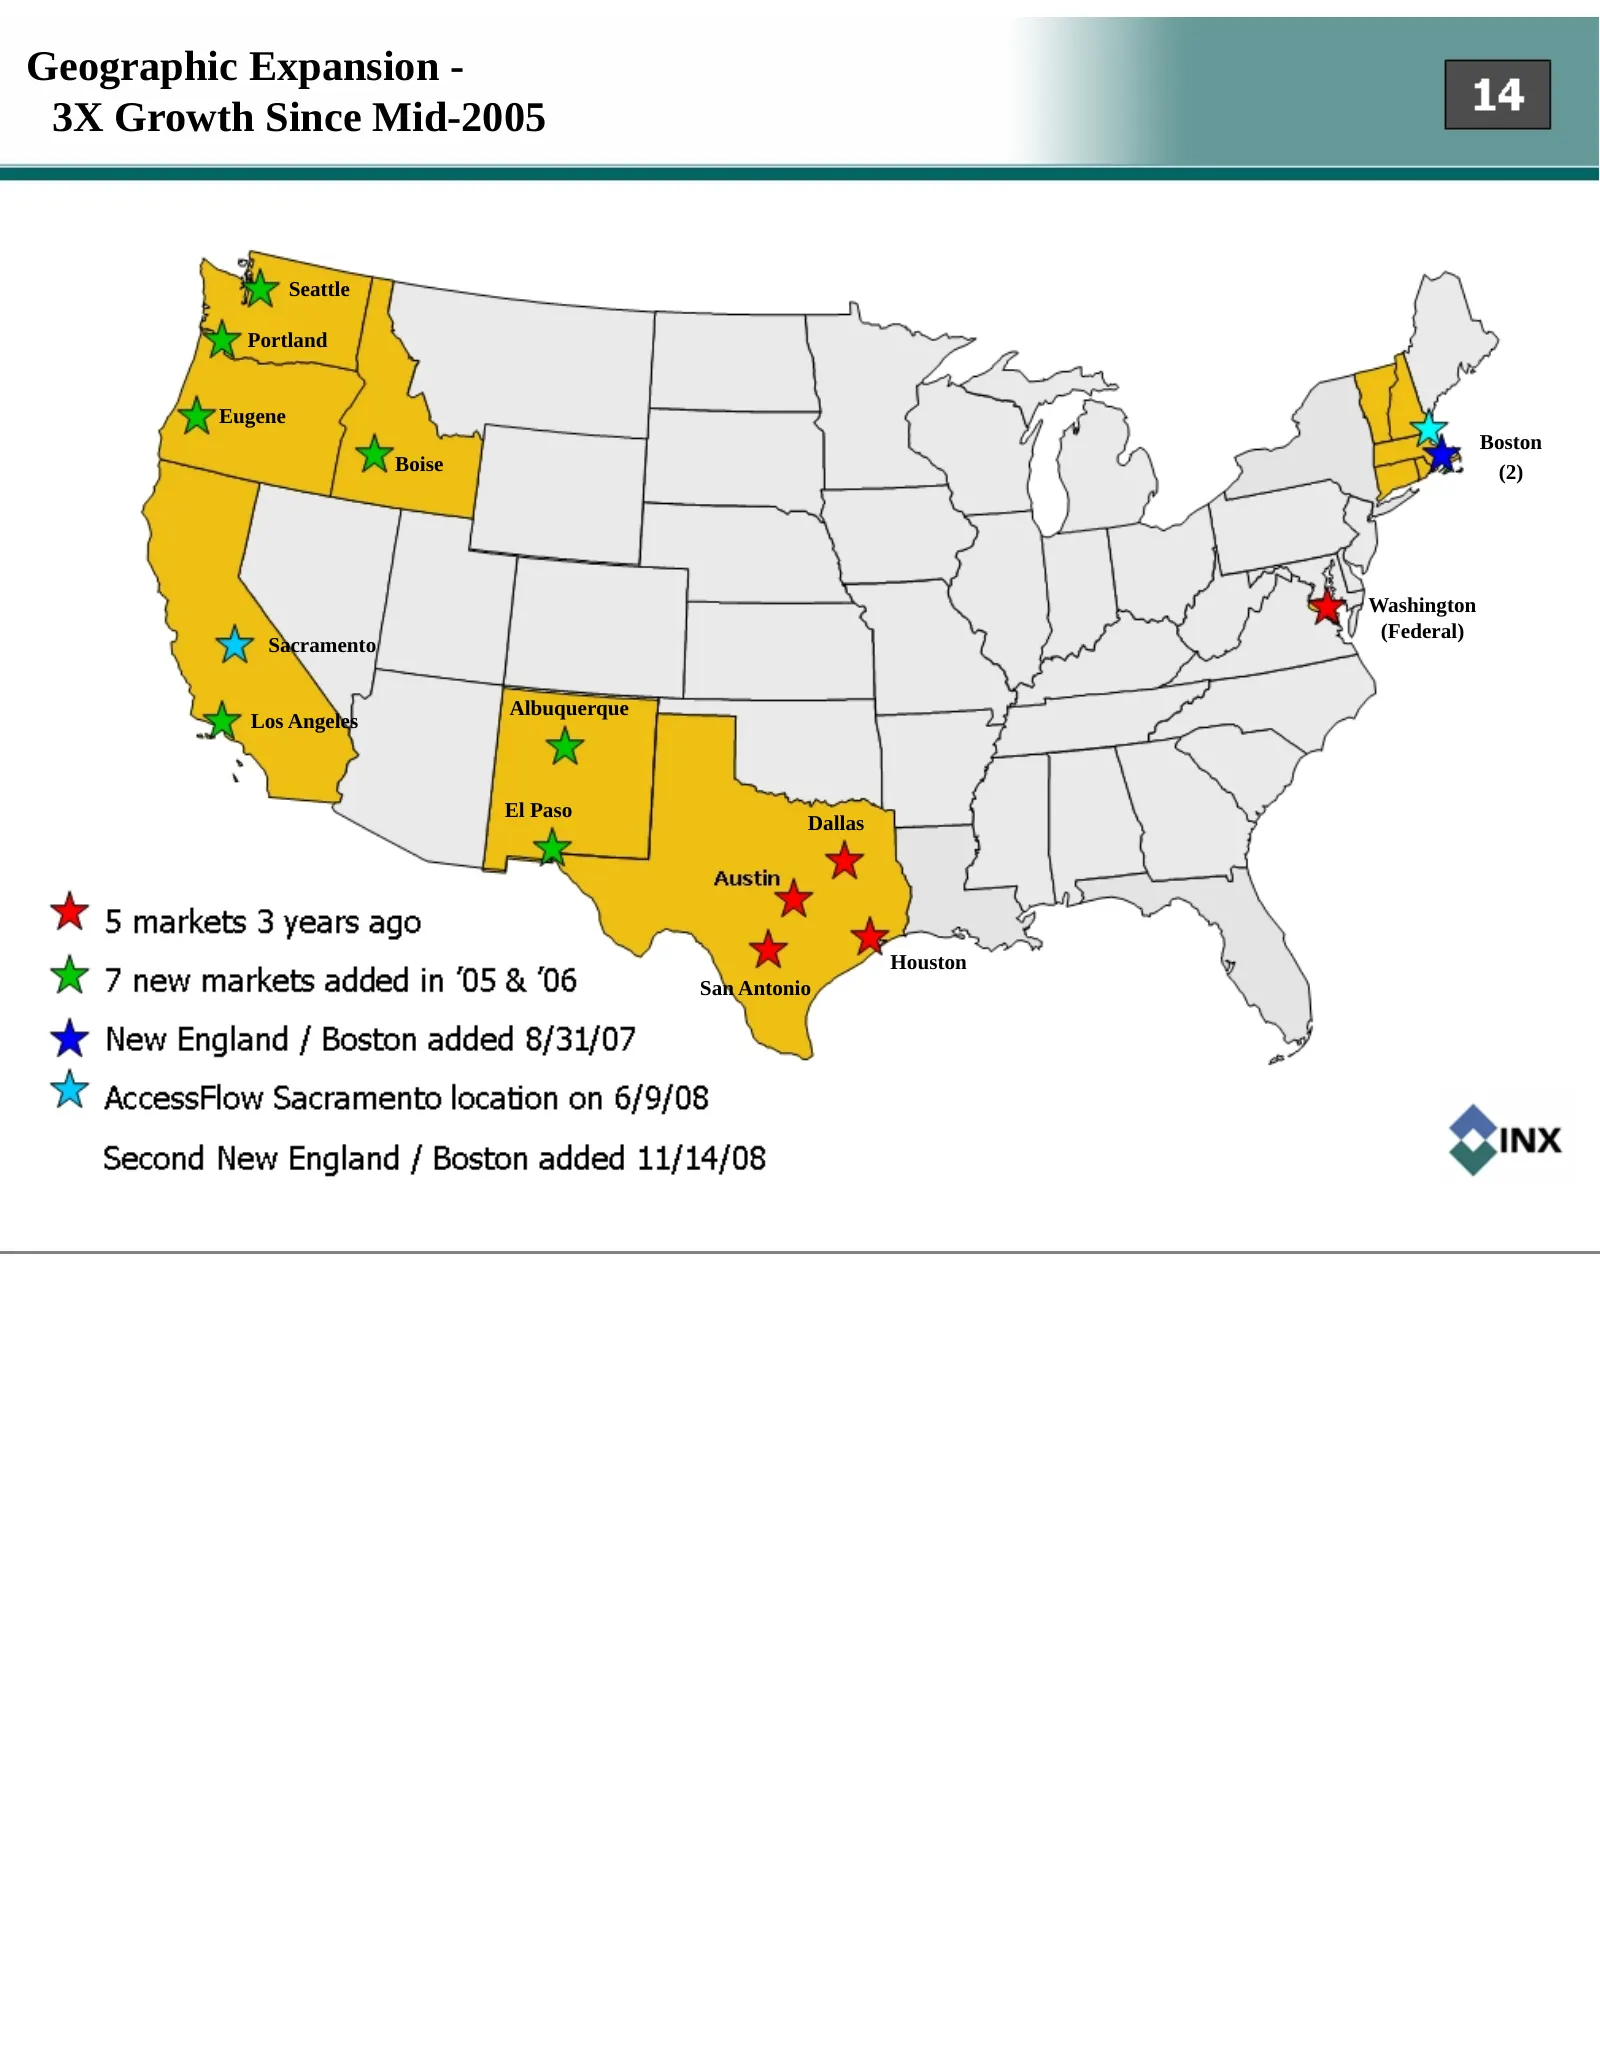
Geographic Expansion - 3X Growth Since Mid-2005 Seattle Portland Eugene Boston Boise (2) Washington (Federal) Sacramento Albuquerque Los Angeles El Paso Dallas Houston San Antonio
Slide 15: Increasing Number and Size of Customers
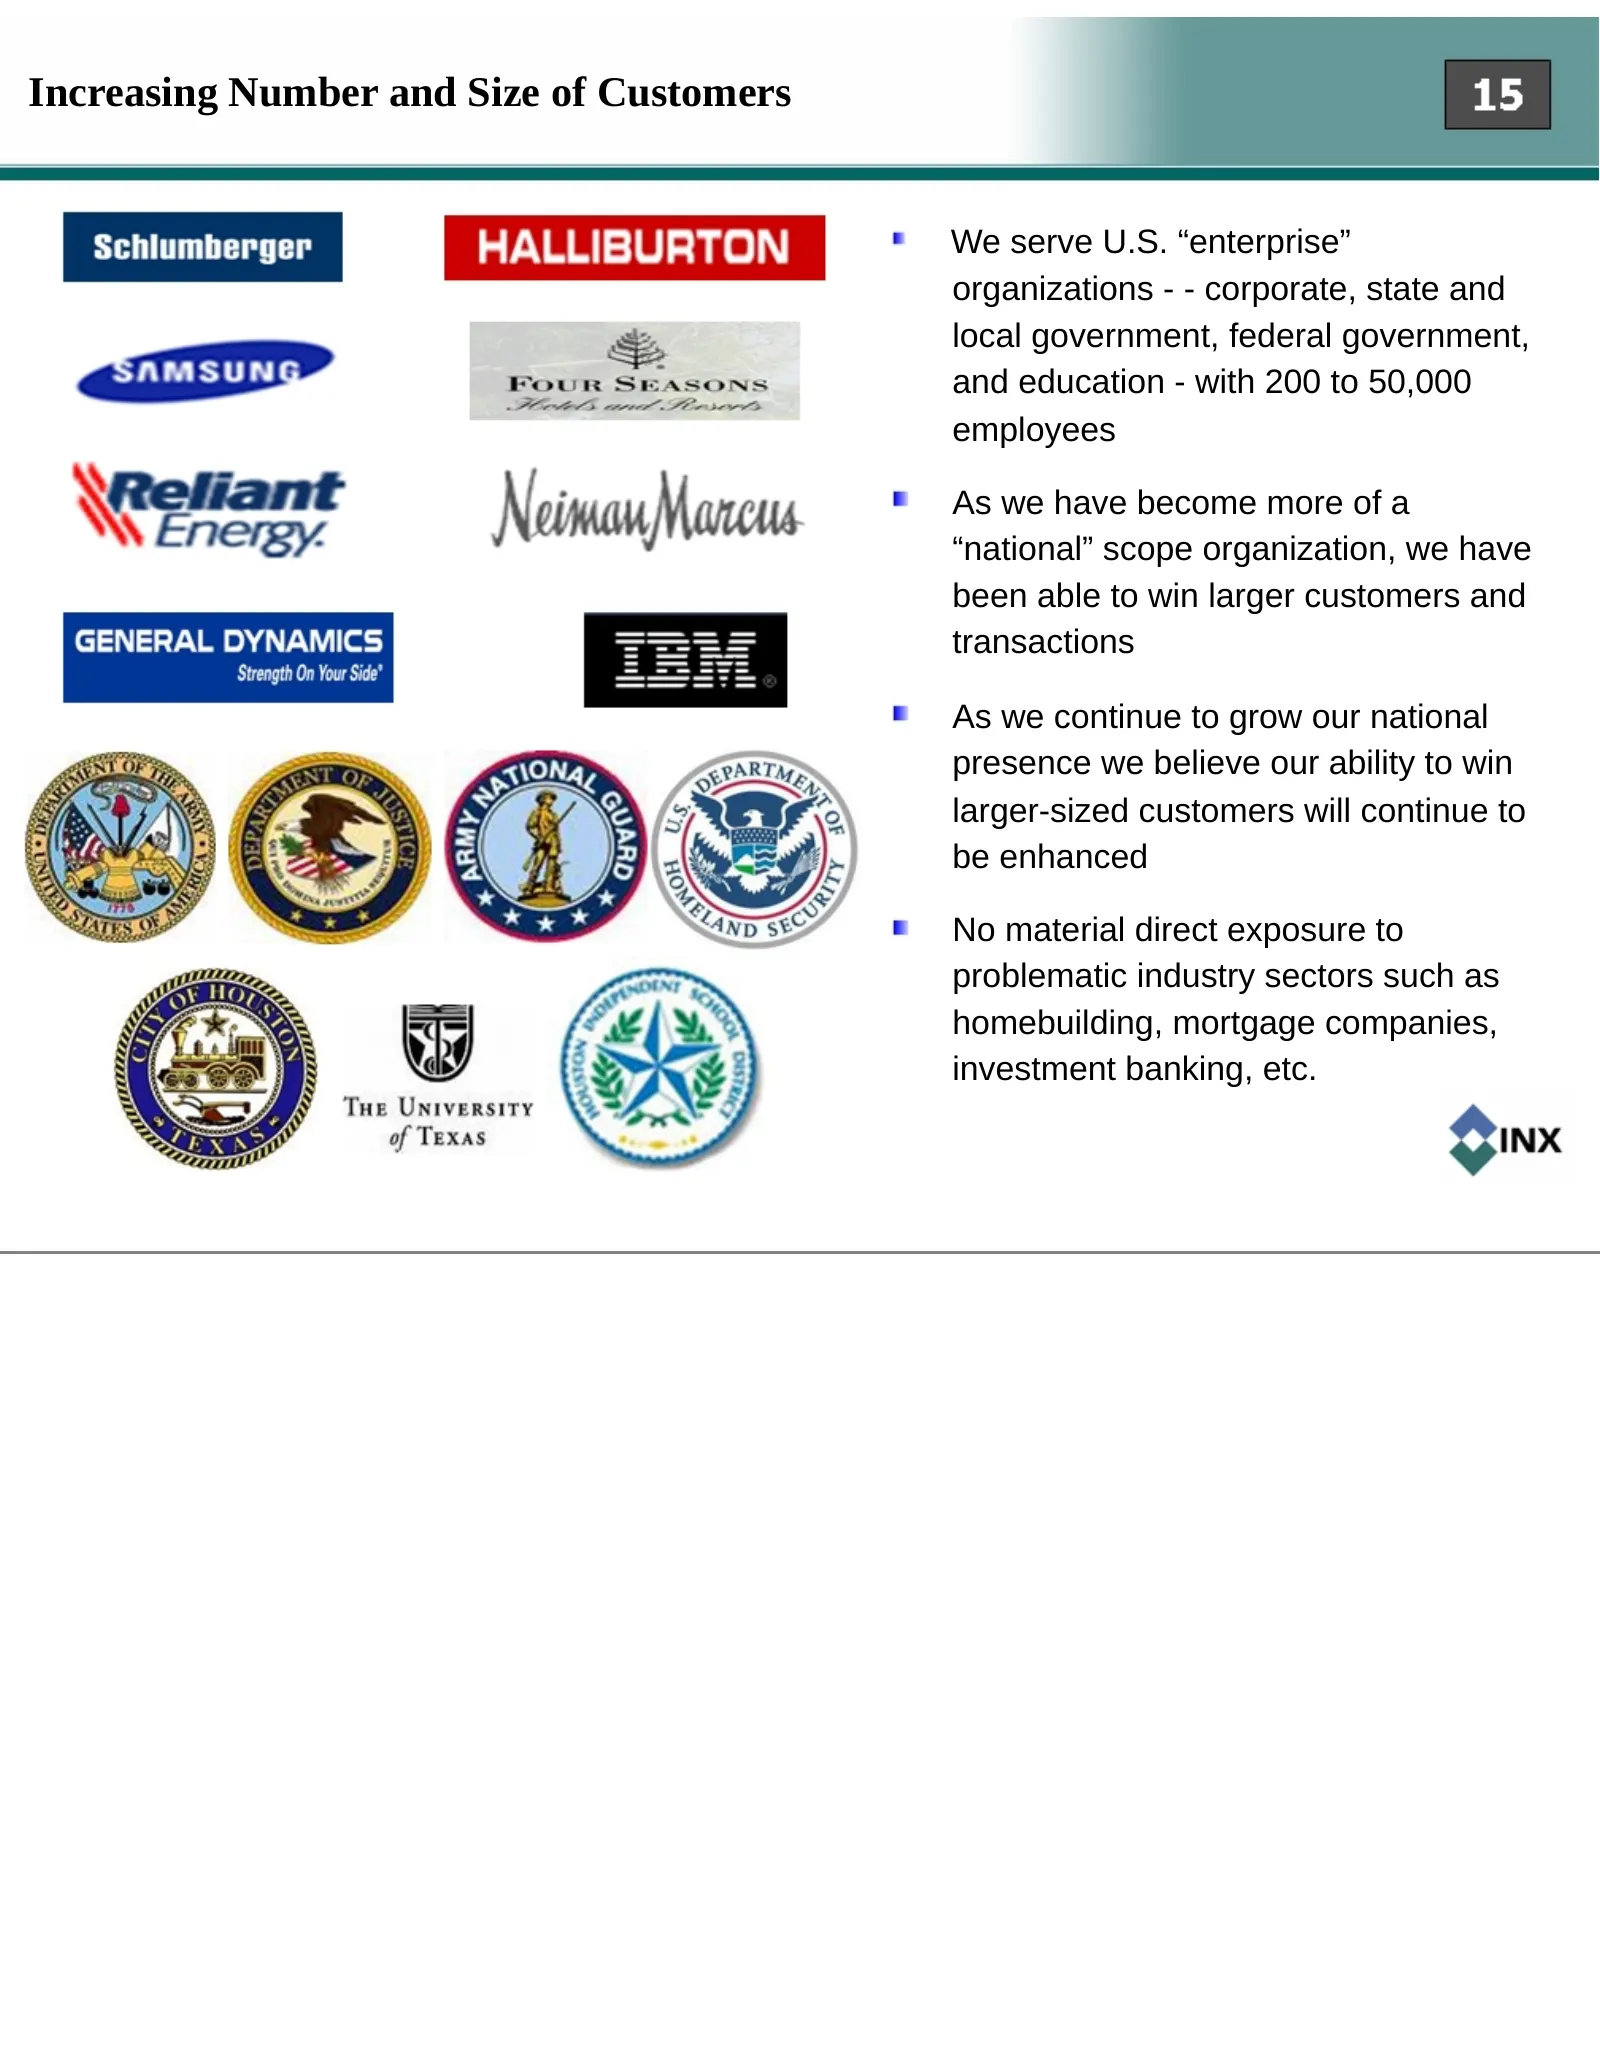
Increasing Number and Size of Customers We serve U.S. “enterprise” organizations - - corporate, state and local government, federal government, and education - with 200 to 50,000 employees As we have become more of a “national” scope organization, we have been able to win larger customers and transa
Slide 16: Competition: National Presence + Focus & Expertise Are Competitive Advantages
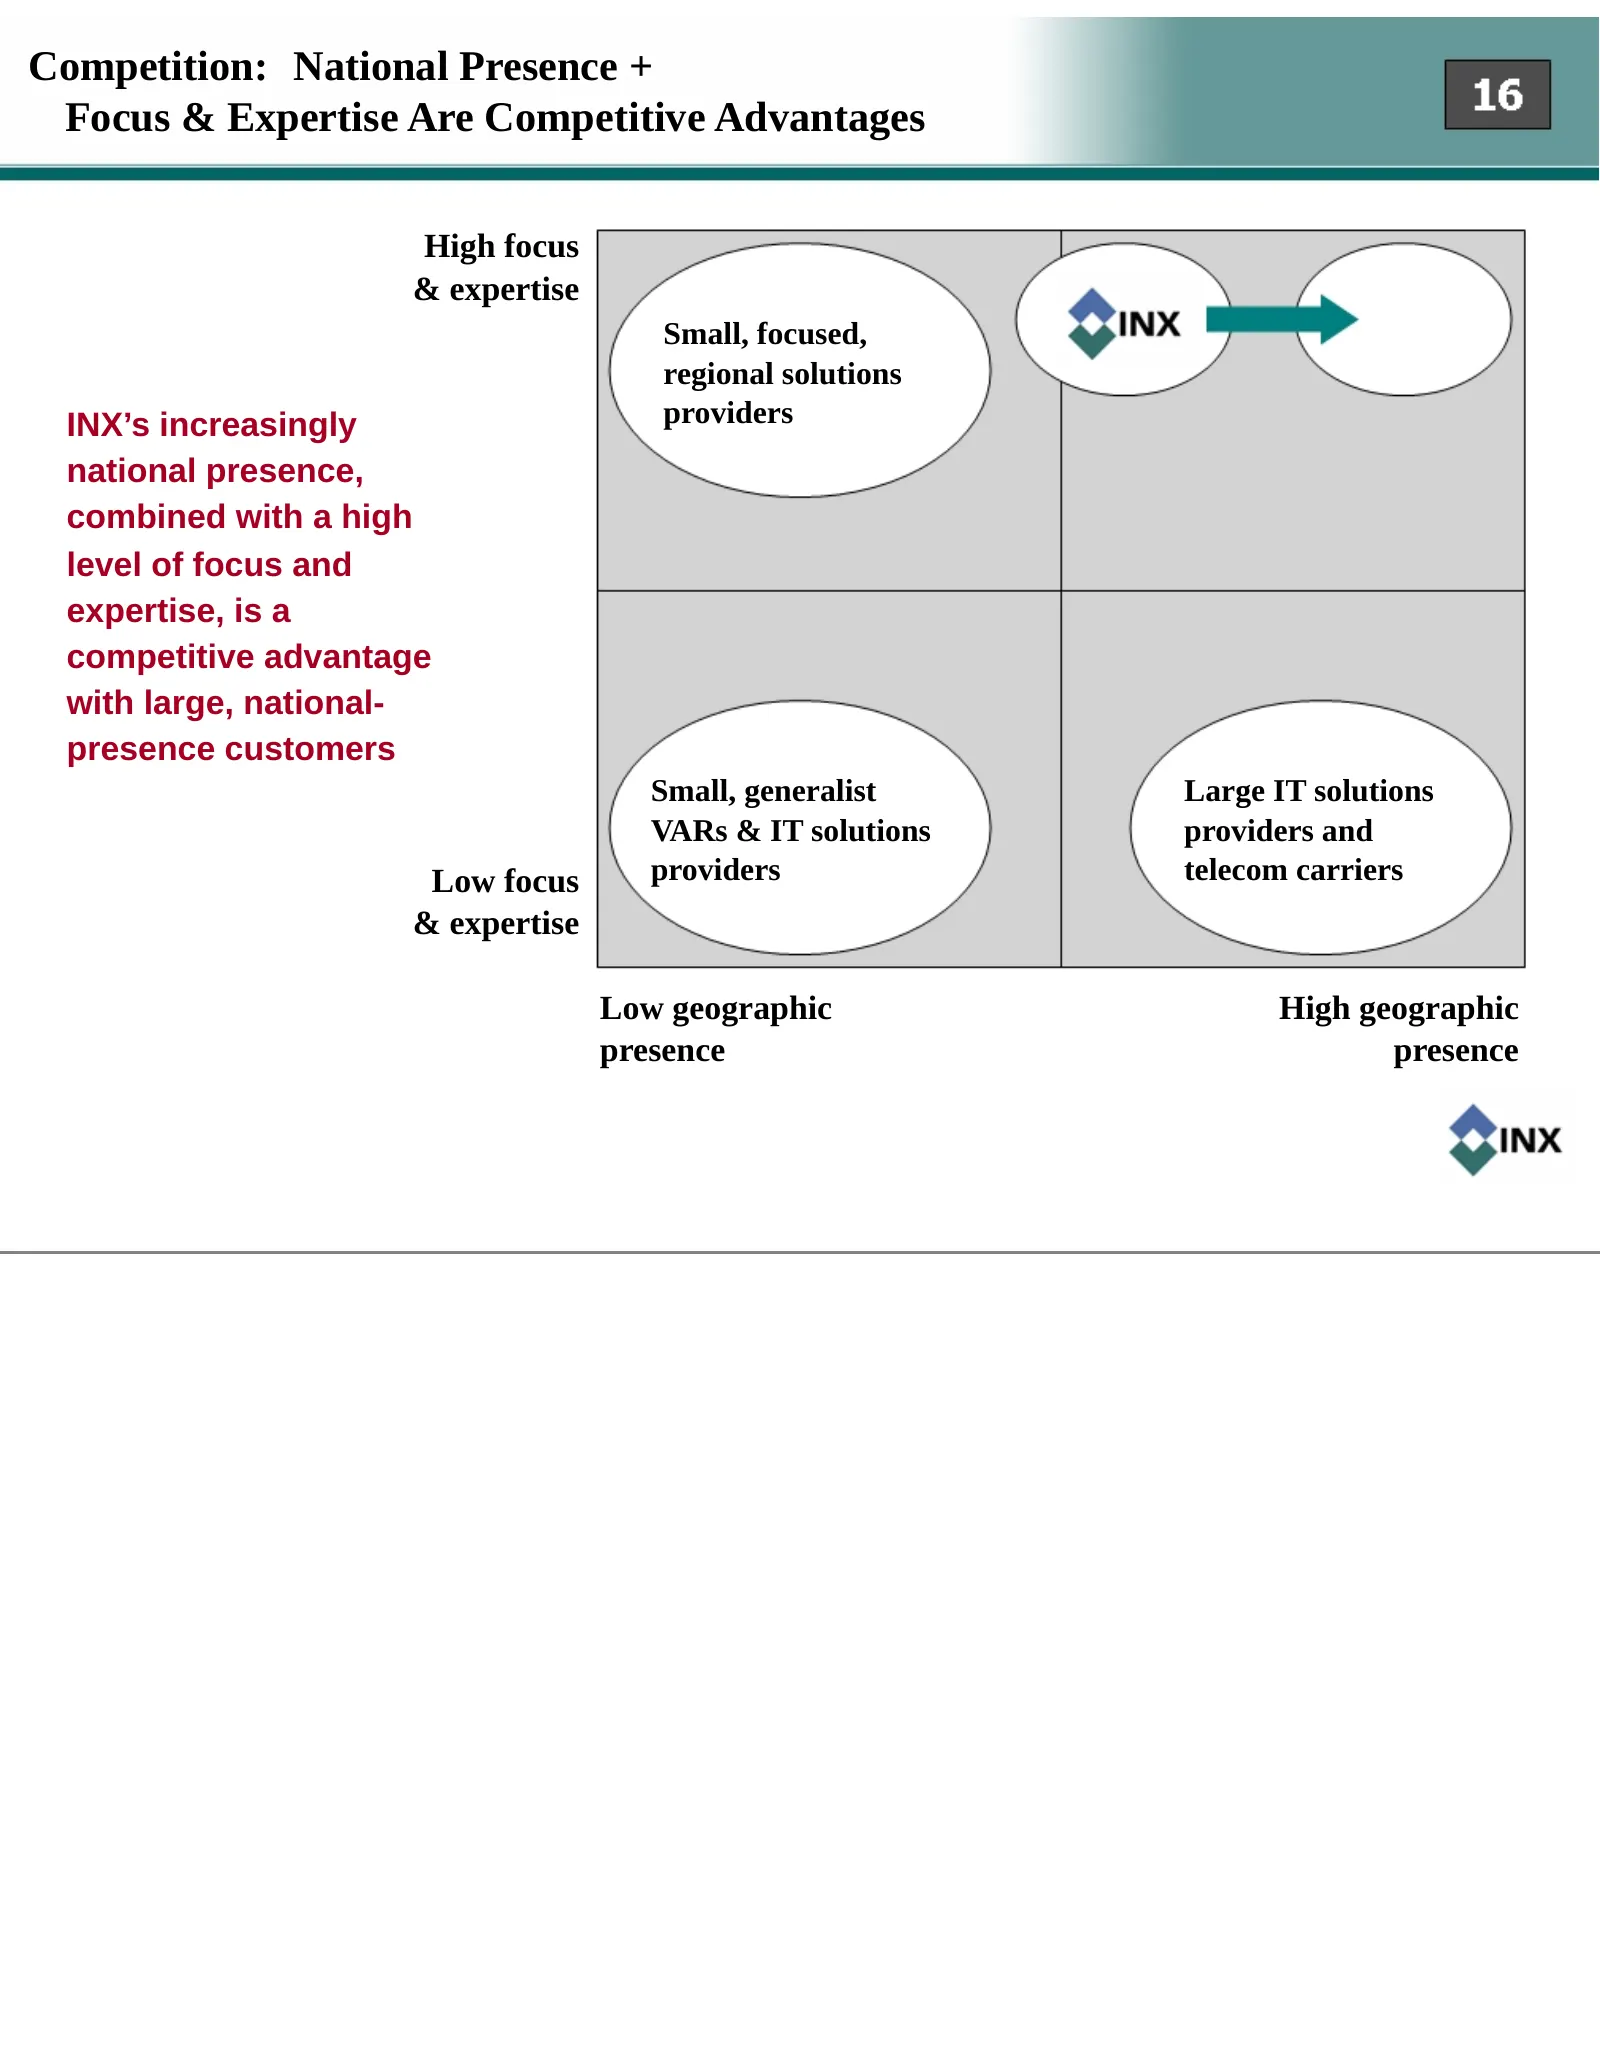
Competition: National Presence + Focus & Expertise Are Competitive Advantages High focus & expertise Small, focused, regional solutions INX’s increasingly providers national presence, combined with a high level of focus and expertise, is a competitive advantage with large, national- presence custome
Slide 17: Operating Financial Performance
Operating Financial Performance
Slide 18: Staffing Trends - Key To Both Growth and Improving Margins
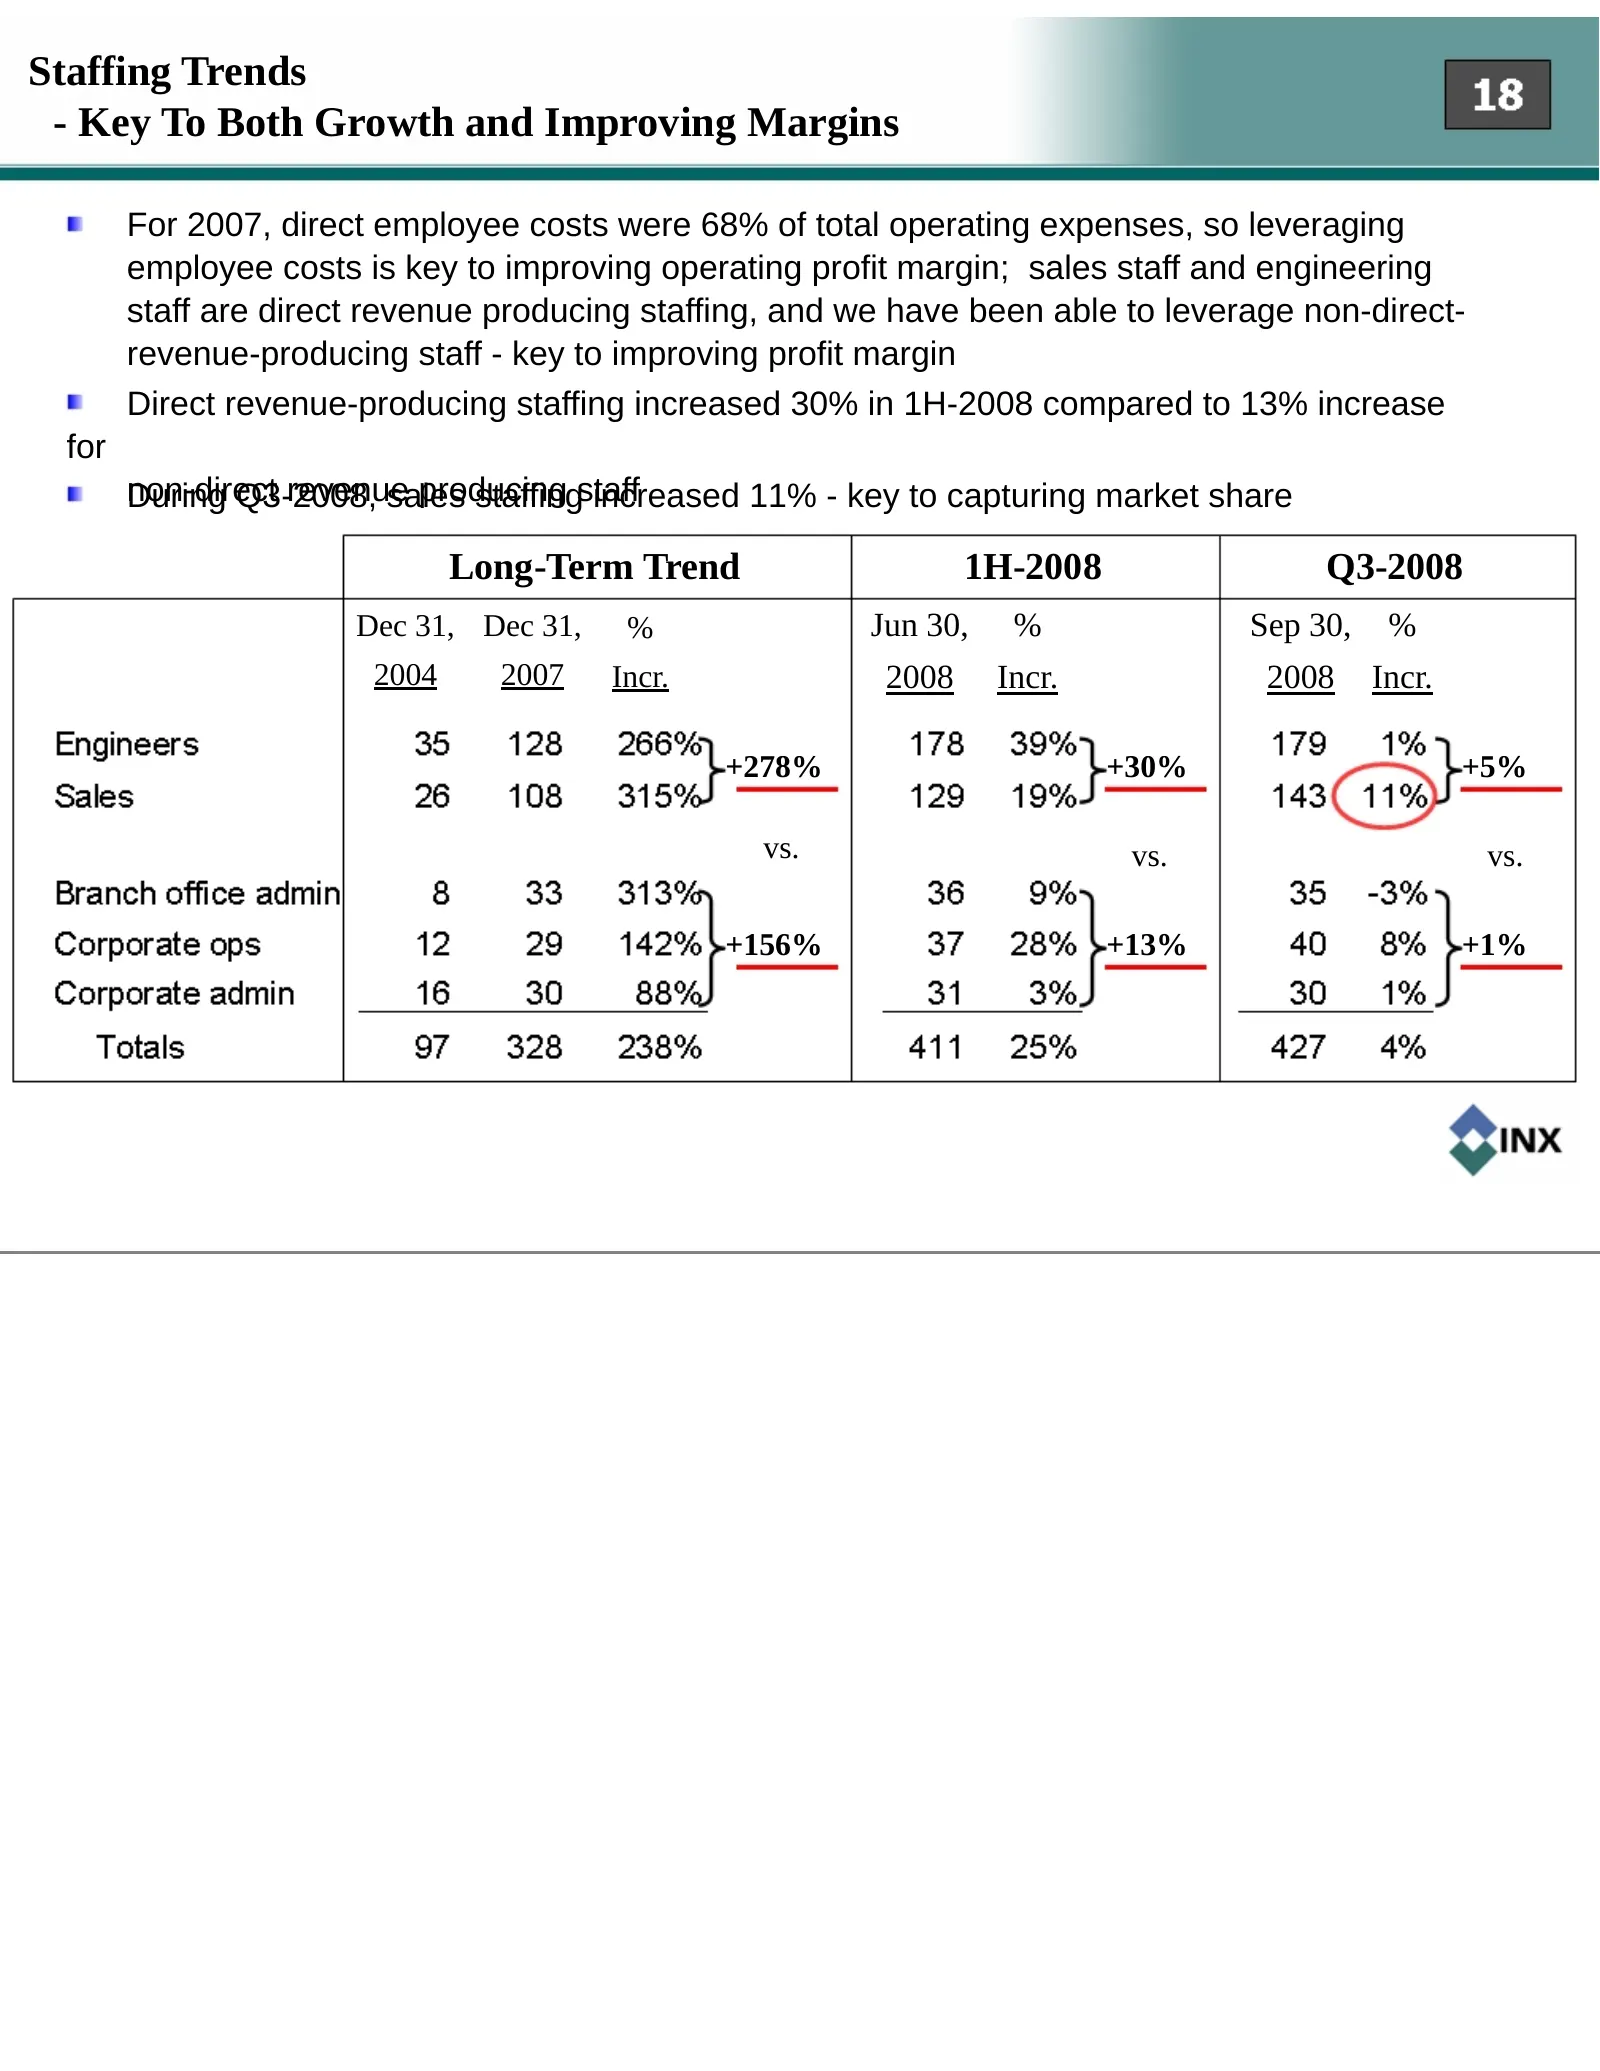
Staffing Trends - Key To Both Growth and Improving Margins For 2007, direct employee costs were 68% of total operating expenses, so leveraging employee costs is key to improving operating profit margin; sales staff and engineering staff are direct revenue producing staffing, and we have been able to
Slide 19: Gross Margin (Product vs. Services Revenue Sources)
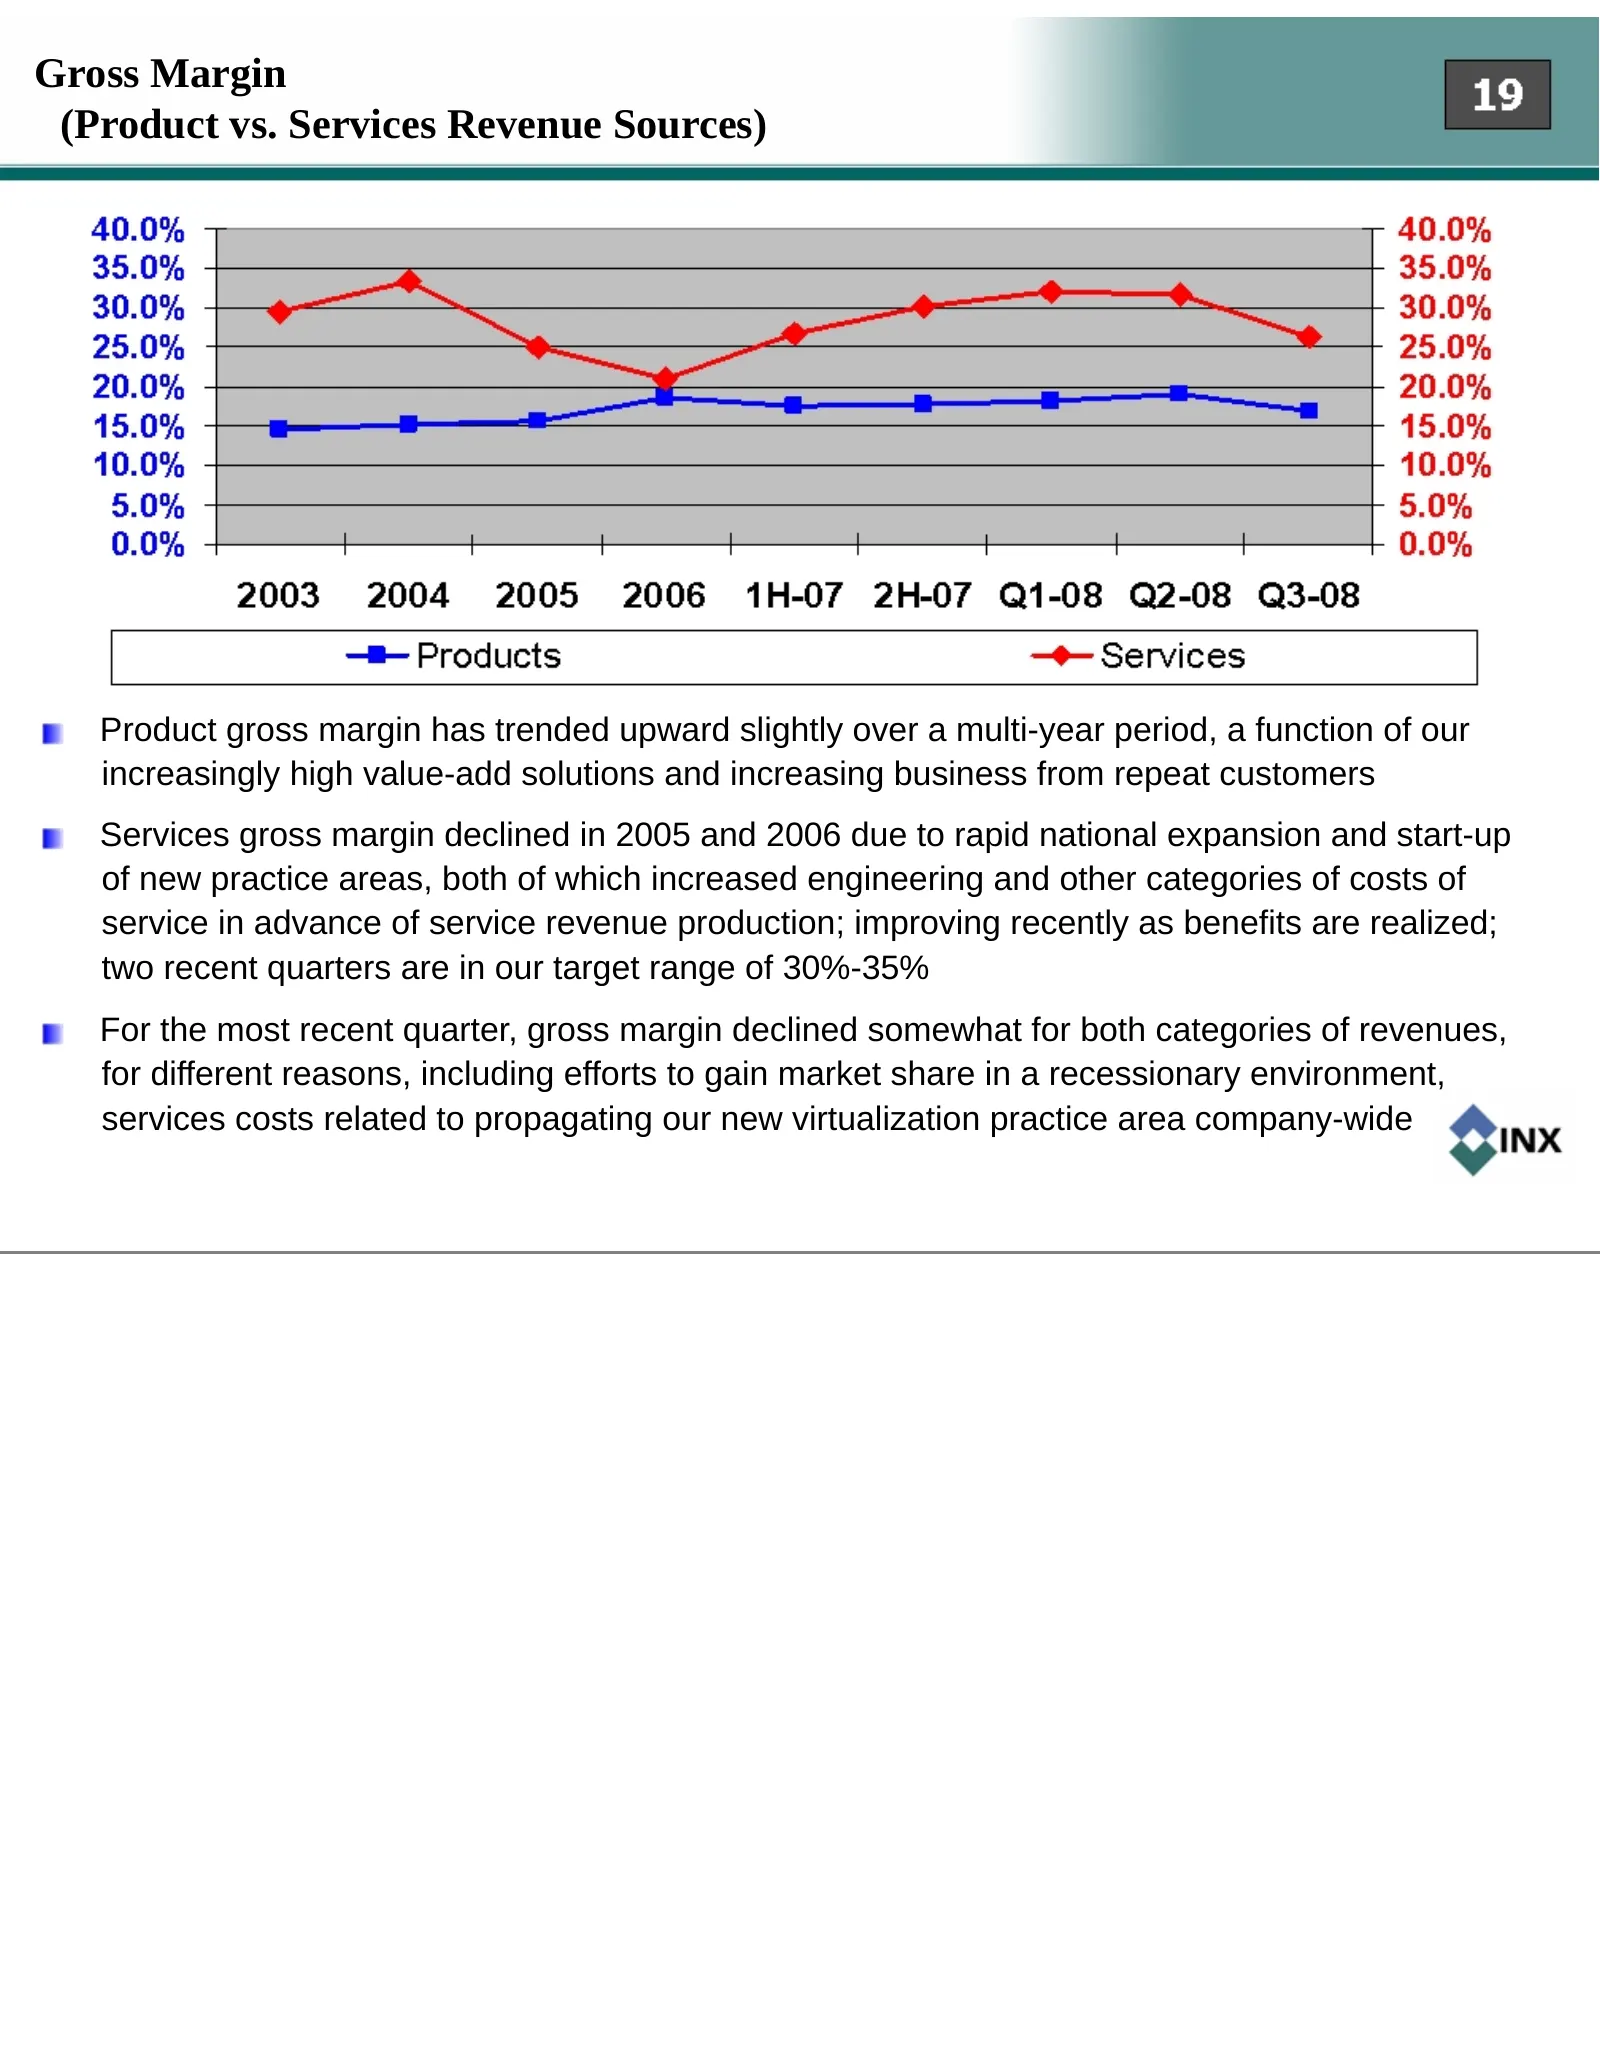
Gross Margin (Product vs. Services Revenue Sources) Product gross margin has trended upward slightly over a multi-year period, a function of our increasingly high value-add solutions and increasing business from repeat customers Services gross margin declined in 2005 and 2006 due to rapid national e
Slide 20: Gross and Operating Profit Margin
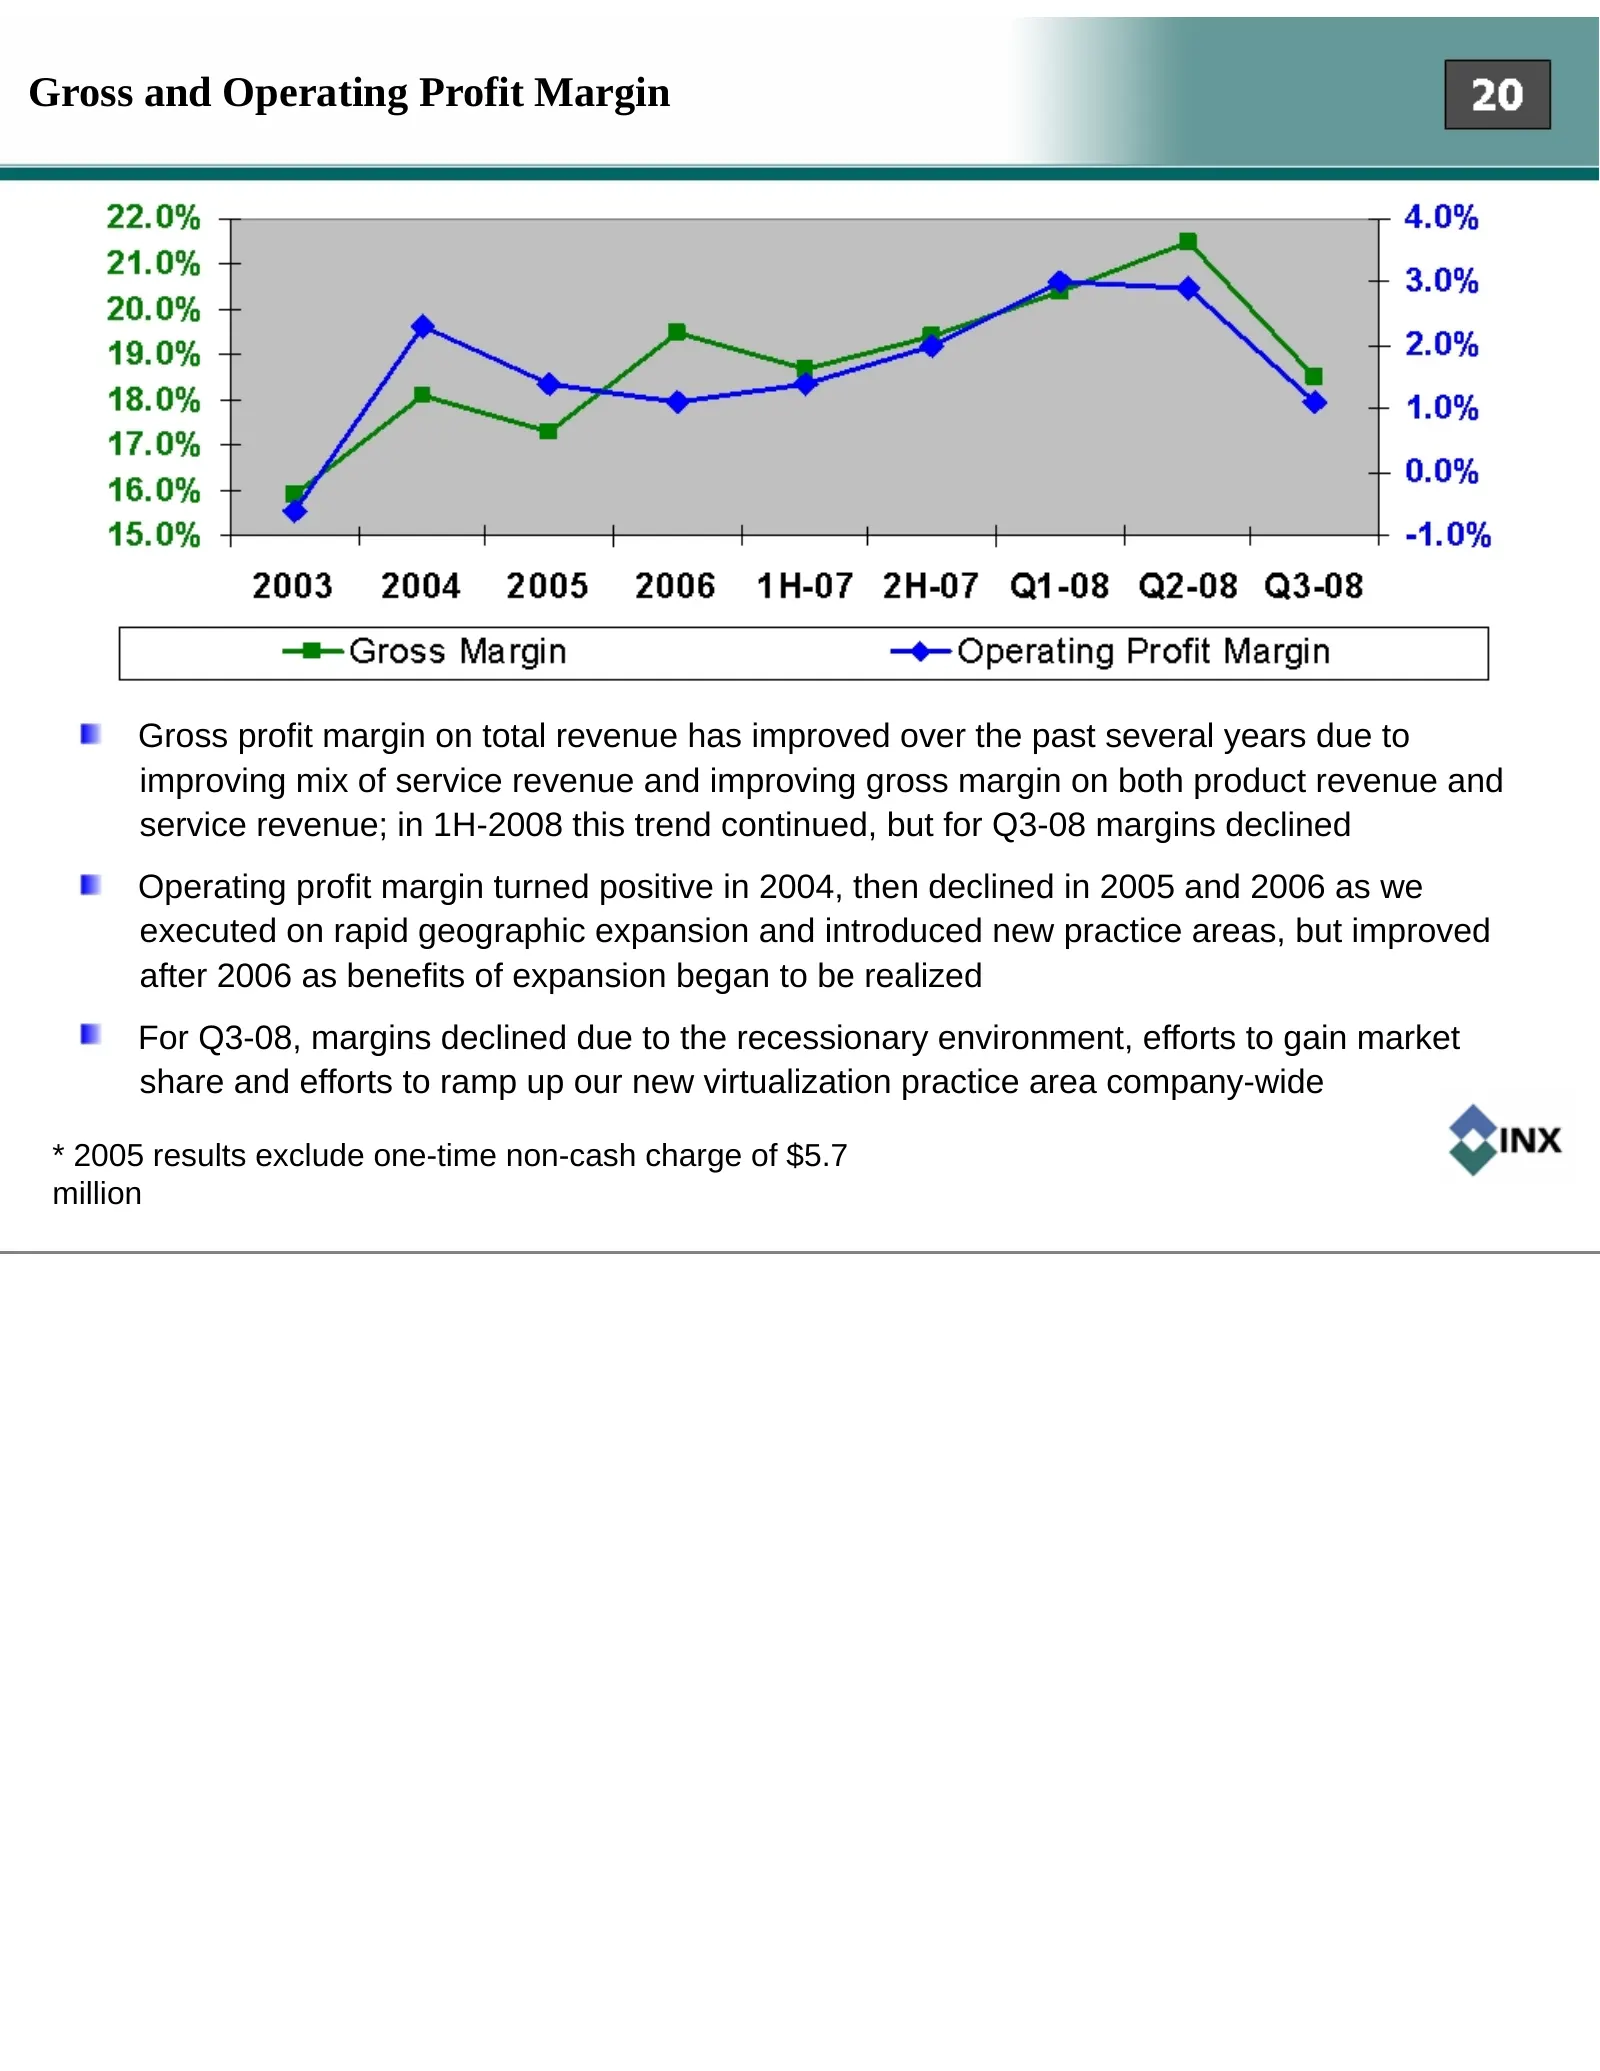
Gross and Operating Profit Margin Gross profit margin on total revenue has improved over the past several years due to improving mix of service revenue and improving gross margin on both product revenue and service revenue; in 1H-2008 this trend continued, but for Q3-08 margins declined Operating pr
Slide 21: Improving Per Diluted Share Operating Results
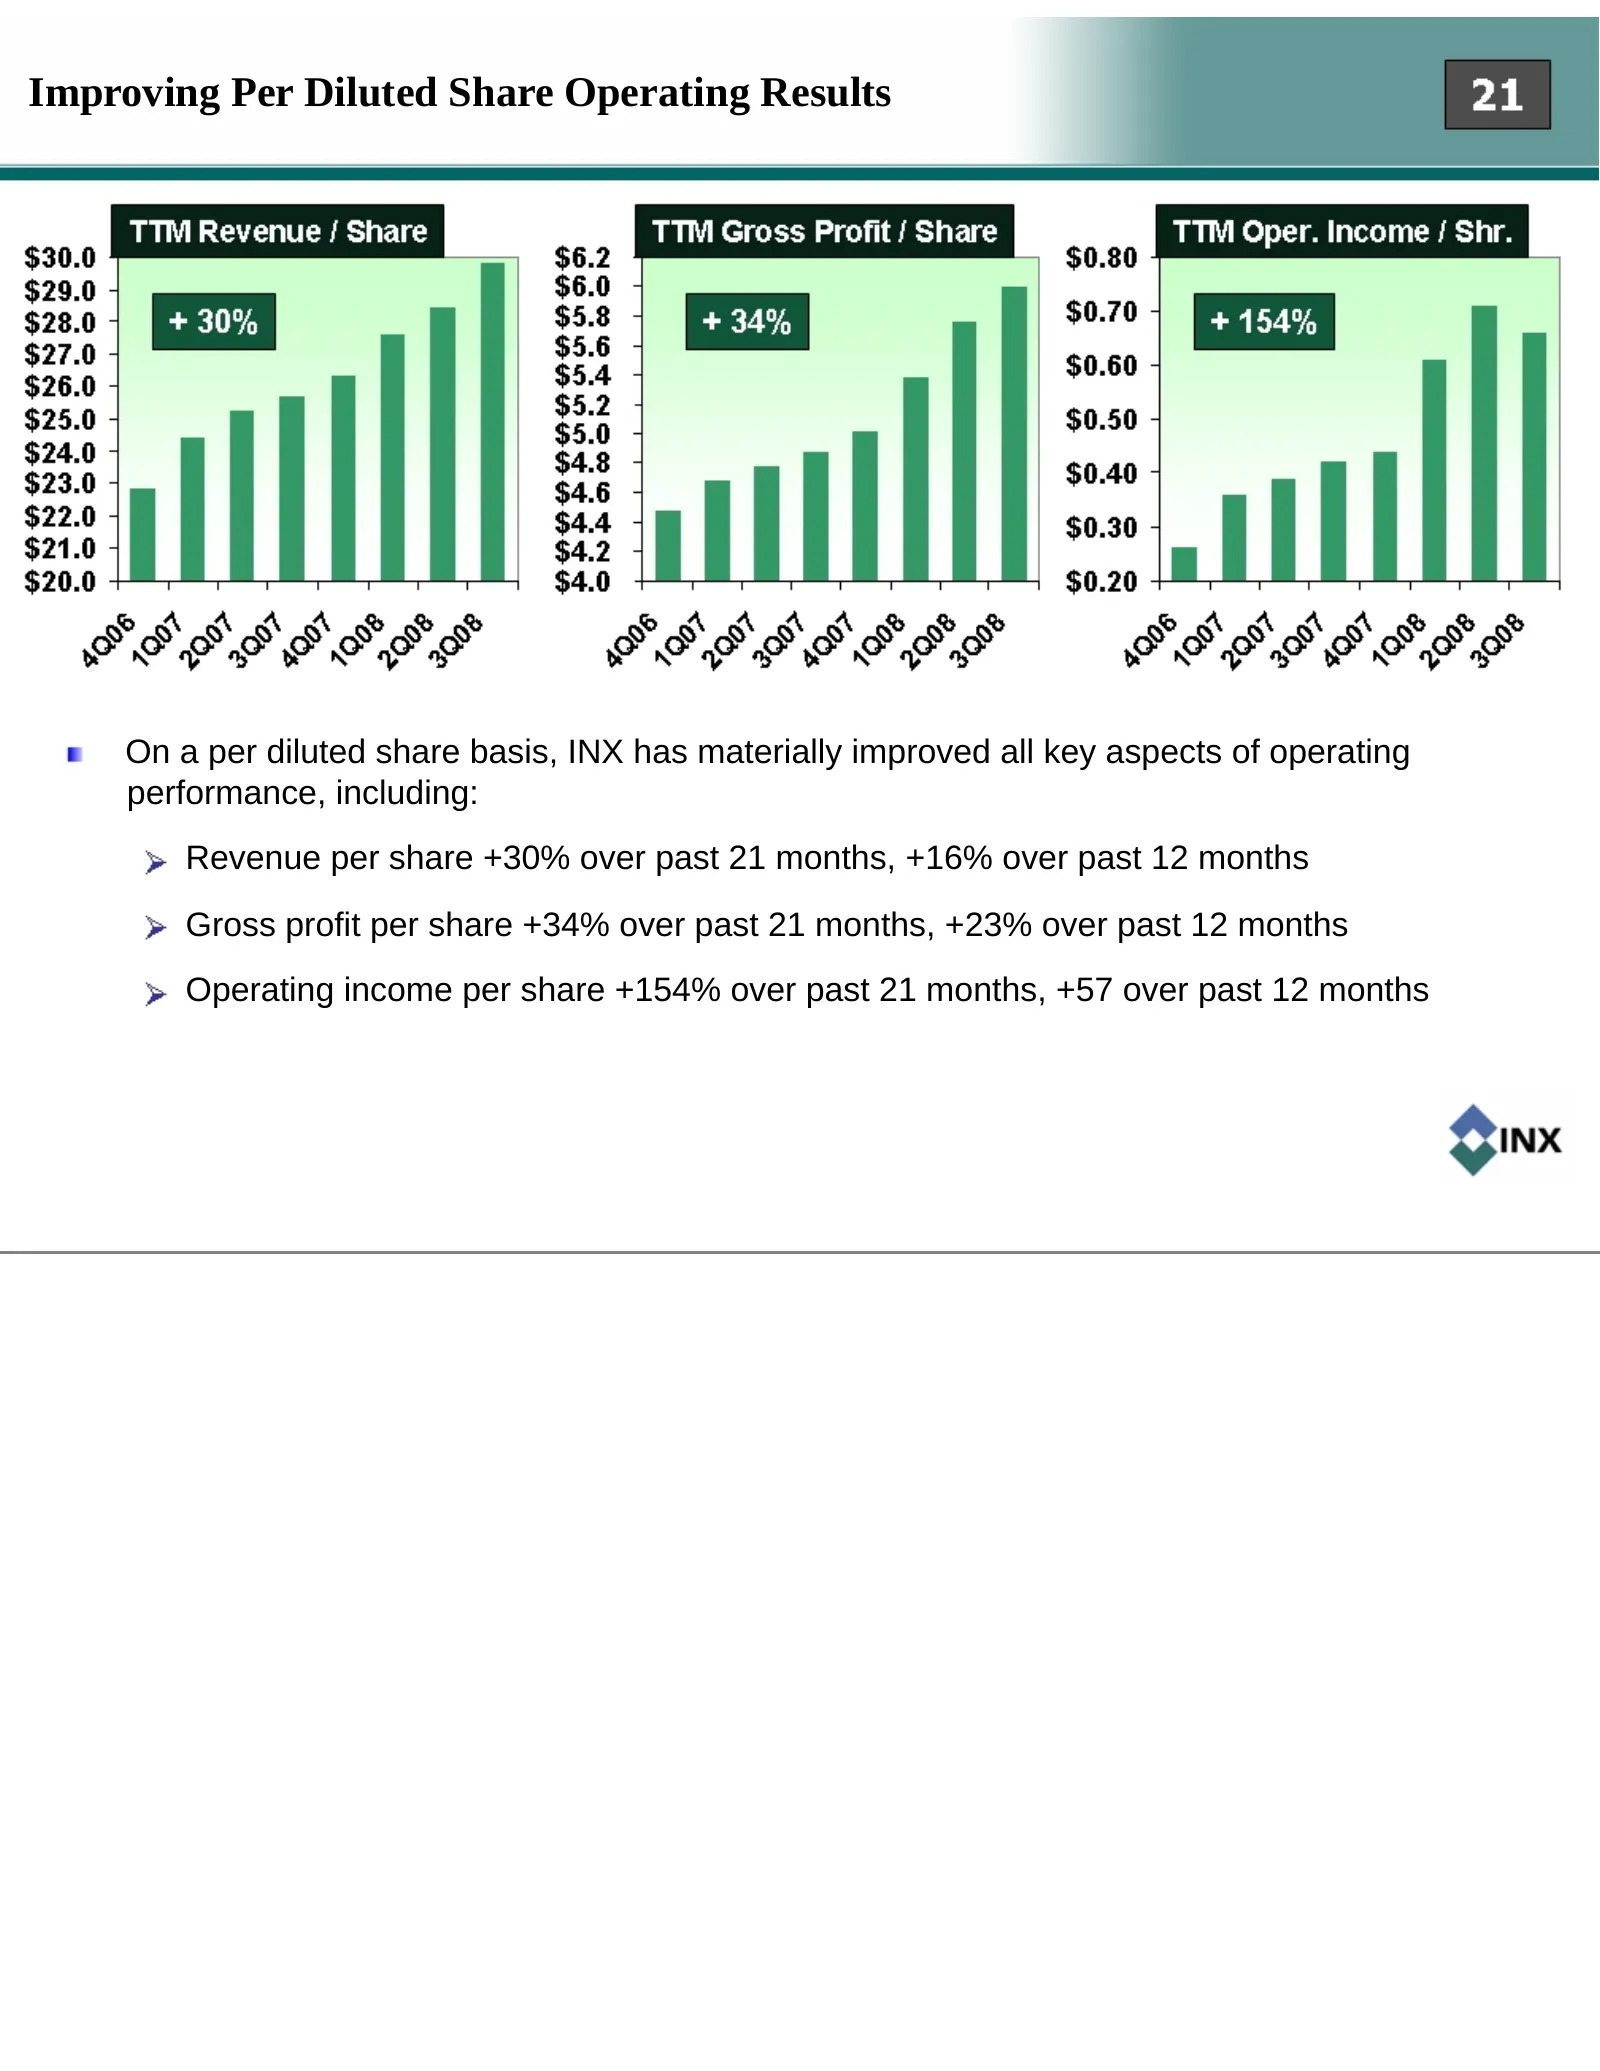
Improving Per Diluted Share Operating Results On a per diluted share basis, INX has materially improved all key aspects of operating performance, including: Revenue per share +30% over past 21 months, +16% over past 12 months Gross profit per share +34% over past 21 months, +23% over past 12 months
Slide 22: Improving Return On Capital Used In Operations
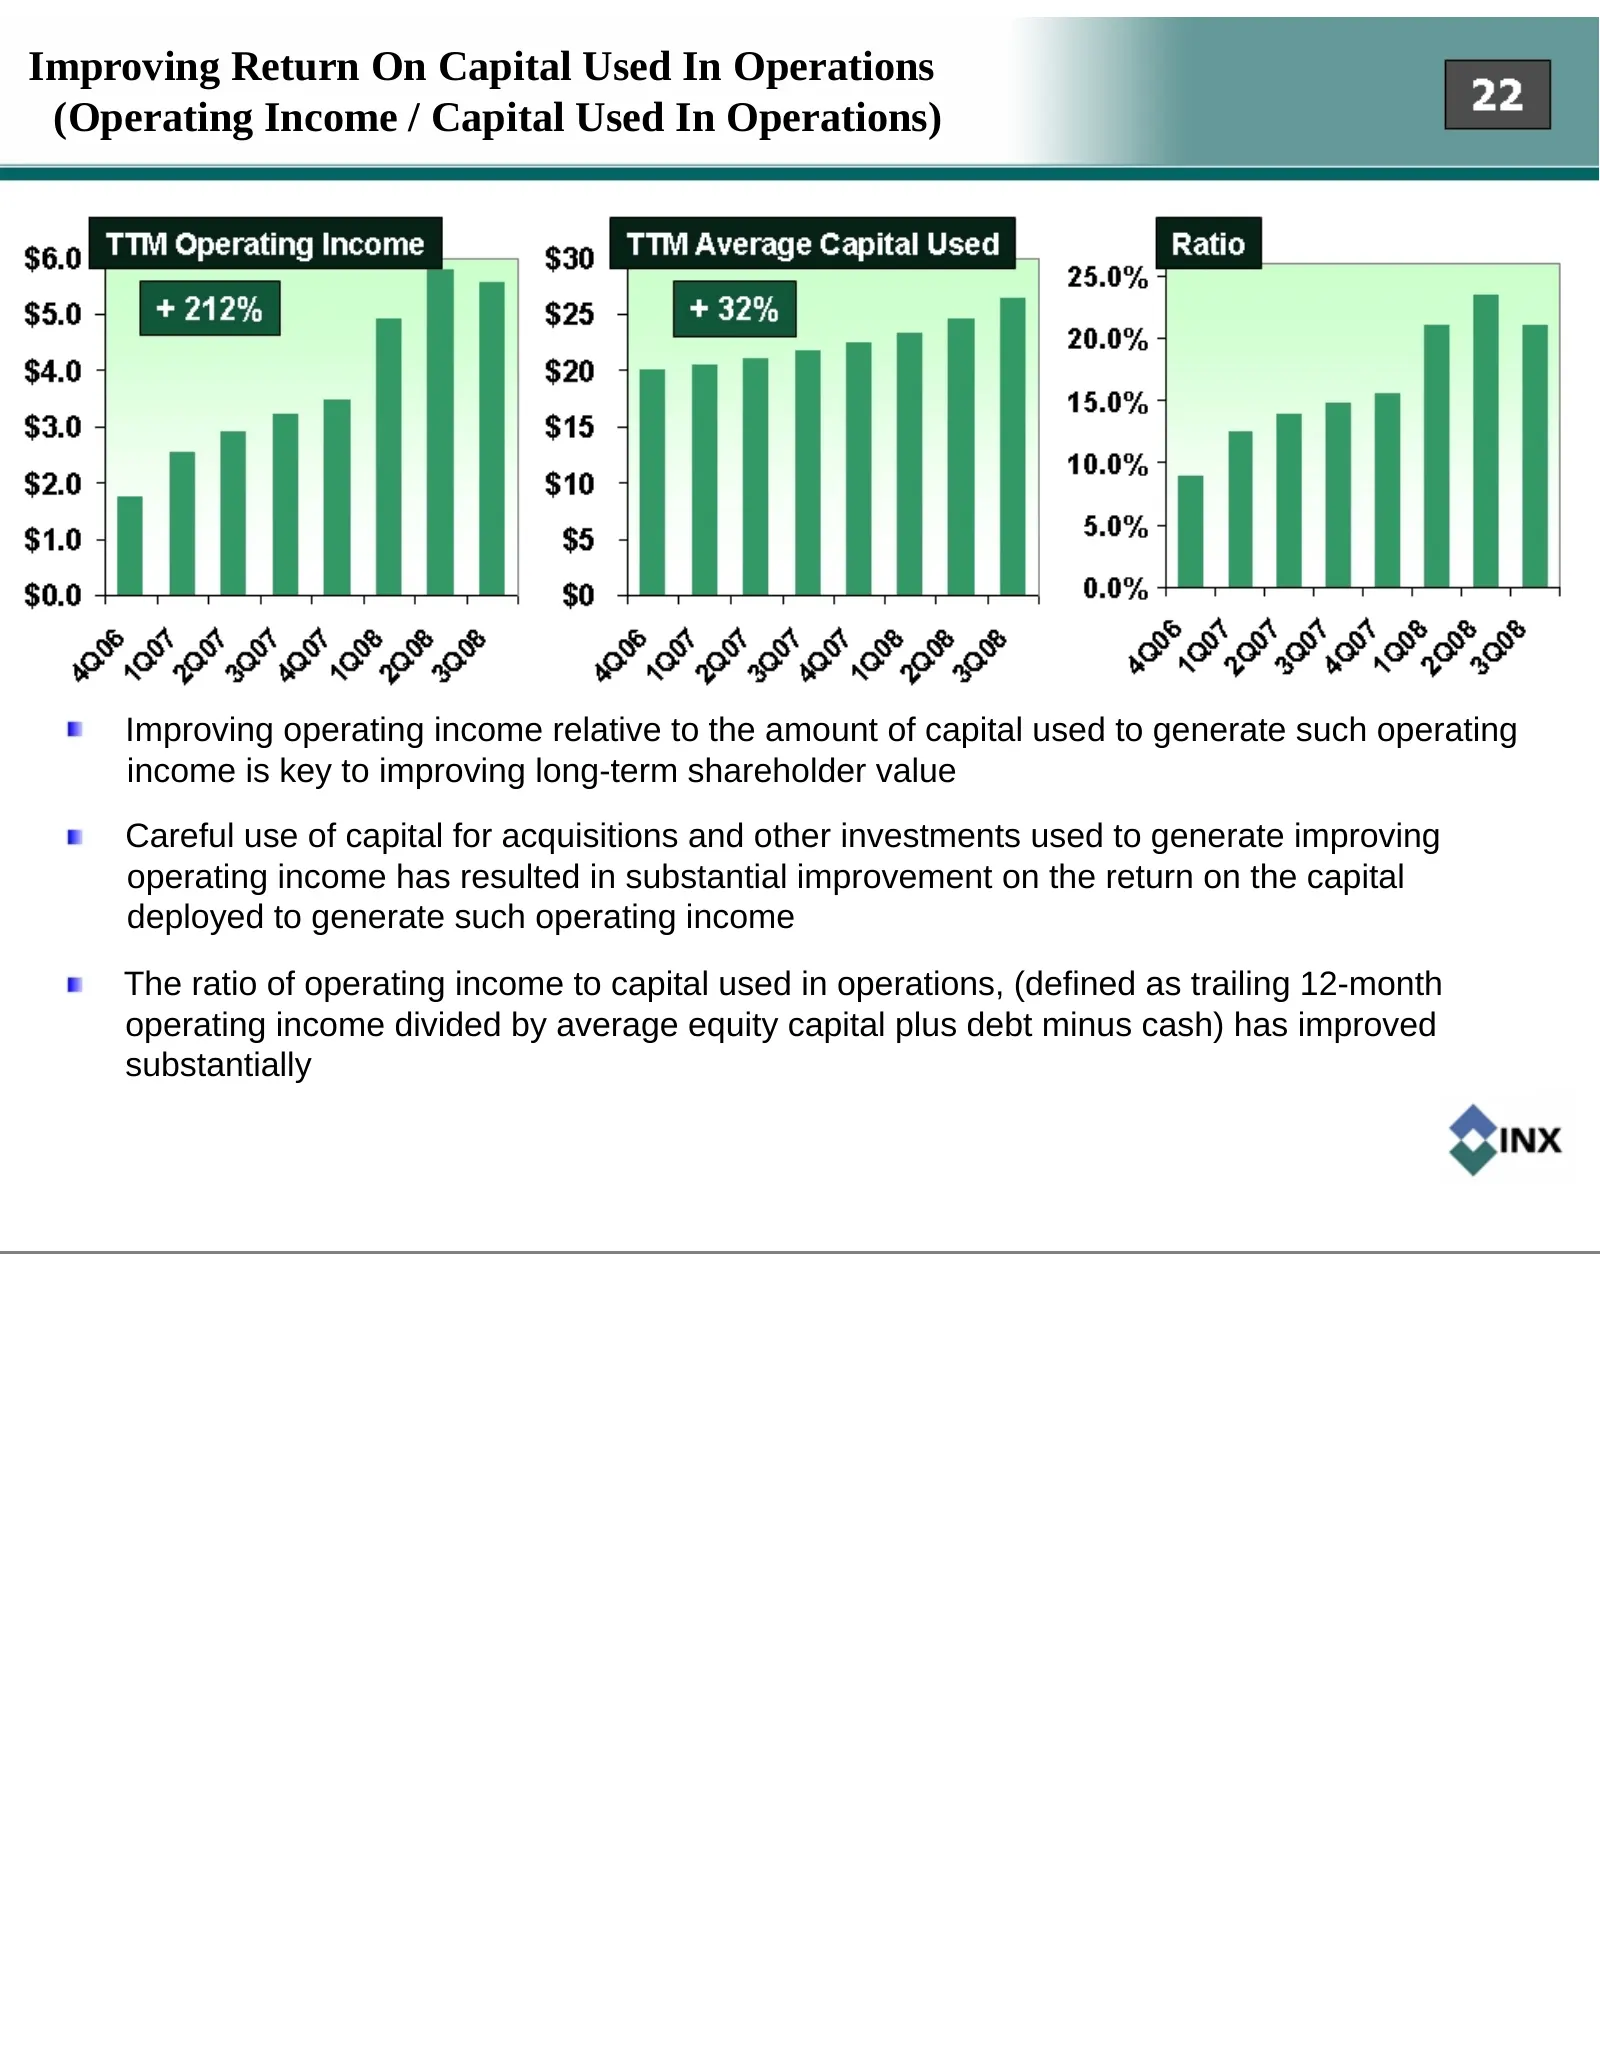
Improving Return On Capital Used In Operations (Operating Income / Capital Used In Operations) Improving operating income relative to the amount of capital used to generate such operating income is key to improving long-term shareholder value Careful use of capital for acquisitions and other investm
Slide 23: Balance Sheet, Liquidity & Credit Availability
Balance Sheet Liquidity & Credit Availability
Slide 24: Improving Balance Sheet
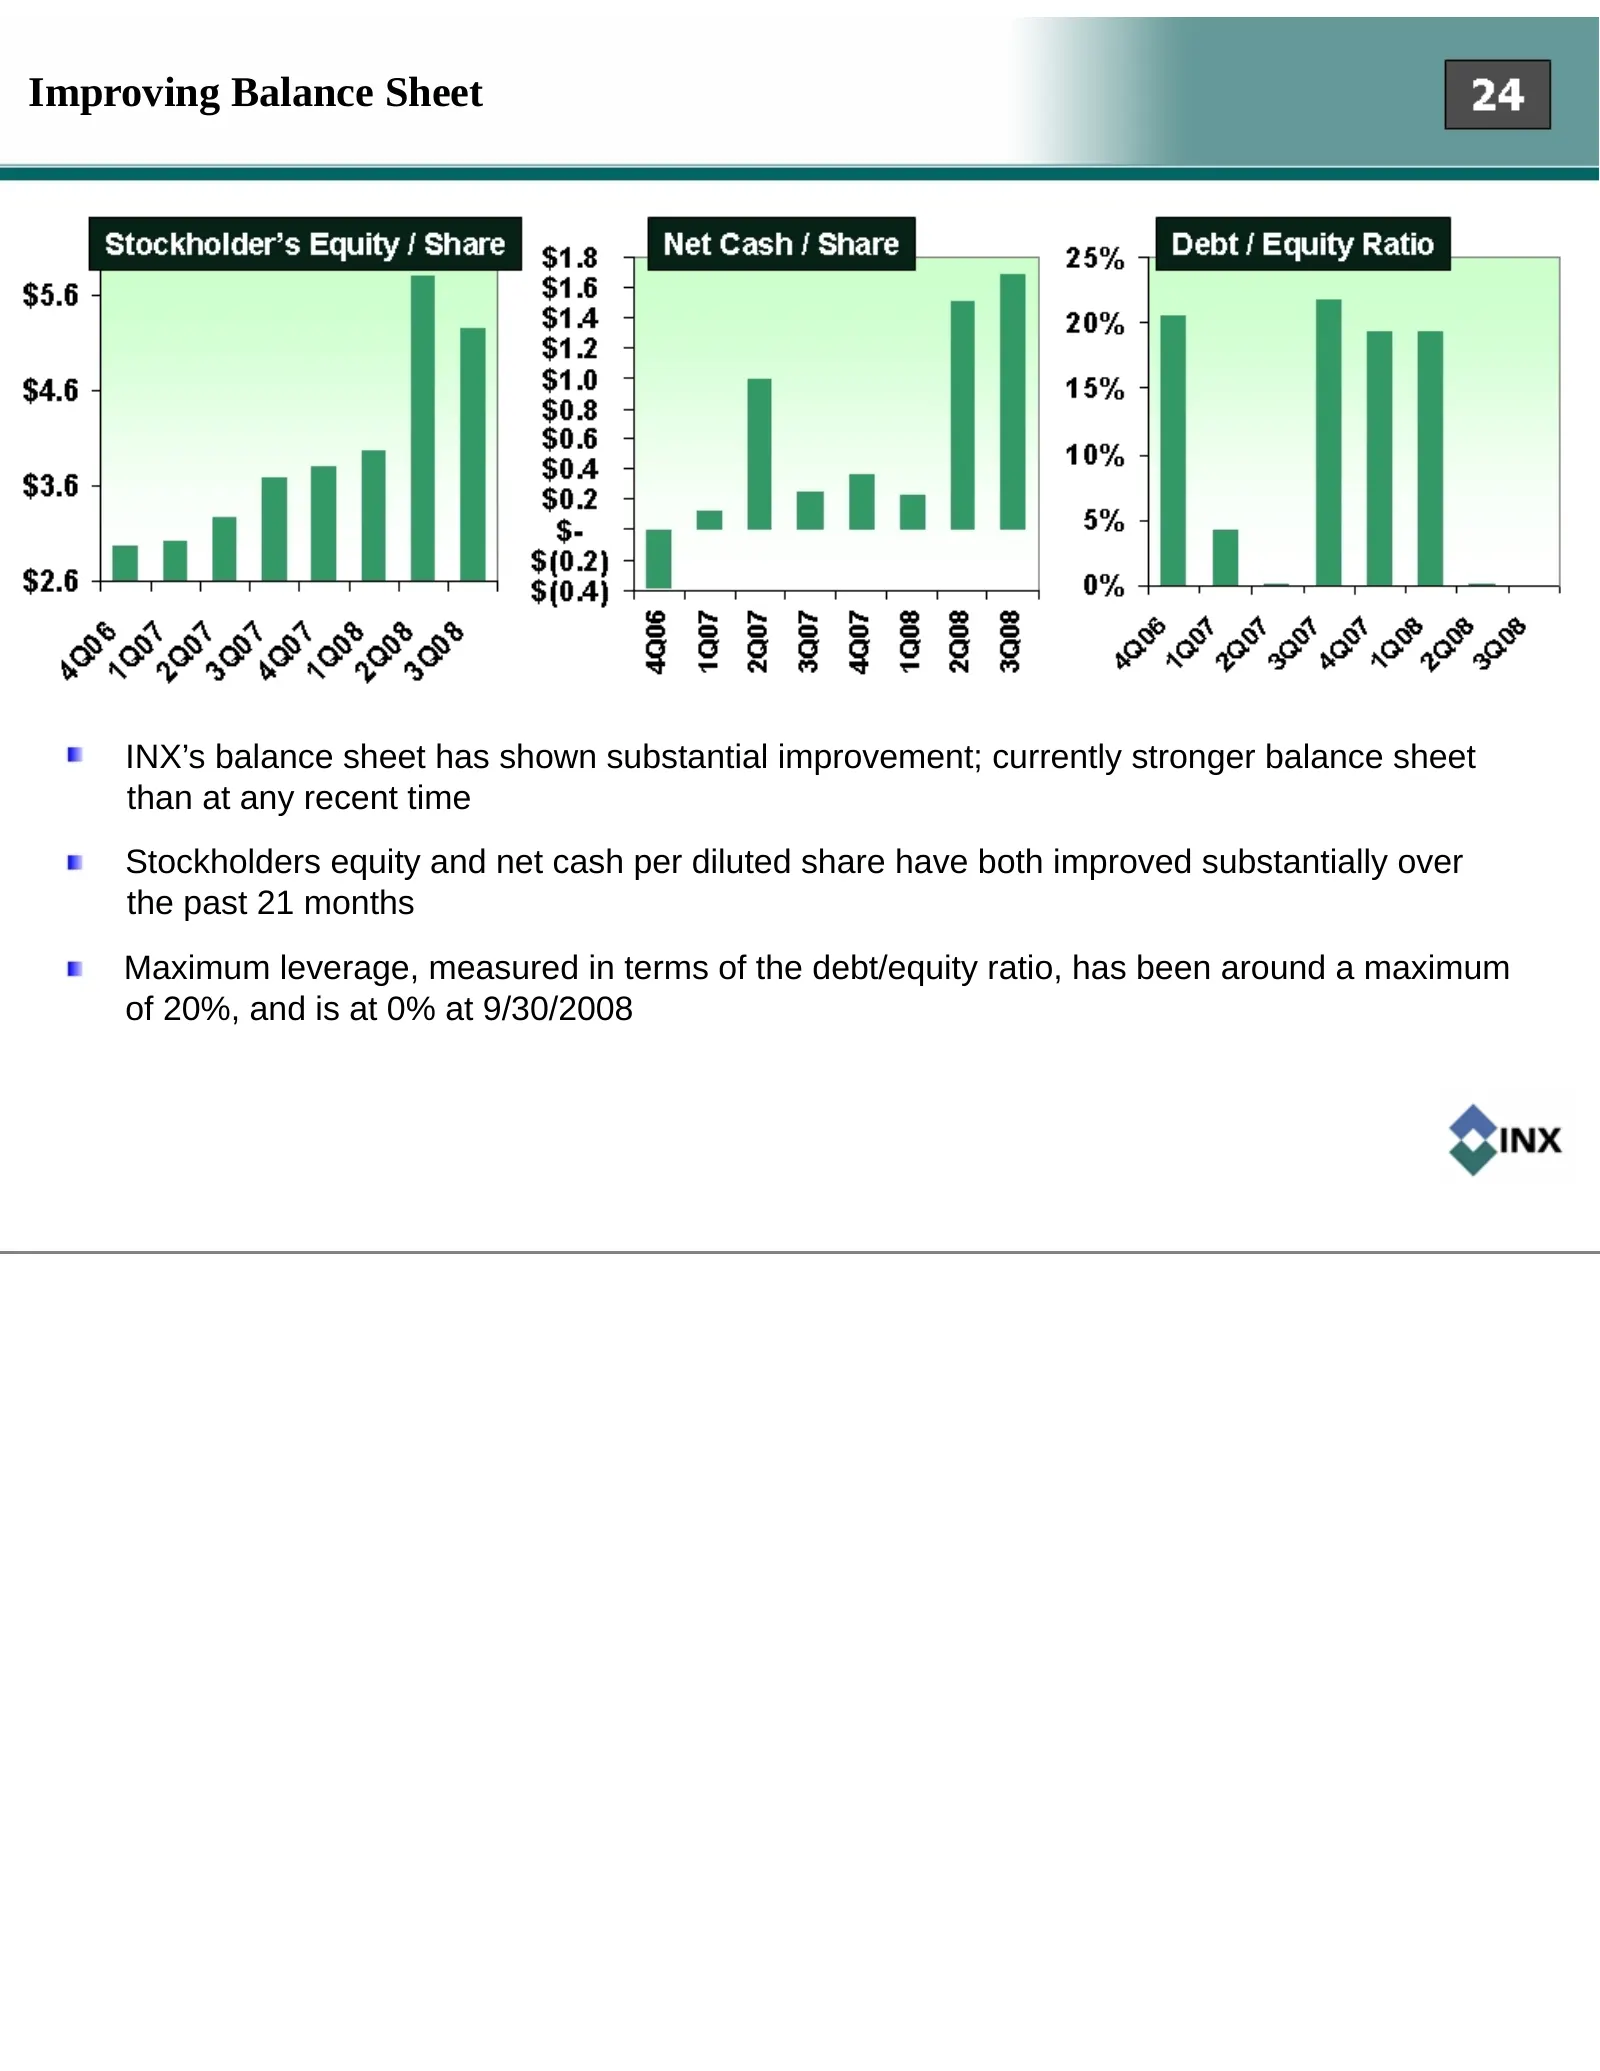
Improving Balance Sheet INX’s balance sheet has shown substantial improvement; currently stronger balance sheet than at any recent time Stockholders equity and net cash per diluted share have both improved substantially over the past 21 months Maximum leverage, measured in terms of the debt/equity r
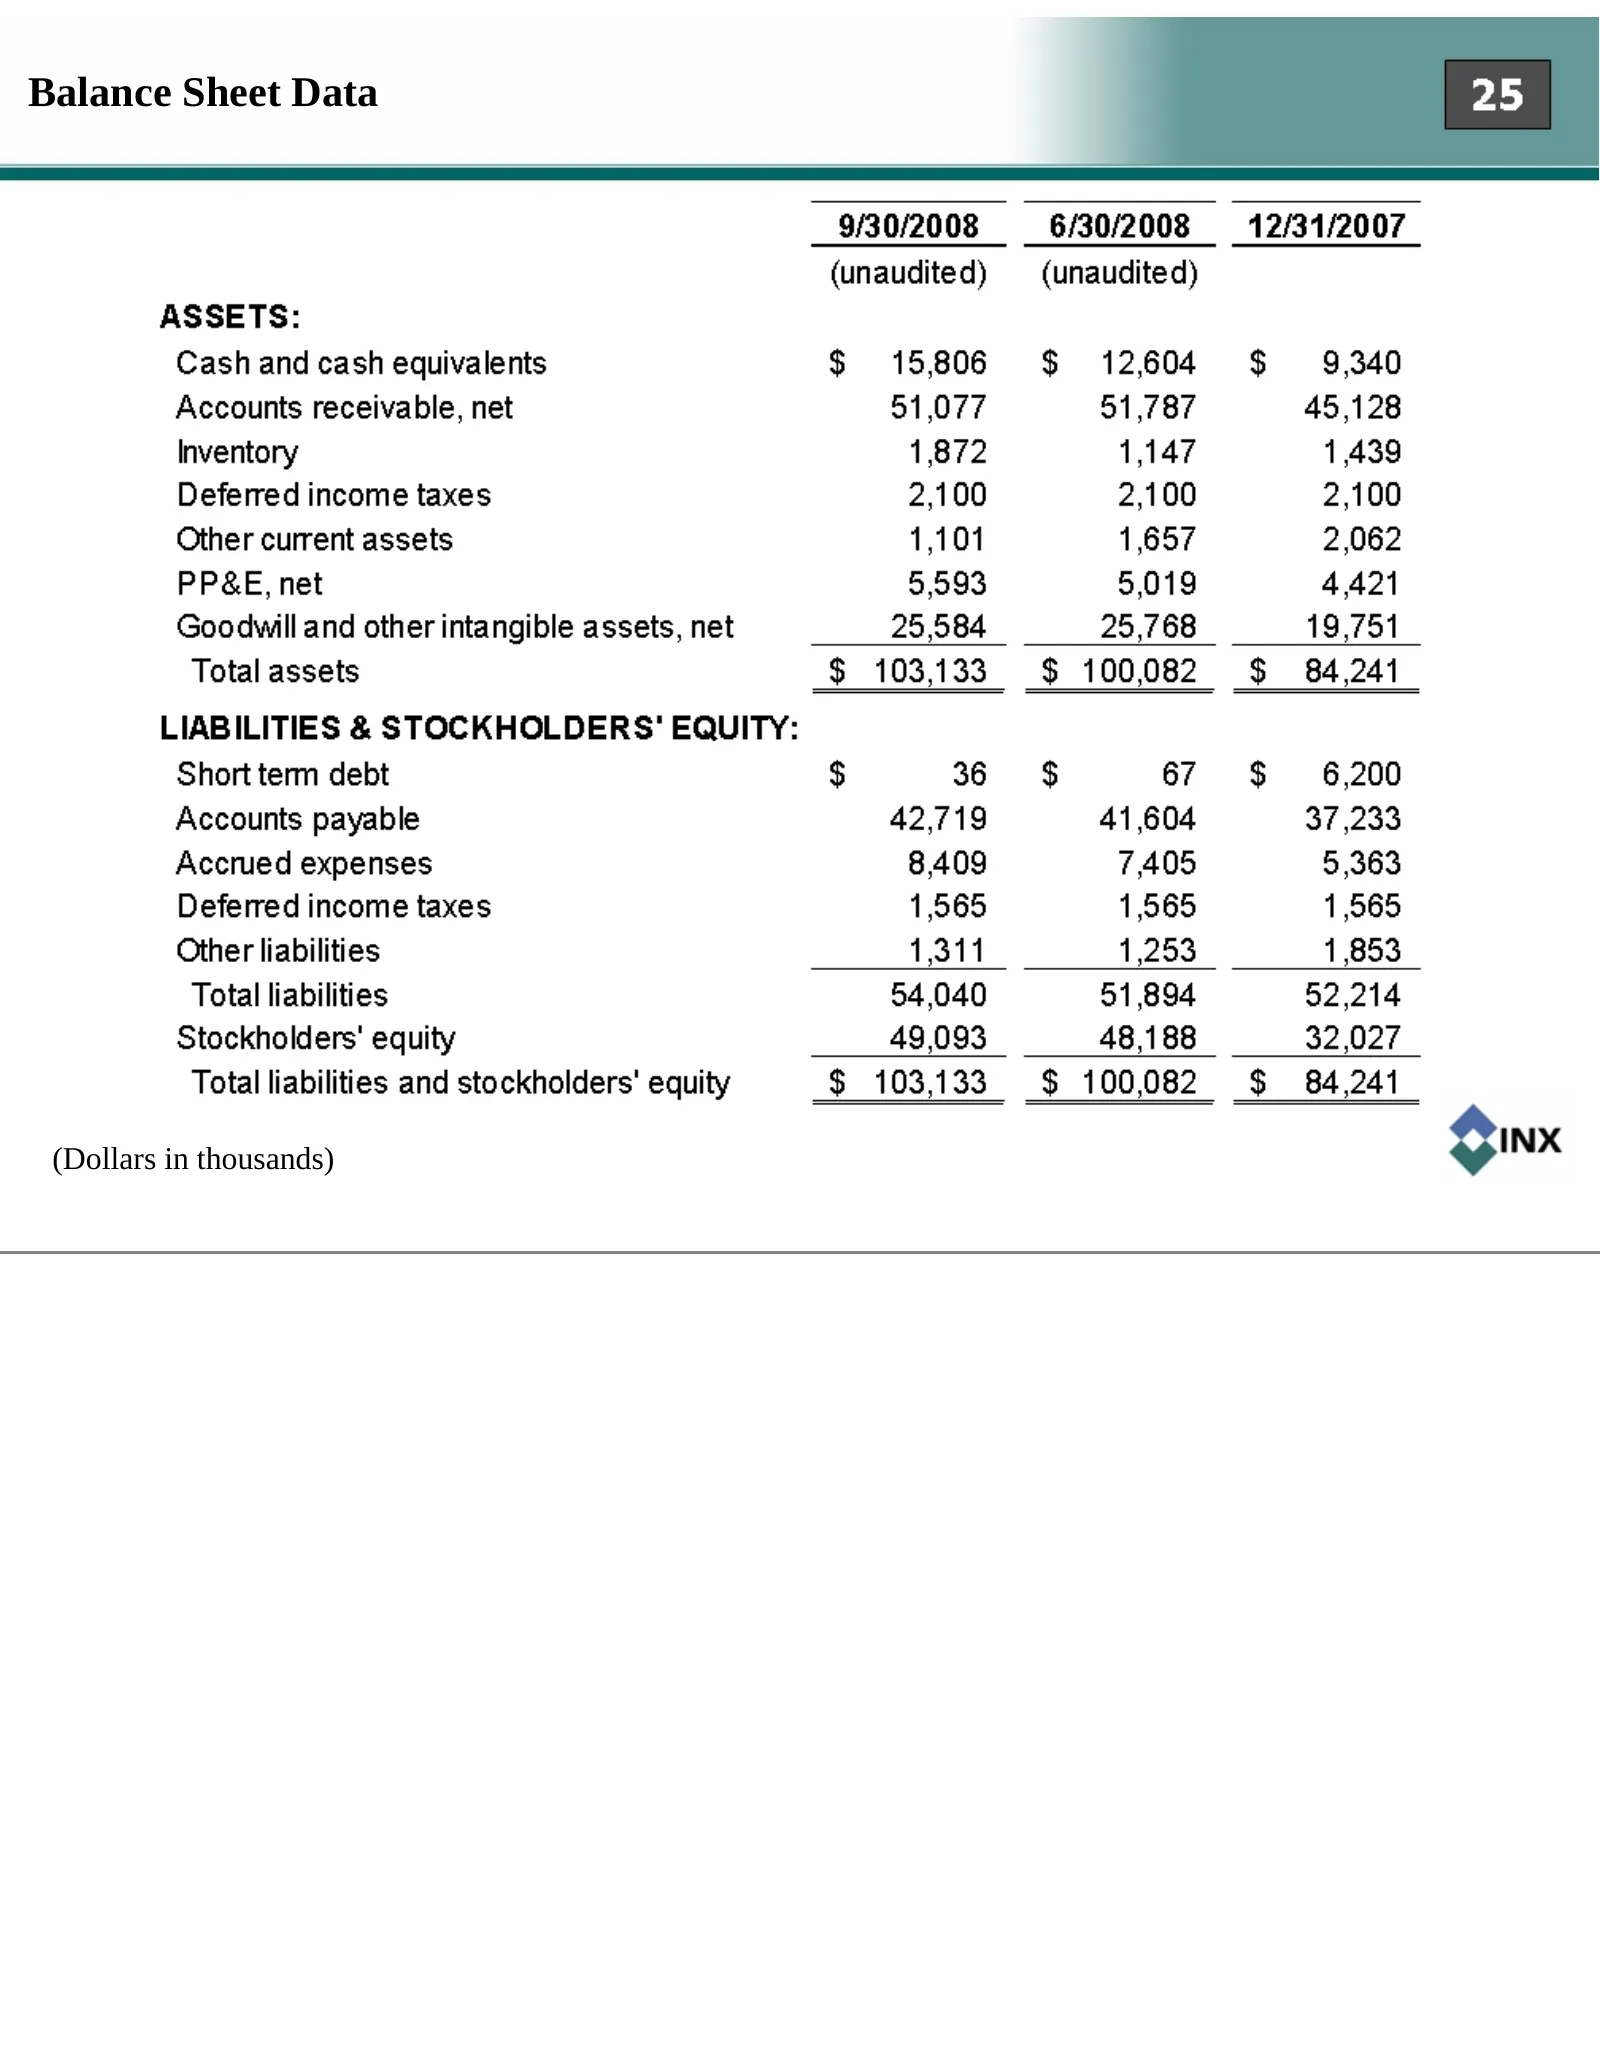
Slide 25: Balance Sheet Data
Balance Sheet Data (Dollars in thousands)
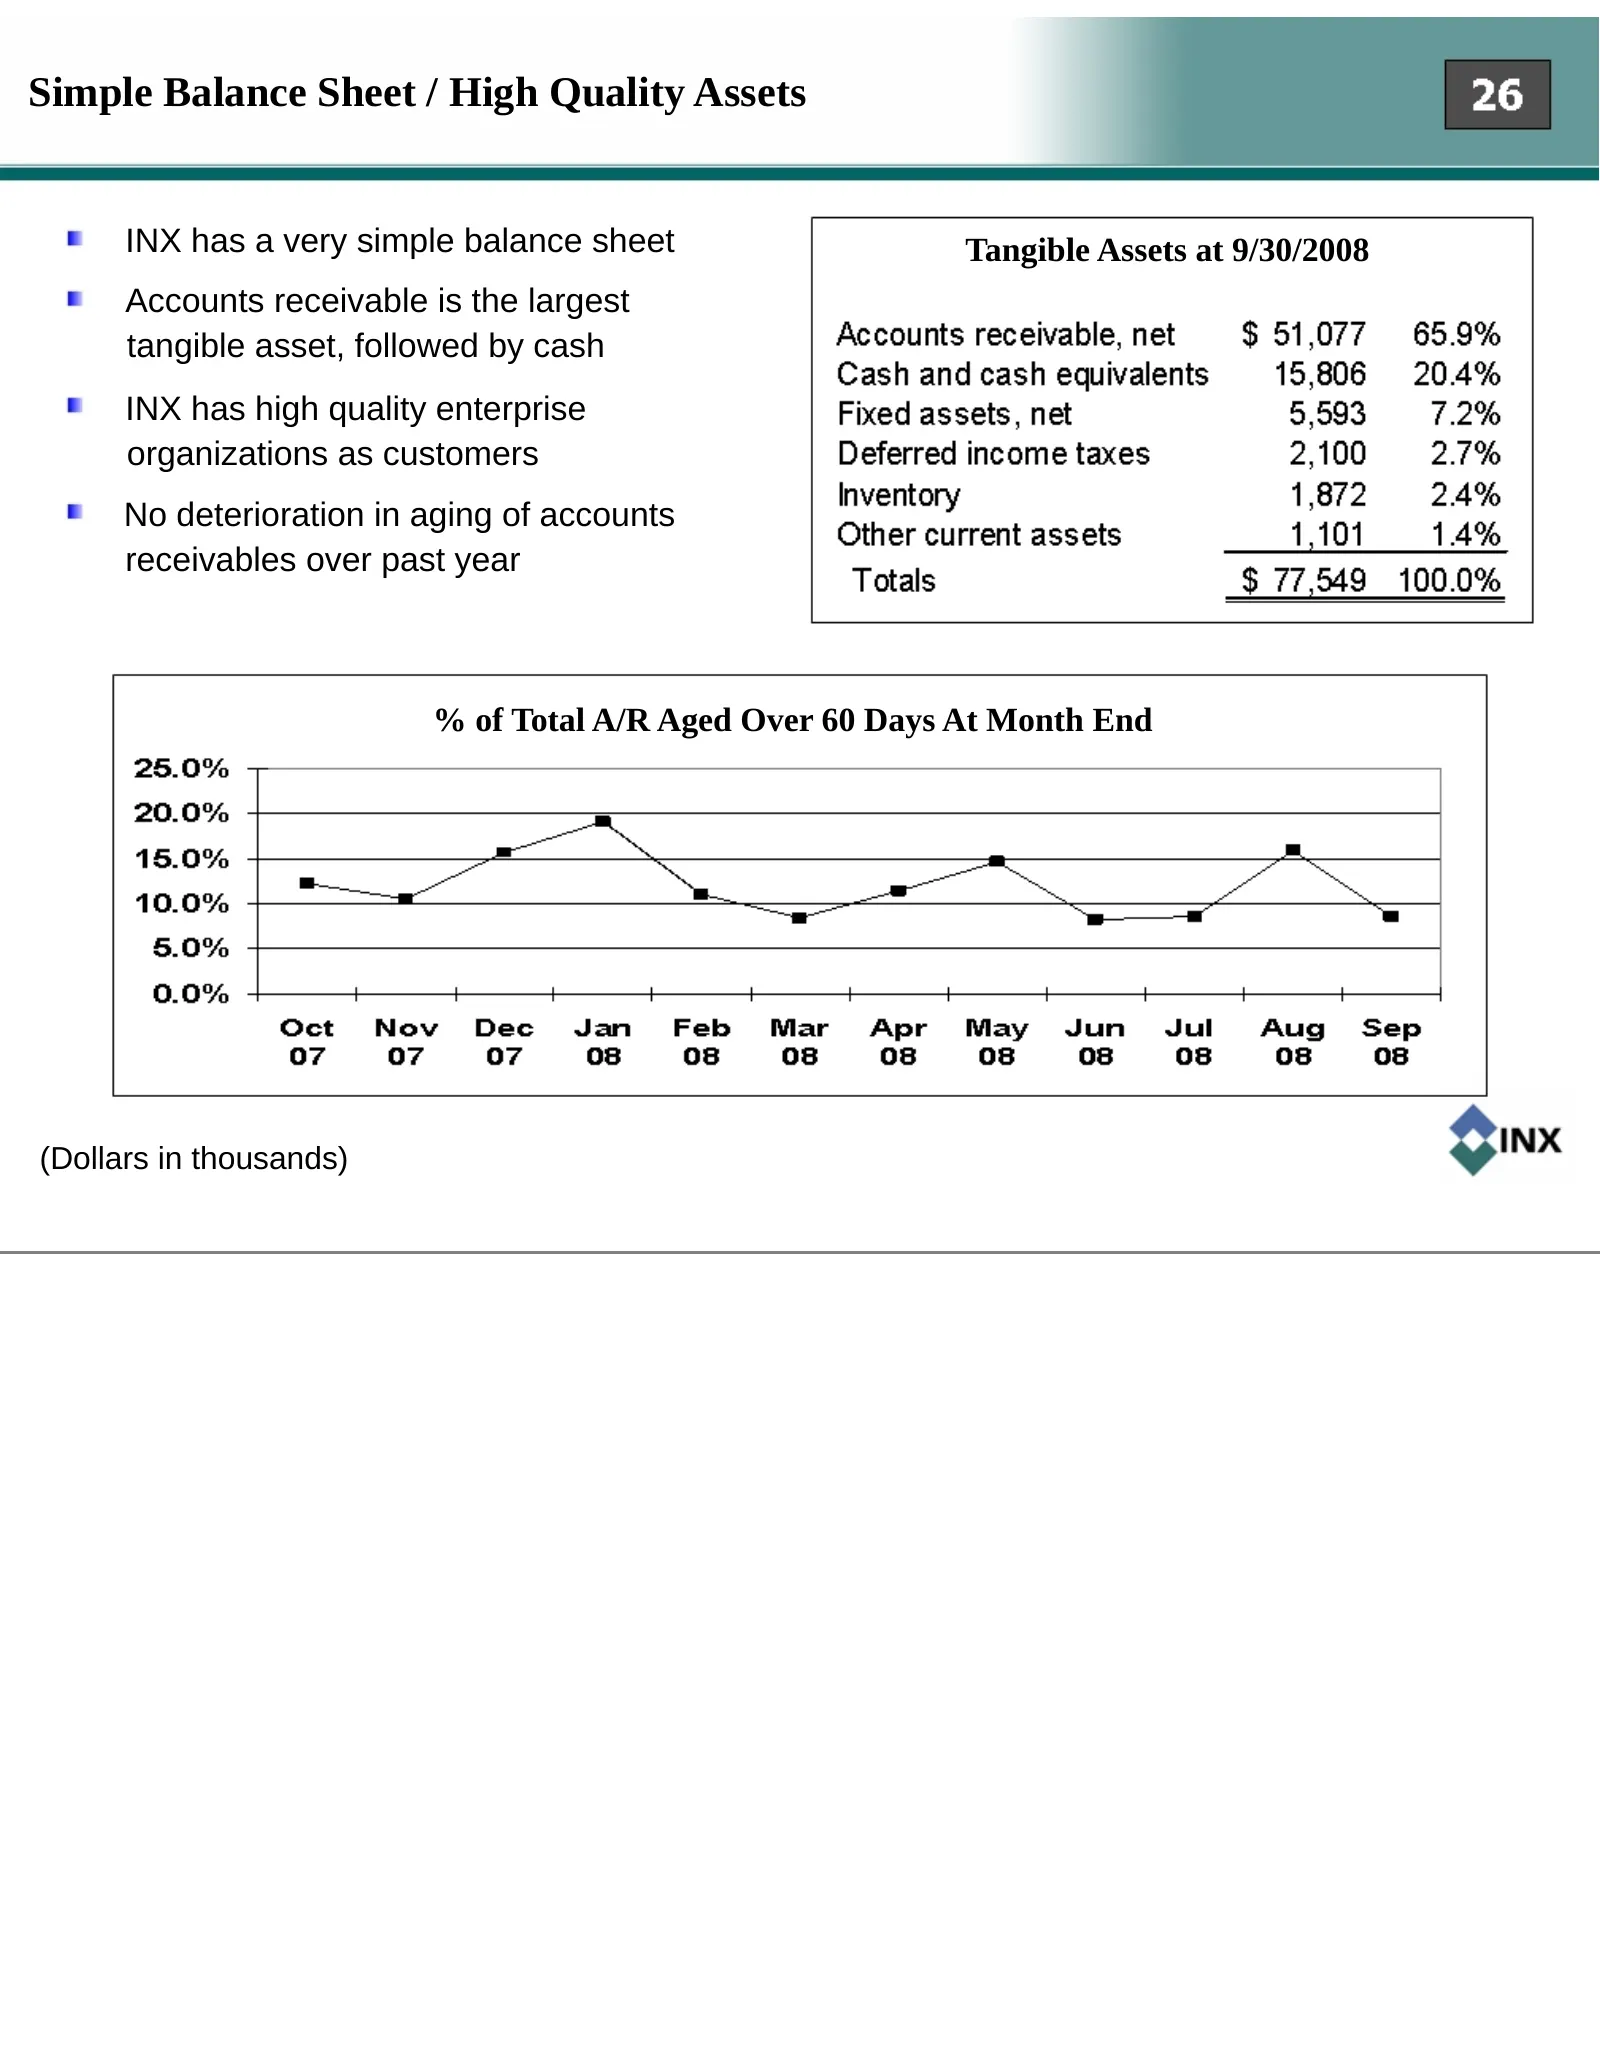
Slide 26: Simple Balance Sheet / High Quality Assets
Simple Balance Sheet / High Quality Assets INX has a very simple balance sheet Tangible Assets at 9/30/2008 Accounts receivable is the largest tangible asset, followed by cash INX has high quality enterprise organizations as customers No deterioration in aging of accounts receivables over past year
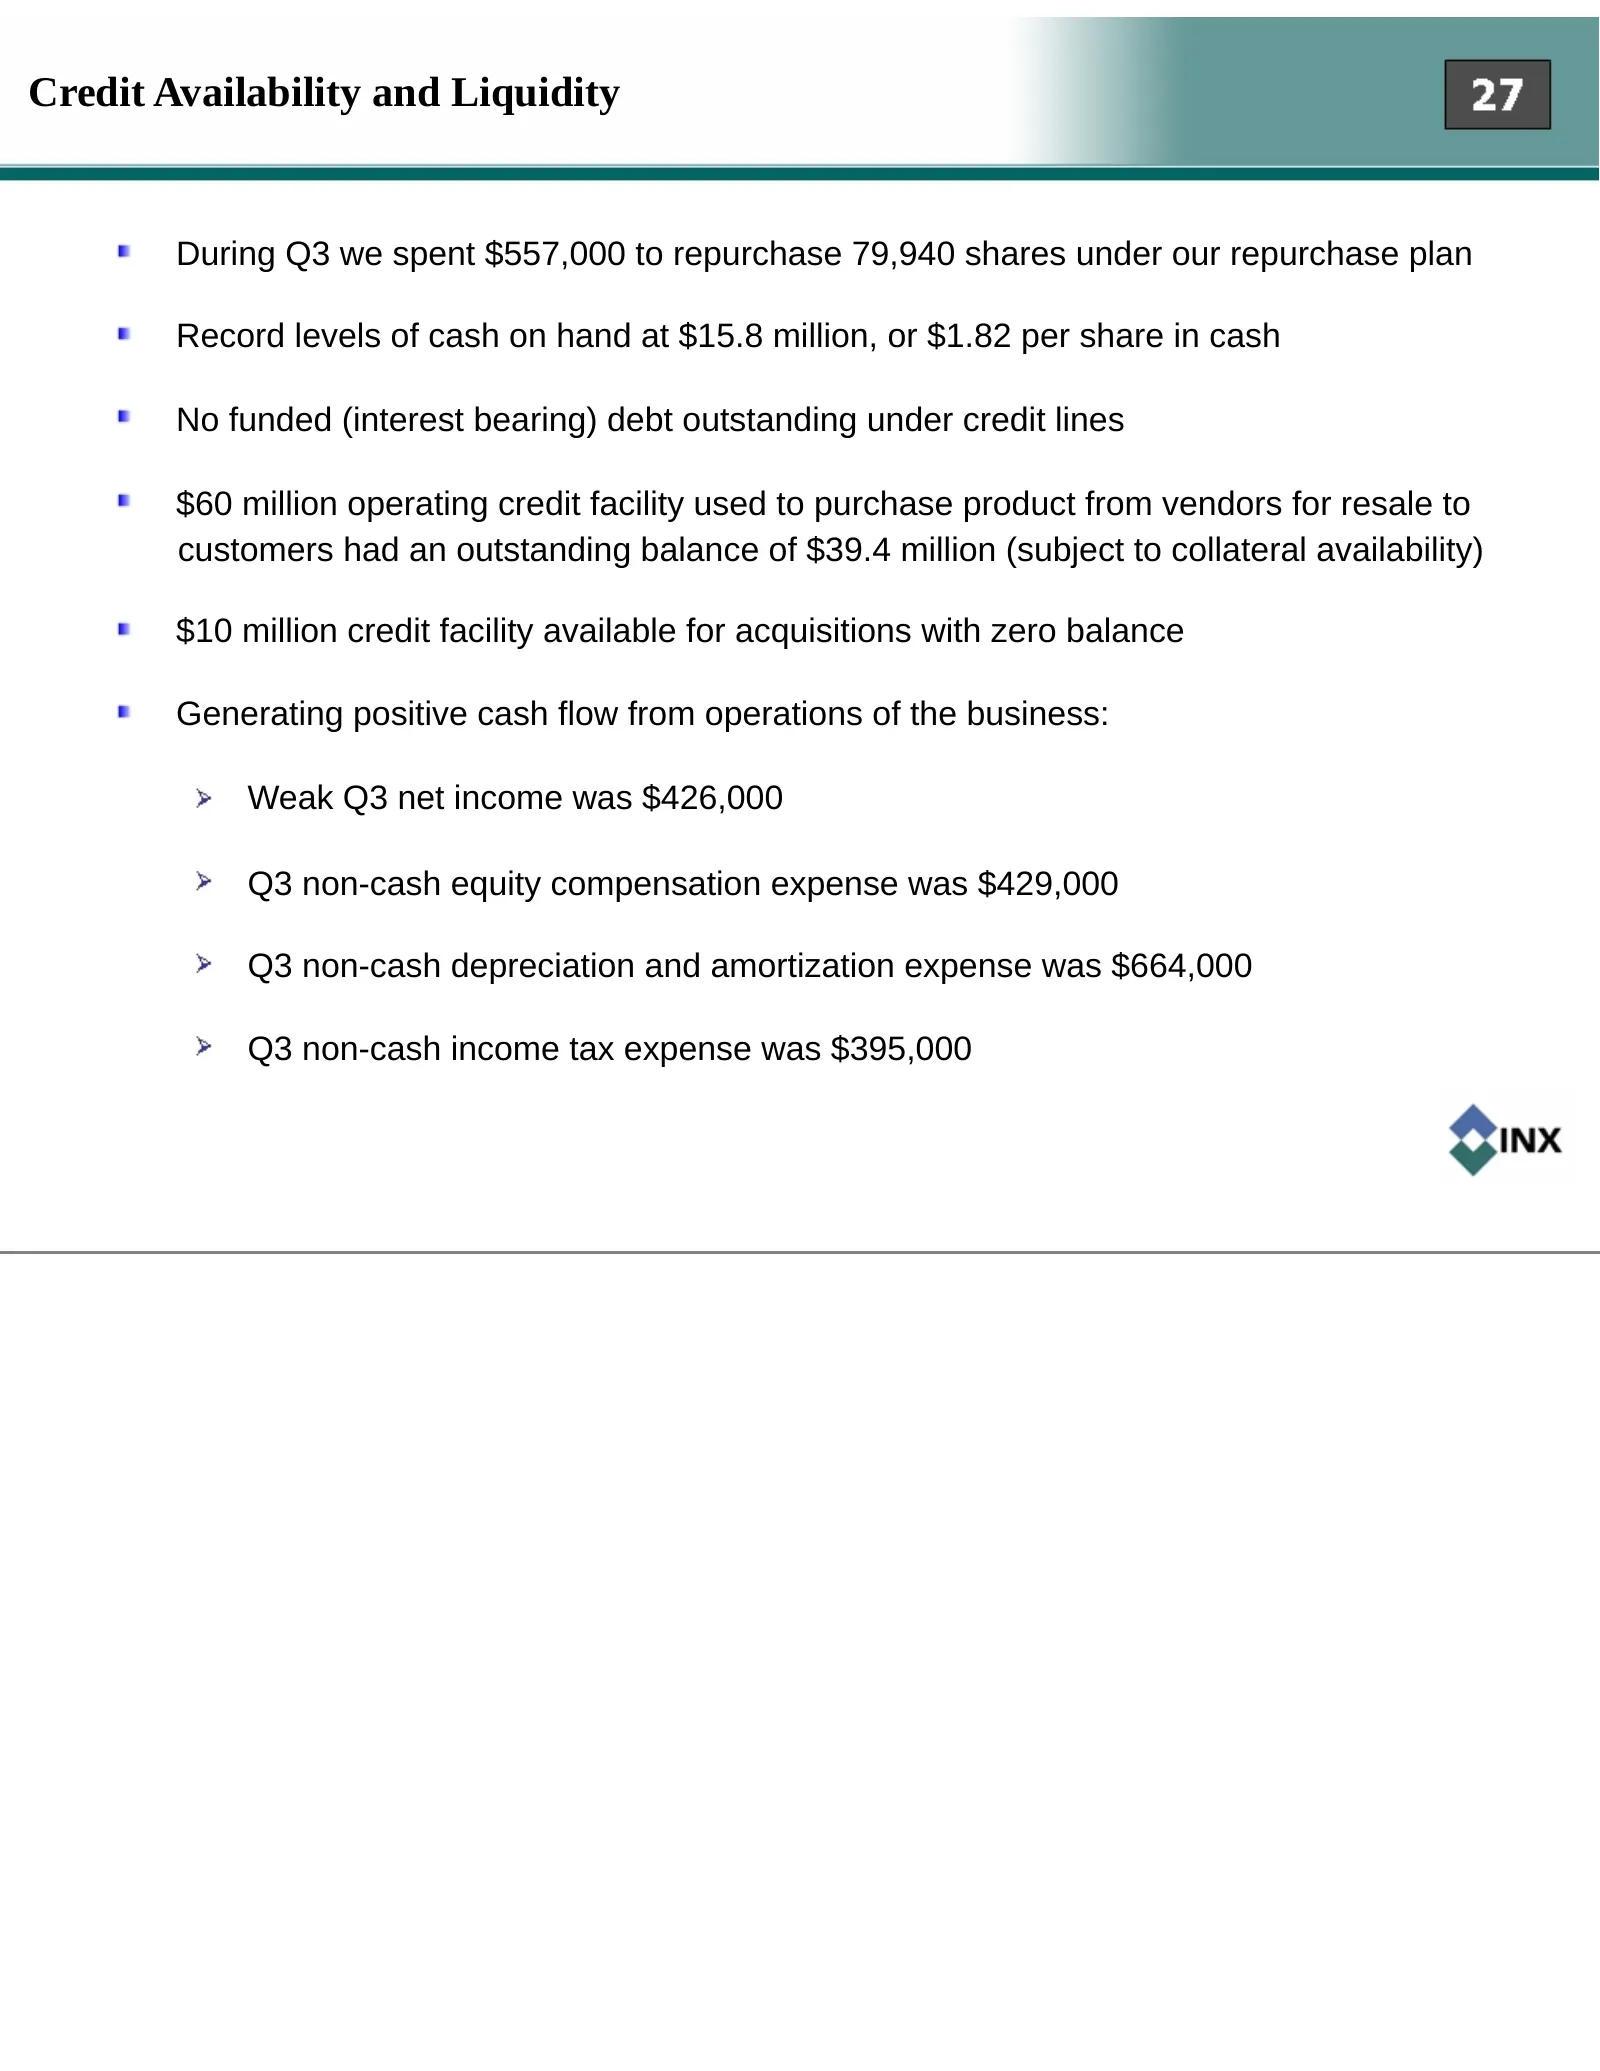
Slide 27: Credit Availability and Liquidity
Credit Availability and Liquidity During Q3 we spent $557,000 to repurchase 79,940 shares under our repurchase plan Record levels of cash on hand at $15.8 million, or $1.82 per share in cash No funded (interest bearing) debt outstanding under credit lines $60 million operating credit facility used t
Slide 28: Update On Recent Trends In Business & Outlook
Update On Recent Trends In Business & Outlook
Slide 29: Market Developments
Market Developments One year ago, on November 5, 2007, we reported that tight credit markets and worries over a possible recession were causing slowing customer demand On August 12th, 2008 we stated that we had seen sequentially improving bookings between March and July, and that we believed custome
Slide 30: Impact Of Recent Market Developments
Impact Of Recent Market Developments The recessionary economic environment, combined with tight credit availability, will negatively impact industry-wide customer demand near-term, and possibly for several quarters, or even longer INX’s industry is well positioned on a relative basis because unified
Slide 31: Why We Are Optimistic About INX's Prospects
Why We Are Optimistic About INX’s Prospects INX currently has a small share of its target market, which target markets include some of the best areas of technology, from a growth perspective Unified communications is still in a state of relative infancy; the majority of enterprise phone systems are
Slide 32: Outlook (Issued 11/6/2008)
Outlook (Issued 11/6/2008) We are expanding our range of expectations somewhat due to lower visibility as compared to recent quarters, which reduced visibility is related to macro-economic uncertainty For Q4-08 we expect: Total revenue in the range of $61-$68 million, an increase of 8% to 20% compar
Slide 33: Acquisition of Boston-Based NetTeks
11/14/2008 Acquisition of Boston-Based NetTeks
Slide 34: 11/14/2008 Acquisition of NetTeks
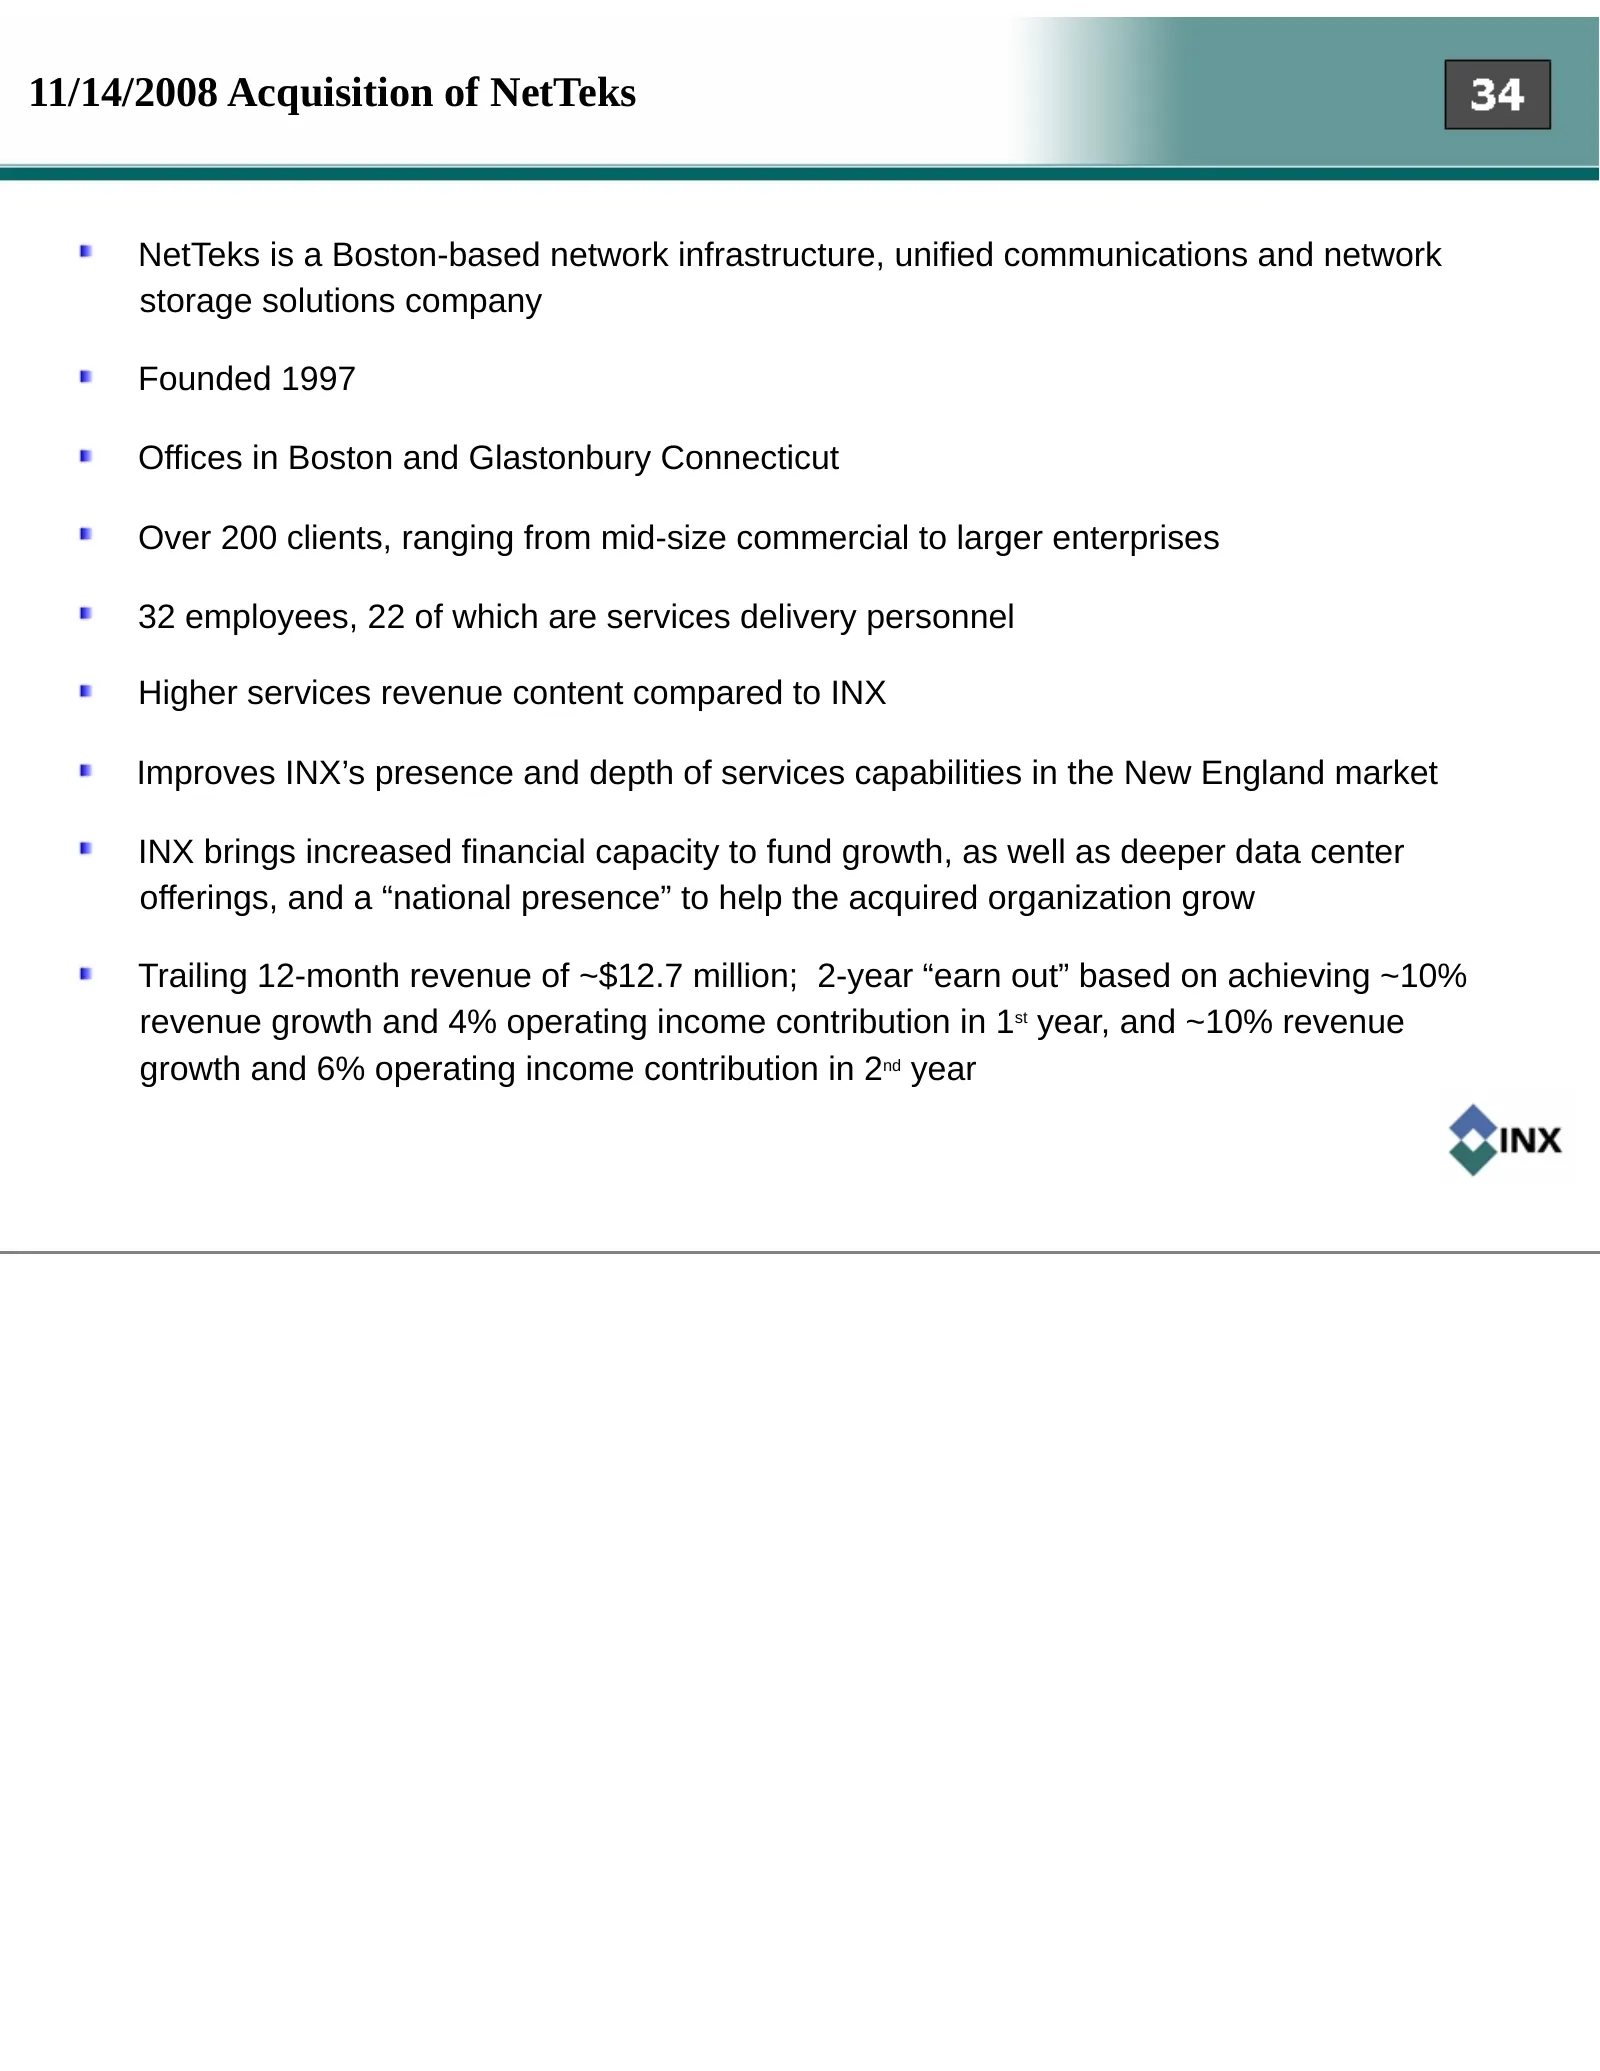
11/14/2008 Acquisition of NetTeks NetTeks is a Boston-based network infrastructure, unified communications and network storage solutions company Founded 1997 Offices in Boston and Glastonbury Connecticut Over 200 clients, ranging from mid-size commercial to larger enterprises 32 employees, 22 of whi
Slide 35: Acquisition of NetTeks: Analysis of 1st Year Range Of Expectations
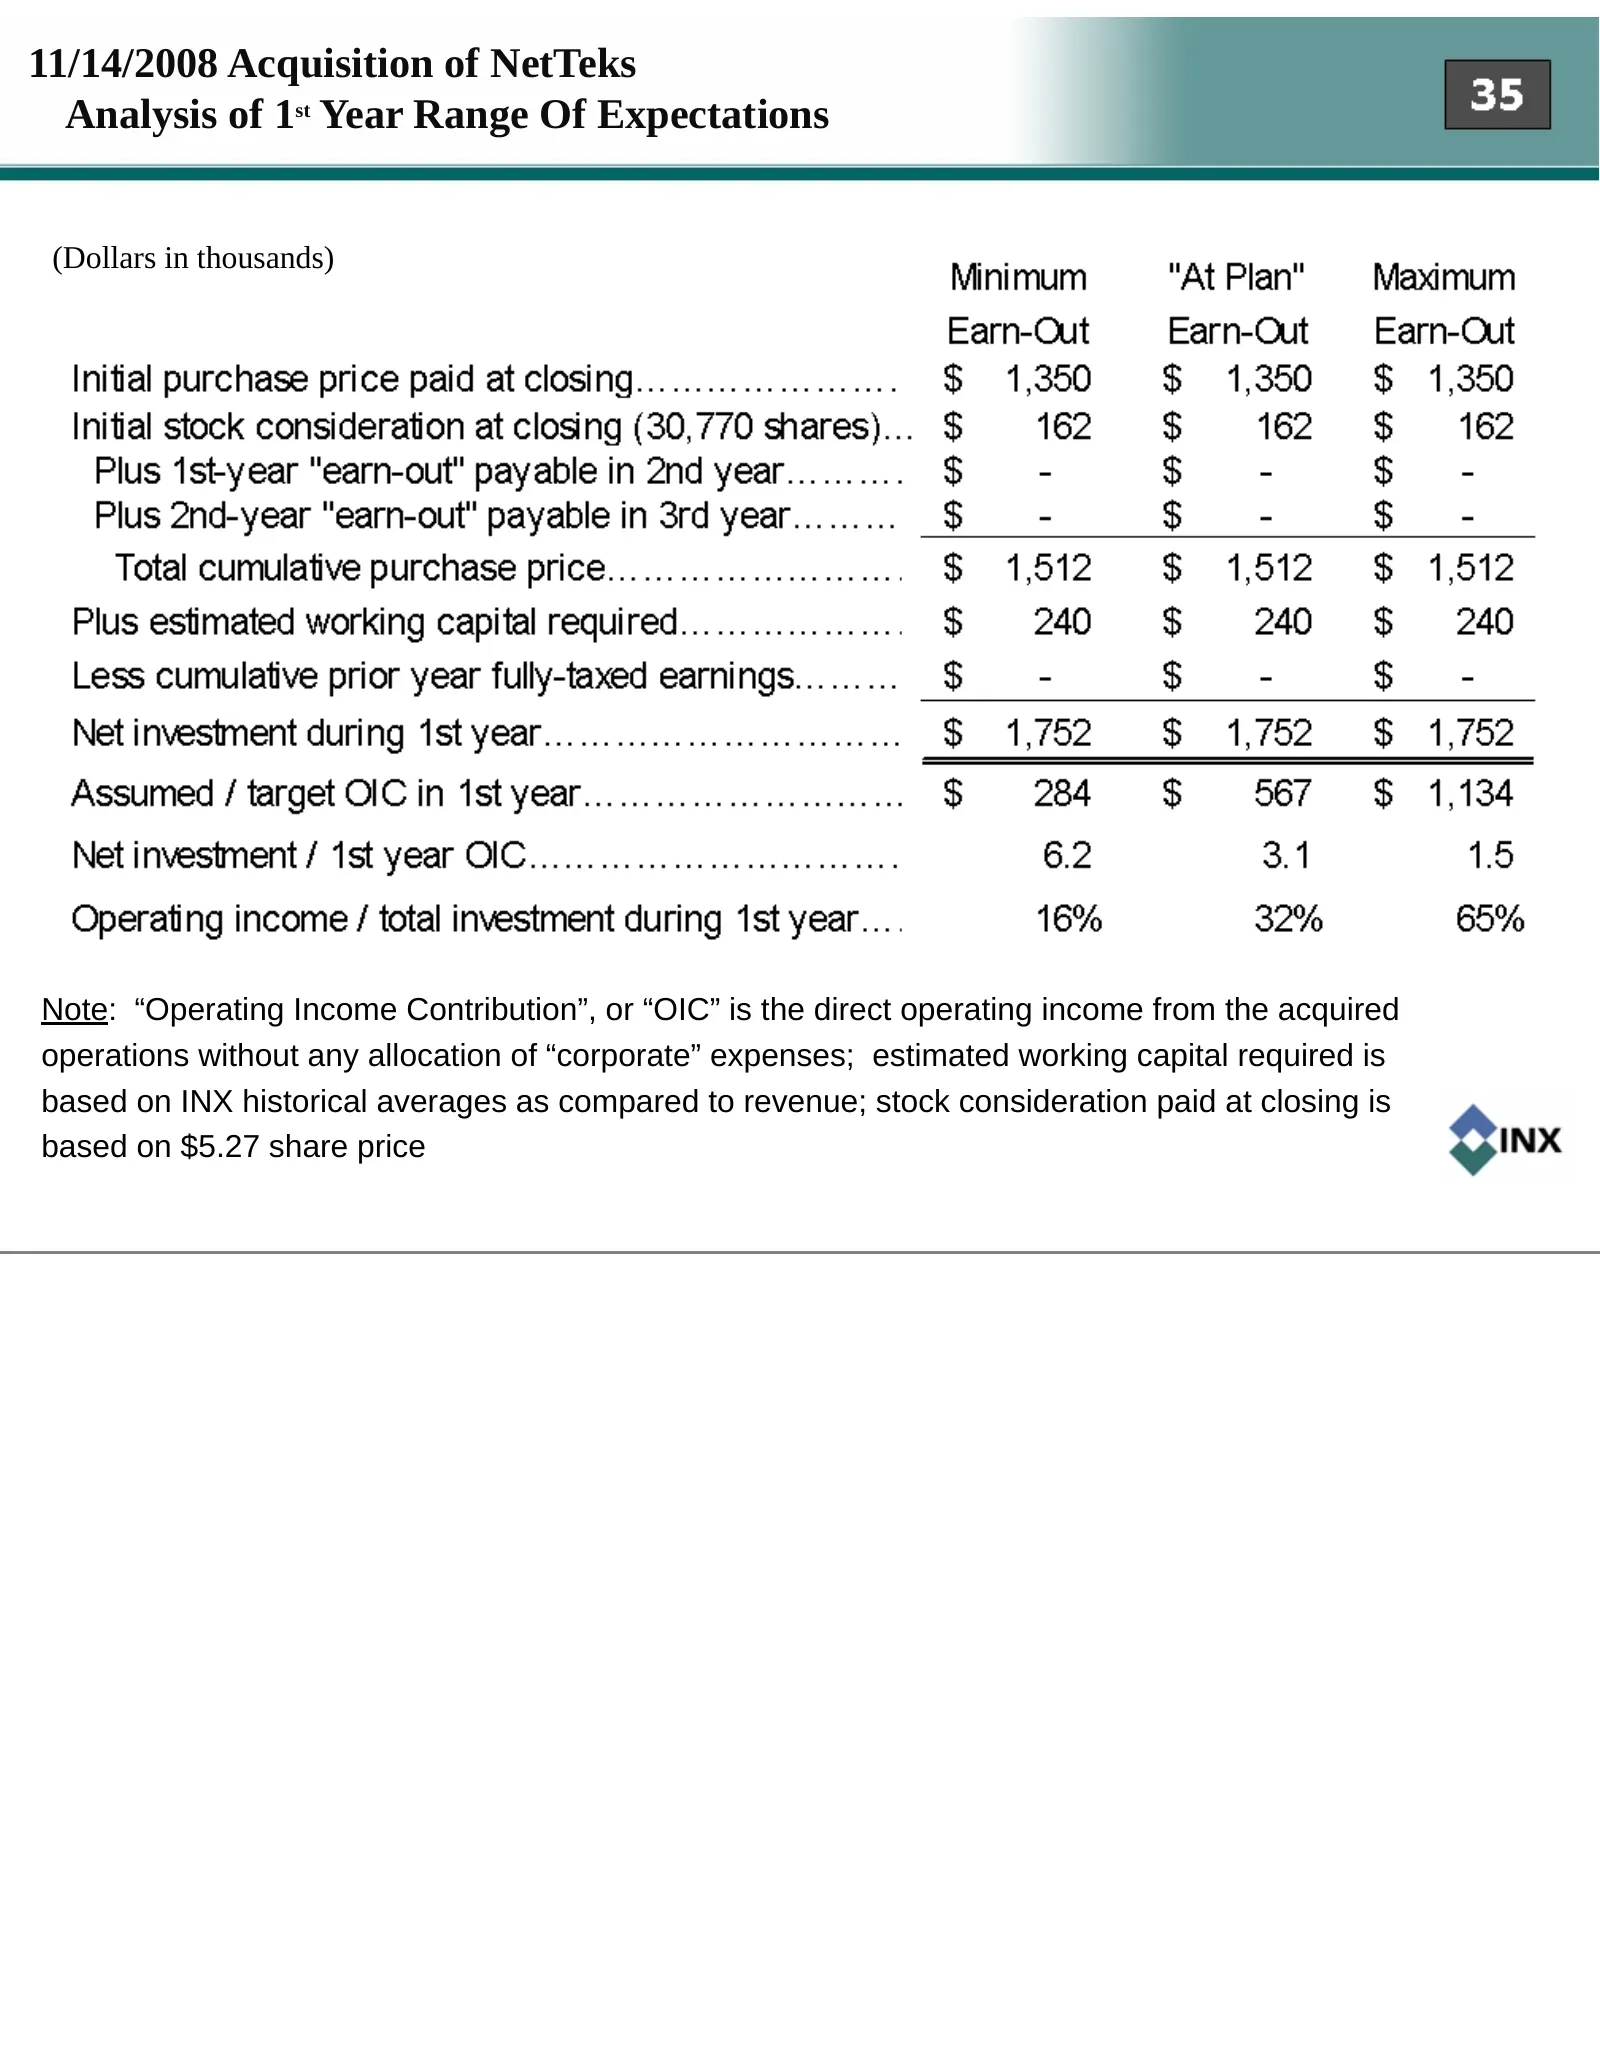
11/14/2008 Acquisition of NetTeks Analysis of 1st Year Range Of Expectations (Dollars in thousands) Note: “Operating Income Contribution”, or “OIC” is the direct operating income from the acquired operations without any allocation of “corporate” expenses; estimated working capital required is based
Slide 36: Acquisition of NetTeks: Analysis of 2nd Year Range Of Expectations
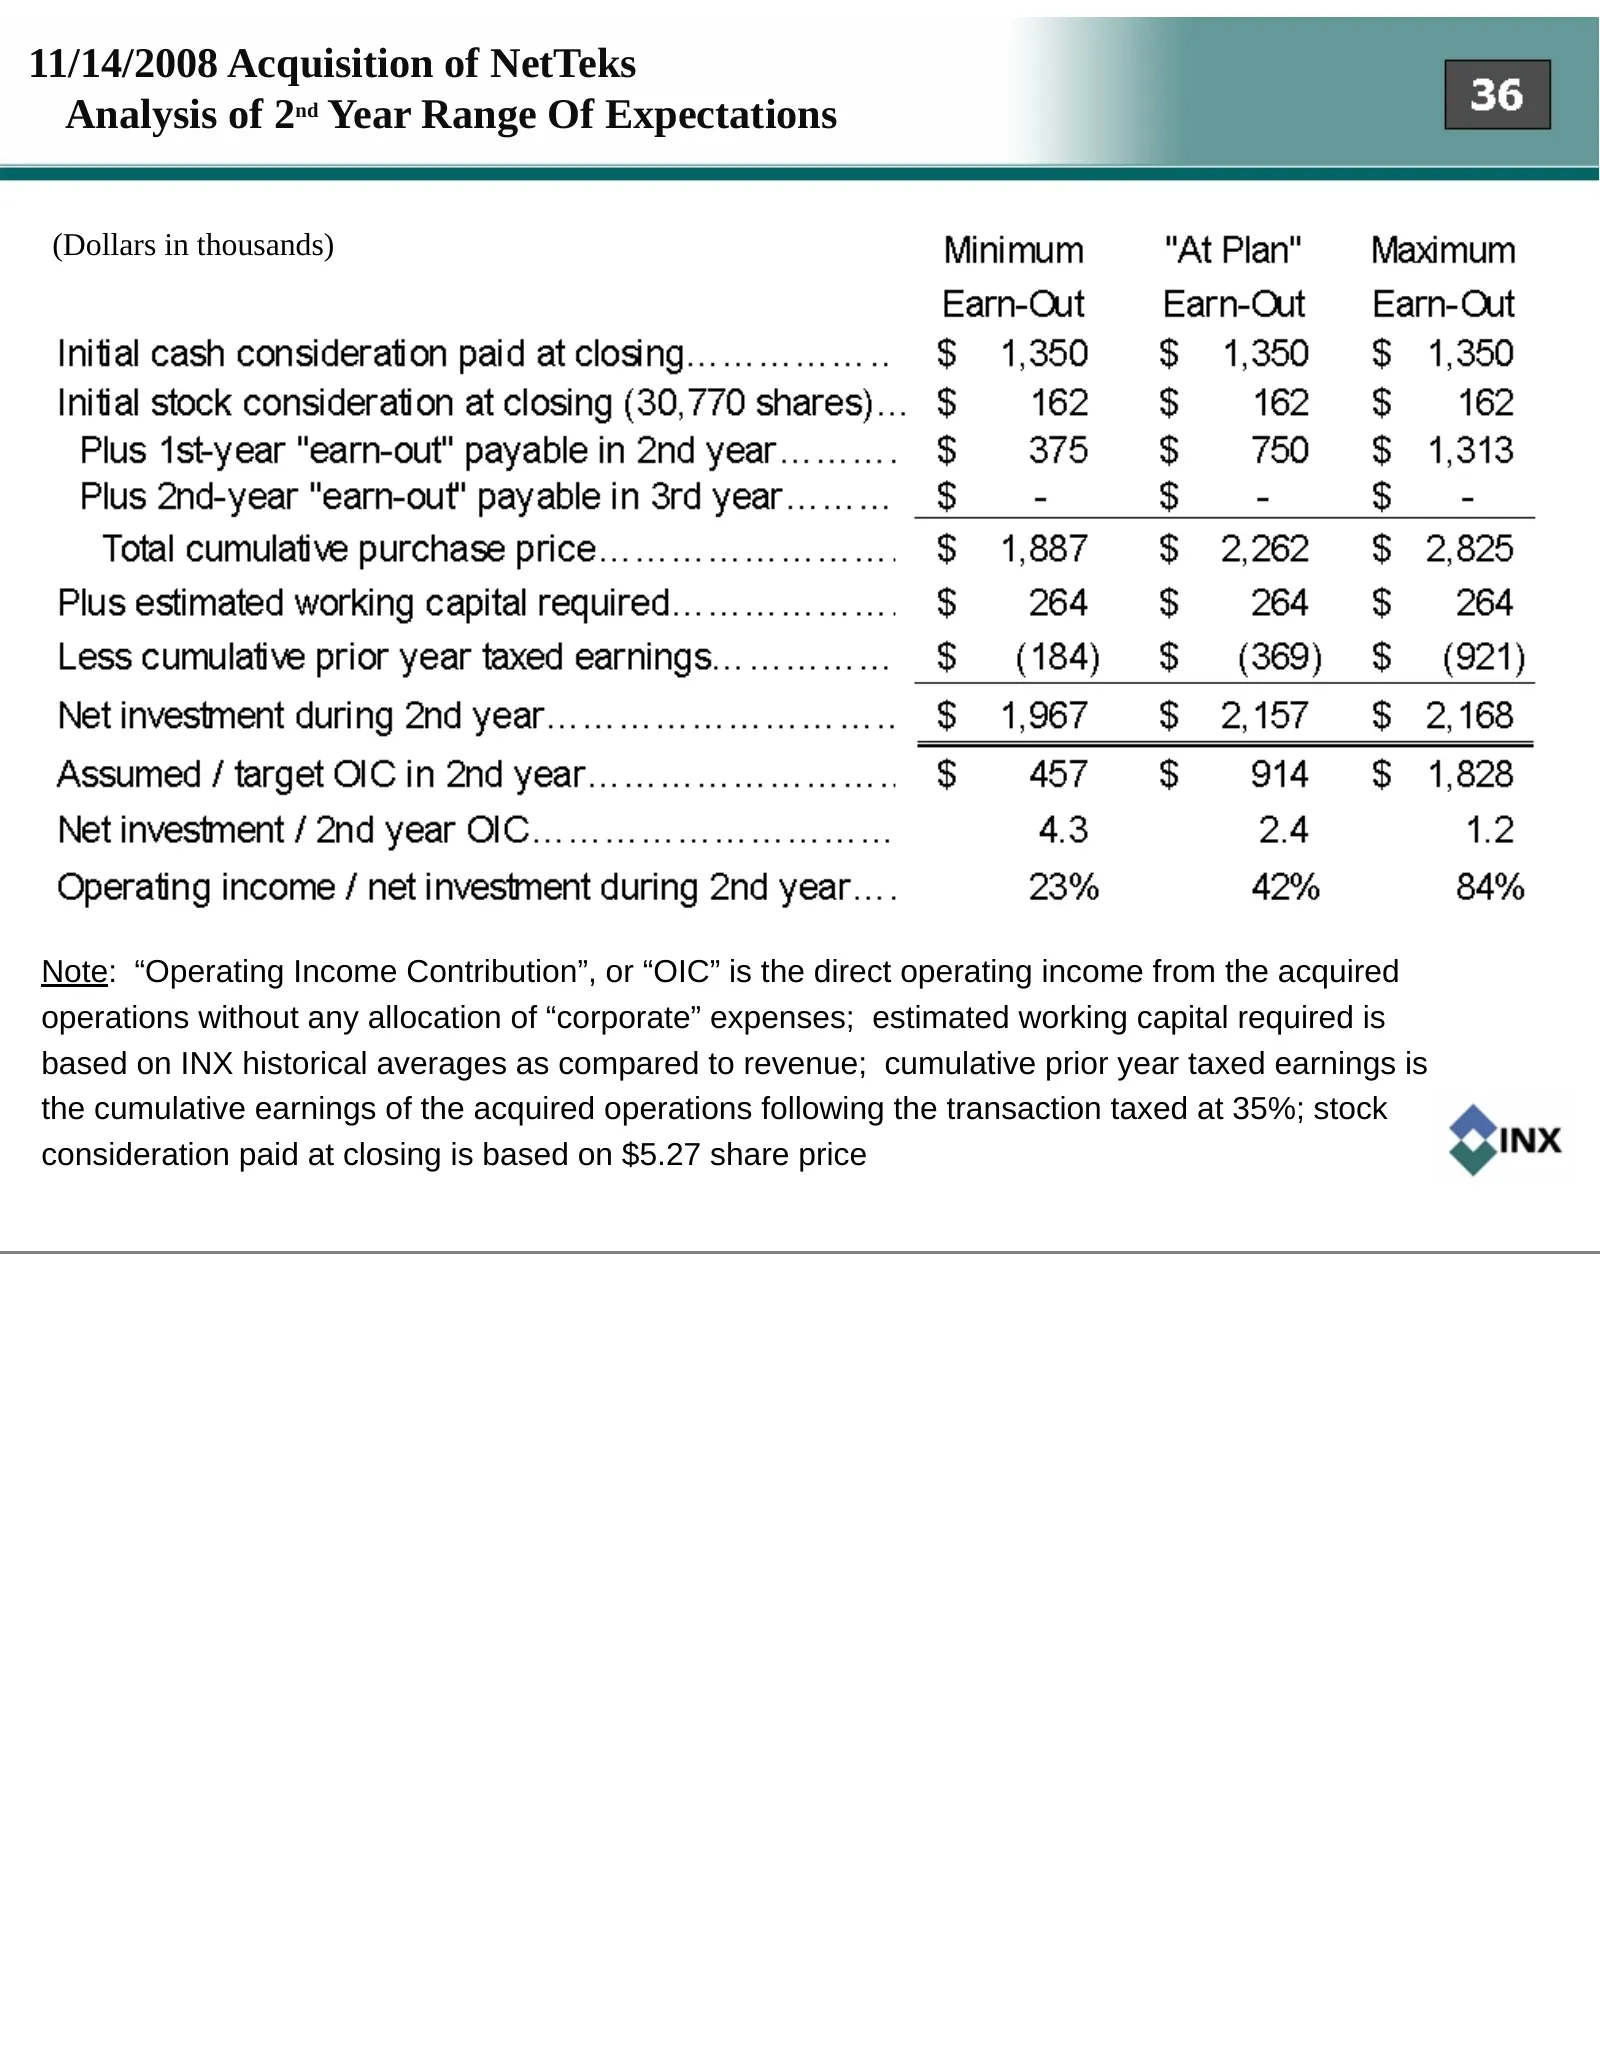
11/14/2008 Acquisition of NetTeks Analysis of 2nd Year Range Of Expectations (Dollars in thousands) Note: “Operating Income Contribution”, or “OIC” is the direct operating income from the acquired operations without any allocation of “corporate” expenses; estimated working capital required is based
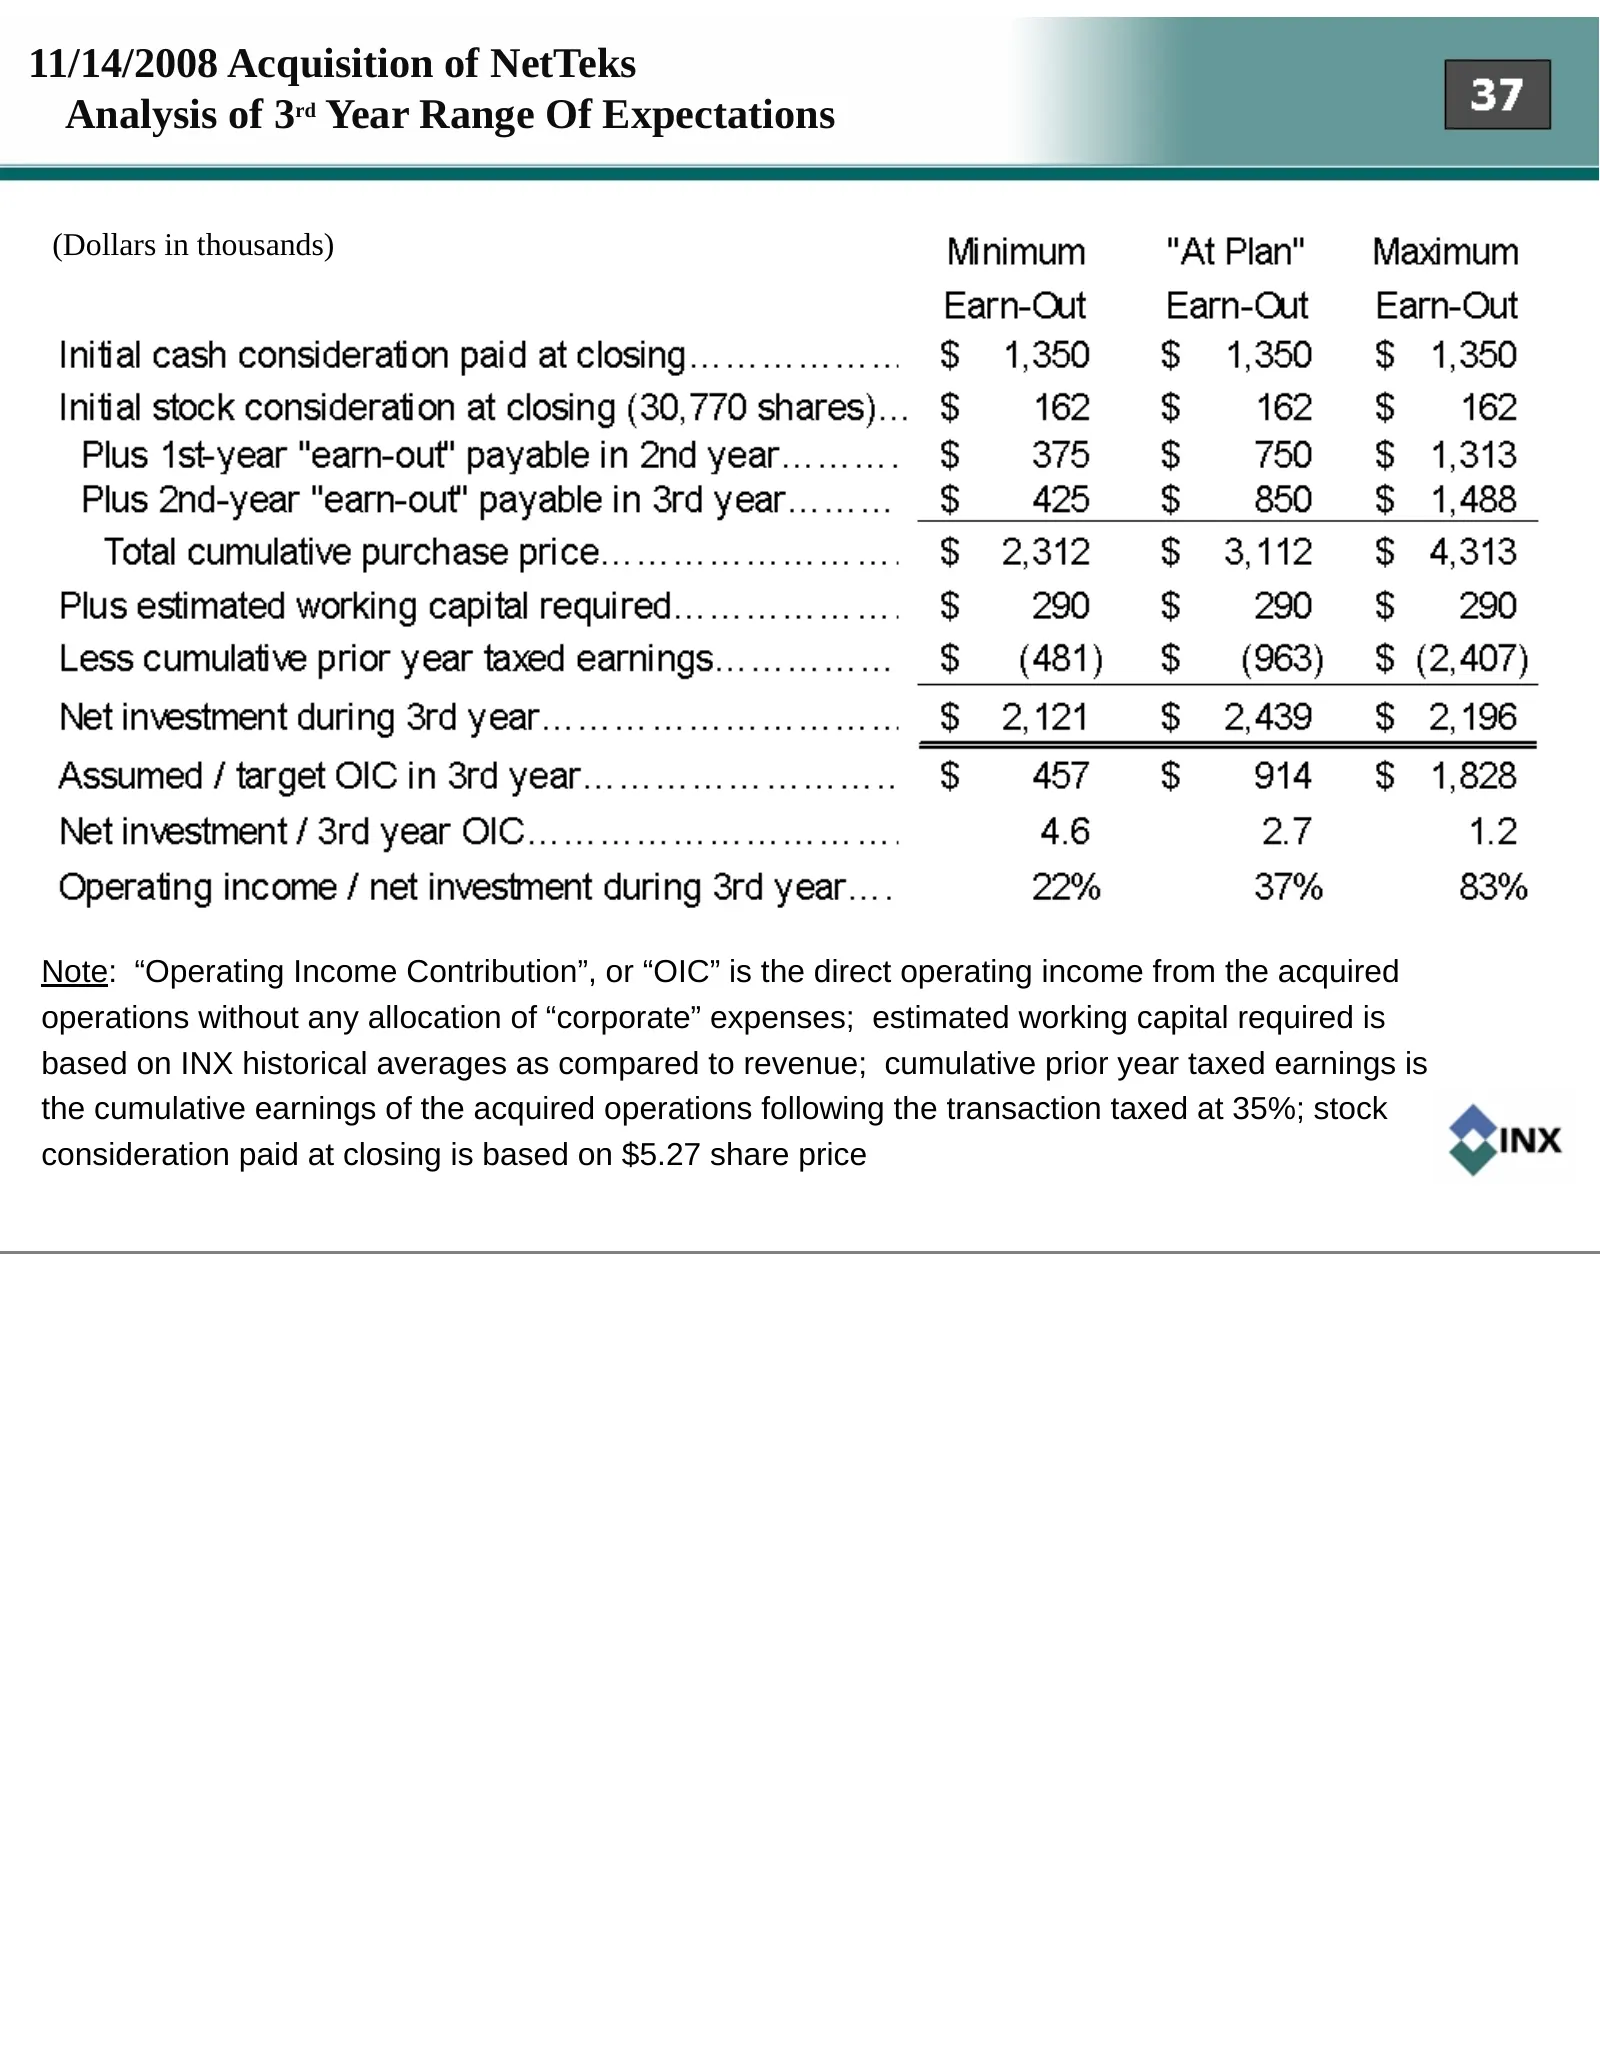
Slide 37: Acquisition of NetTeks: Analysis of 3rd Year Range Of Expectations
11/14/2008 Acquisition of NetTeks Analysis of 3rd Year Range Of Expectations (Dollars in thousands) Note: “Operating Income Contribution”, or “OIC” is the direct operating income from the acquired operations without any allocation of “corporate” expenses; estimated working capital required is based
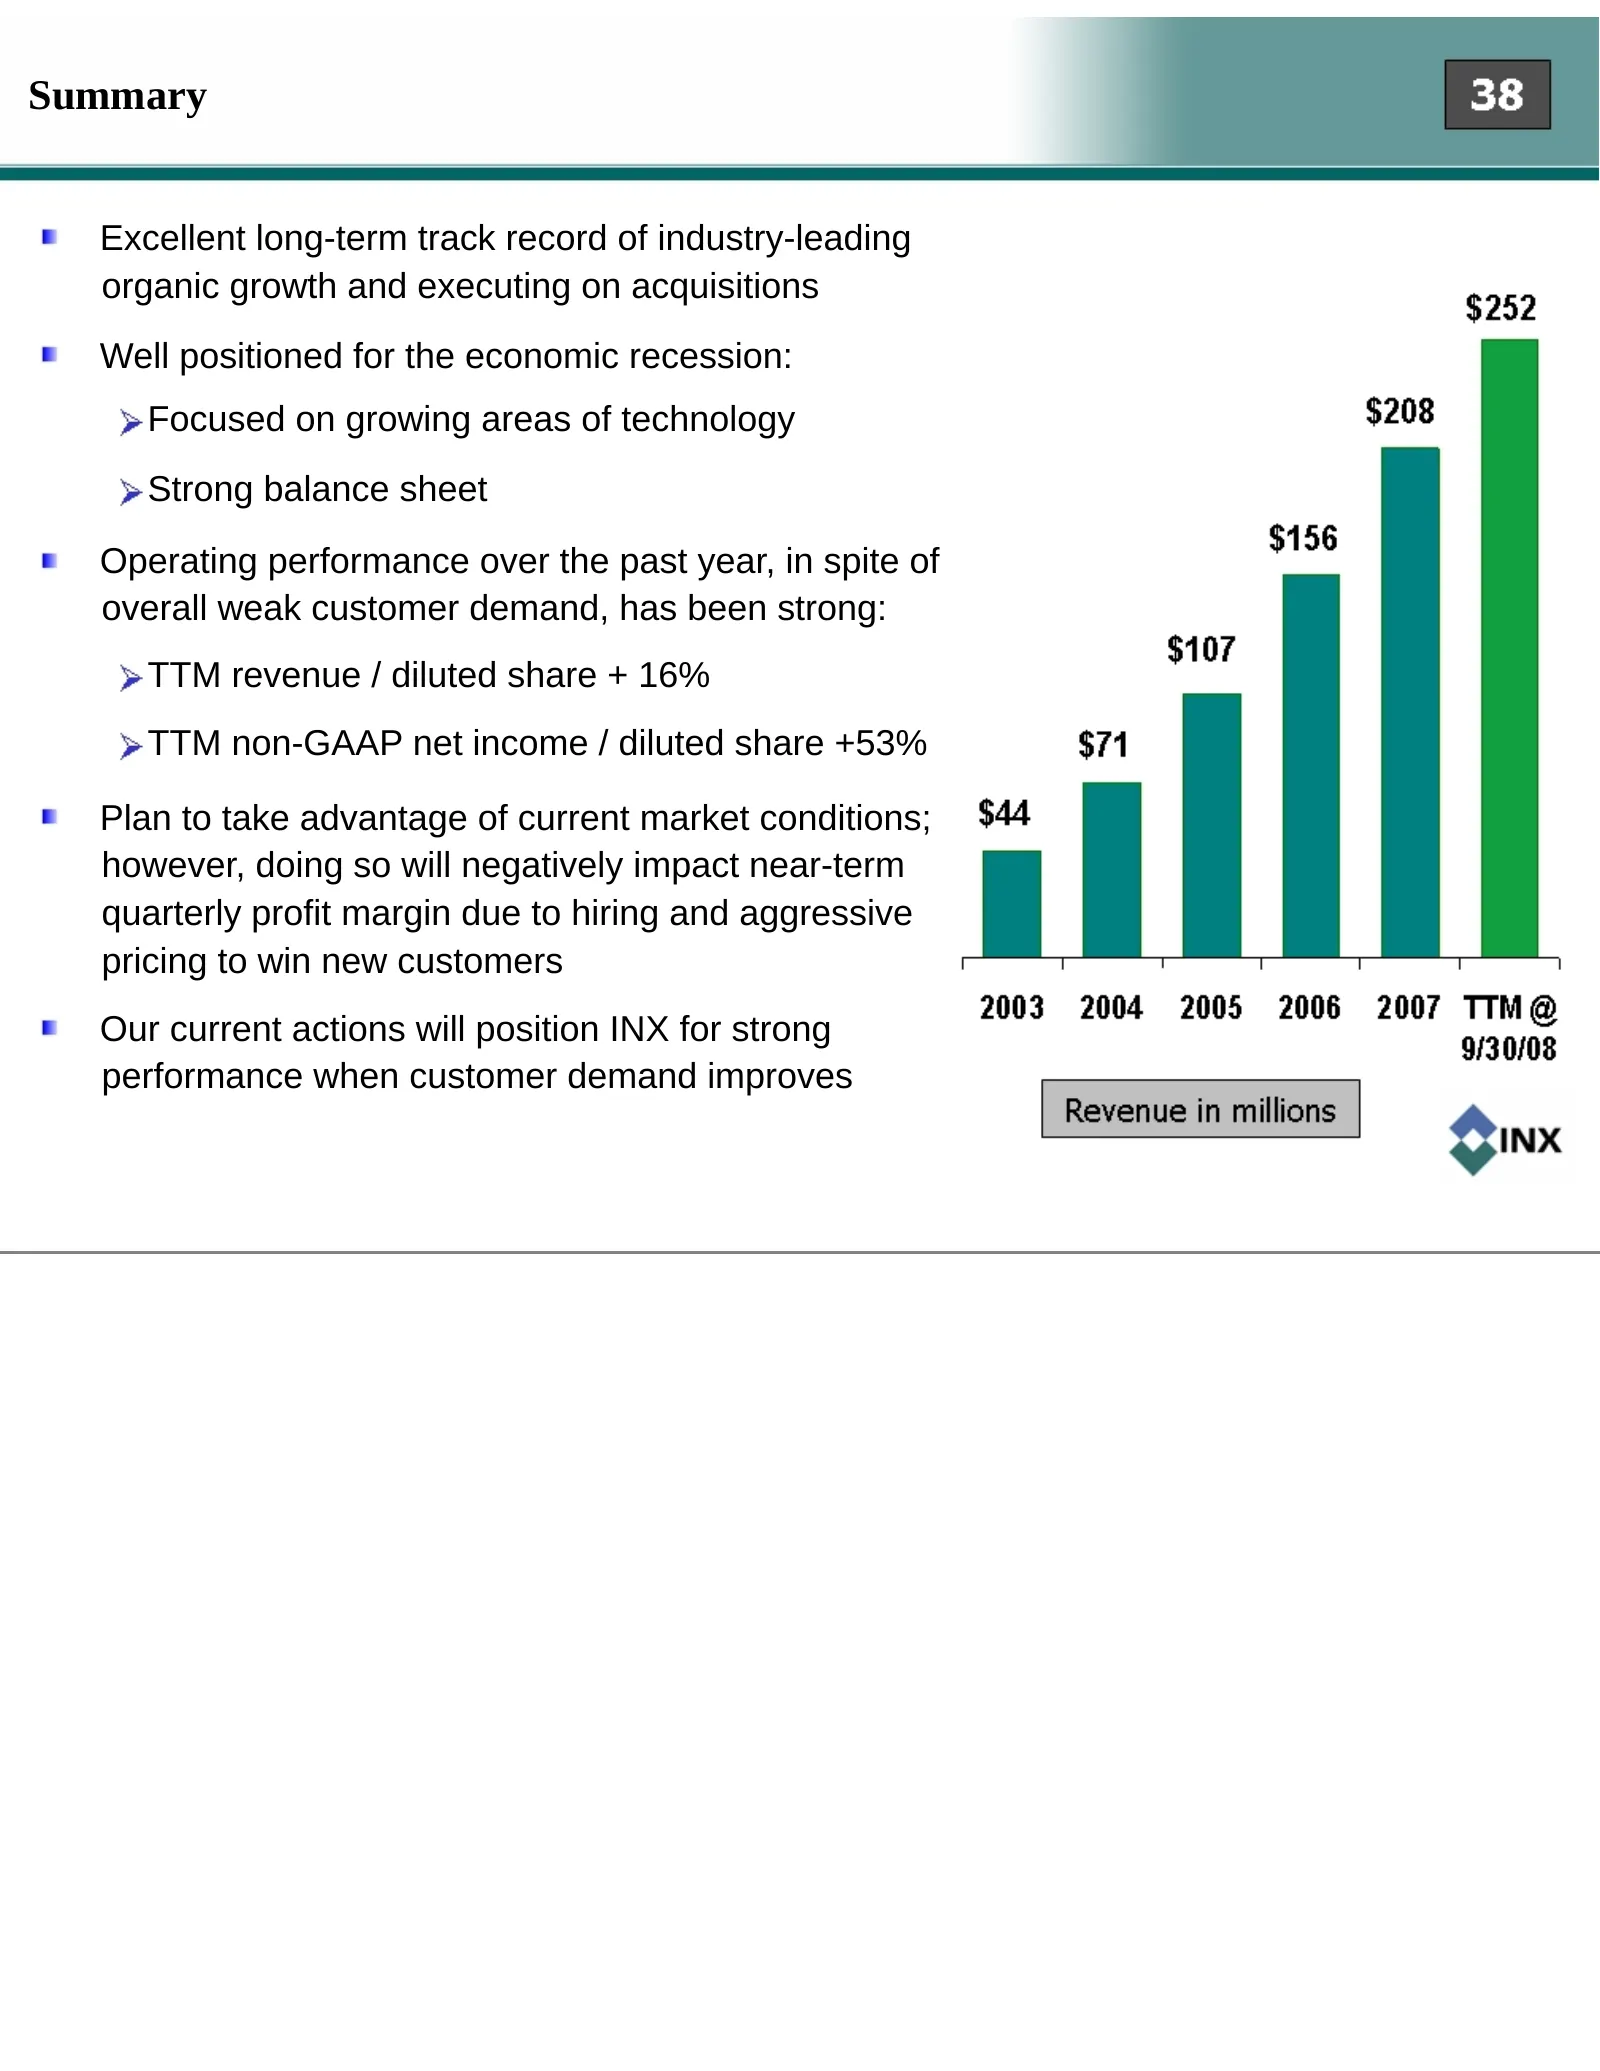
Slide 38: Summary
Summary Excellent long-term track record of industry-leading organic growth and executing on acquisitions Well positioned for the economic recession: Focused on growing areas of technology Strong balance sheet Operating performance over the past year, in spite of overall weak customer demand, has be

Slide 39
Source: SEC EDGAR · 8-K filed Nov 18, 2008
More decks from INX Inc
 Merger or Acquisition (November 2011)10 slides · Nov 1, 2011
 Rodman & Renshaw Global Investment Conference 201120 slides · Sep 13, 2011
 Shareholder Meeting (July 2011)15 slides · Jul 19, 2011
 Q1 2011 Earnings Presentation15 slides · Jul 13, 2011
 FY2010 Earnings Presentation28 slides · Jun 6, 2011
 Corporate Update (November 2010)24 slides · Nov 10, 2010