SITE Centers Corp. · NYSE:SITC
SITE Centers — Q2 2023 Earnings Presentation
25 slides from SITE Centers's earnings presentation, Jul 25, 2023
Slide 1: 2Q23 Earnings Conference Call
2Q23 EARNINGS CONFERENCE CALL S I T E C E N T E R S | J U LY 25 , 2 0 23
Slide 2: Safe Harbor Statement
S A F E H A R B O R S TAT E M E N T SITE Centers Corp. considers portions of the information in this press release to be forward-looking statements within the meaning of Section 27A of the Securities Act of 1933 and Section 21E of the Securities Exchange Act of 1934, both as amended, with respect to
Slide 3: Table of Contents
2 Q 2 3 K E Y TA K E AWAY S 4 2 Q 2 3 R E S U LT S S U M M A R Y 5 Table of O P E R AT I O N S O V E R V I E W 6 Contents G U I D A N C E & E A R N I N G S C O N S I D E R AT I O N S 10 C O N V E N I E N C E R E A L E S TAT E O P P O R T U N I T Y 11 APPENDIX 18 SITE CENTERS 2Q23 CONFERENCE CALL 3
Slide 4: 2Q23 Key Takeaways
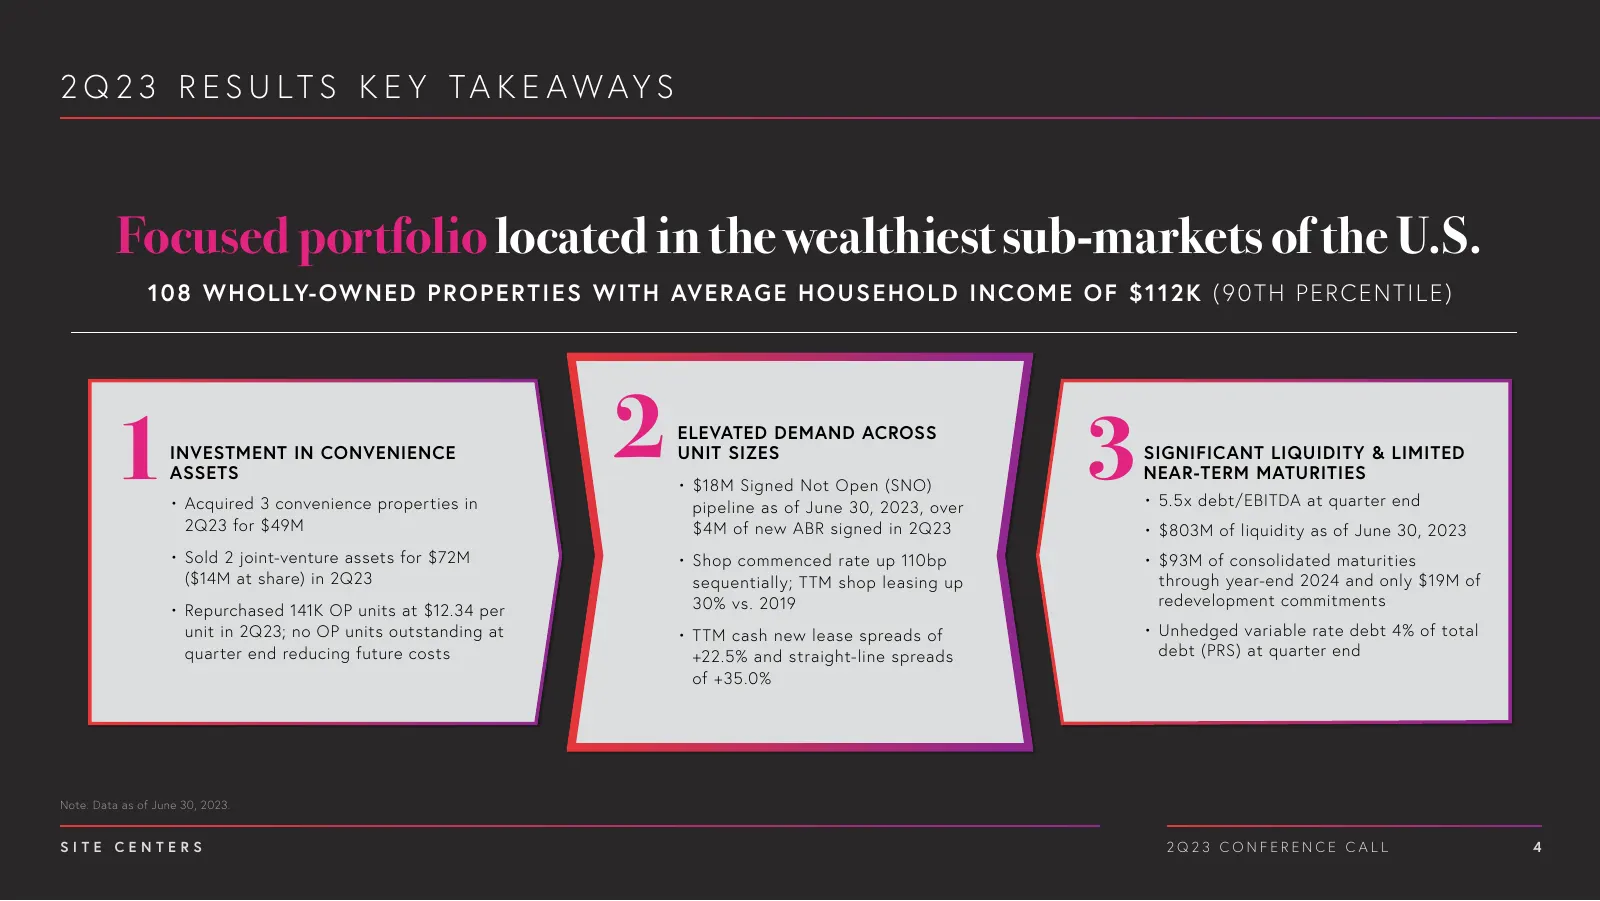
2 Q 2 3 R E S U LT S K E Y TA K E AWAY S Focused portfolio located in the wealthiest sub-markets of the U.S. 1 0 8 W HOL LY-OW NE D P R O P E R TI E S W I TH AVE R AG E H O U S EHO LD INCO ME O F $112 K (90 TH PE RCE NTILE ) 1 INVESTMENT IN CONVENIENCE ASSETS 2 ELEVATED DEMAND ACROSS UNIT SIZES • $1
Slide 5: 2Q23 Results Summary
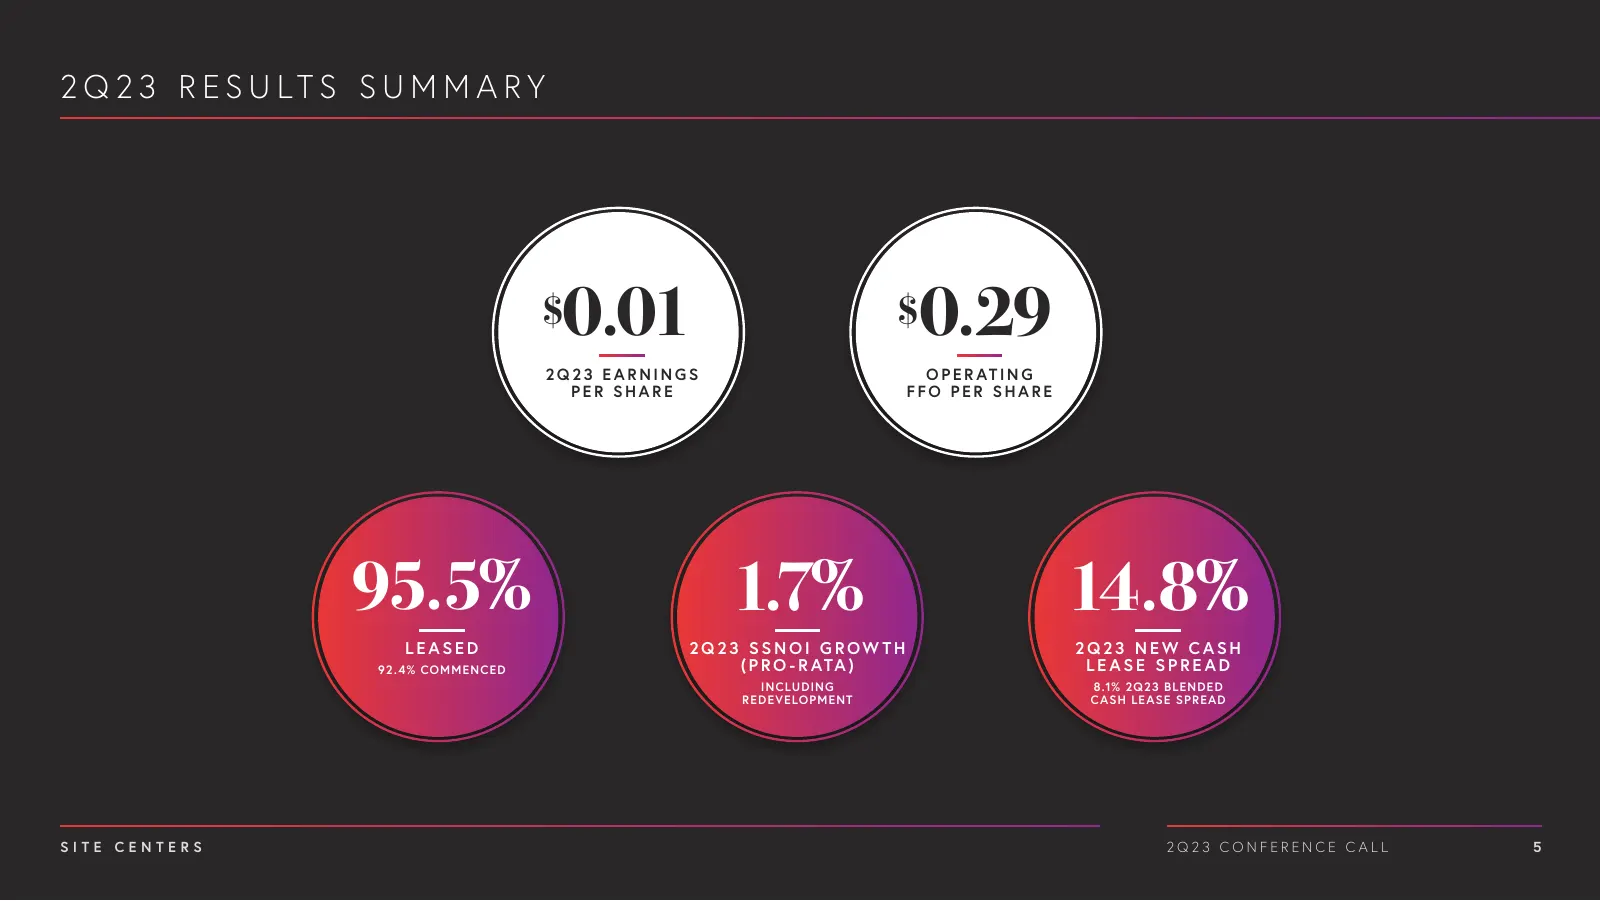
2 Q 2 3 R E S U LT S S U M M A R Y $0.01 $ 0.29 2Q23 EARNINGS O P E R AT I N G PER SHARE FFO PER SHARE 95.5% 1.7% 14.8% LEASED 2Q23 SSNOI G ROW TH 2Q23 NEW CASH 92 . 4% COMMENCED ( P R O - R ATA ) LEASE SPREAD INCLUDING 8.1% 2Q23 BLENDED REDE VELOPMENT CASH LE ASE SPRE AD SITE CENTERS 2Q23 CONFERENC
Slide 6: Operations Overview – Leasing Trends
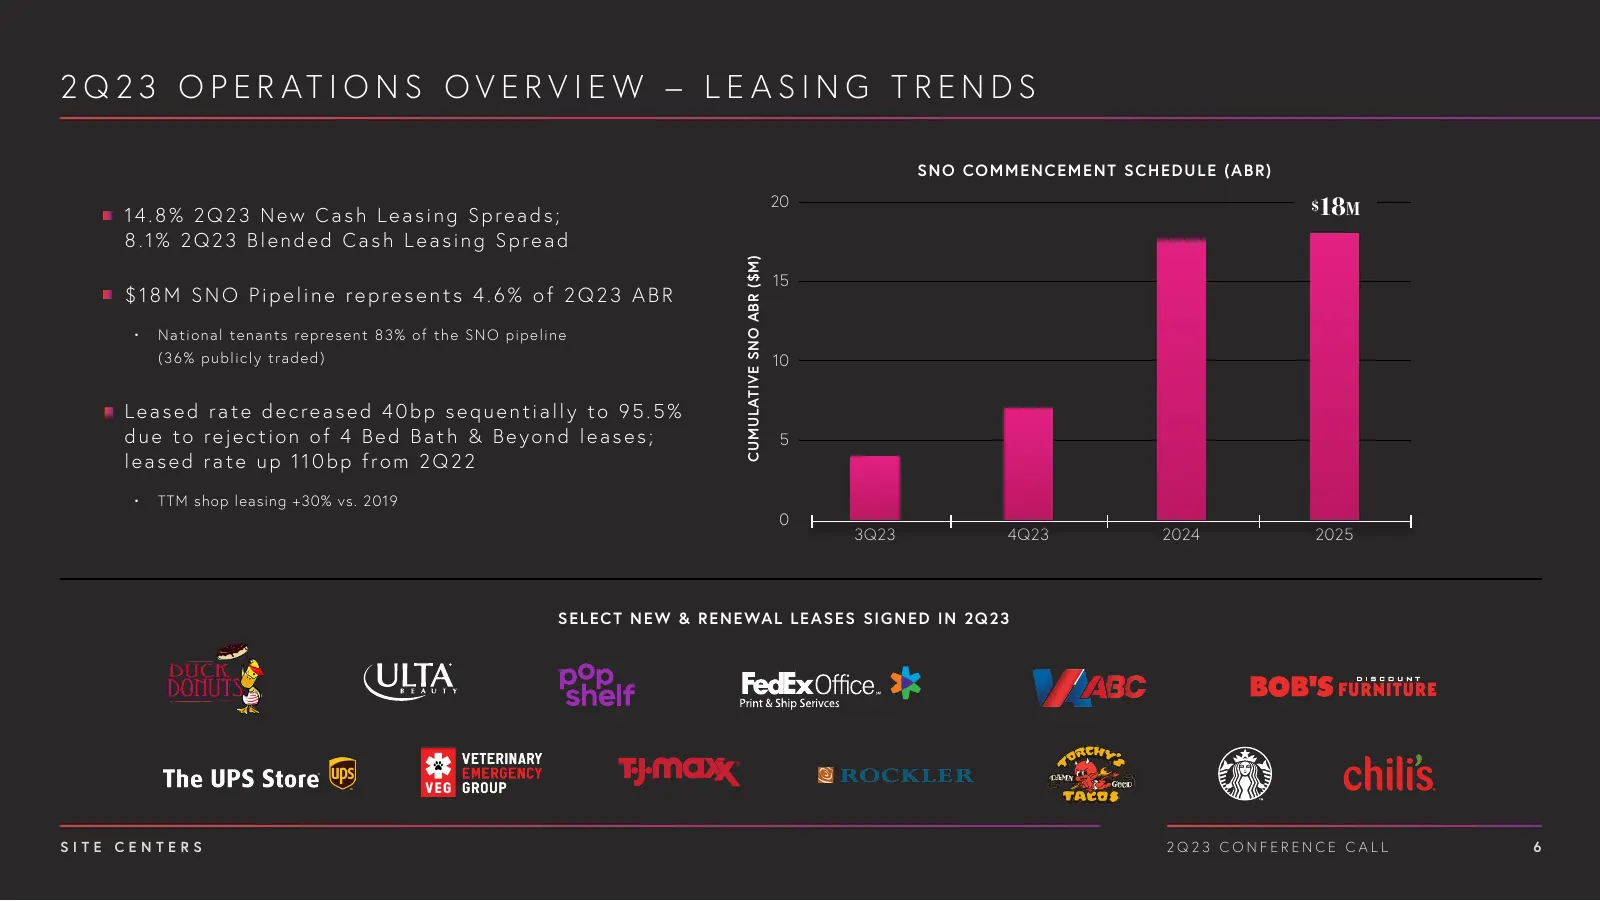
2 Q 2 3 O P E R AT I O N S O V E R V I E W – L E A S I N G T R E N D S SN O CO M M E N CE M E NT SCH E D U L E ( A B R) 14.8% 2Q23 New Cash Leasing Spreads; 20 18m $ 8.1% 2Q23 Blended Cash Leasing Spread CUMULATIVE SNO ABR ($M) 15 $18M SNO Pipeline represents 4.6% of 2Q23 ABR • N at io na l t e n a
Slide 7: Significant Liquidity at Quarter End
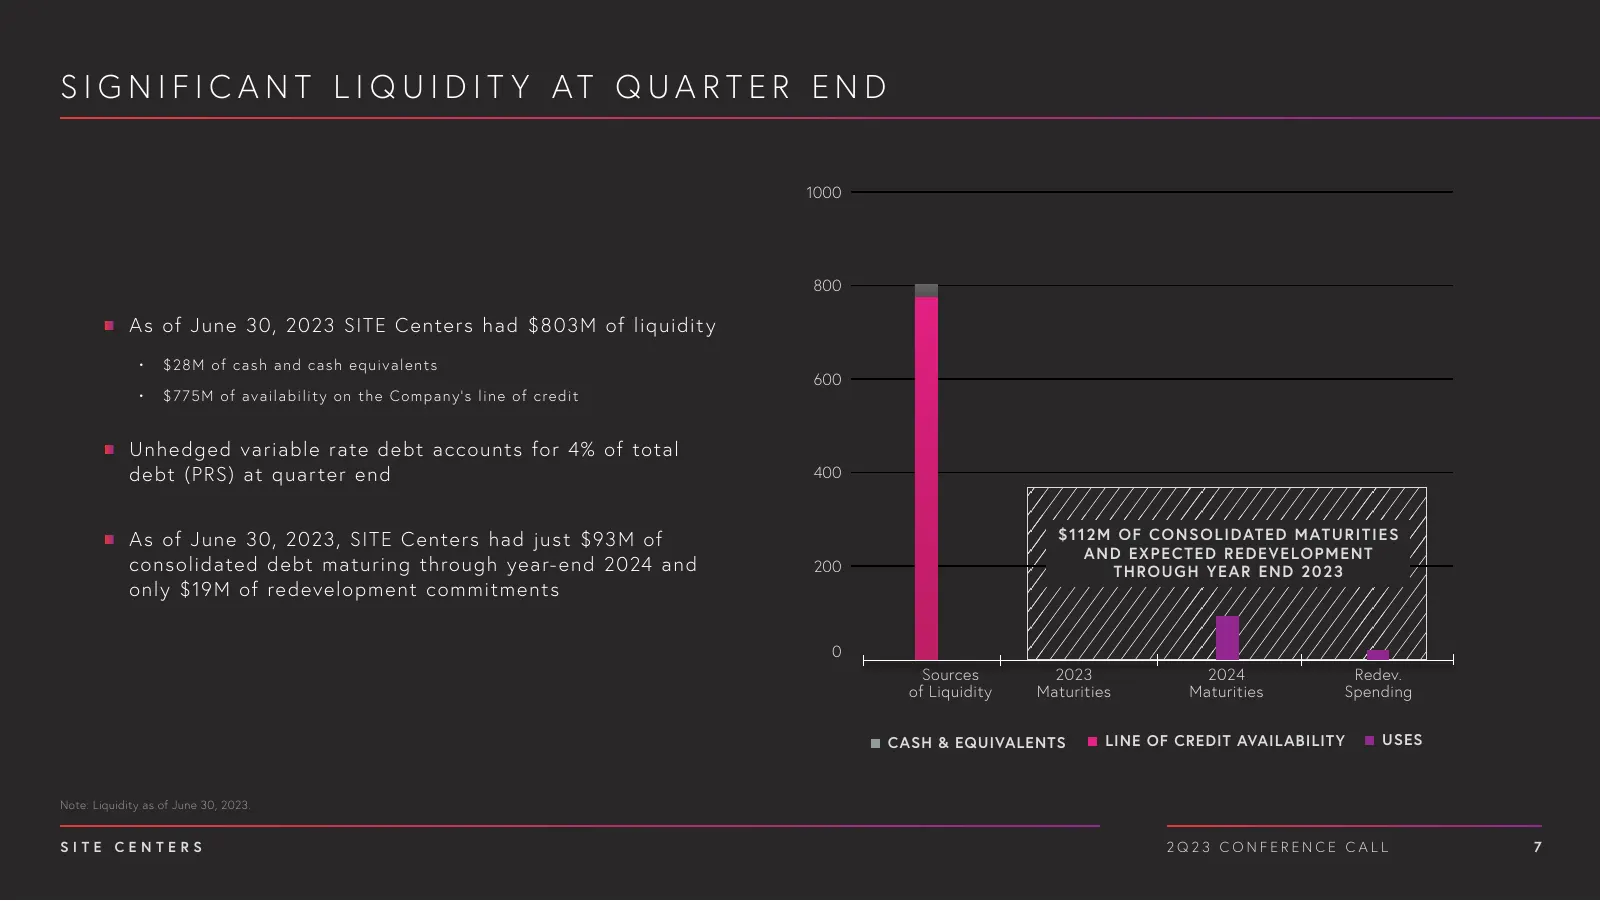
S I G N I F I C A N T L I Q U I D I T Y AT Q U A R T E R E N D 1000 800 A s of June 3 0, 2023 SITE Centers had $803M of liquidit y • $ 2 8 M of c a s h a n d c a s h e q u i v a l e n t s 600 • $ 775 M of a v a i l a bi l i t y on t he C om p an y’s lin e of c re dit Unhe dged variable rate debt acc
Slide 8: Investment Highlights: Briarcroft Center
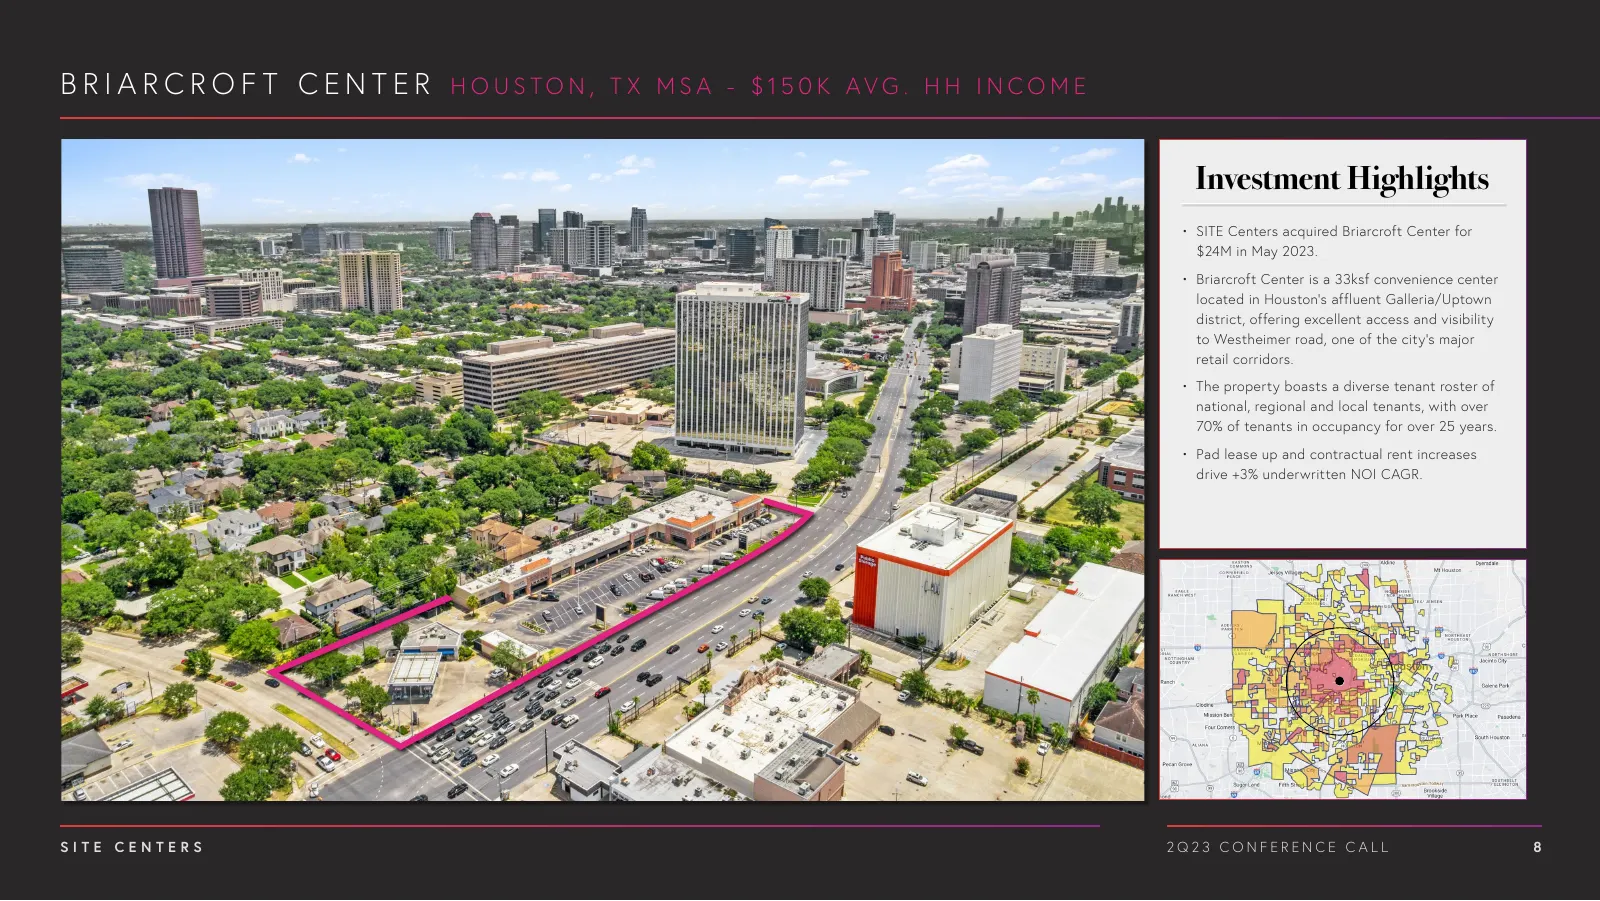
B R I A R C R O F T C E N T E R H O US TO N , T X M S A - $15 0 K AVG . H H I N CO M E Investment Highlights • SITE Centers acquired Briarcroft Center for $24M in May 2023. • Briarcroft Center is a 33ksf convenience center located in Houston’s affluent Galleria/Uptown district, offering excellent ac
Slide 9: Bed Bath & Beyond Update
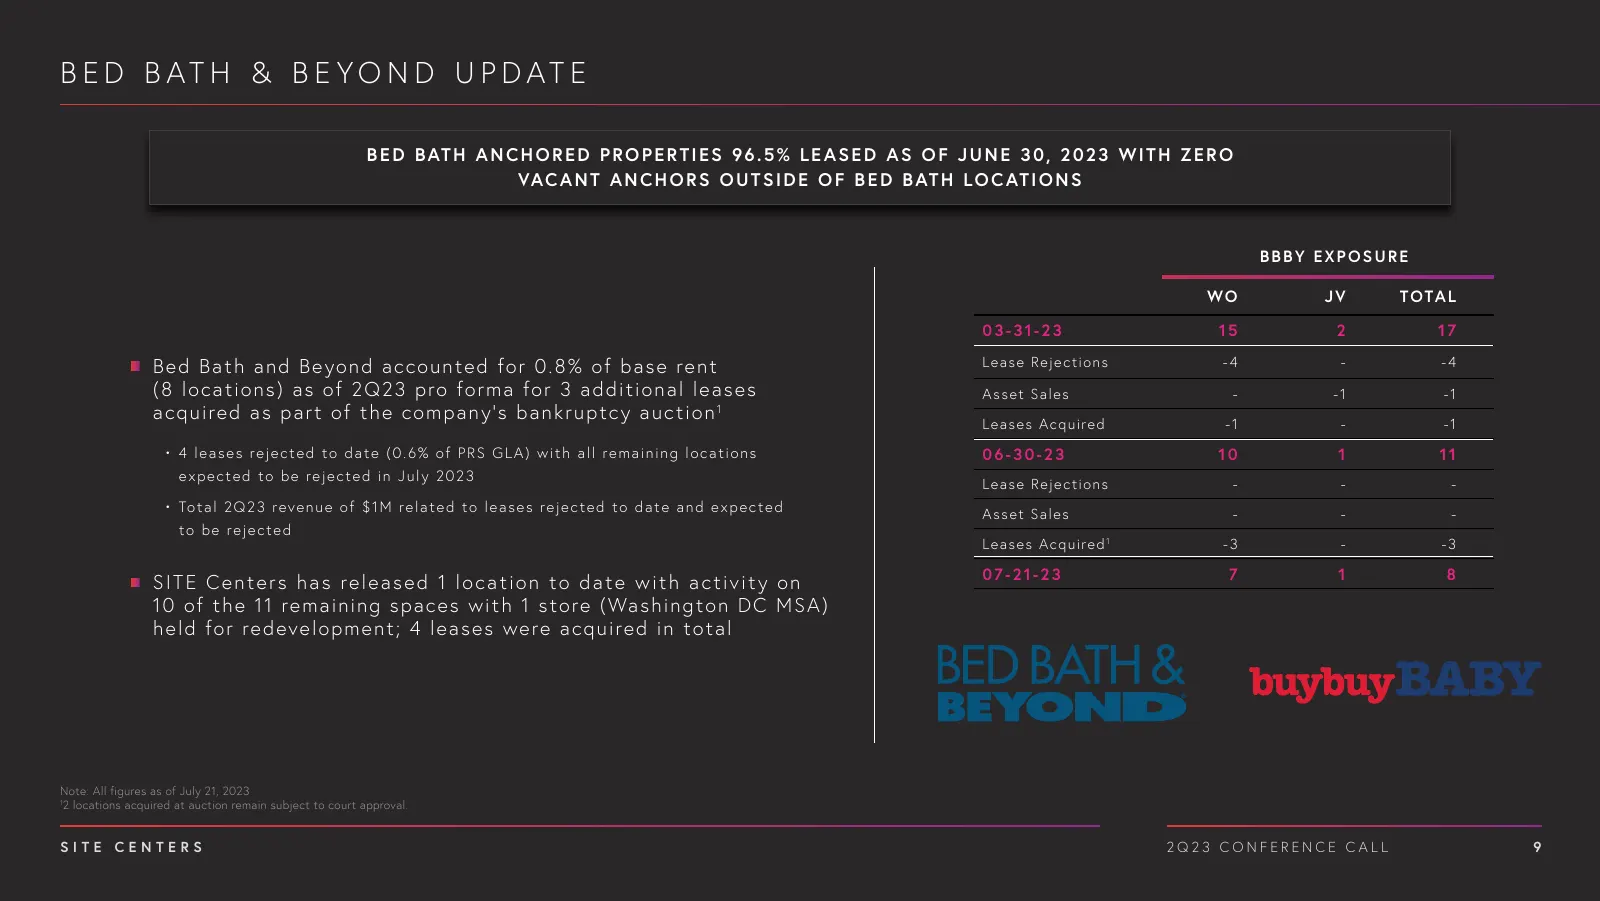
B E D B AT H & B E YO N D U P D AT E B E D B AT H A N C H O R E D P R O P E R T I E S 96 . 5 % L E A S E D A S O F J U N E 3 0, 2 0 2 3 W I T H Z E R O VAC A N T A N C H O R S O U T S I D E O F B E D B AT H L O C AT I O N S BBBY EXPOSURE WO JV T O TA L 03-31-23 15 2 17 B e d B ath and B eyo nd ac c
Slide 10: Guidance and Earnings Considerations
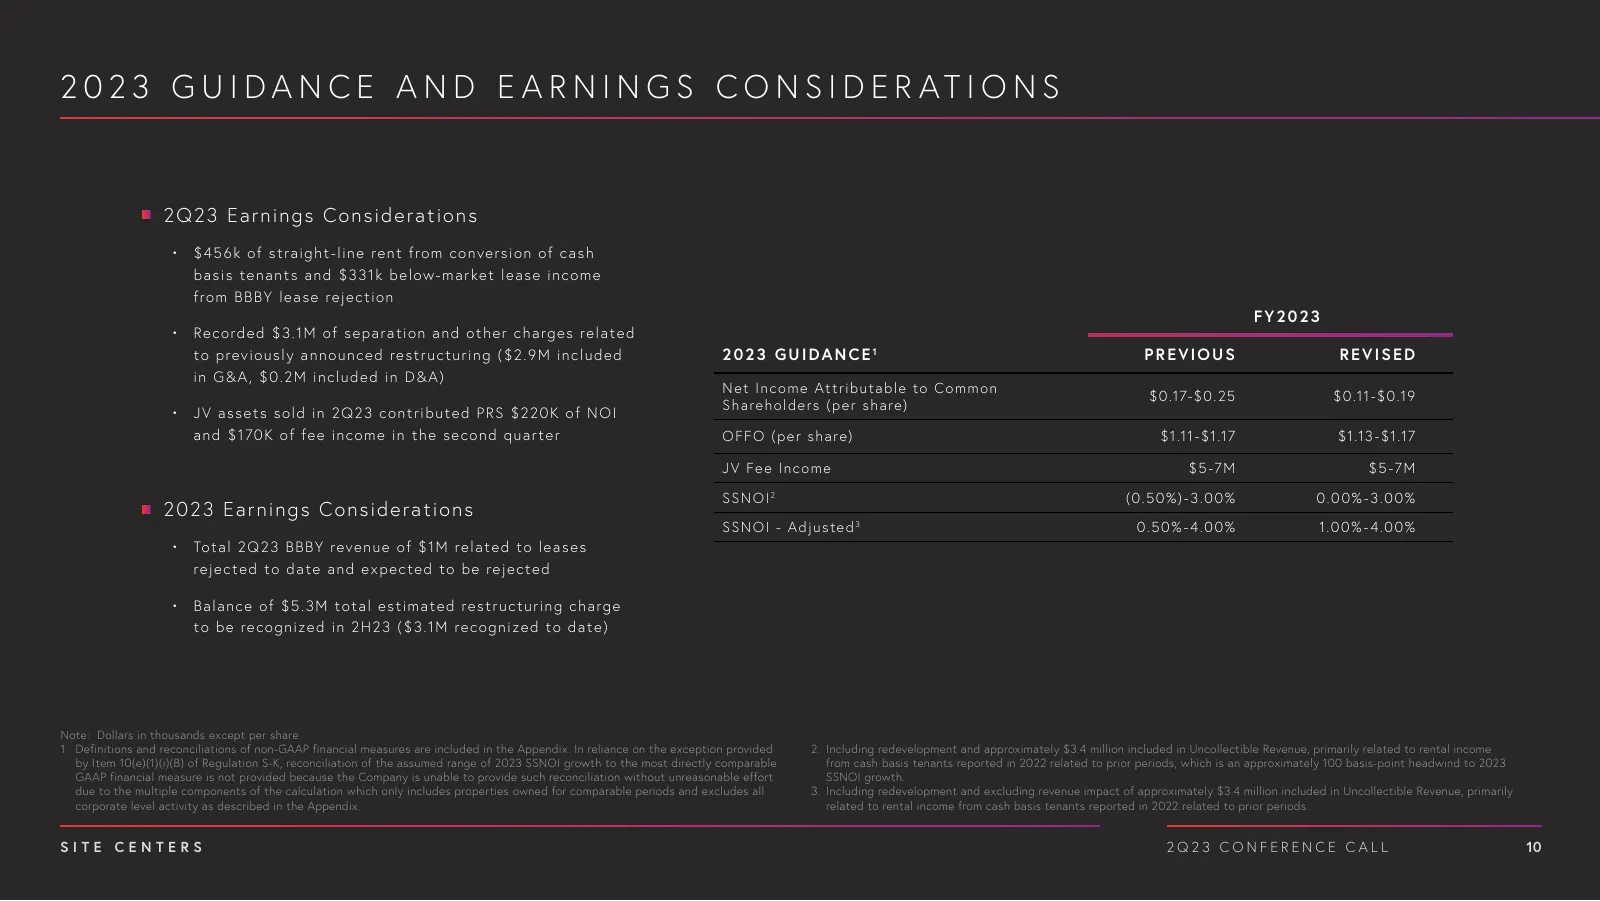
2 0 2 3 G U I D A N C E A N D E A R N I N G S C O N S I D E R AT I O N S 2 Q 2 3 E arni ng s C o nsi dera tions • $ 456 k of s t ra i g ht -l i n e re n t from c on ve rsion of c ash b a s i s t e n a n t s a n d $ 3 3 1 k be l ow-m arke t le ase in c om e f rom B B B Y l e a s e rej e c t i on FY20

Slide 11: Convenience Real Estate Opportunity
Convenience Real Estate Opportunity SITE CENTERS 2Q23 CONFERENCE CALL 11
Slide 12: Convenience Sector Attributes
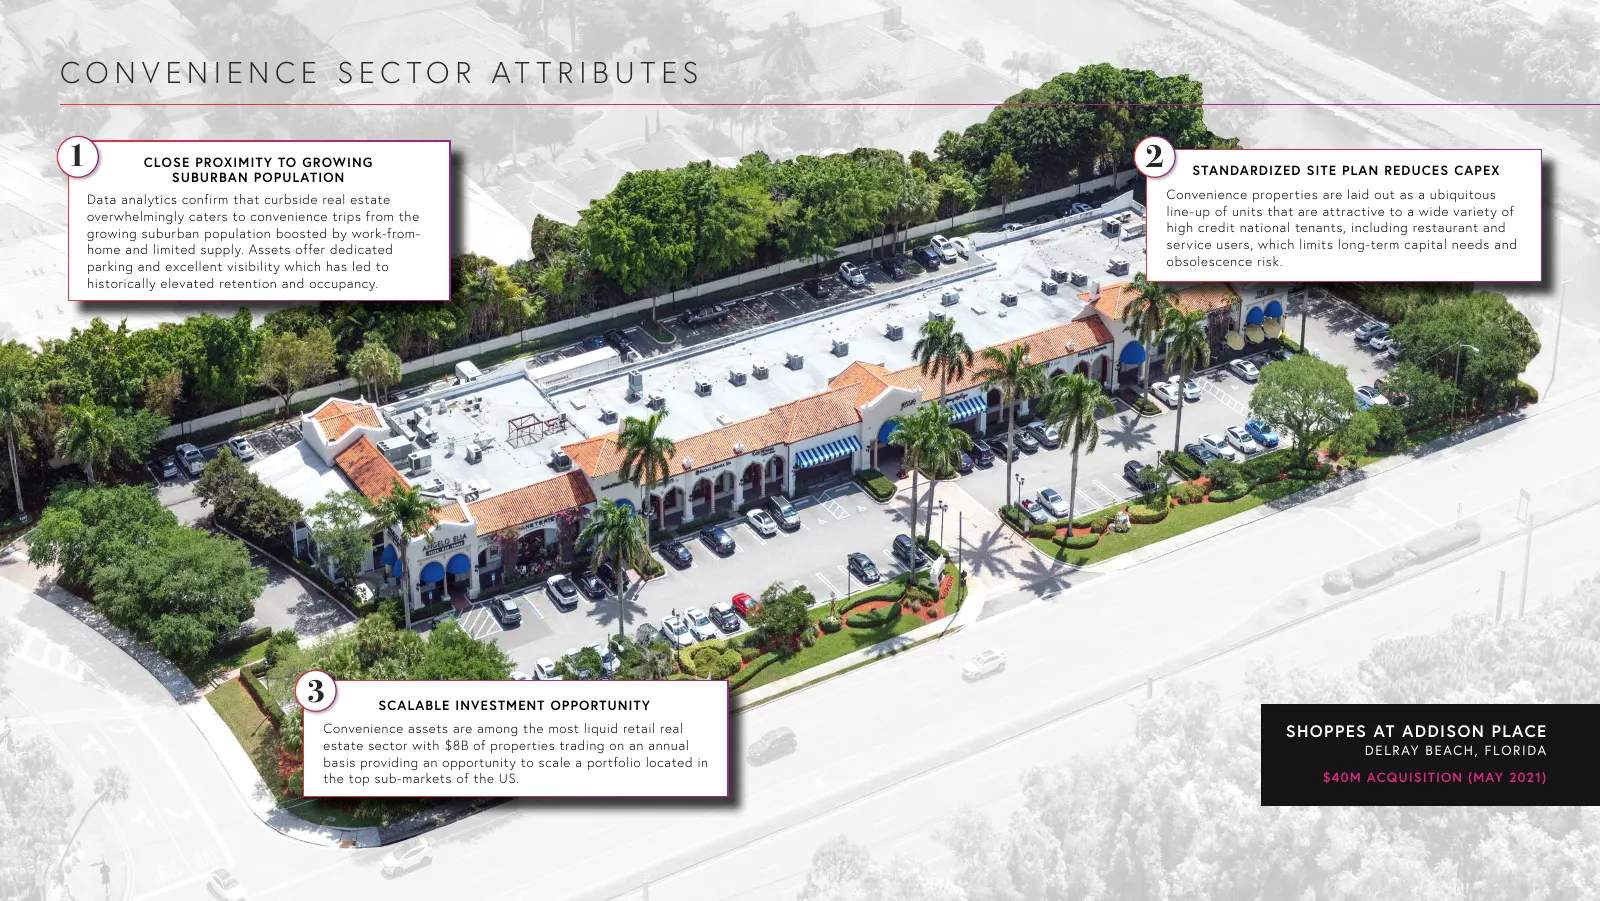
C O N V E N I E N C E S E C TO R AT T R I B U T E S 1 CLOSE PROXIMITY TO GROWING SUBURBAN POPULATION 2 STANDARDIZED SITE PLAN REDUCES CAPEX Data analytics confirm that curbside real estate Convenience properties are laid out as a ubiquitous overwhelmingly caters to convenience trips from the line-up
Slide 13: Scalable Investment Opportunity
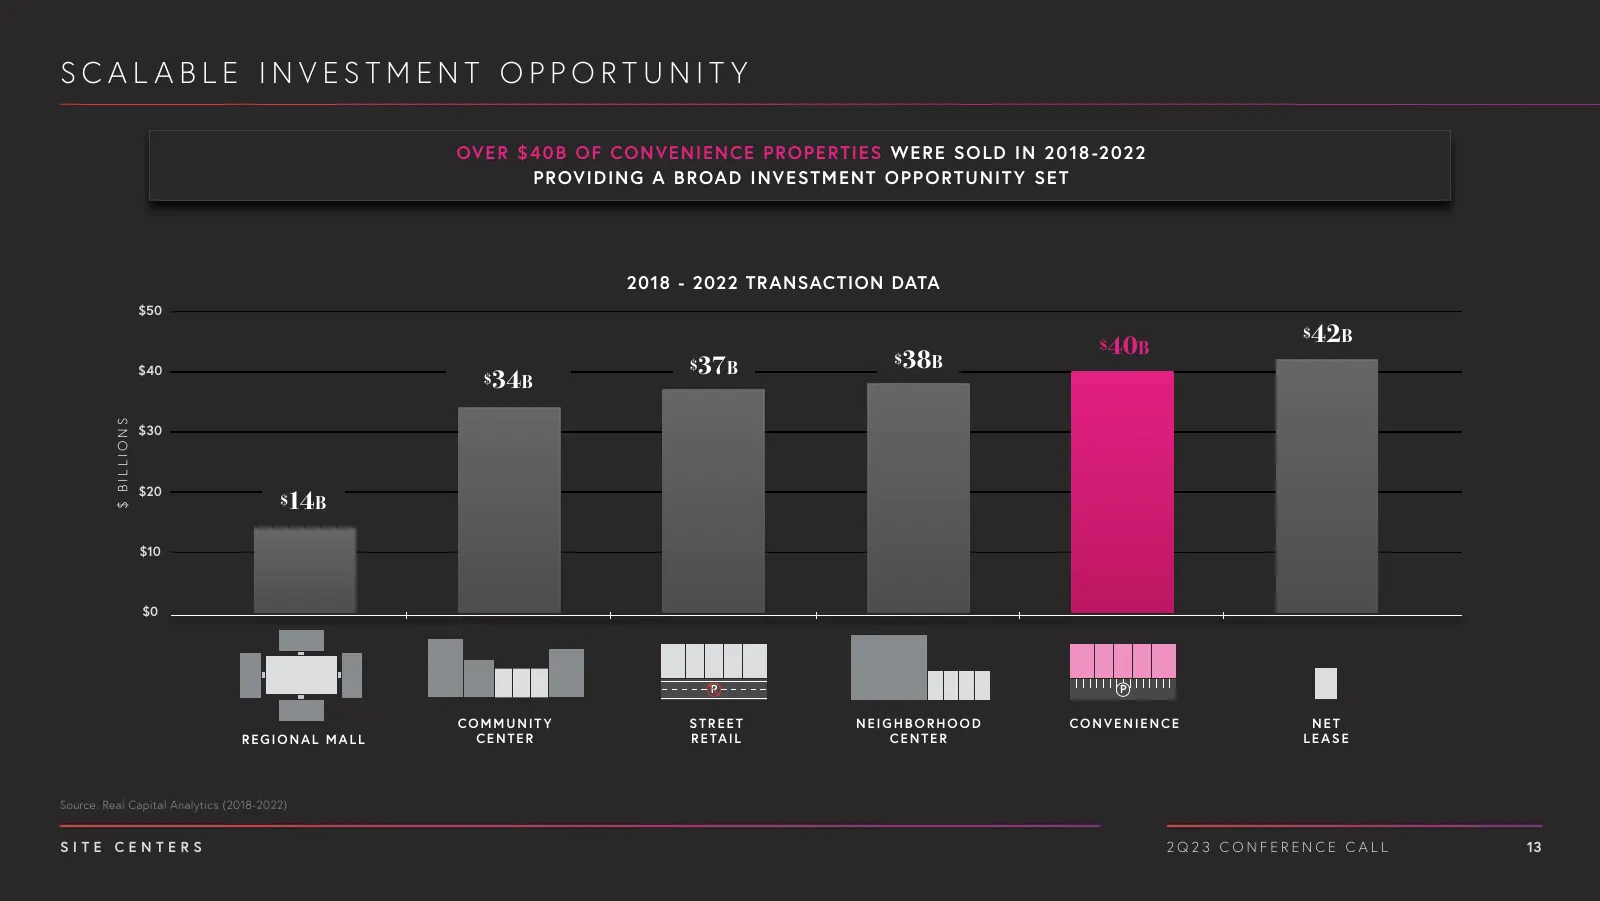
SCAL ABLE INVESTMENT OPPORTUNIT Y OVE R $ 40 B O F CO NVE NIE N CE PRO PE RTIES WE RE SO LD IN 2018 -2022 PROVIDIN G A B ROAD INVESTM E NT O PP O RTU NIT Y SE T 2018 - 2022 TRANSACTION DATA $50 $40b $42b $40 $37b 38b $ $34b $ BILLIONS $30 $20 $14b $10 $0 REGIONAL COMMUNITY HIGH NEIGHBORHOOD CONVENIE
Slide 14: Lease Structure and Credit Profile Offer Attractive Investment Attributes
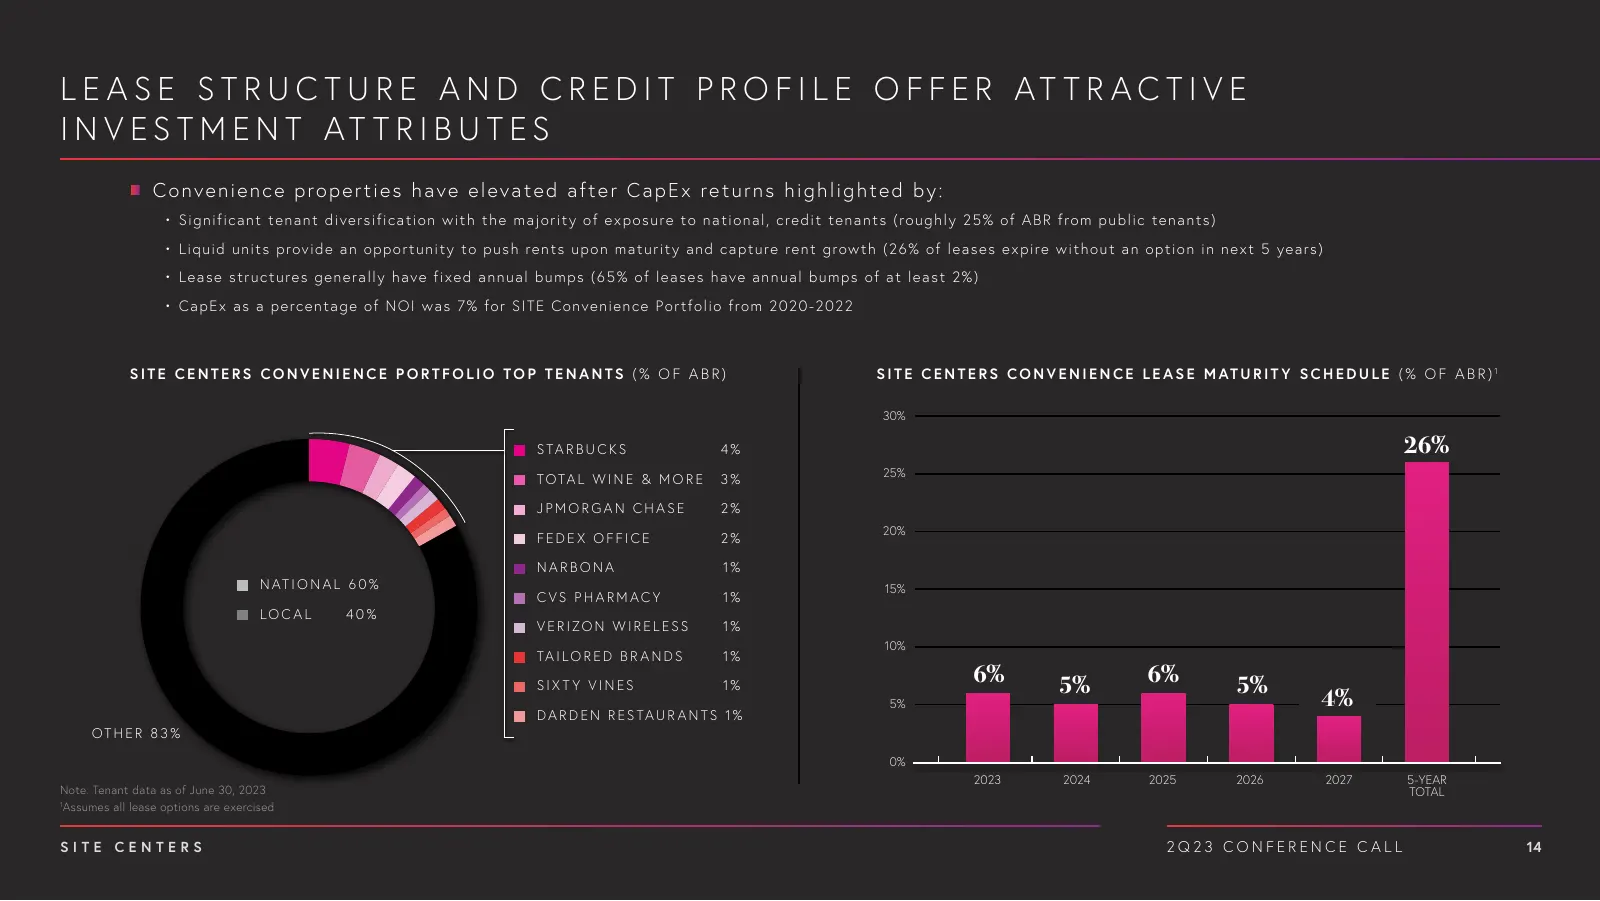
L E A S E S T R U C T U R E A N D C R E D I T P R O F I L E O F F E R AT T R A C T I V E I N V E S T M E N T AT T R I B U T E S C o n ve n i e n c e p ro p e r t i e s h a ve e l ev a t e d a f t e r C a p E x re t u r n s h i g h l i g h t e d b y : • S igni fi c a n t t e n a n t di ve rs i fi c a
Slide 15: Growing Convenience Real Estate Portfolio
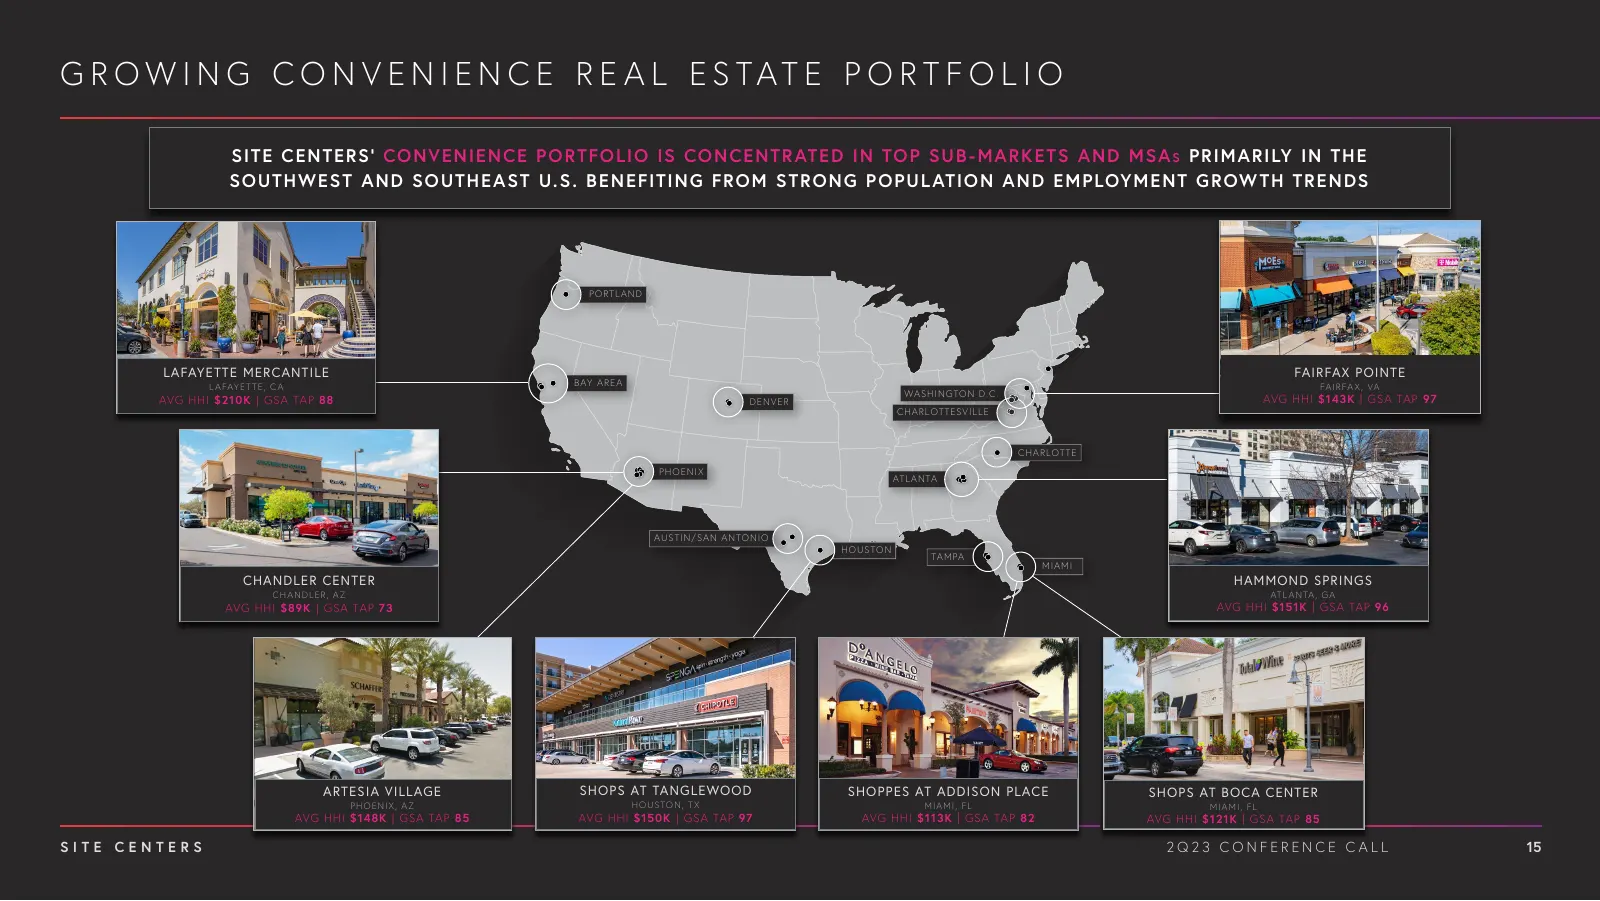
G R O W I N G C O N V E N I E N C E R E A L E S TAT E P O R T F O L I O SITE CE NTE RS ’ CO NVE NIE N CE P O RTFO LIO IS CO N CE NTR ATE D IN TO P SU B - MARK E TS AN D MSA s PRIMARILY IN TH E SOUTHWEST AN D SOUTH E AST U.S . B E N E FITIN G FRO M STRO N G P O PU L ATIO N AN D E M PLOYM E NT G ROW T
Slide 16: SITE Centers Convenience Real Estate Portfolio
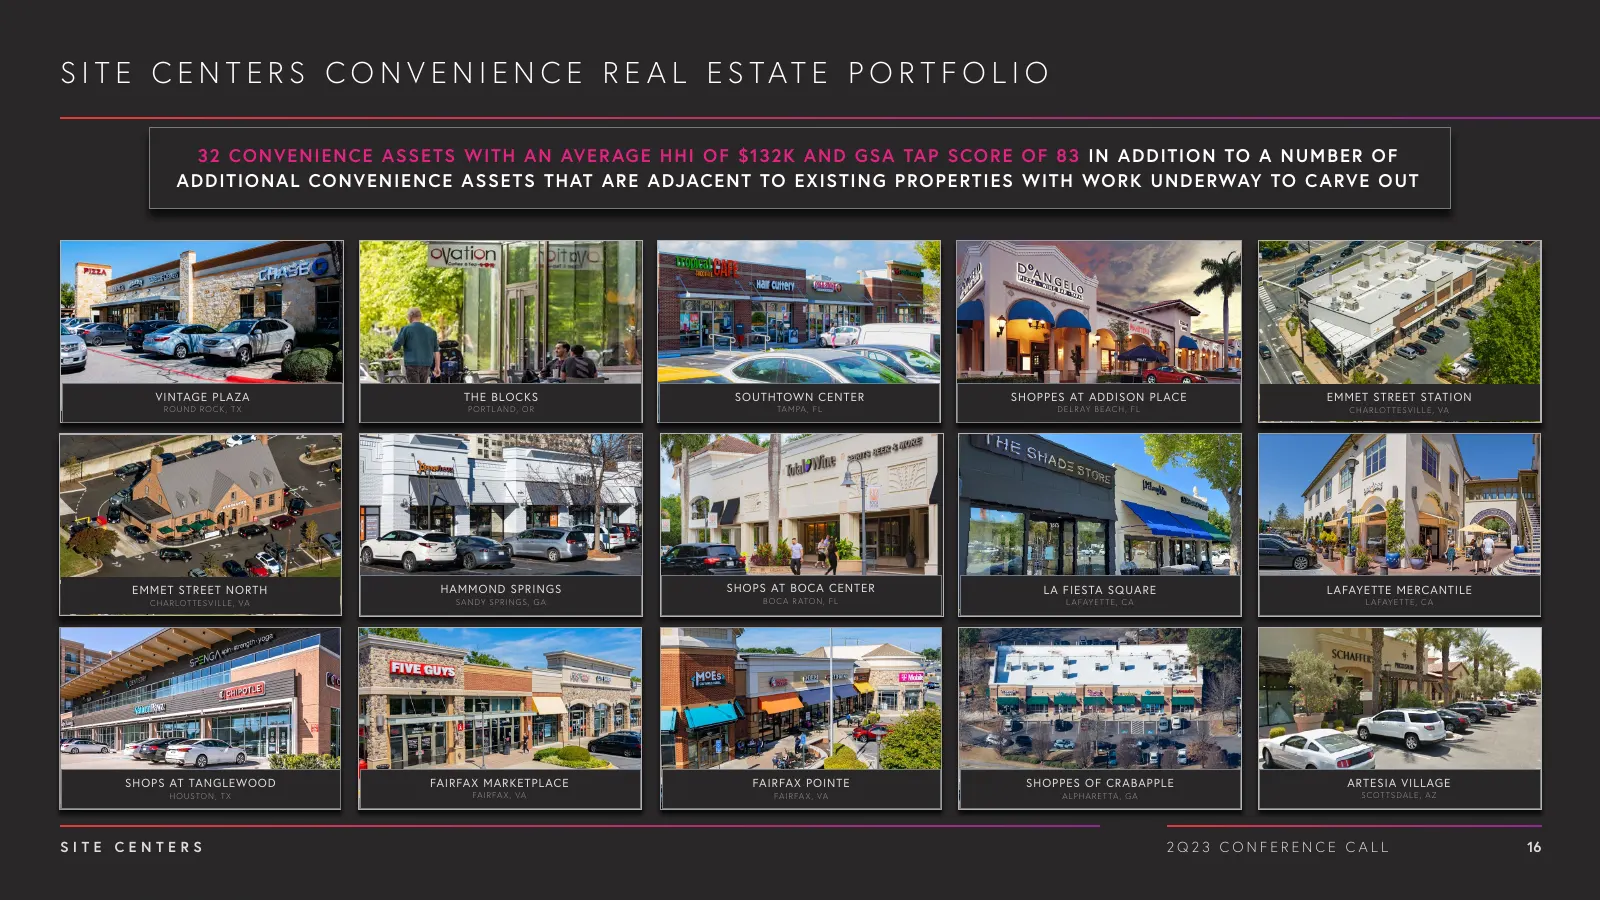
S I T E C E N T E R S C O N V E N I E N C E R E A L E S TAT E P O R T F O L I O 32 CO NVE NIE N CE ASSE TS WITH AN AVE R AG E H HI O F $132 K AN D GSA TAP SCO RE O F 83 IN AD DITIO N TO A N U M B E R O F AD DITIO NAL CO NVE NIE N CE ASSE TS THAT ARE ADJACE NT TO E XISTIN G PRO PE RTIES WITH WO RK U
Slide 17: SITE Centers Convenience Real Estate Portfolio Continued
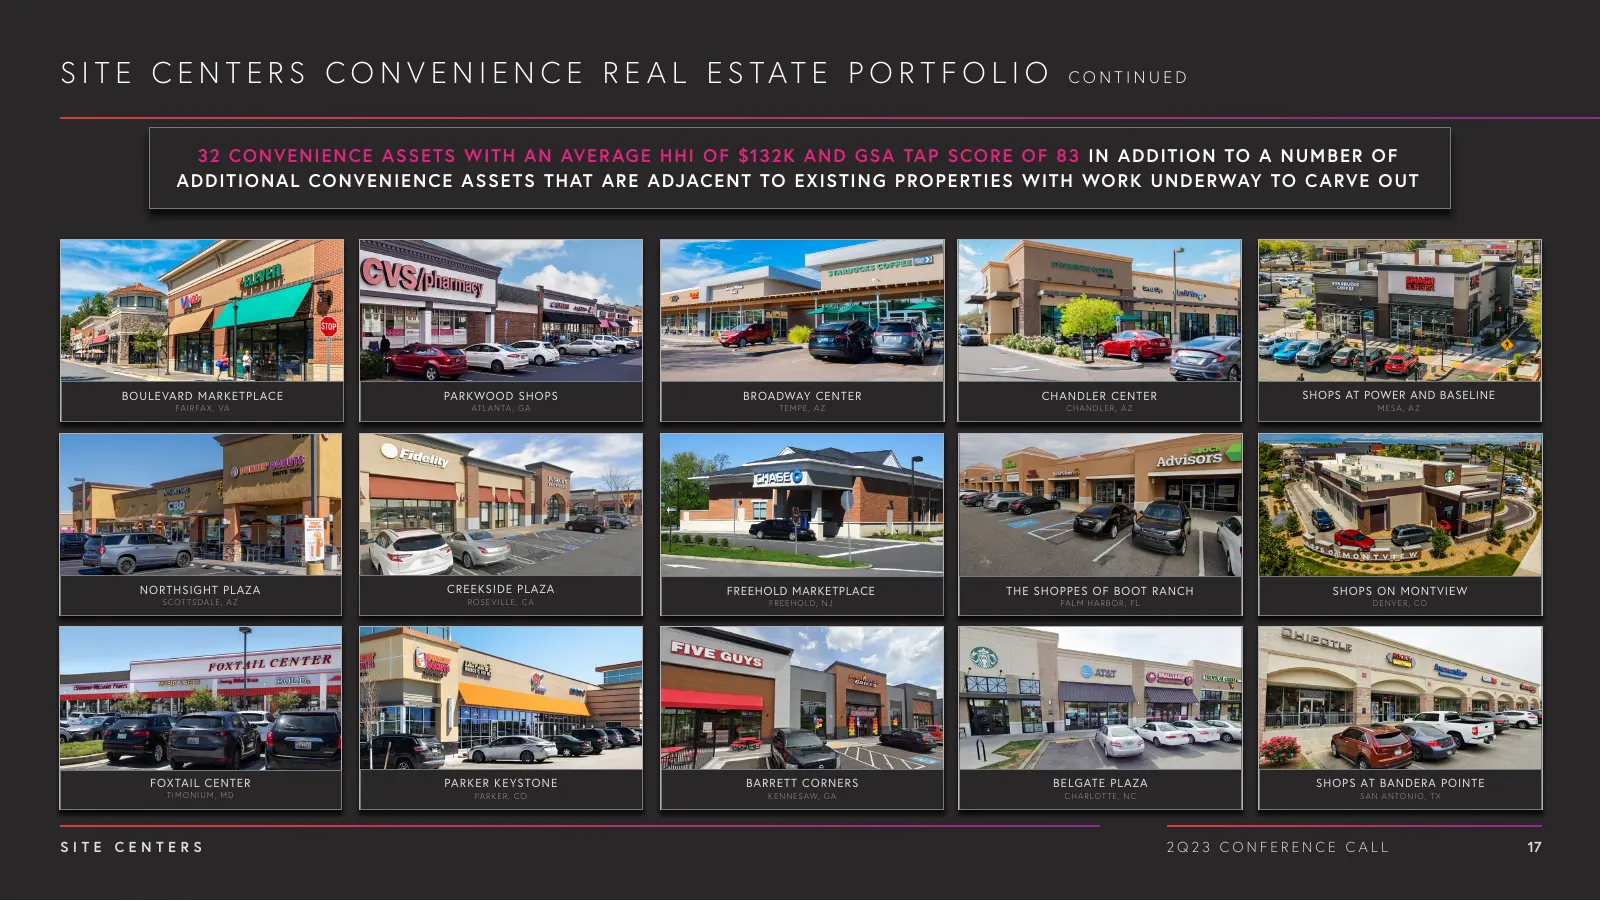
S I T E C E N T E R S C O N V E N I E N C E R E A L E S TAT E P O R T F O L I O CONTINUED 32 CO NVE NIE N CE ASSE TS WITH AN AVE R AG E H HI O F $132 K AN D GSA TAP SCO RE O F 83 IN AD DITIO N TO A N U M B E R O F AD DITIO NAL CO NVE NIE N CE ASSE TS THAT ARE ADJACE NT TO E XISTIN G PRO PE RTIES WIT

Slide 18: Appendix
Appendix SITE CENTERS 2Q23 CONFERENCE CALL 18
Slide 19: Non-GAAP Financial Measures and Other Operating Metrics – Definitions
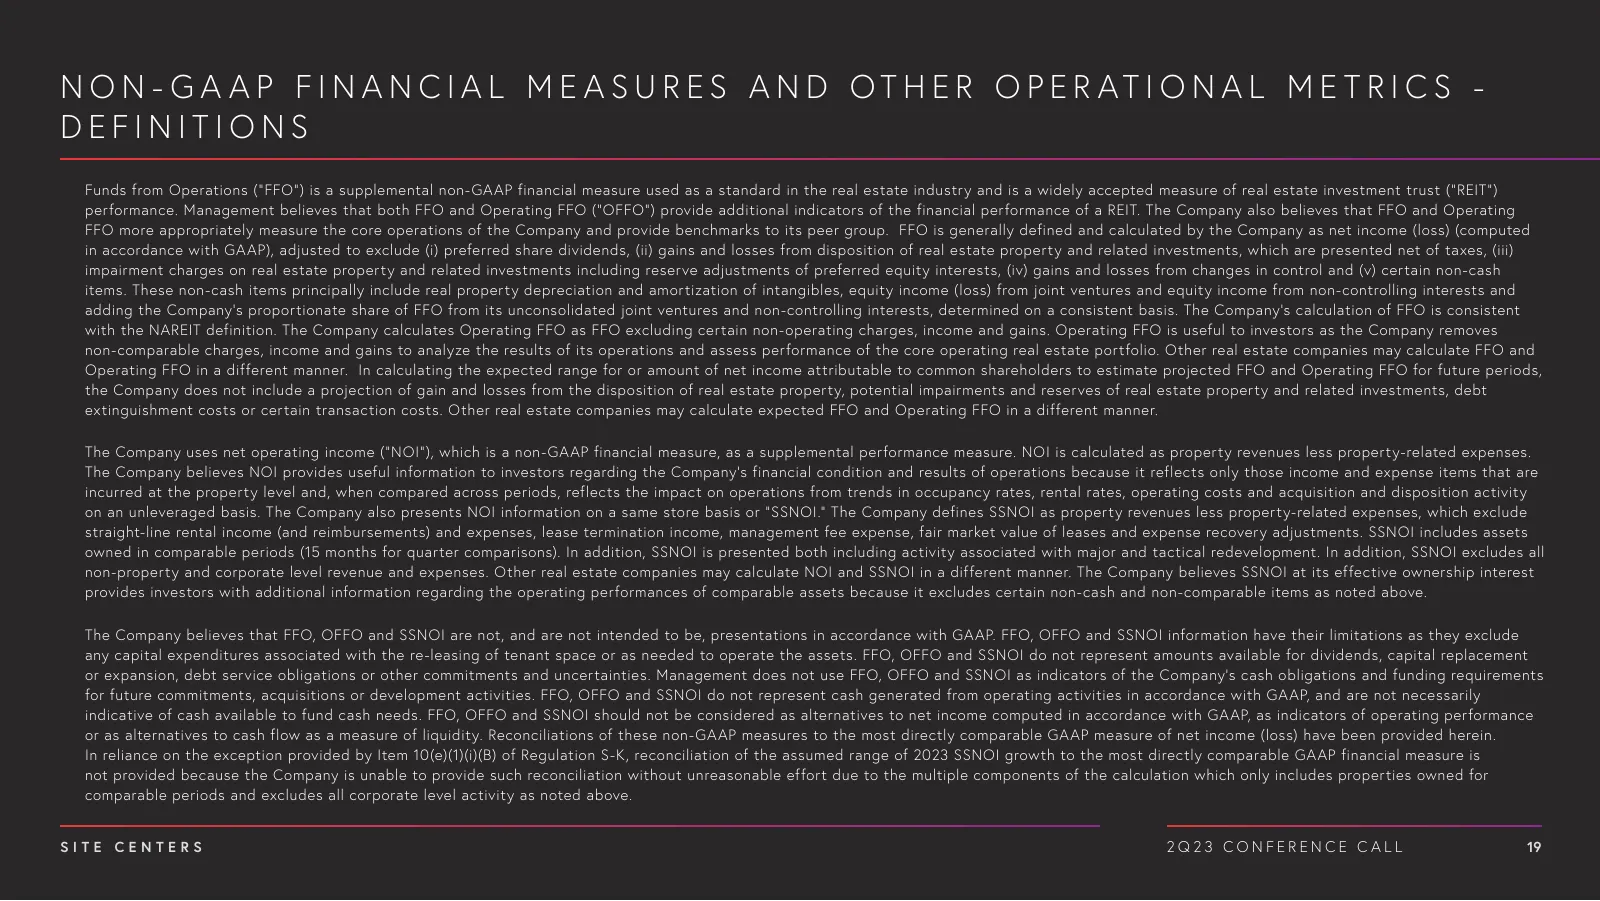
N O N - G A A P F I N A N C I A L M E A S U R E S A N D OT H E R O P E R AT I O N A L M E T R I C S - DEFINITIONS Funds from Operations (“FFO”) is a supplemental non-GAAP financial measure used as a standard in the real estate industry and is a widely accepted measure of real estate investment trust
Slide 20: Non-GAAP Financial Measures and Other Operating Metrics – Definitions Continued
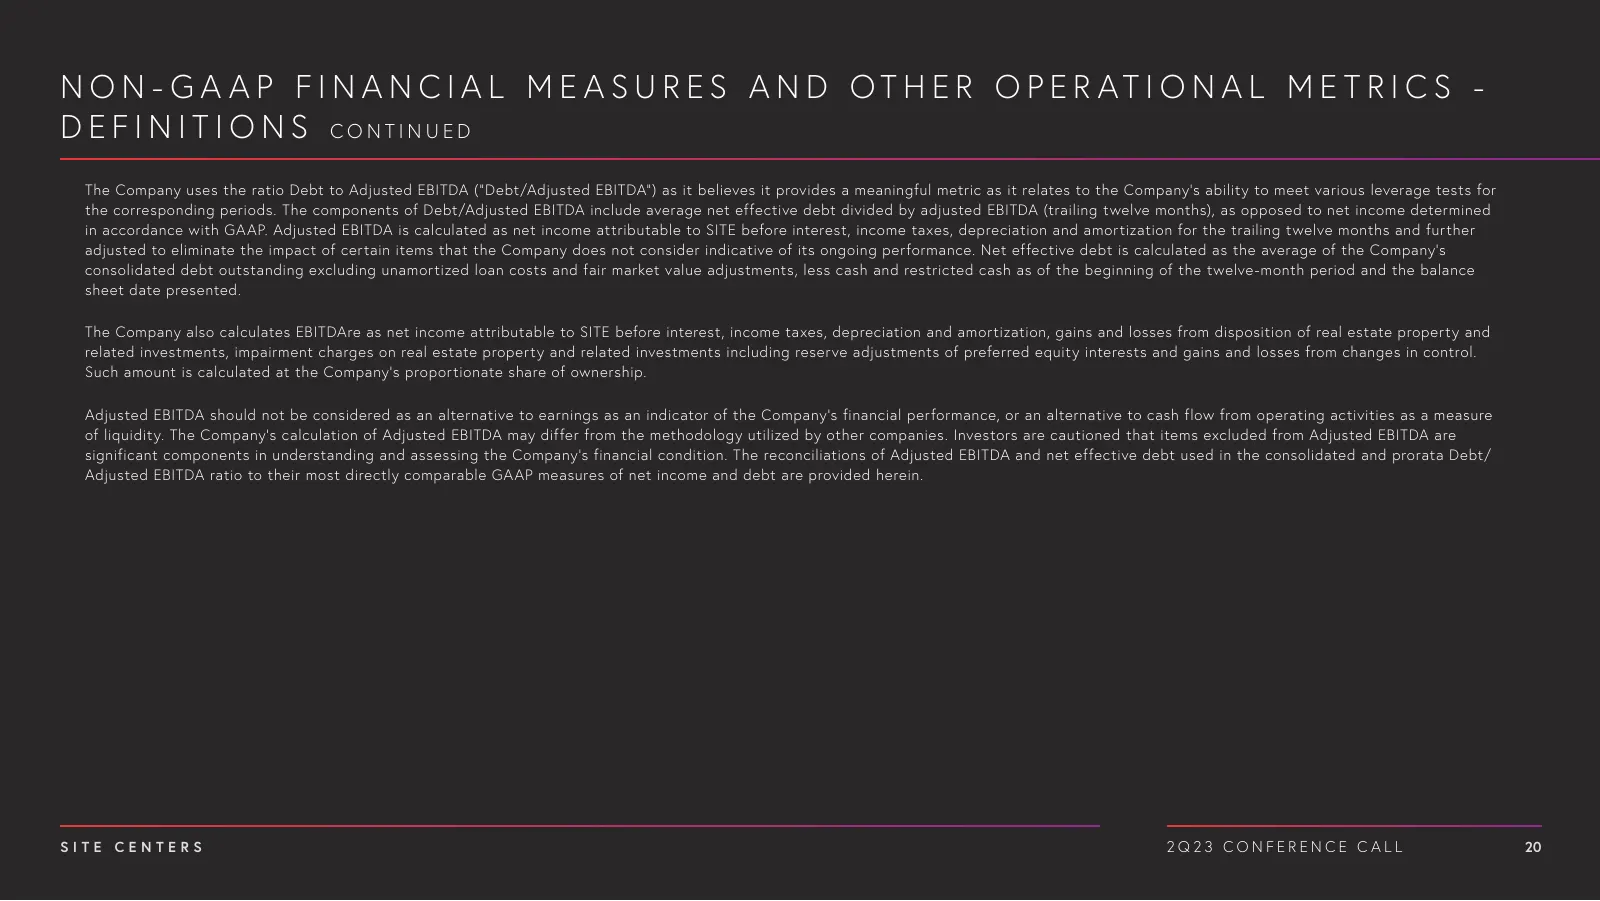
N O N - G A A P F I N A N C I A L M E A S U R E S A N D OT H E R O P E R AT I O N A L M E T R I C S - D E F I N I T I O N S CONTINUED The Company uses the ratio Debt to Adjusted EBITDA (“Debt/Adjusted EBITDA”) as it believes it provides a meaningful metric as it relates to the Company’s ability to m
Slide 21: Reconciliation: Net Income to FFO and Operating FFO
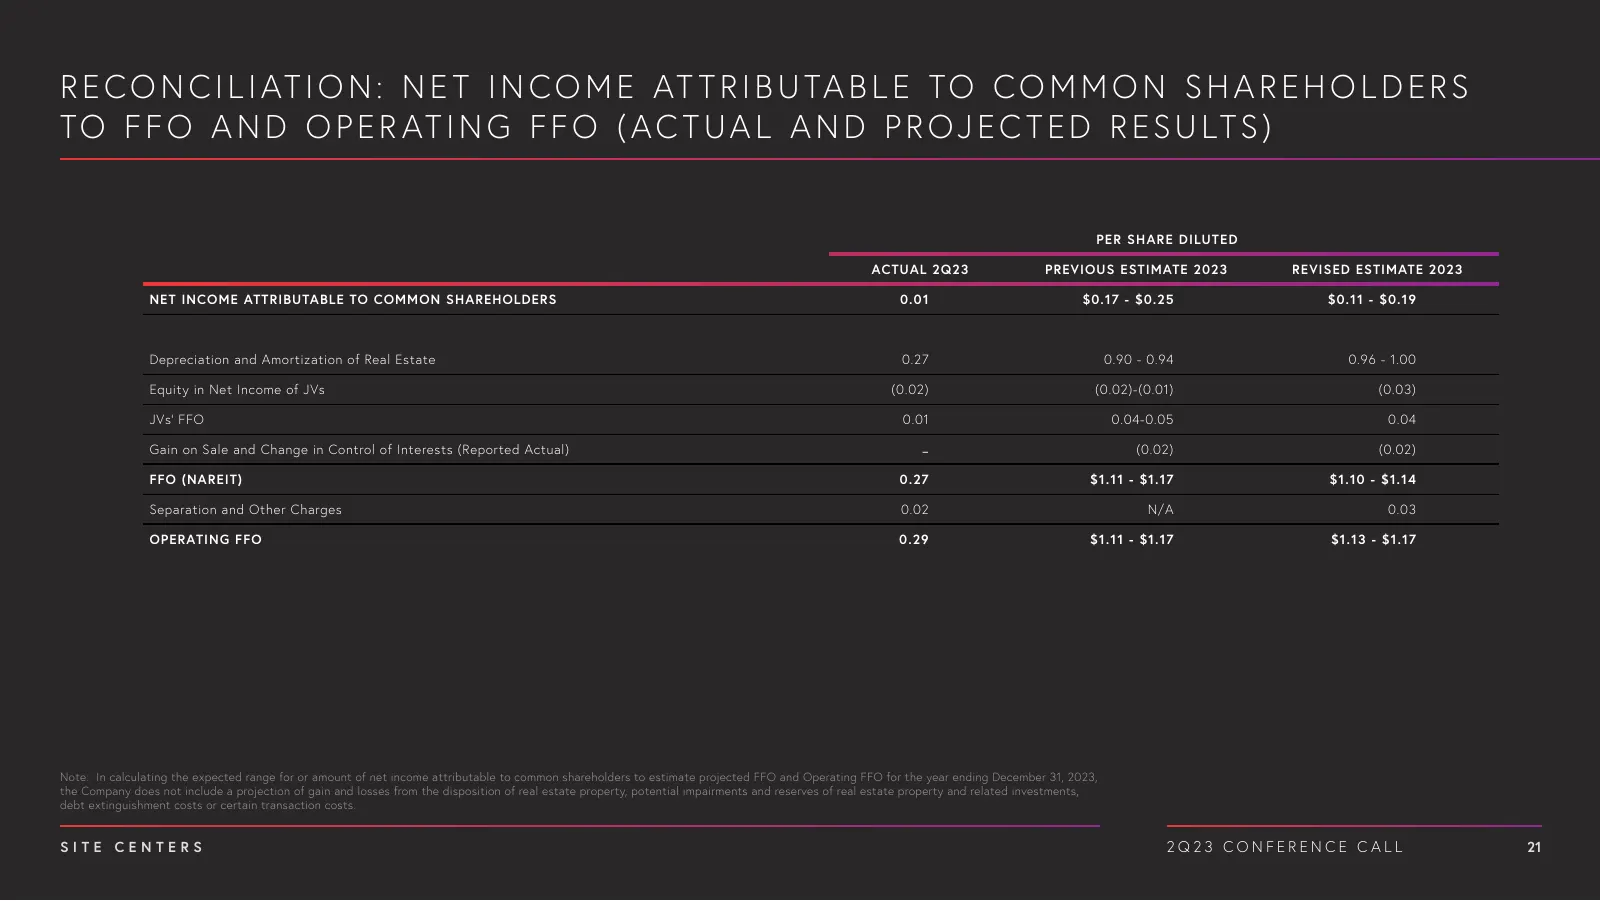
R E C O N C I L I AT I O N : N E T I N C O M E AT T R I B U TA B L E TO C O M M O N S H A R E H O L D E R S TO F F O A N D O P E R AT I N G F F O ( A C T U A L A N D P R O J E C T E D R E S U LT S ) PER SHARE DILUTED ACTUAL 2Q23 PREVIOUS ESTIMATE 2023 REVISED ESTIMATE 2023 NET INCOME ATTRIBUTABLE TO
Slide 22: Reconciliation: Net Income to Same Store NOI
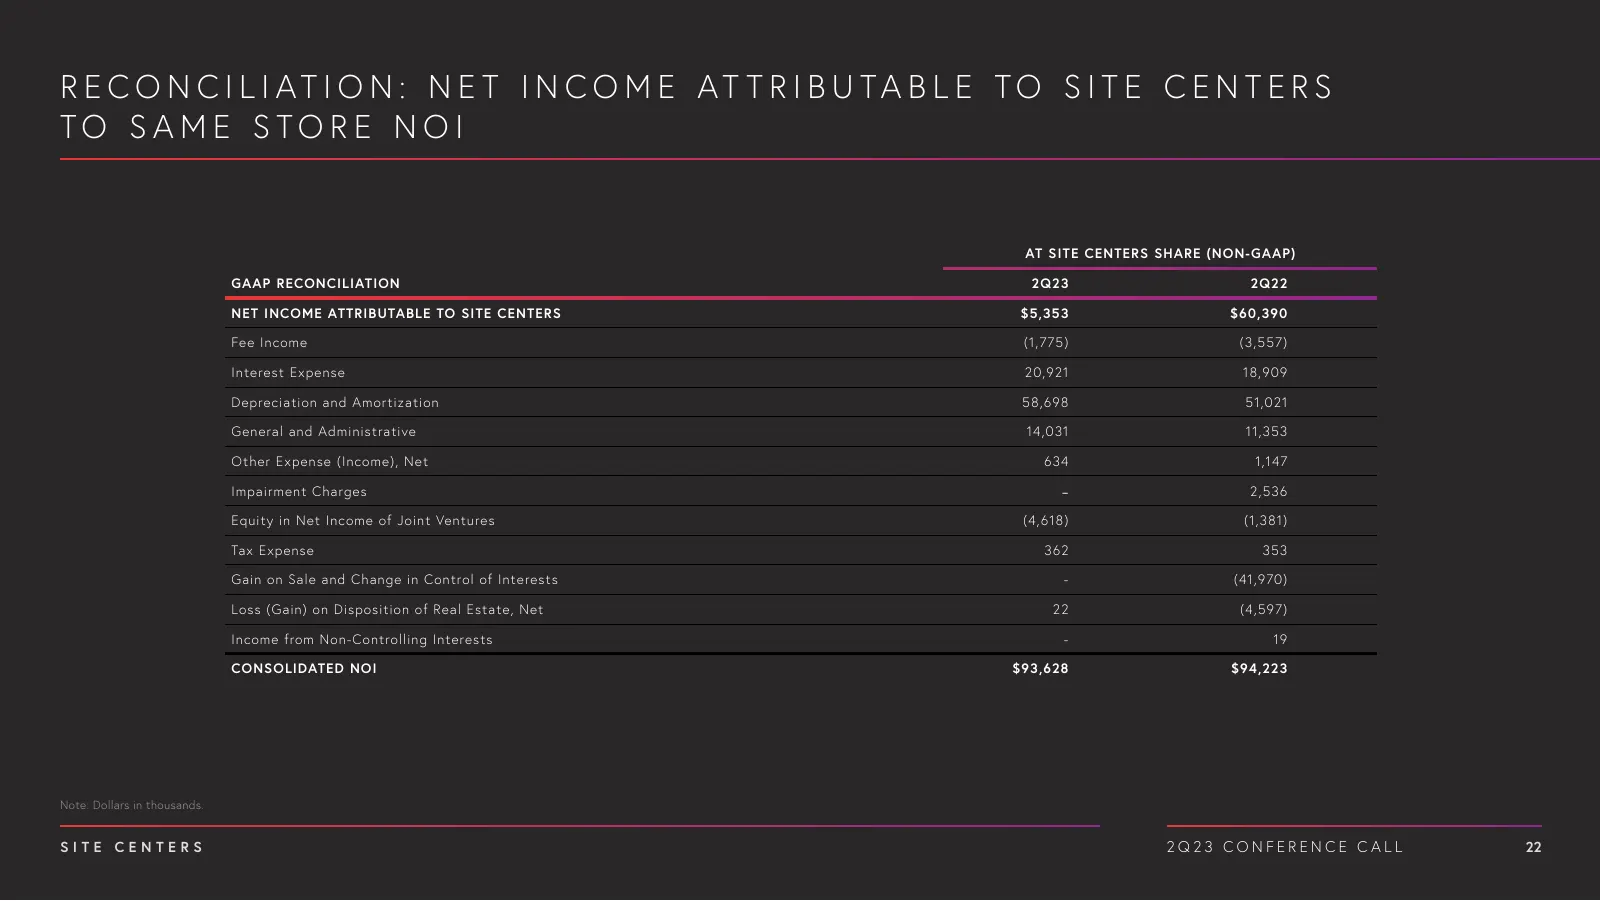
R E C O N C I L I AT I O N : N E T I N C O M E AT T R I B U TA B L E TO S I T E C E N T E R S TO SAM E STO RE N OI AT SITE CENTERS SHARE (NON-GAAP) GAAP RECONCILIATION 2Q23 2Q22 NET INCOME ATTRIBUTABLE TO SITE CENTERS $5,353 $60,390 Fee Income (1,775) (3,557) Interest Expense 20,921 18,909 Depreciat
Slide 23: Reconciliation: Net Income to Same Store NOI Continued
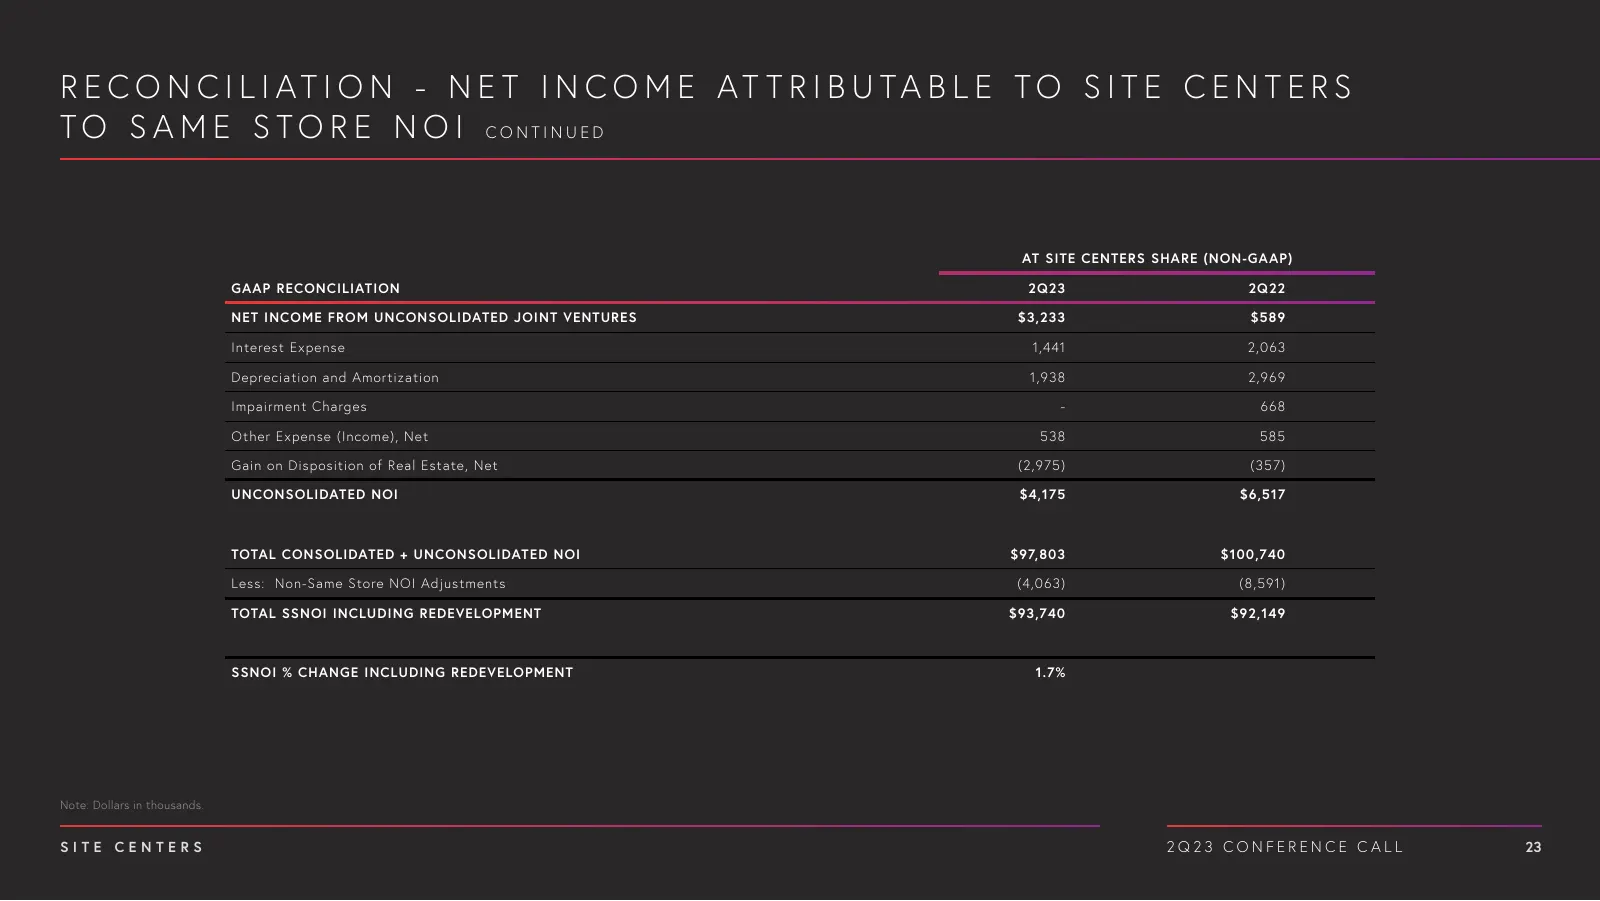
R E C O N C I L I AT I O N - N E T I N C O M E AT T R I B U TA B L E TO S I T E C E N T E R S T O S A M E S T O R E N O I CONTINUED AT SITE CENTERS SHARE (NON-GAAP) GAAP RECONCILIATION 2Q23 2Q22 NET INCOME FROM UNCONSOLIDATED JOINT VENTURES $3,233 $589 Interest Expense 1,441 2,063 Depreciation and A
Slide 24: Reconciliation: Debt/Adjusted EBITDA
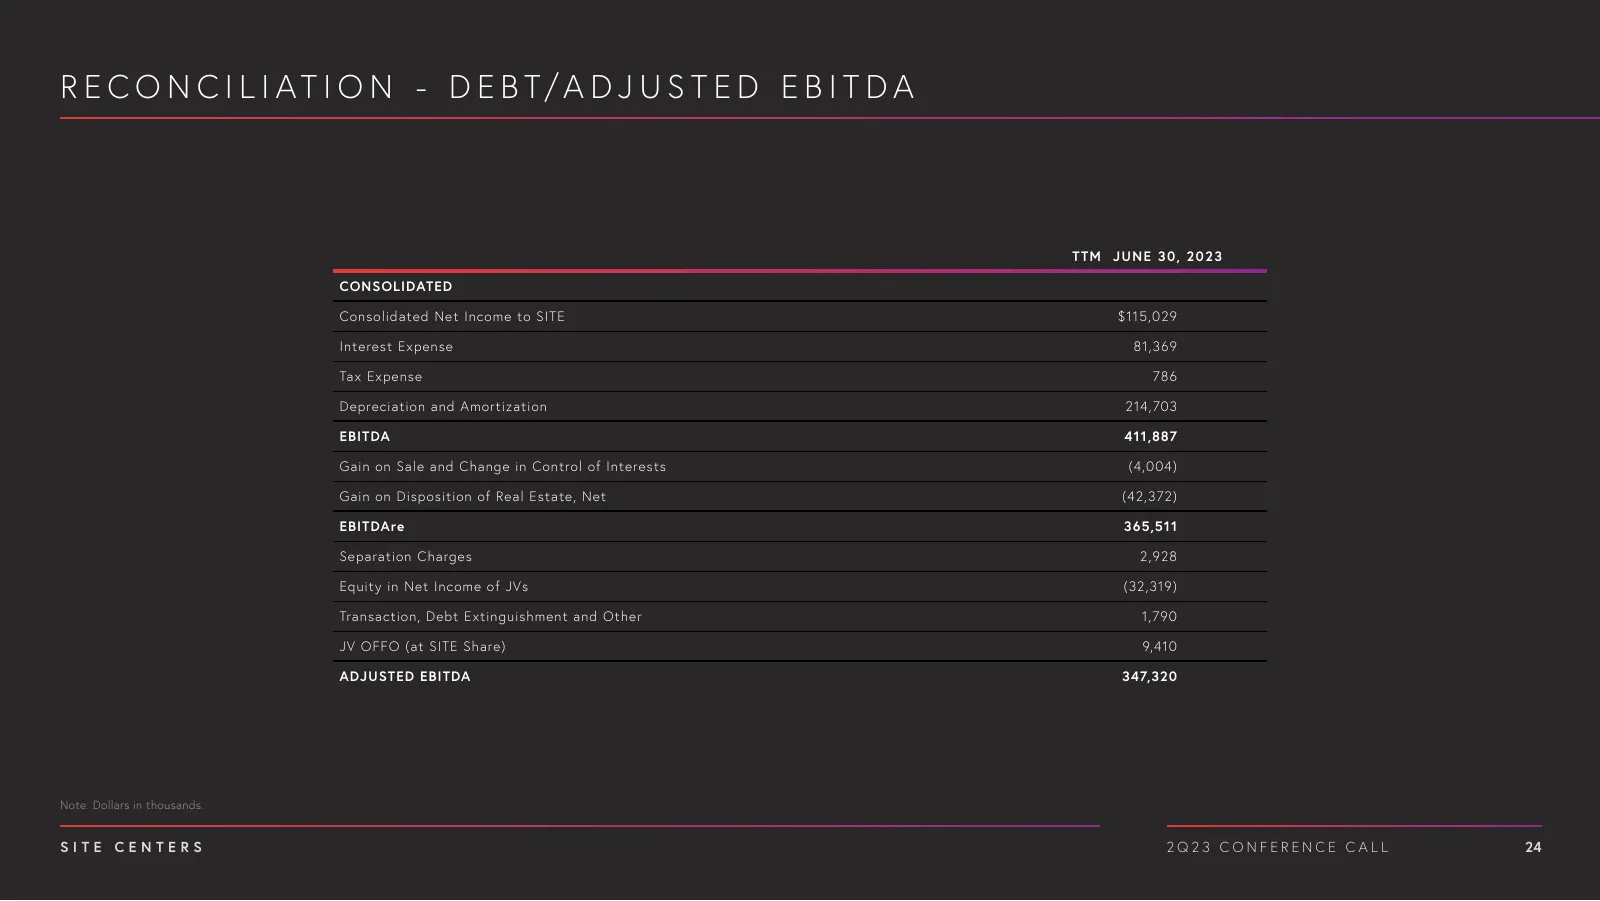
R E C O N C I L I A T I O N - D E B T/ A D J U S T E D E B I T D A T T M J UNE 3 0 , 20 23 CONSOLIDATED Consolidated Net Income to SITE $115,029 Interest Expense 81,369 Tax Expense 786 Depreciation and Amortization 214,703 EBITDA 411,887 Gain on Sale and Change in Control of Interests (4,004) Gain o
Slide 25: Reconciliation: Debt/Adjusted EBITDA Continued
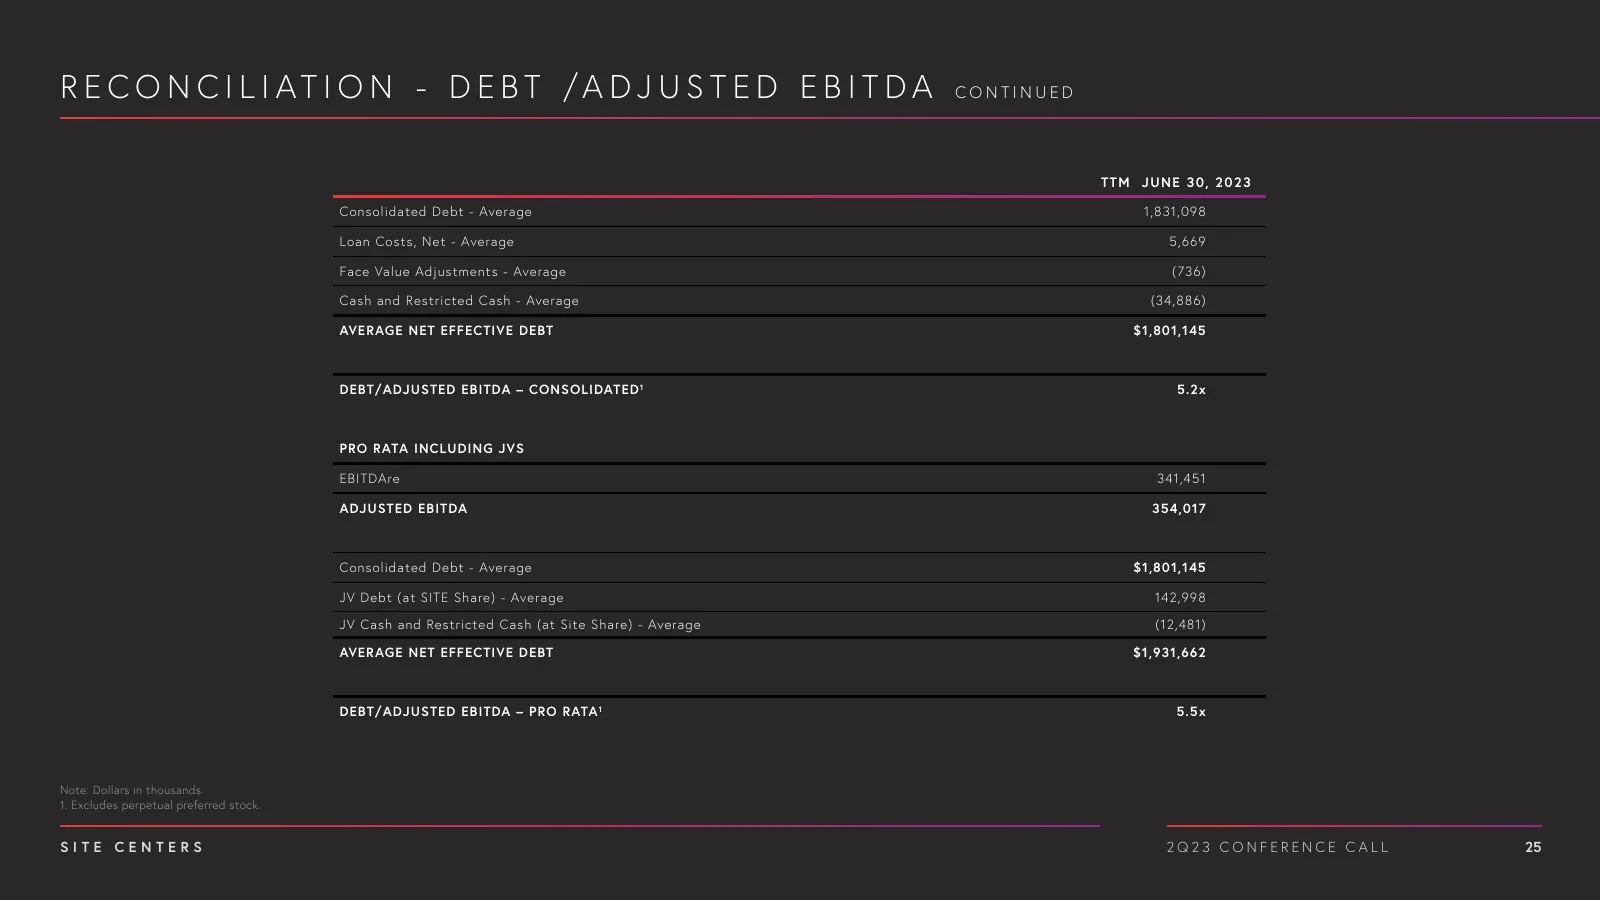
R E C O N C I L I A T I O N - D E B T /A D J U S T E D E B I T D A CONTINUED T T M J UNE 3 0 , 20 23 Consolidated Debt - Average 1,831,098 Loan Costs, Net - Average 5,669 Face Value Adjustments - Average (736) Cash and Restricted Cash - Average (34,886) AVERAGE NET EFFECTIVE DEBT $1,801,145 DEBT/ADJ
Source: Internet Archive copy of images.sitecenters.com
More decks from SITE Centers Corp.
 Merger or Acquisition (September 2024)32 slides · Sep 17, 2024
 Q2 2024 Earnings Presentation39 slides · Jul 30, 2024
 Q1 2024 Earnings Presentation28 slides · Apr 30, 2024
 Citi Global Property CEO Conference 202442 slides · March 2024
 Q4 2023 Earnings Presentation29 slides · Feb 13, 2024
 Merger or Acquisition (November 2023)42 slides · Nov 1, 2023