Boardwalk Pipeline Partners LP
Boardwalk Pipeline Partners LP — NAPTP 2014 MLP Annual Investor Conference
33 slides from Boardwalk Pipeline Partners LP's conference presentation, May 20, 2014
Slide 1: NAPTP 2014 MLP Annual Investor Conference
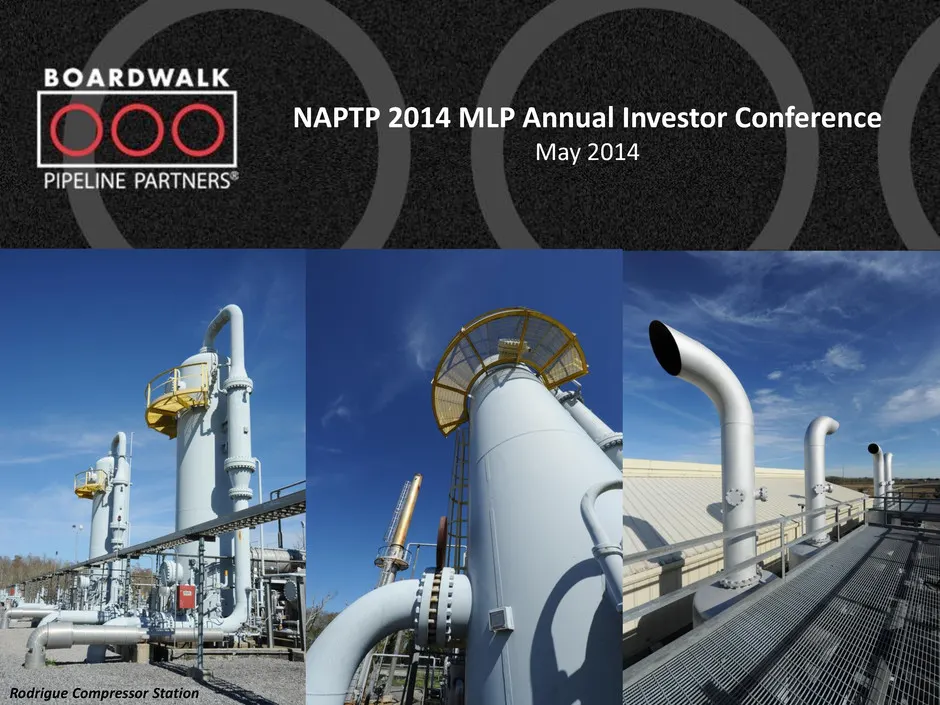
1 NAPTP 2014 MLP Annual Investor Conference May 2014 Rodrigue Compressor Station
Slide 2: Important Information
2 Important Information Forward-looking statements disclosure Statements made at this conference or in the materials distributed in conjunction with this conference that contain "forward-looking statements" include, but are not limited to, statements using the words “believe”, “expect”, “plan”, “int
Slide 3: Boardwalk Summary
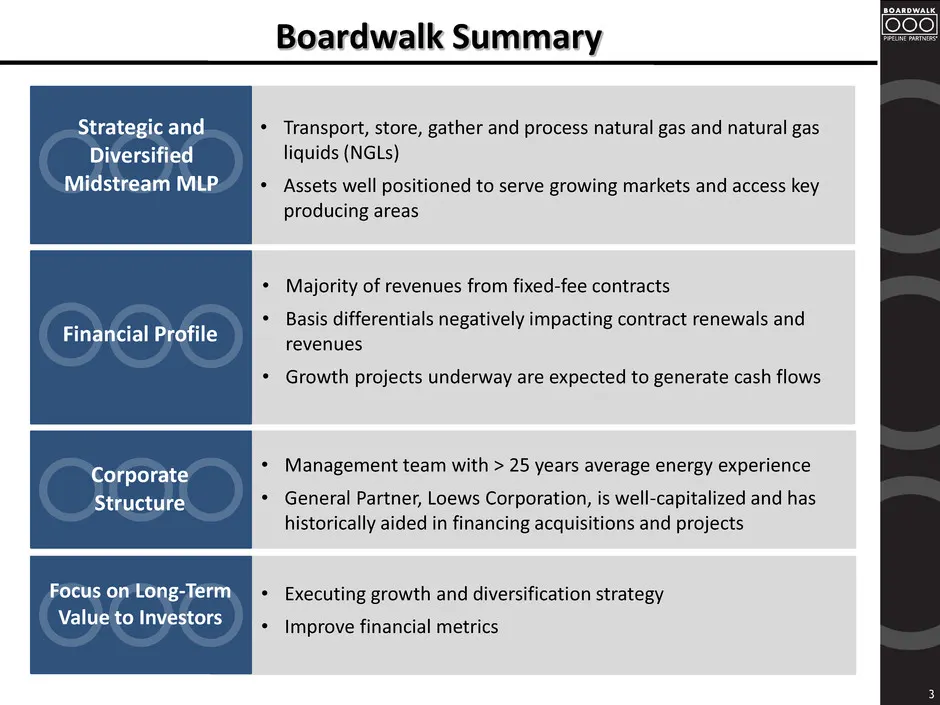
3 • Transport, store, gather and process natural gas and natural gas liquids (NGLs) • Assets well positioned to serve growing markets and access key producing areas Strategic and Diversified Midstream MLP • Executing growth and diversification strategy • Improve financial metrics Focus on Long-Term
Slide 4: Boardwalk Strategy
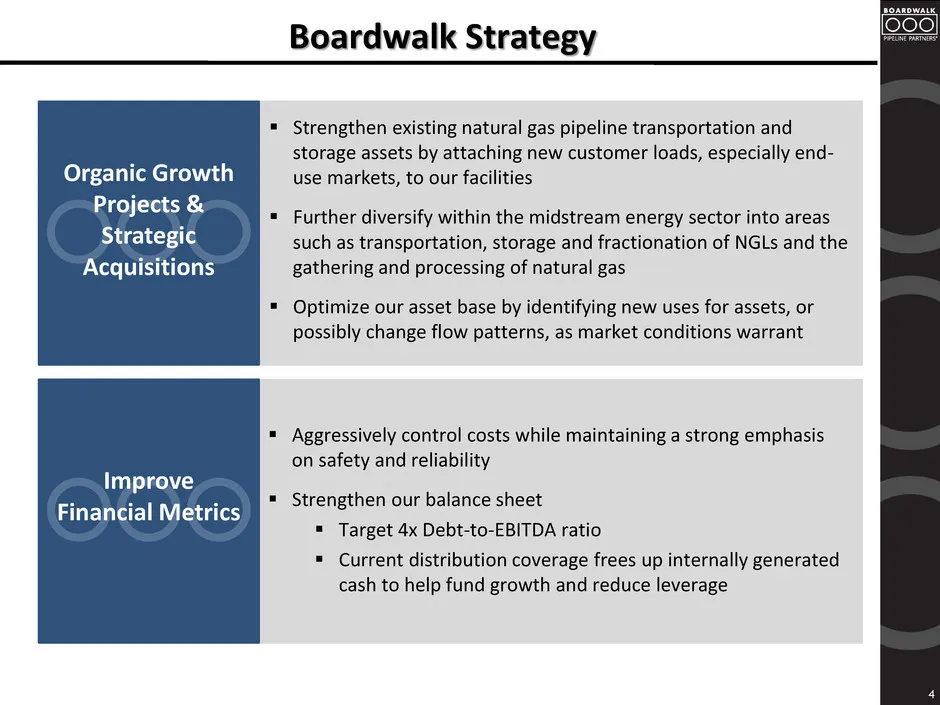
Boardwalk Strategy 4 Strengthen existing natural gas pipeline transportation and storage assets by attaching new customer loads, especially end- use markets, to our facilities Further diversify within the midstream energy sector into areas such as transportation, storage and fractionation of NGL
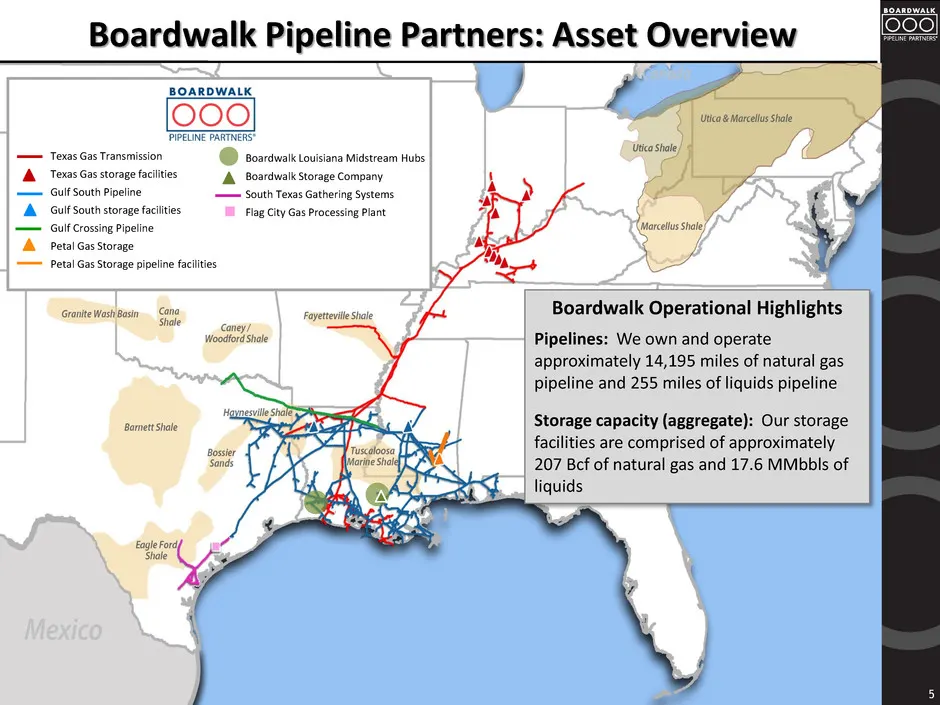
Slide 5: Boardwalk Pipeline Partners: Asset Overview
5 Boardwalk Pipeline Partners: Asset Overview Texas Gas Transmission Texas Gas storage facilities Gulf South Pipeline Gulf South storage facilities Gulf Crossing Pipeline Petal Gas Storage Petal Gas Storage pipeline facilities Boardwalk Louisiana Midstream Hubs Boardwalk Storage Company South Texas
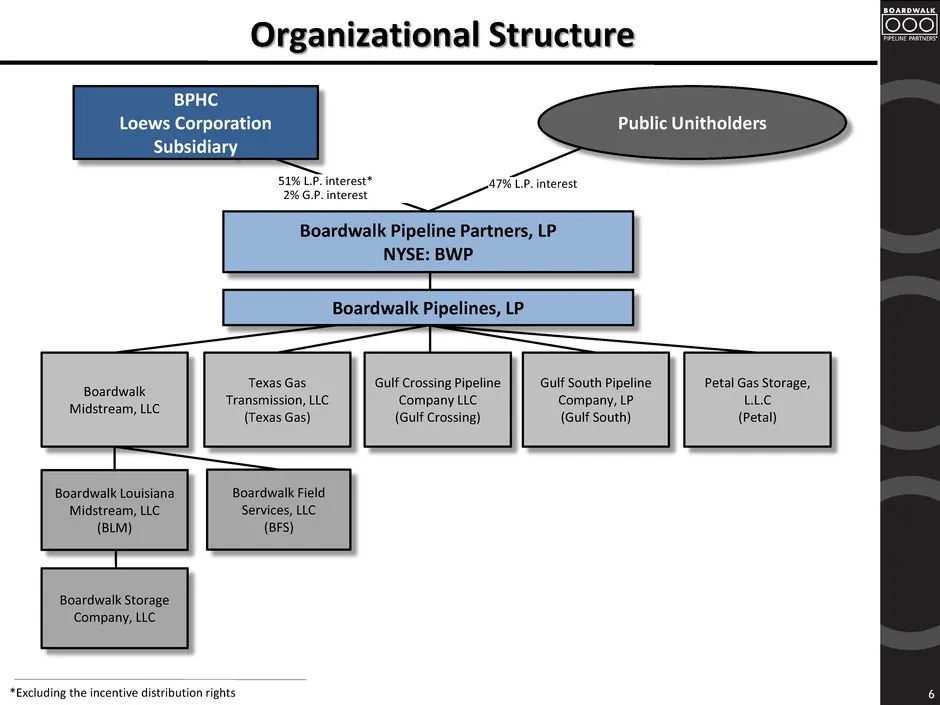
Slide 6: Organizational Structure
6 Organizational Structure *Excluding the incentive distribution rights Boardwalk Midstream, LLC 51% L.P. interest* 2% G.P. interest 47% L.P. interest BPHC Loews Corporation Subsidiary Boardwalk Pipeline Partners, LP NYSE: BWP Public Unitholders Texas Gas Transmission, LLC (Texas Gas) Gulf Crossing
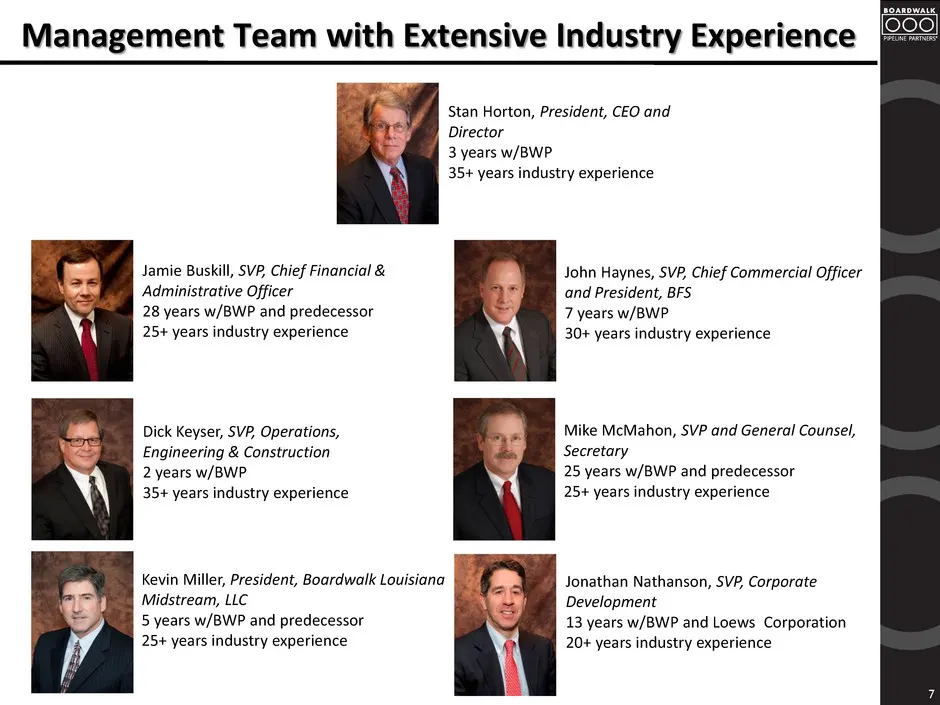
Slide 7: Management Team with Extensive Industry Experience
Management Team with Extensive Industry Experience Stan Horton, President, CEO and Director 3 years w/BWP 35+ years industry experience Jamie Buskill, SVP, Chief Financial & Administrative Officer 28 years w/BWP and predecessor 25+ years industry experience John Haynes, SVP, Chief Commercial Officer
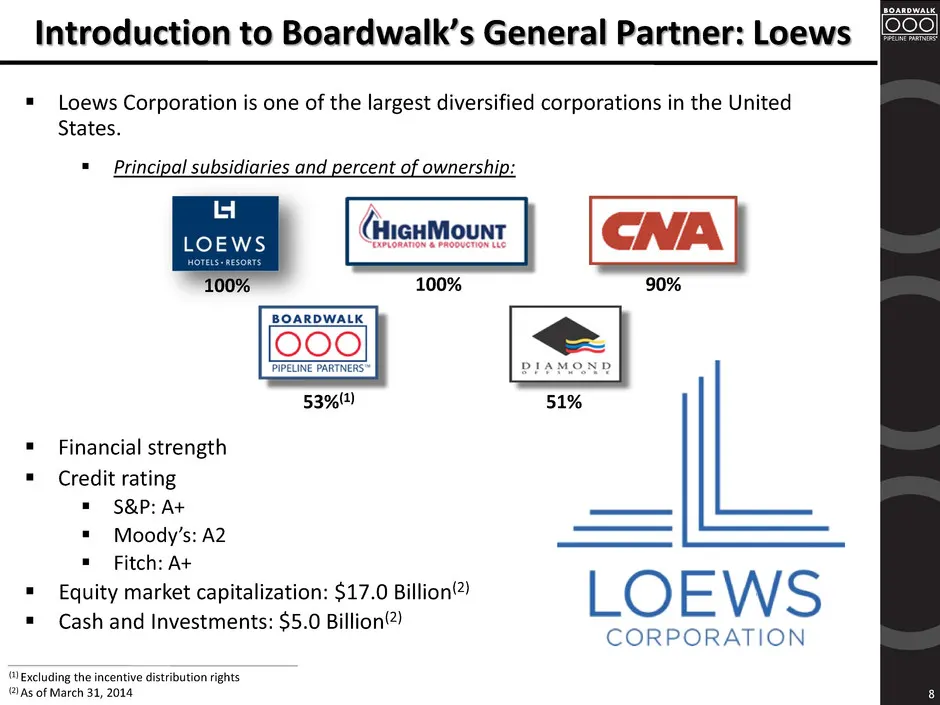
Slide 8: Introduction to Boardwalk's General Partner: Loews
(1) Excluding the incentive distribution rights (2) As of March 31, 2014 Loews Corporation is one of the largest diversified corporations in the United States. Principal subsidiaries and percent of ownership: Financial strength Credit rating S&P: A+ Moody’s: A2 Fitch: A+ Equity marke
Slide 9: Market Fundamentals
BOARDWALK Market Fundamentals PIPELINE PARTNERS®
Slide 10: Key Shale Gas Supplies Near our Footprint
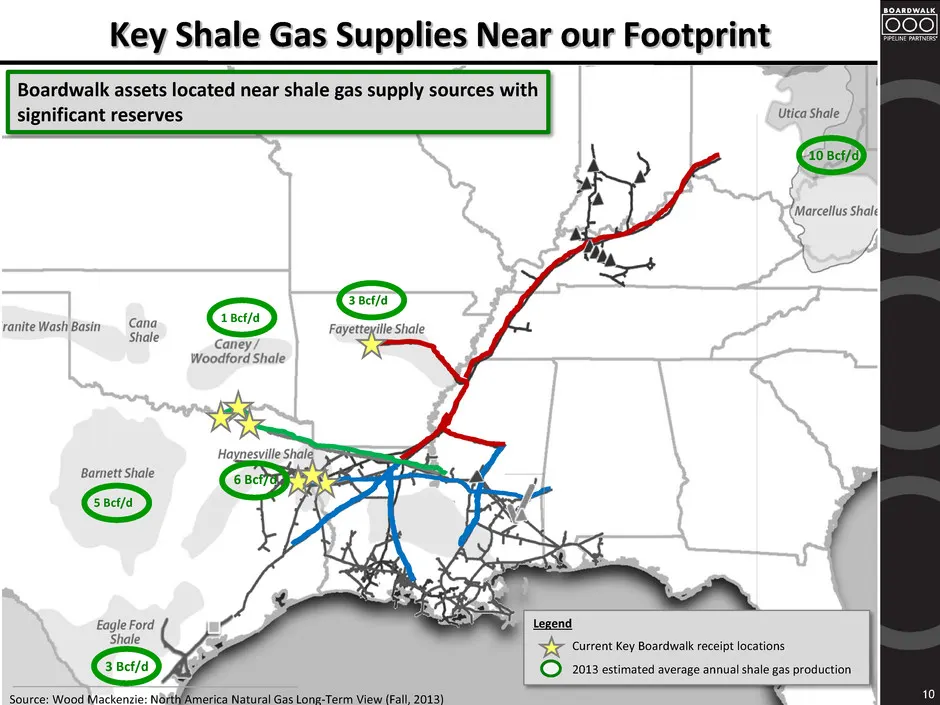
10 Key Shale Gas Supplies Near our Footprint 3 Bcf/d 1 Bcf/d Boardwalk assets located near shale gas supply sources with significant reserves 5 Bcf/d 3 Bcf/d 6 Bcf/d 10 Bcf/d Source: Wood Mackenzie: North America Natural Gas Long-Term View (Fall, 2013) Legend Current Key Boardwalk receipt locations
Slide 11: 2020 Forecasted Growth in Shale Gas Supply
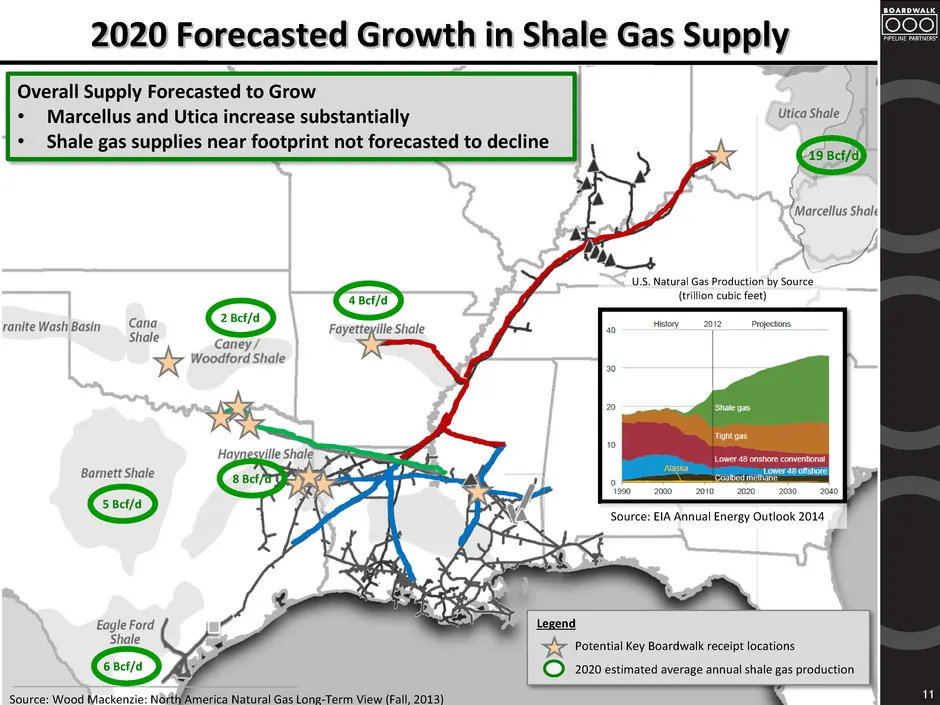
11 2020 Forecasted Growth in Shale Gas Supply 4 Bcf/d 2 Bcf/d 19 Bcf/d Source: Wood Mackenzie: North America Natural Gas Long-Term View (Fall, 2013) Legend Potential Key Boardwalk receipt locations 2020 estimated average annual shale gas production 5 Bcf/d 6 Bcf/d 8 Bcf/d Overall Supply Forecasted t
Slide 12: Deliveries to Interconnects Currently Comprise Majority of Revenues
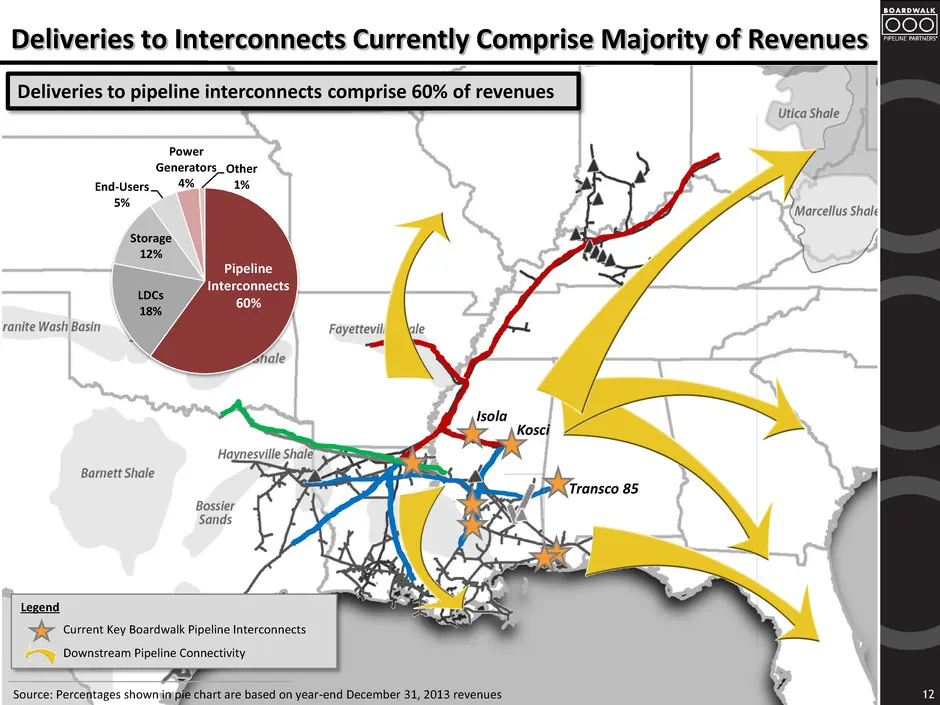
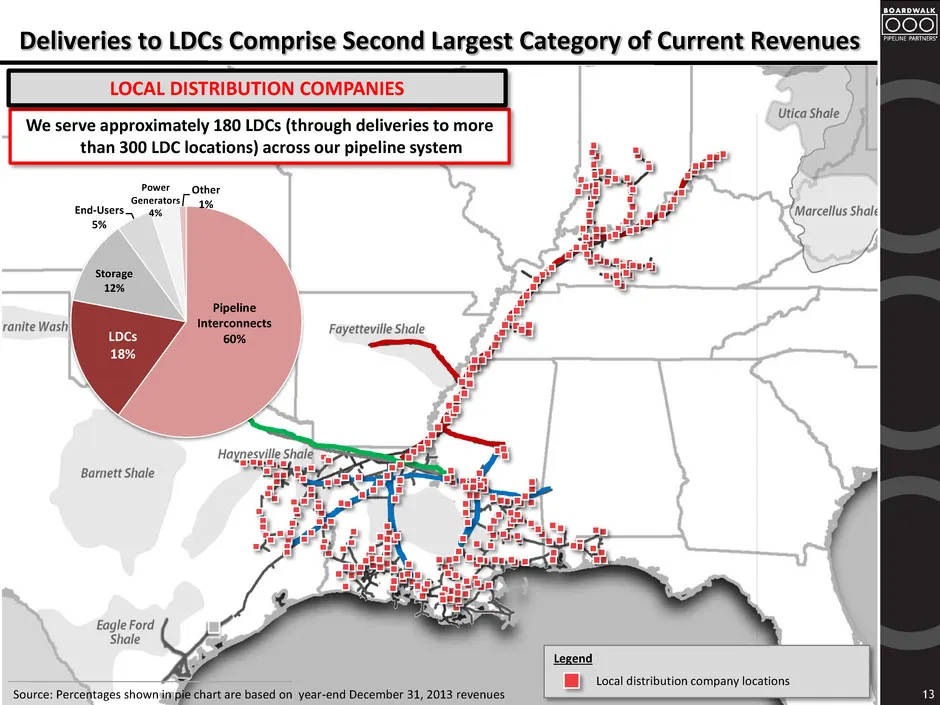
12 Deliveries to Interconnects Currently Comprise Majority of Revenues Deliveries to pipeline interconnects comprise 60% of revenues LDCs 18% Storage 12% End-Users 5% Power Generators 4% Other 1% Pipeline Interconnects 60% Source: Percentages shown in pie chart are based on year-end December 31, 201
Slide 13: Deliveries to LDCs Comprise Second Largest Category of Revenues
13 Deliveries to LDCs Comprise Second Largest Category of Current Revenues We serve approximately 180 LDCs (through deliveries to more than 300 LDC locations) across our pipeline system LOCAL DISTRIBUTION COMPANIES LDCs 18% Storage 12% End-Users 5% Power Generators 4% Other 1% Source: Percentages sh
Slide 14: Opportunities to Attach to New Customer Loads: LNG Exports
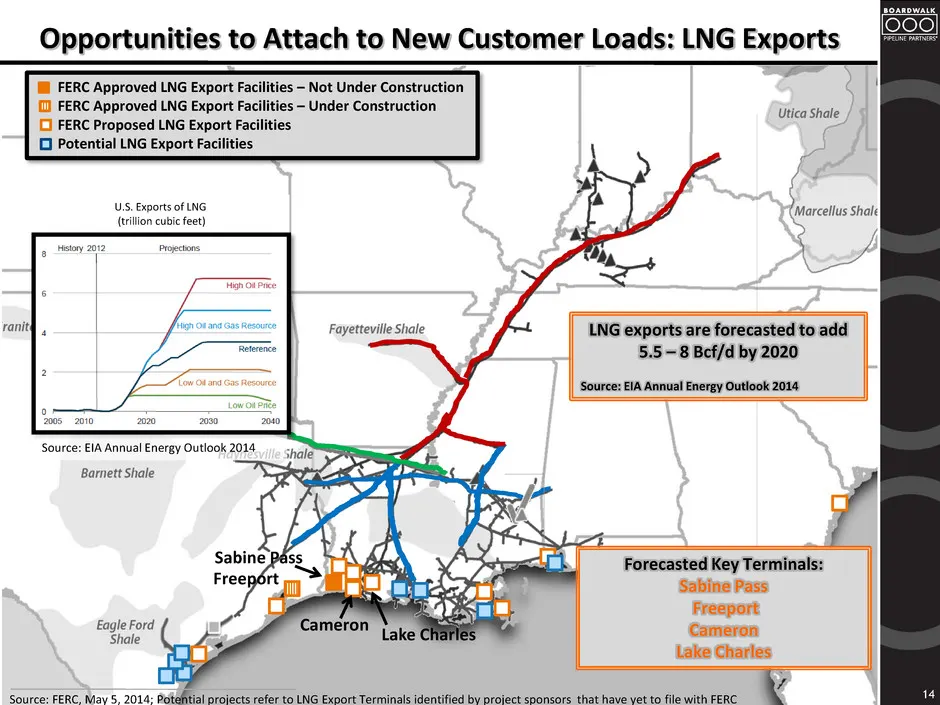
14 Opportunities to Attach to New Customer Loads: LNG Exports FERC Approved LNG Export Facilities – Not Under Construction FERC Approved LNG Export Facilities – Under Construction FERC Proposed LNG Export Facilities Potential LNG Export Facilities LNG exports are forecasted to add 5.5 – 8 Bcf/d by 2
Slide 15: Opportunities to Attach to New Customer Loads: Industrial Markets
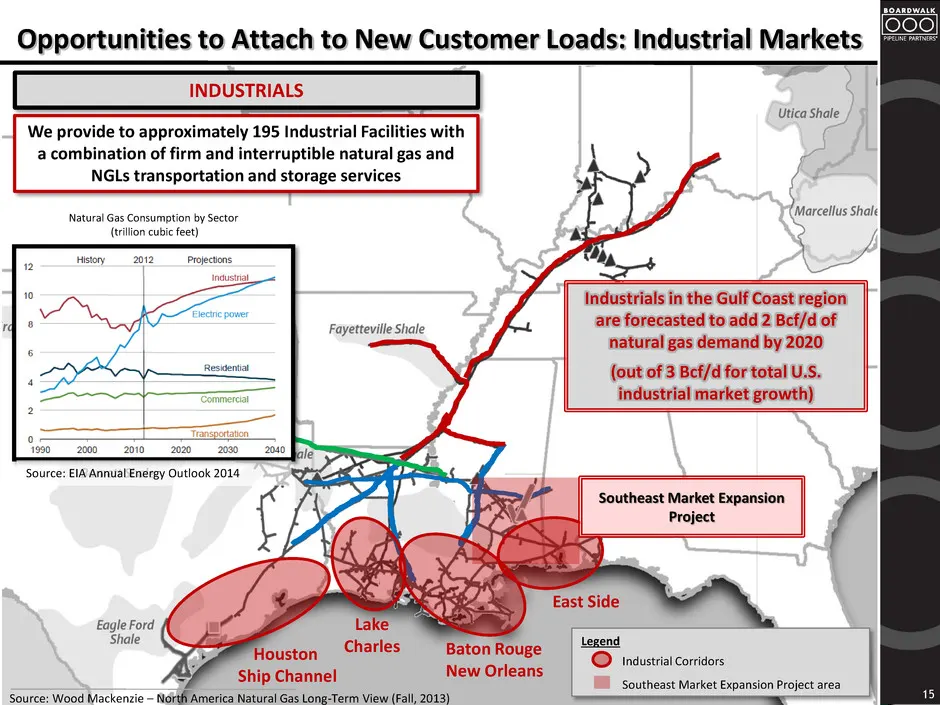
15 Opportunities to Attach to New Customer Loads: Industrial Markets We provide to approximately 195 Industrial Facilities with a combination of firm and interruptible natural gas and NGLs transportation and storage services INDUSTRIALS Source: Wood Mackenzie – North America Natural Gas Long-Term Vi
Slide 16: Opportunities to Attach to New Customer Loads: Power Plants
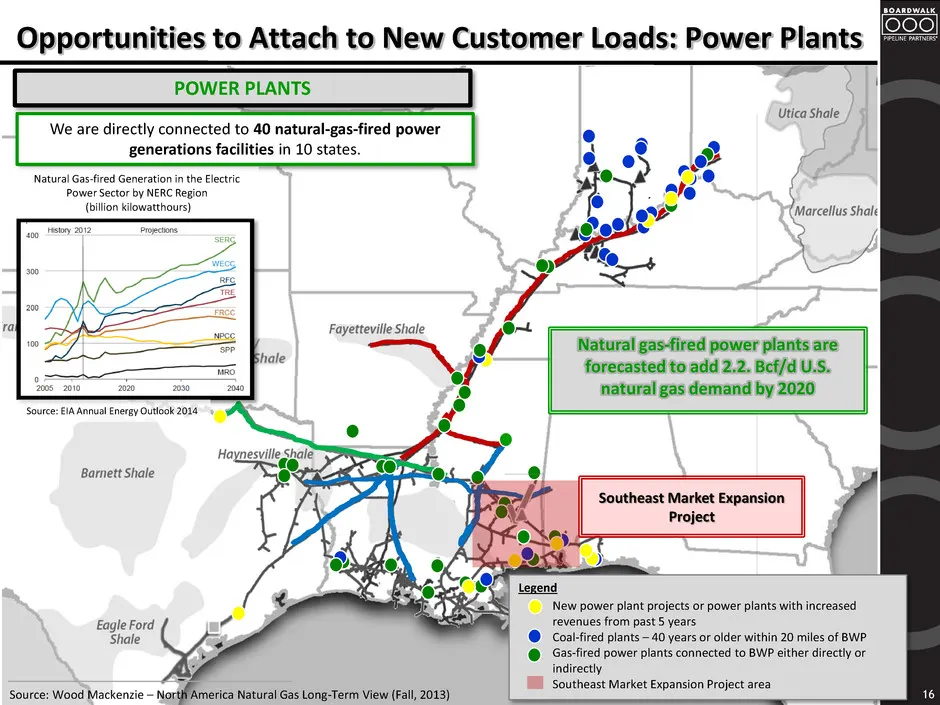
16 Opportunities to Attach to New Customer Loads: Power Plants We are directly connected to 40 natural-gas-fired power generations facilities in 10 states. POWER PLANTS Natural gas-fired power plants are forecasted to add 2.2. Bcf/d U.S. natural gas demand by 2020 Source: Wood Mackenzie – North Amer
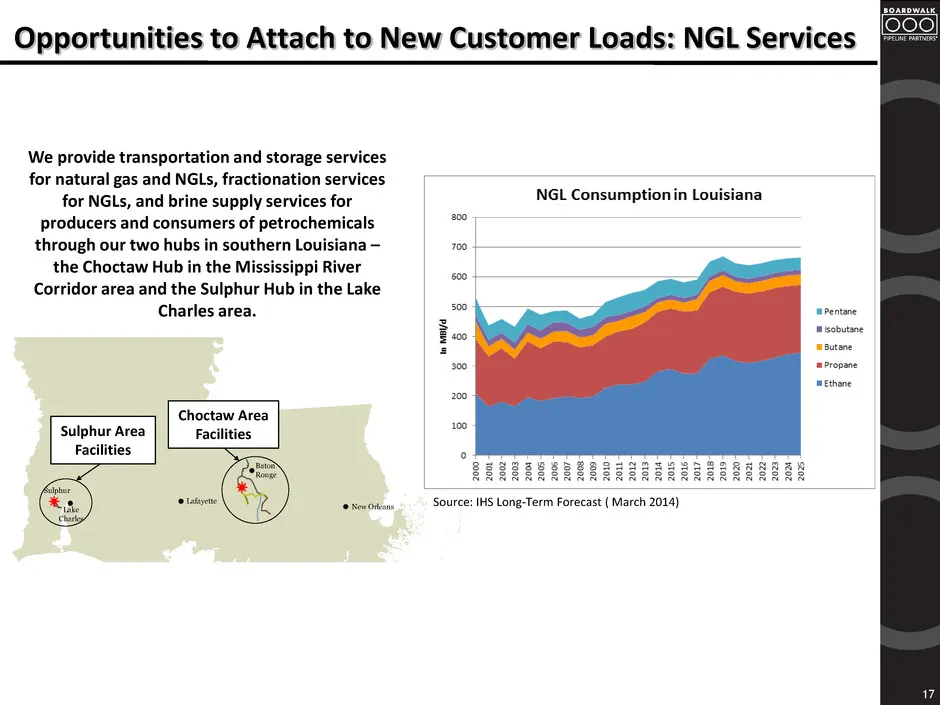
Slide 17: Opportunities to Attach to New Customer Loads: NGL Services
Opportunities to Attach to New Customer Loads: NGL Services 17 Lake Charles Lafayette New Orleans Sulphur Choctaw Area Facilities Sulphur Area Facilities Ethylene Pipeline Propylene Pipeline Natural Gas Pipeline Brine Pipeline E/P Pipeline PL Midstream Hubs Baton Rouge Sulphur Area Facilities Chocta
Slide 18: Growth Projects
BOARDWALK Growth Projects PIPELINE PARTNERS®
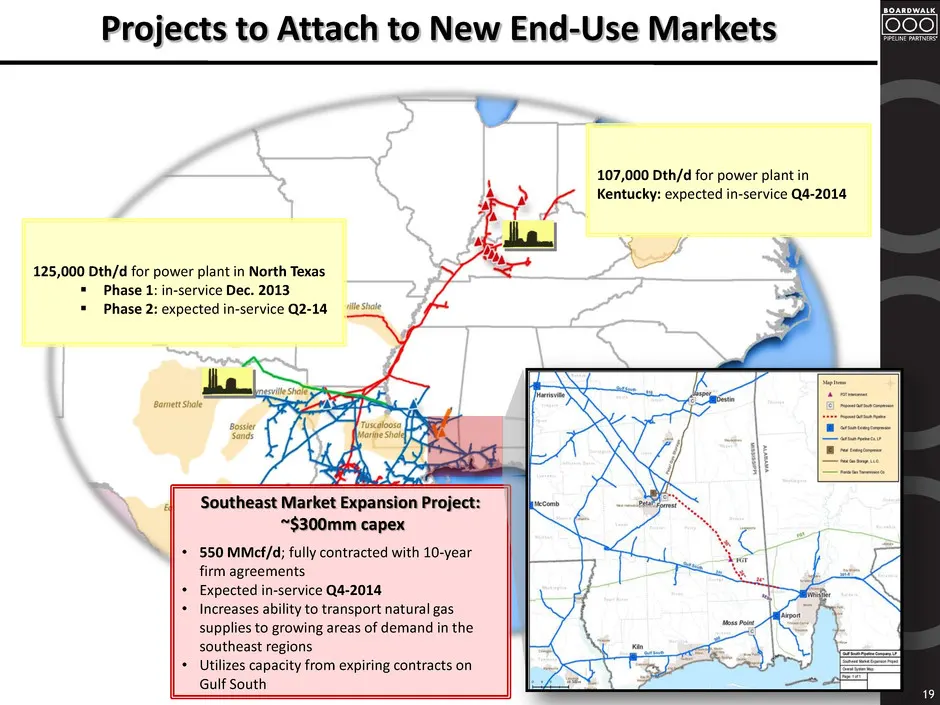
Slide 19: Southeast Market Expansion Project
19 Southeast Market Expansion Project: ~$300mm capex • 550 MMcf/d; fully contracted with 10-year firm agreements • Expected in-service Q4-2014 • Increases ability to transport natural gas supplies to growing areas of demand in the southeast regions • Utilizes capacity from expiring contracts on Gulf
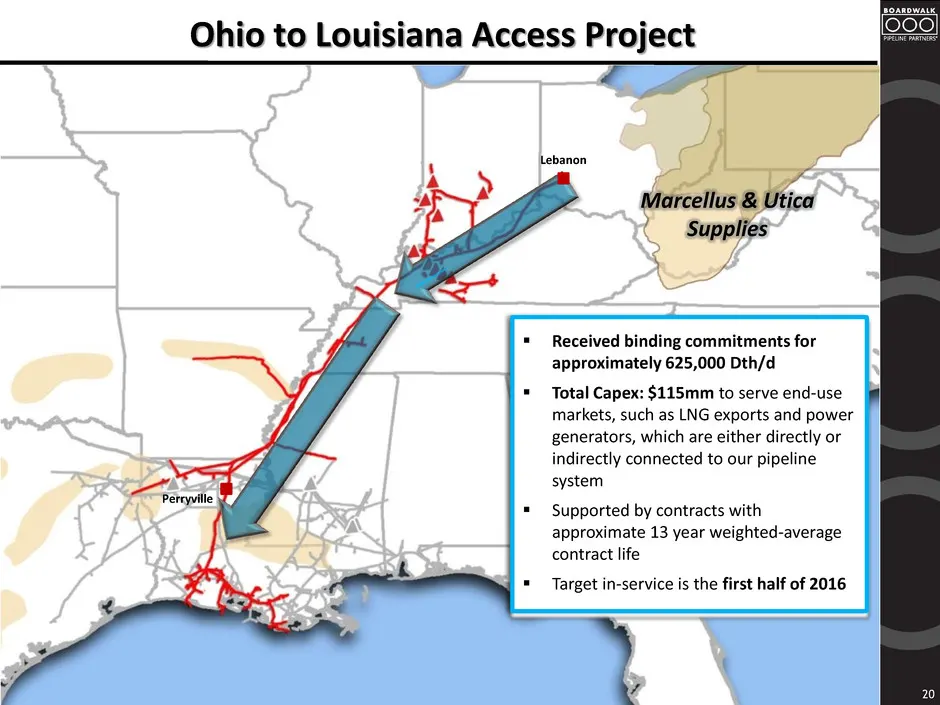
Slide 20: Ohio to Louisiana Access Project
Ohio to Louisiana Access Project Marcellus & Utica Supplies 20 Received binding commitments for approximately 625,000 Dth/d Total Capex: $115mm to serve end-use markets, such as LNG exports and power generators, which are either directly or indirectly connected to our pipeline system Supported
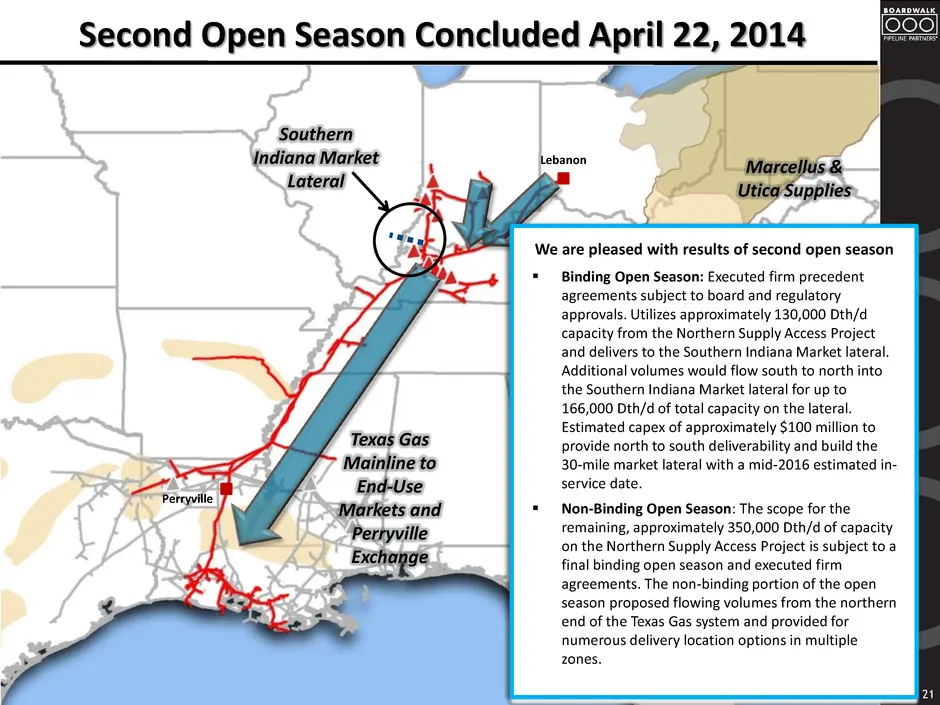
Slide 21: Second Open Season Concluded April 22, 2014
Second Open Season Concluded April 22, 2014 Marcellus & Utica Supplies Texas Gas Mainline to End-Use Markets and Perryville Exchange 21 Lebanon Perryville We are pleased with results of second open season Binding Open Season: Executed firm precedent agreements subject to board and regulatory appro
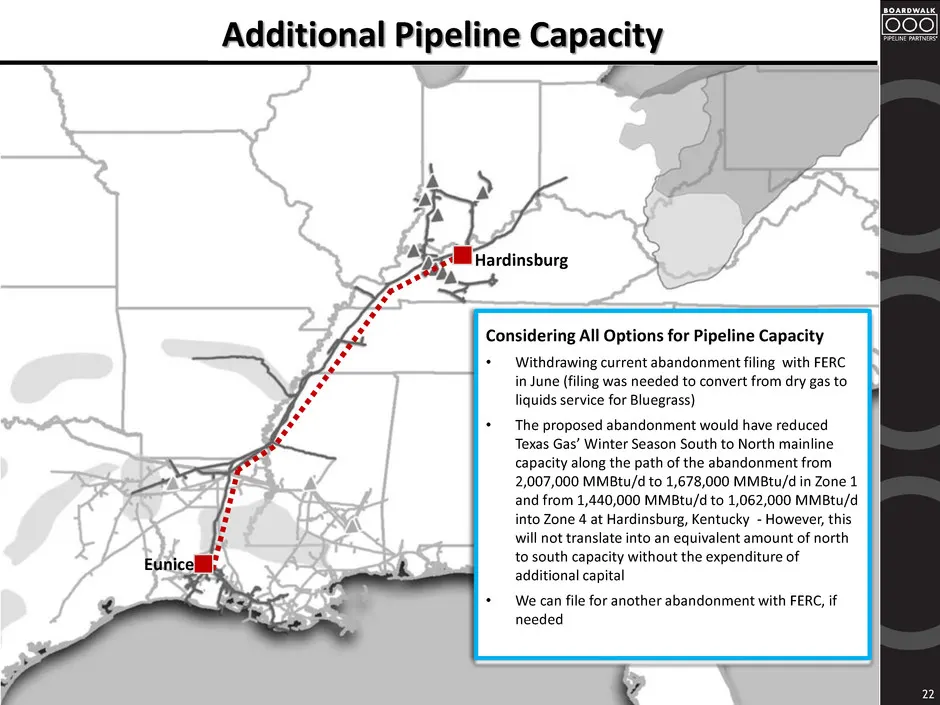
Slide 22: Additional Pipeline Capacity
22 Additional Pipeline Capacity Hardinsburg Eunice Considering All Options for Pipeline Capacity • Withdrawing current abandonment filing with FERC in June (filing was needed to convert from dry gas to liquids service for Bluegrass) • The proposed abandonment would have reduced Texas Gas’ Winter Sea
Slide 23: Other Midstream Projects
Other Midstream Projects We are engaged in discussions with customers looking to build large-scale ethane crackers in Louisiana, reinforcing our bullish point of view on demand for liquids services in Louisiana. We recently executed long-term firm agreements with Sasol for ethane and ethylene tran
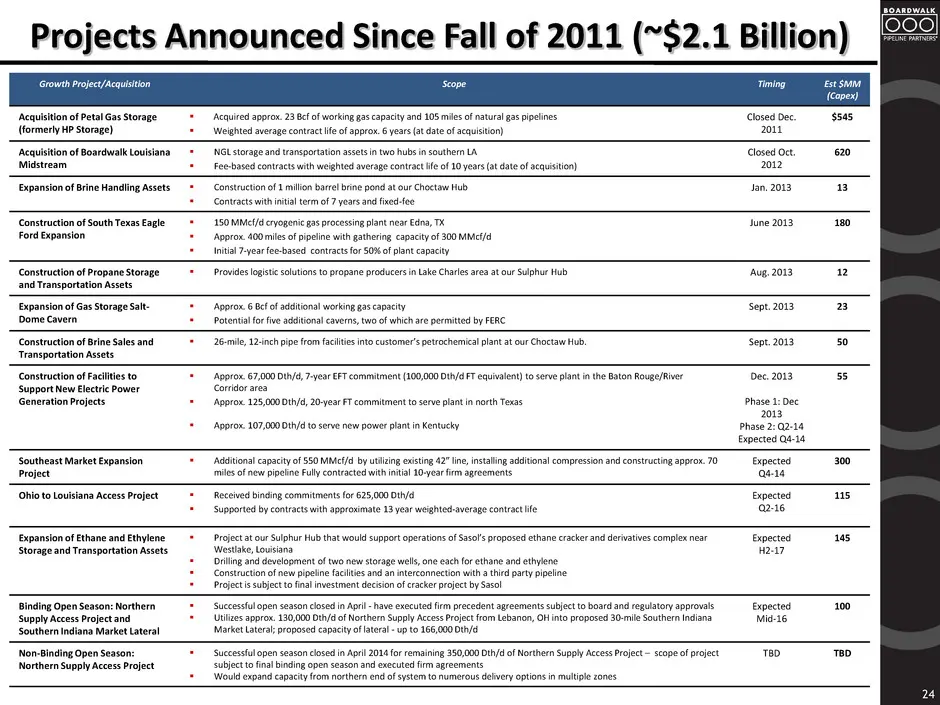
Slide 24: Projects Announced Since Fall of 2011
Projects Announced Since Fall of 2011 (~$2.1 Billion) 24 Growth Project/Acquisition Scope Timing Est $MM (Capex) Acquisition of Petal Gas Storage (formerly HP Storage) Acquired approx. 23 Bcf of working gas capacity and 105 miles of natural gas pipelines Weighted average contract life of approx.
Slide 25: Financial Overview
BOARDWALK Financial Overview PIPELINE PARTNERS®
Slide 26: Revenue Profile Backed by Firm, Long-term Contracts
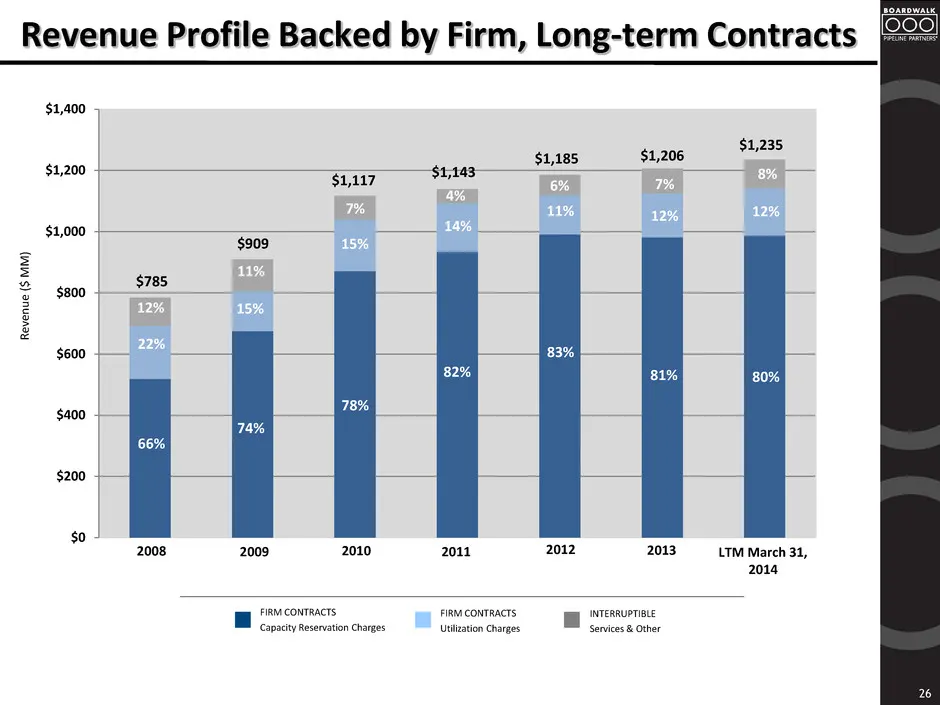
$0 $200 $400 $600 $800 $1,000 $1,200 $1,400 Revenue Profile Backed by Firm, Long-term Contracts 26 R ev en u e ($ MM ) FIRM CONTRACTS Capacity Reservation Charges FIRM CONTRACTS Utilization Charges INTERRUPTIBLE Services & Other 2008 2009 2010 2011 2012 2013 LTM March 31, 2014 66% 22% 12% 74% 15% 11
Slide 27: Financial Comparison
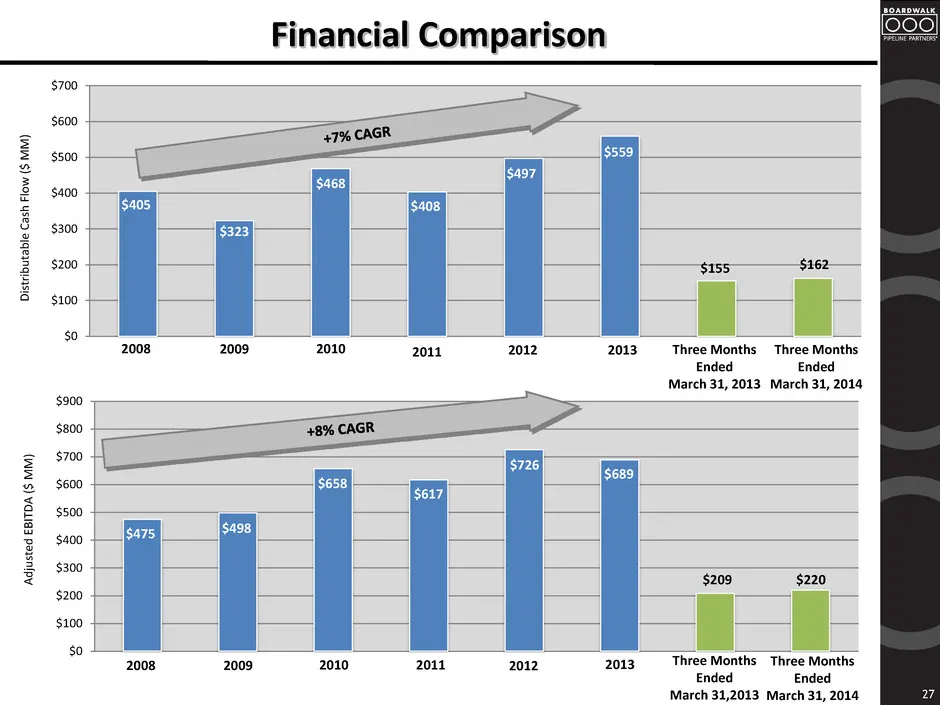
$0 $100 $200 $300 $400 $500 $600 $700 $0 $100 $200 $300 $400 $500 $600 $700 $800 $900 Financial Comparison 27 Di stri b u ta b le Ca sh Fl o w ($ MM ) A d ju ste d E BI TDA ($ MM ) $405 $323 $468 $408 $497 $155 $162 $559 $475 $498 $658 $617 $726 $689 $209 $220 2008 2009 2010 2011 2012 2013 Three Mon
Slide 28: Capitalization as of March 31, 2014
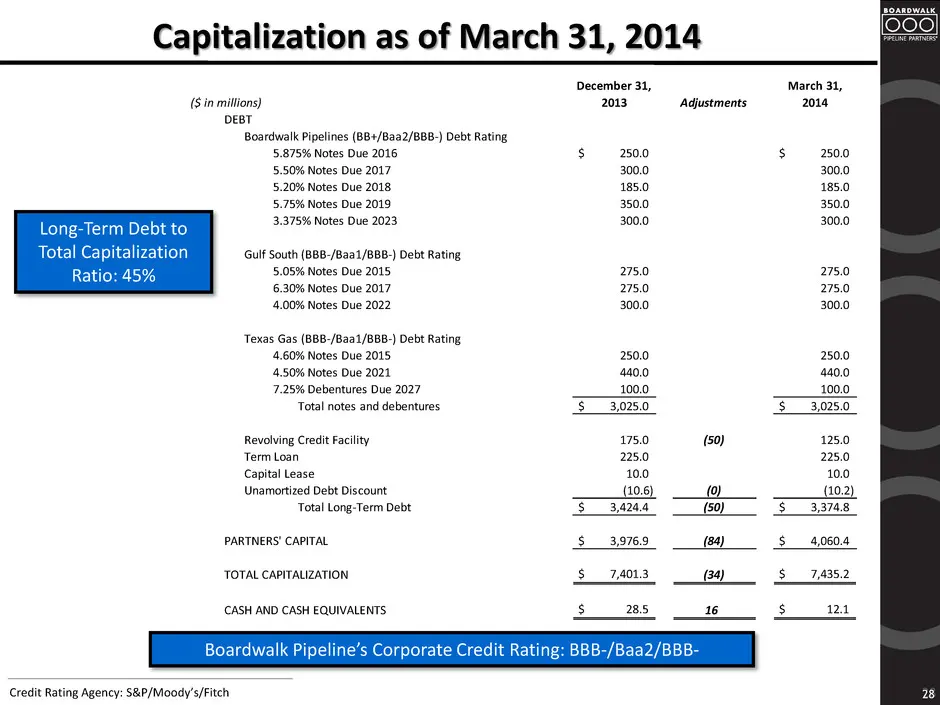
Capitalization as of March 31, 2014 28 Credit Rating Agency: S&P/Moody’s/Fitch ($ in millions) December 31, 2013 Adjustments March 31, 2014 DEBT Boardwalk Pipelines (BB+/Baa2/BBB-) Debt Rating 5.875% Notes Due 2016 $ 250.0 $ 250.0 5.50% Notes Due 2017 300.0 300.0 5.20% Notes Due 2018 185.0 185.0 5.7
Slide 29: Adjusted EBITDA and Distributable Cash Flow Reconciliation
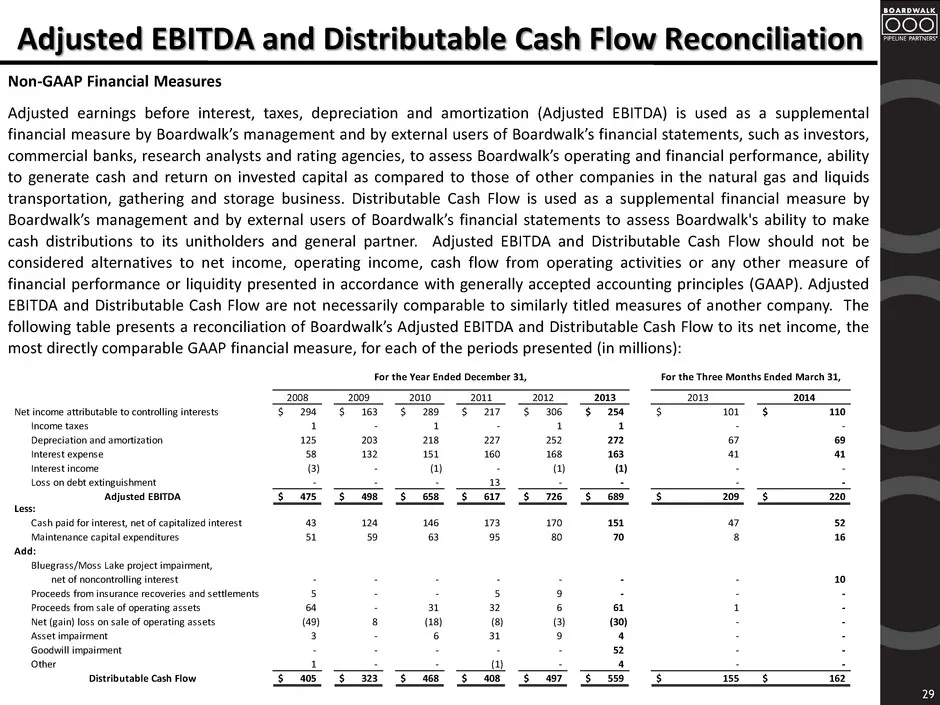
Adjusted EBITDA and Distributable Cash Flow Reconciliation 29 Non-GAAP Financial Measures Adjusted earnings before interest, taxes, depreciation and amortization (Adjusted EBITDA) is used as a supplemental financial measure by Boardwalk’s management and by external users of Boardwalk’s financial sta
Slide 30: Appendix
BOARDWALK Appendix PIPELINE PARTNERS®
Slide 31: Basis Spreads
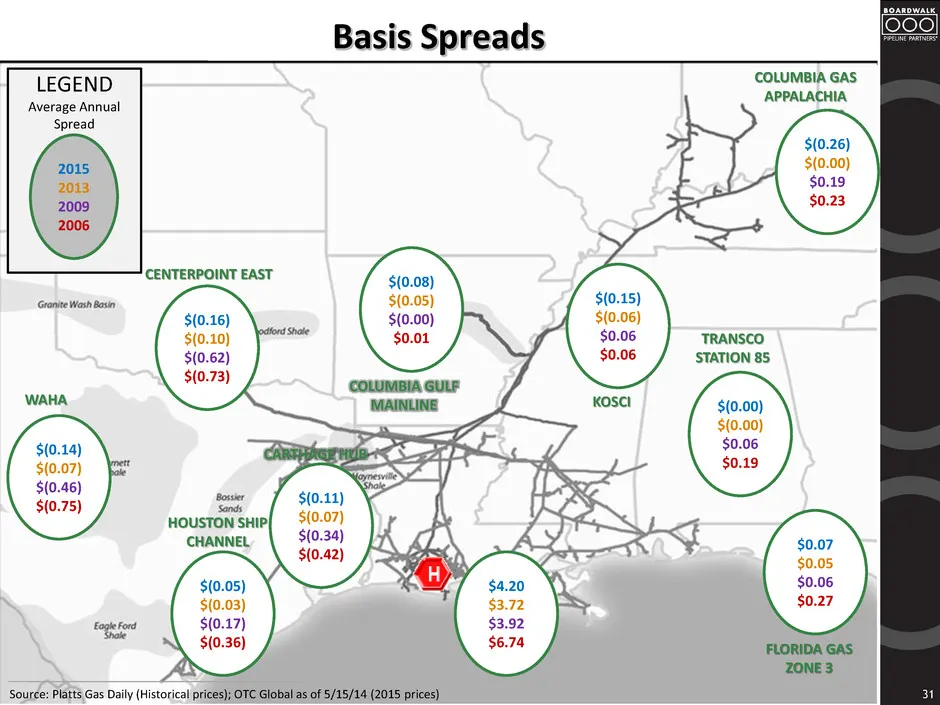
Basis Spreads 31 CENTERPOINT EAST HOUSTON SHIP CHANNEL CARTHAGE HUB KOSCI TRANSCO STATION 85 COLUMBIA GAS APPALACHIA FLORIDA GAS ZONE 3 LEGEND Average Annual Spread 2015 2013 2009 2006 $(0.14) $(0.07) $(0.46) $(0.75) WAHA COLUMBIA GULF MAINLINE $(0.16) $(0.10) $(0.62) $(0.73) $(0.05) $(0.03) $(0.17)
Slide 32: Basin Breakeven Prices
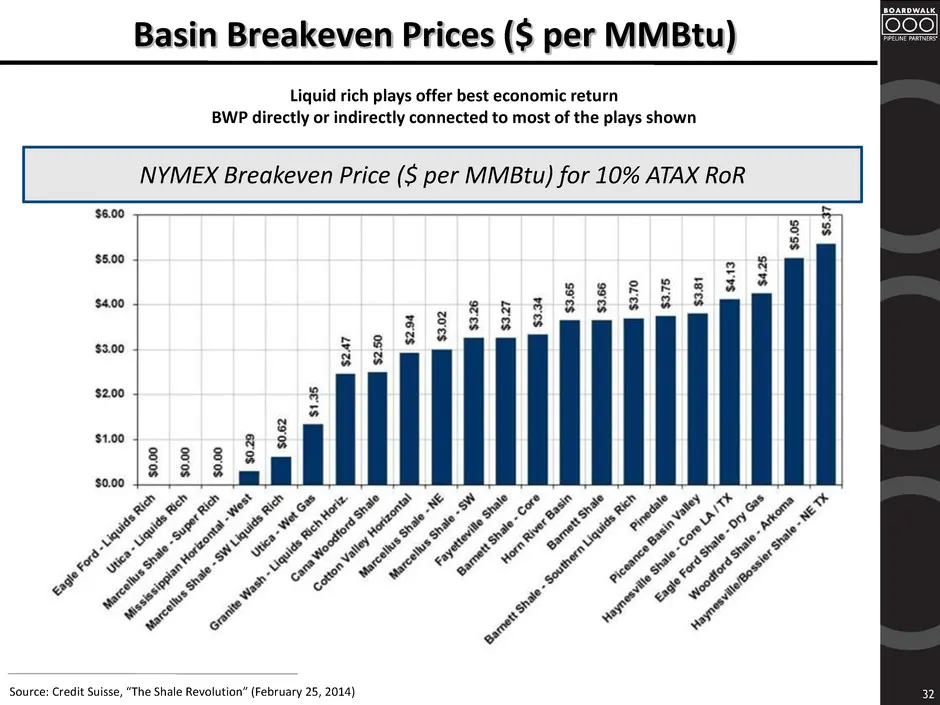
Basin Breakeven Prices ($ per MMBtu) Liquid rich plays offer best economic return BWP directly or indirectly connected to most of the plays shown Source: Credit Suisse, “The Shale Revolution” (February 25, 2014) NYMEX Breakeven Price ($ per MMBtu) for 10% ATAX RoR 32
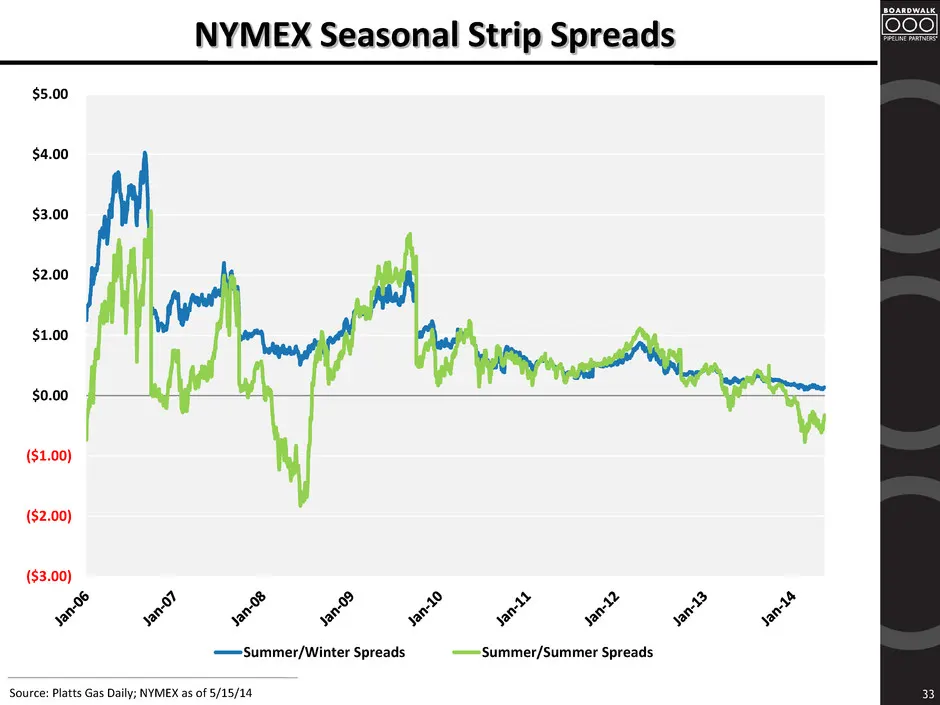
Slide 33: NYMEX Seasonal Strip Spreads
NYMEX Seasonal Strip Spreads Source: Platts Gas Daily; NYMEX as of 5/15/14 33 ($3.00) ($2.00) ($1.00) $0.00 $1.00 $2.00 $3.00 $4.00 $5.00 Summer/Winter Spreads Summer/Summer Spreads
Source: SEC EDGAR · 8-K filed May 20, 2014
More decks from Boardwalk Pipeline Partners LP
 Wells Fargo presentation (May 2017)28 slides · May 16, 2017
 2015 Wells Fargo Energy Symposium32 slides · Dec 7, 2015
 2014 Citi 1x1 MLP/Midstream Infrastructure Conference36 slides · Aug 19, 2014
 Corporate Update (October 2011)9 slides · Oct 17, 2011
 Investor Presentation (May 2009)27 slides · May 26, 2009