CES Energy Solutions Corp · TSX:CEU
CES Energy Solutions — Investor Presentation (November 2026)
24 slides from CES Energy Solutions's investor presentation, Nov 12, 2026
Slide 1: Leading Provider of Consumable Chemical Solutions
Leading Provider of Consumable Chemical Solutions November 2026
Slide 2: Forward Looking Information and Statements
Forward Looking Information and Statements Certain statements in this presentation may constitute forward-looking information or forward-looking statements (collectively referred to as “forward-looking information”) which involves known and unknown risks, uncertainties and other factors, which may c
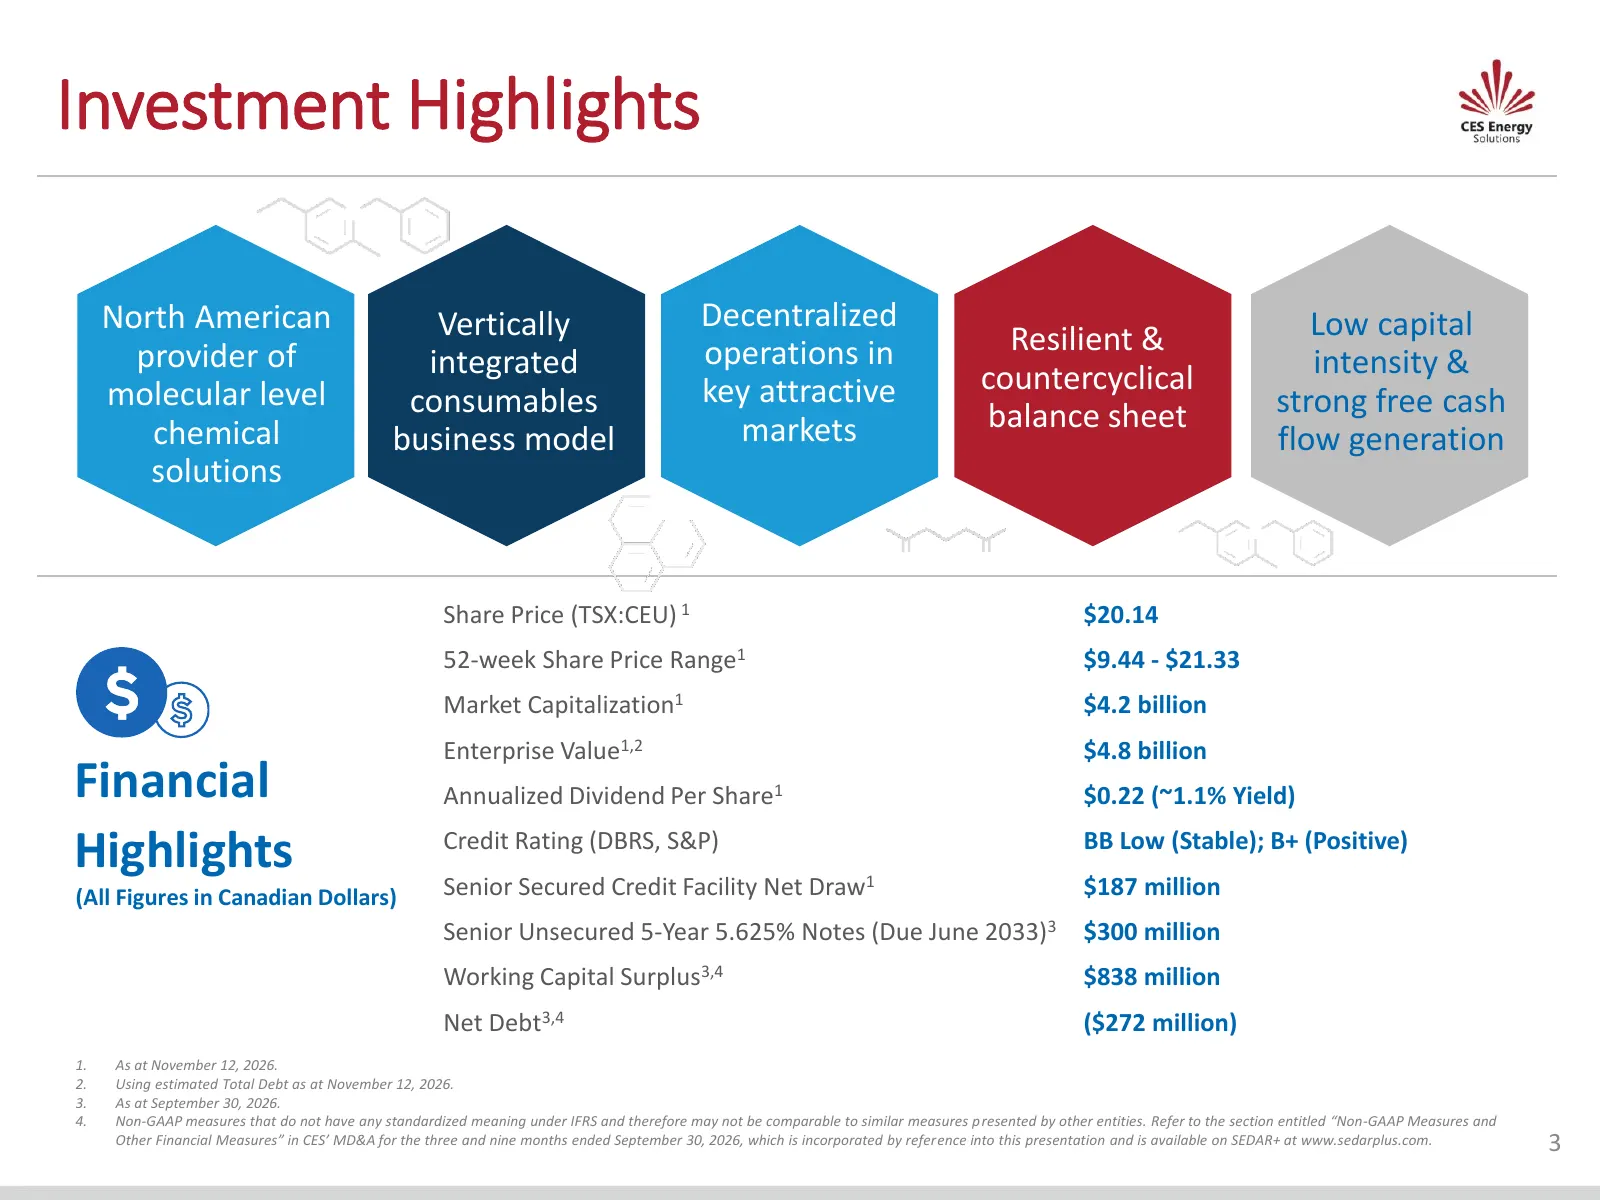
Slide 3: Investment Highlights
Investment Highlights North American Vertically Decentralized Low capital provider of operations in Resilient & integrated countercyclical intensity & molecular level consumables key attractive strong free cash chemical markets balance sheet business model flow generation solutions Share Price (TSX:
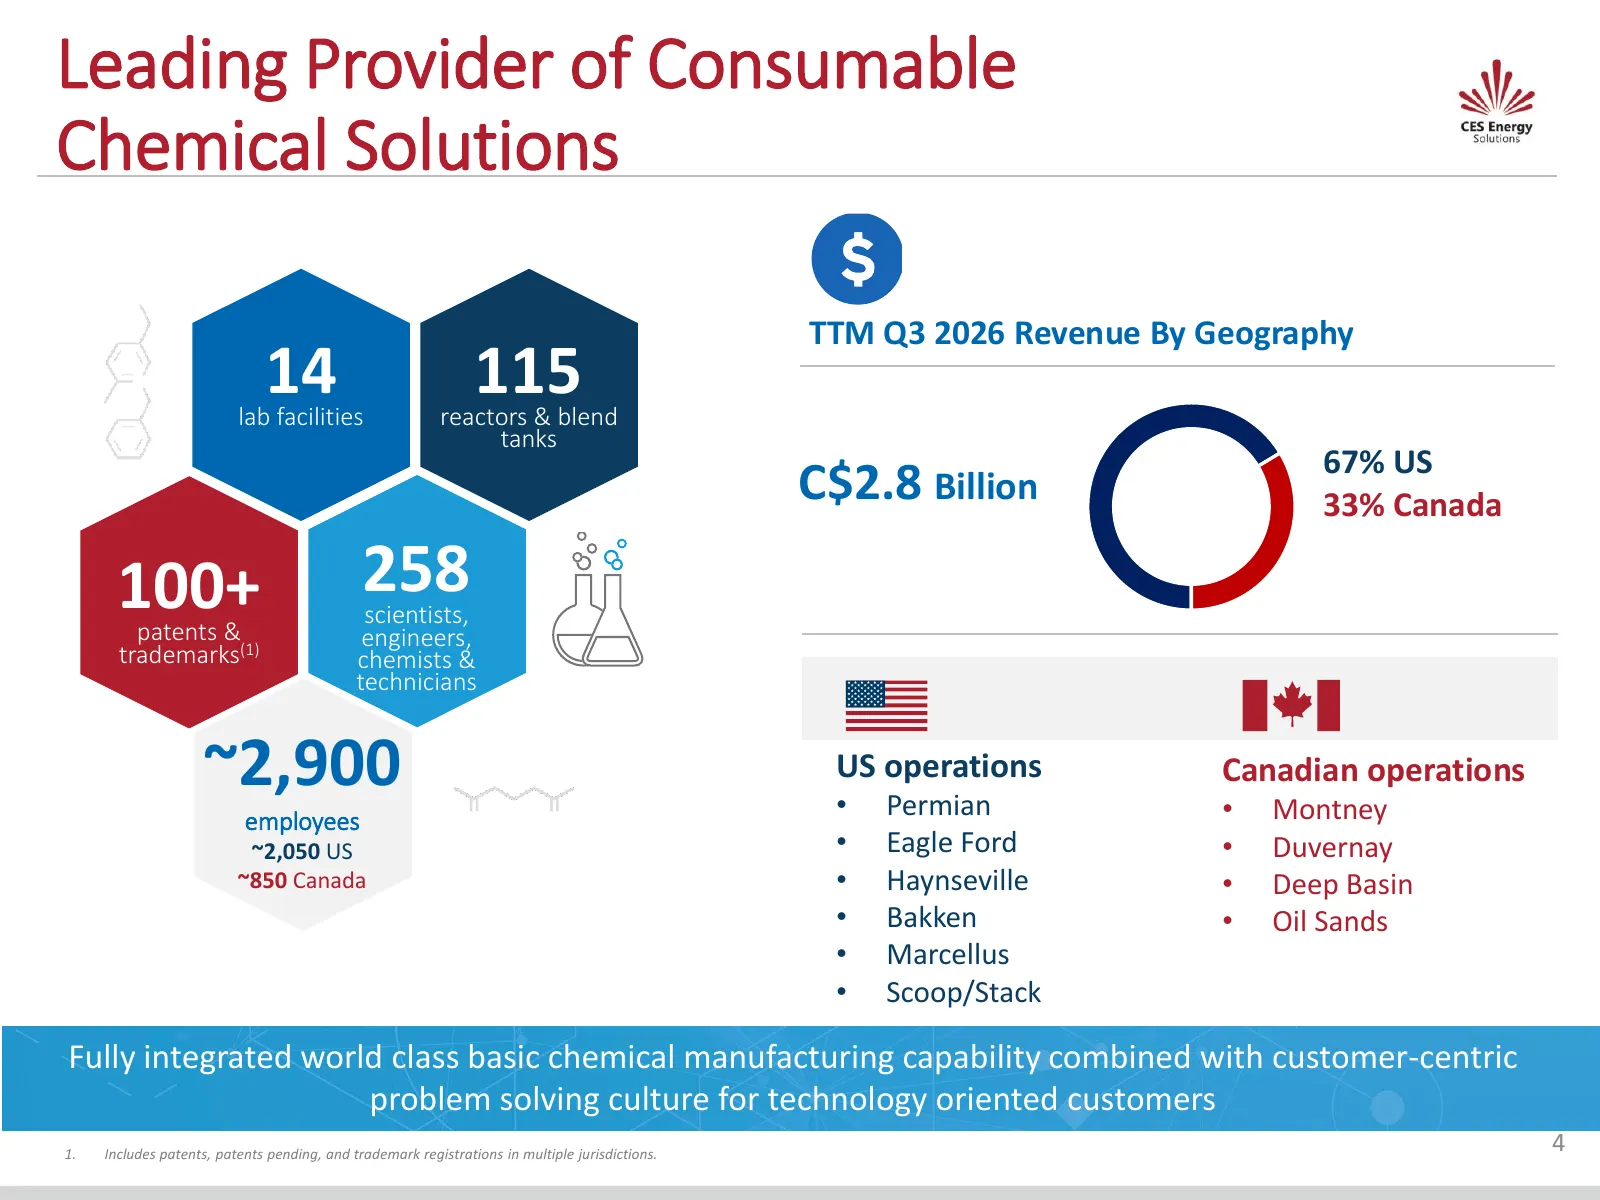
Slide 4: Leading Provider of Consumable Chemical Solutions
Leading Provider of Consumable Chemical Solutions TTM Q3 2026 Revenue By Geography 14 lab facilities 115 reactors & blend tanks 67% US C$2.8 Billion 33% Canada 100+ 258 scientists, patents & engineers, trademarks(1) chemists & technicians ~2,900 US operations • Permian Canadian operations • Montney
Slide 5: Solving Problems and Adding Value through Technology & Customer Service
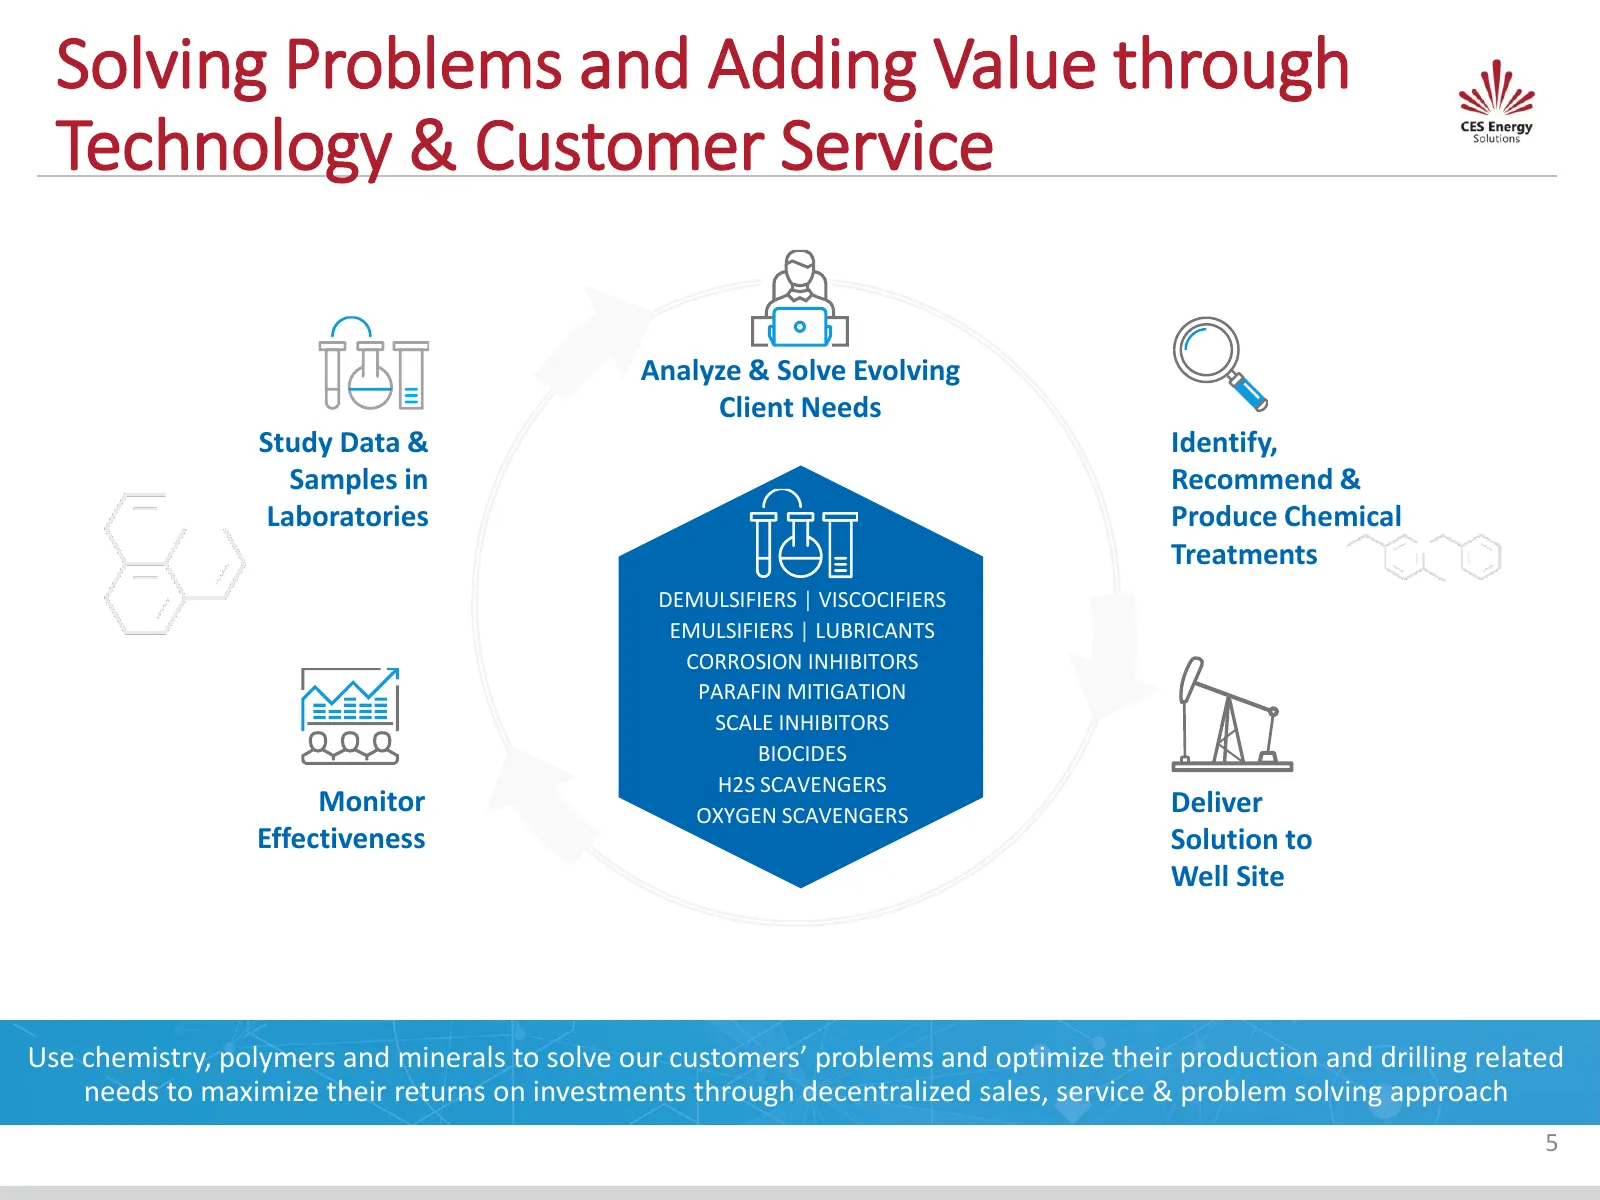
Solving Problems and Adding Value through Technology & Customer Service Analyze & Solve Evolving Client Needs Study Data & Identify, Samples in Recommend & Laboratories Produce Chemical Treatments DEMULSIFIERS | VISCOCIFIERS Optimize Chemical EMULSIFIERS | LUBRICANTS CORROSION INHIBITORS Solutions t
Slide 6: Improving Trends & Stable End Markets
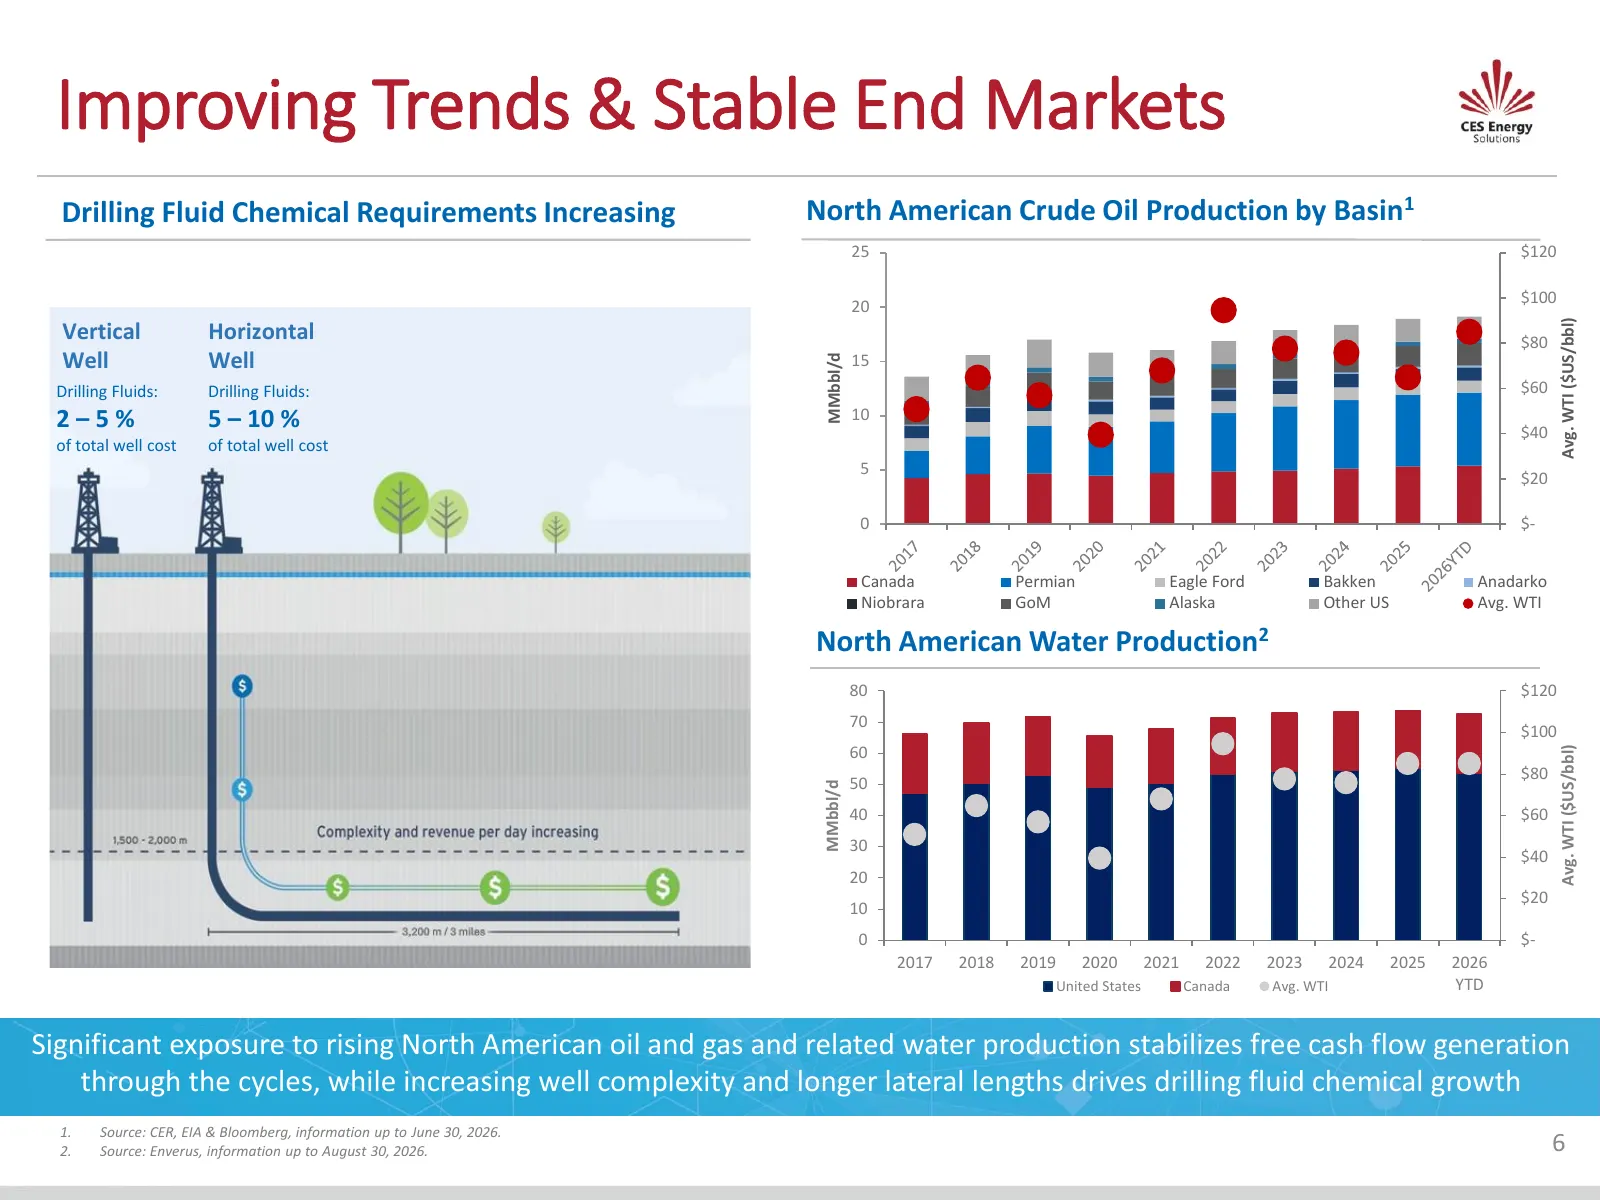
Improving Trends & Stable End Markets Drilling Fluid Chemical Requirements Increasing North American Crude Oil Production by Basin1 25 $120 $100 20 Avg. WTI ($US/bbl) Vertical Horizontal $80 Well Well MMbbl/d 15 Drilling Fluids: Drilling Fluids: $60 2–5% 5 – 10 % 10 $40 of total well cost of total w
Slide 7: Strong Competitive Positioning
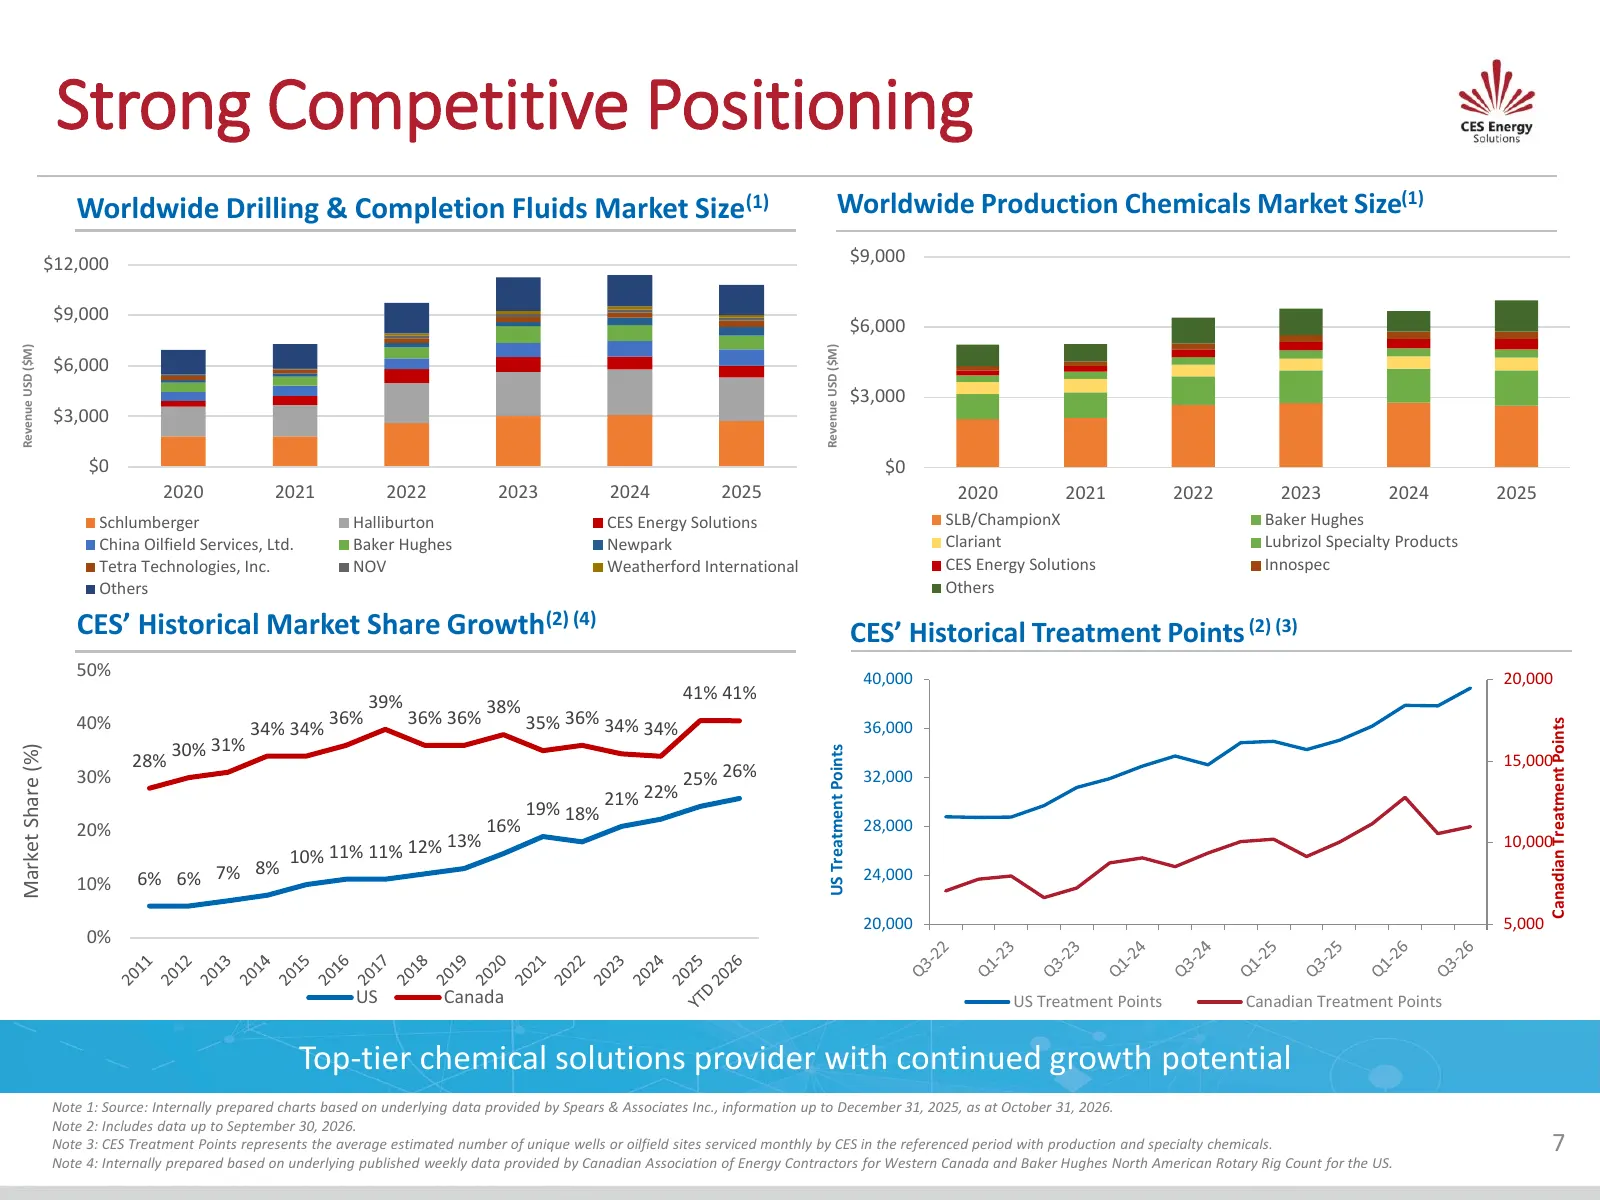
Strong Competitive Positioning Worldwide Drilling & Completion Fluids Market Size(1) Worldwide Production Chemicals Market Size(1) $12,000 $9,000 $9,000 $6,000 Revenue USD ($M) Revenue USD ($M) $6,000 $3,000 $3,000 $0 $0 2020 2021 2022 2023 2024 2025 2020 2021 2022 2023 2024 2025 Schlumberger Hallib
Slide 8: Well Positioned for Growth with Decentralized Model
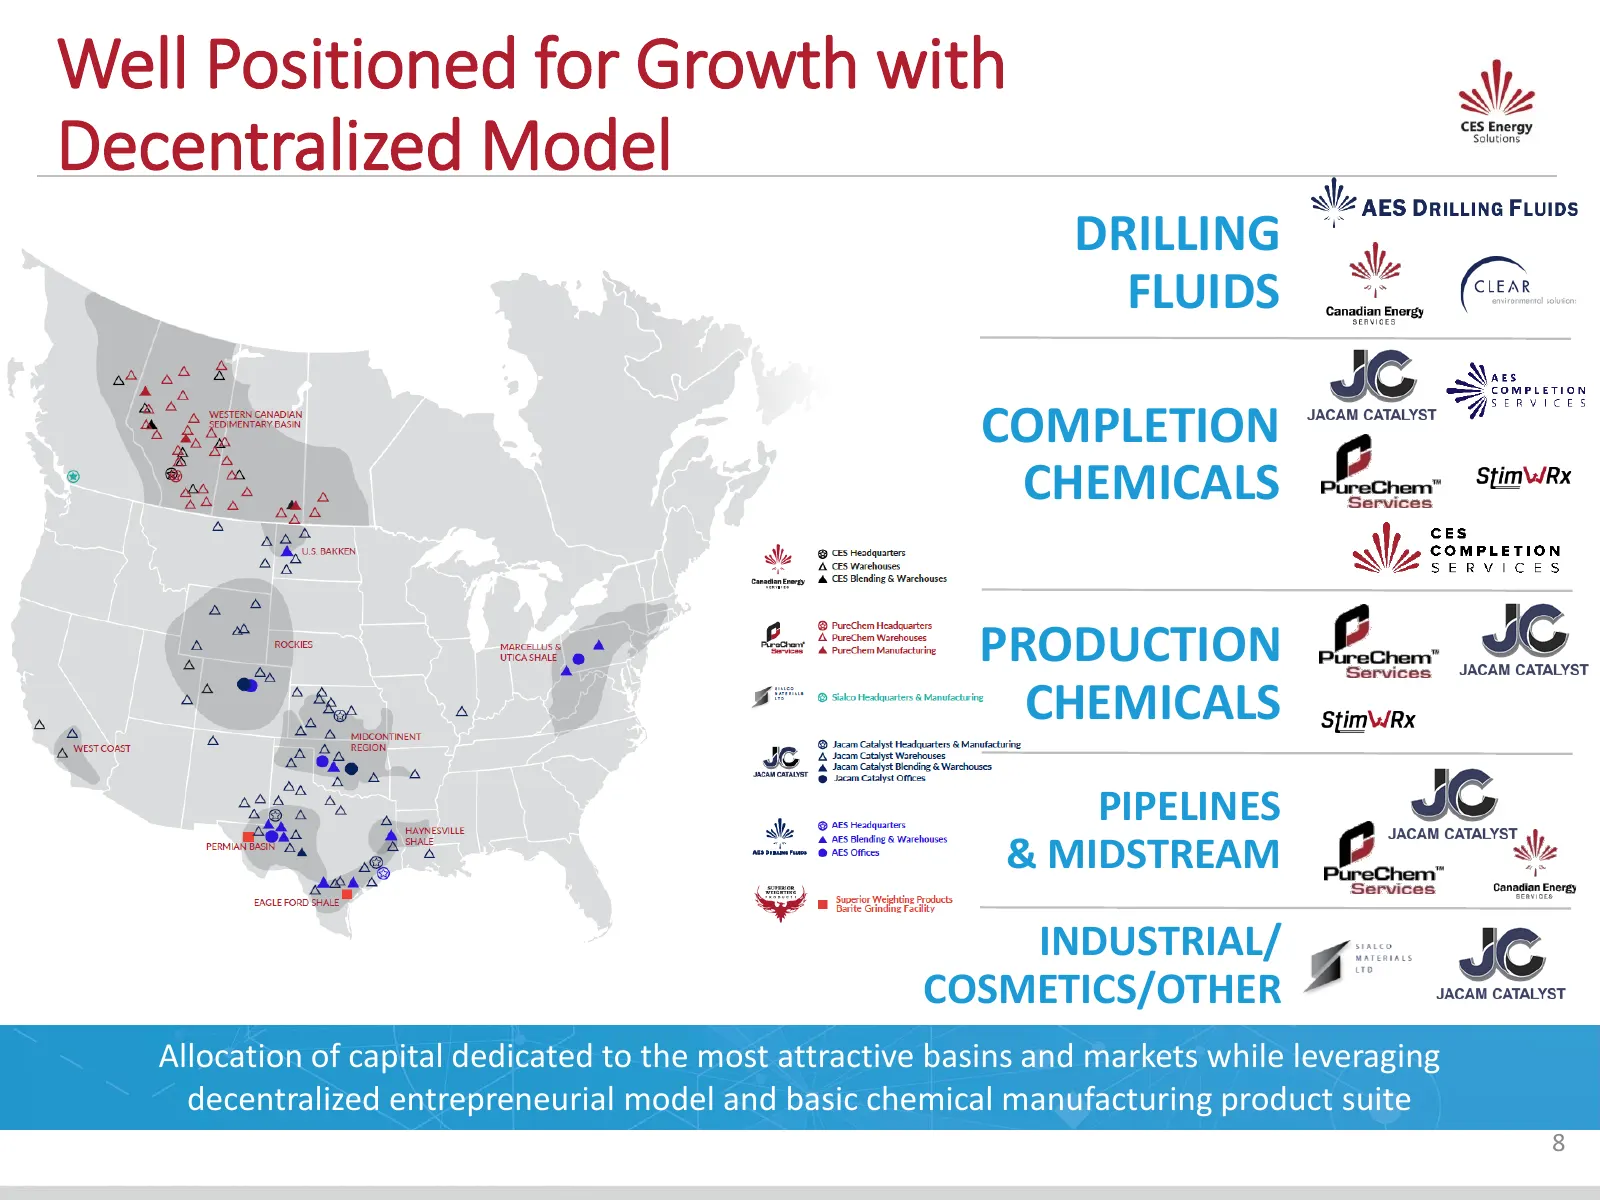
Well Positioned for Growth with Decentralized Model DRILLING FLUIDS COMPLETION CHEMICALS PRODUCTION CHEMICALS PIPELINES & MIDSTREAM INDUSTRIAL/ COSMETICS/OTHER Allocation of capital dedicated to the most attractive basins and markets while leveraging decentralized entrepreneurial model and basic che
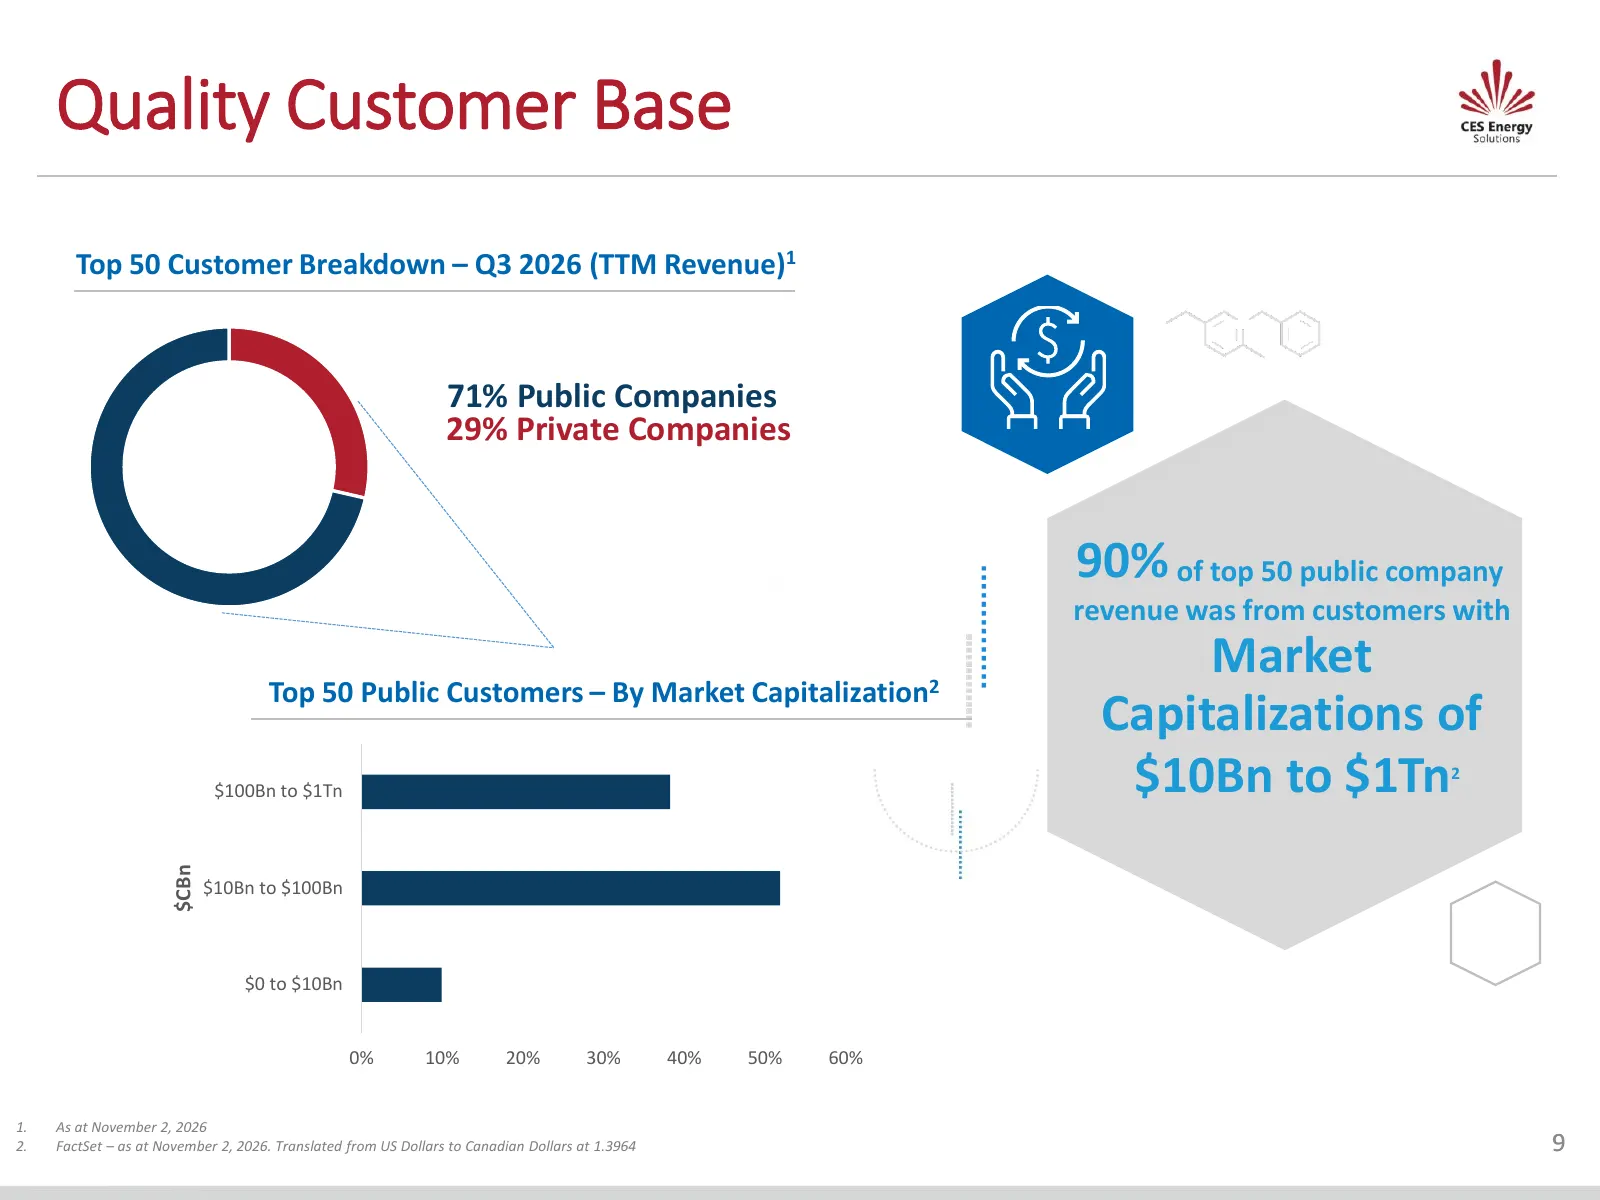
Slide 9: Quality Customer Base
Quality Customer Base Top 50 Customer Breakdown – Q3 2026 (TTM Revenue)1 71% Public Companies 29% Private Companies 90% of top 50 public company revenue was from customers with Market Top 50 Public Customers – By Market Capitalization2 Capitalizations of $100Bn to $1Tn $10Bn to $1Tn 2 $CBn $10Bn to
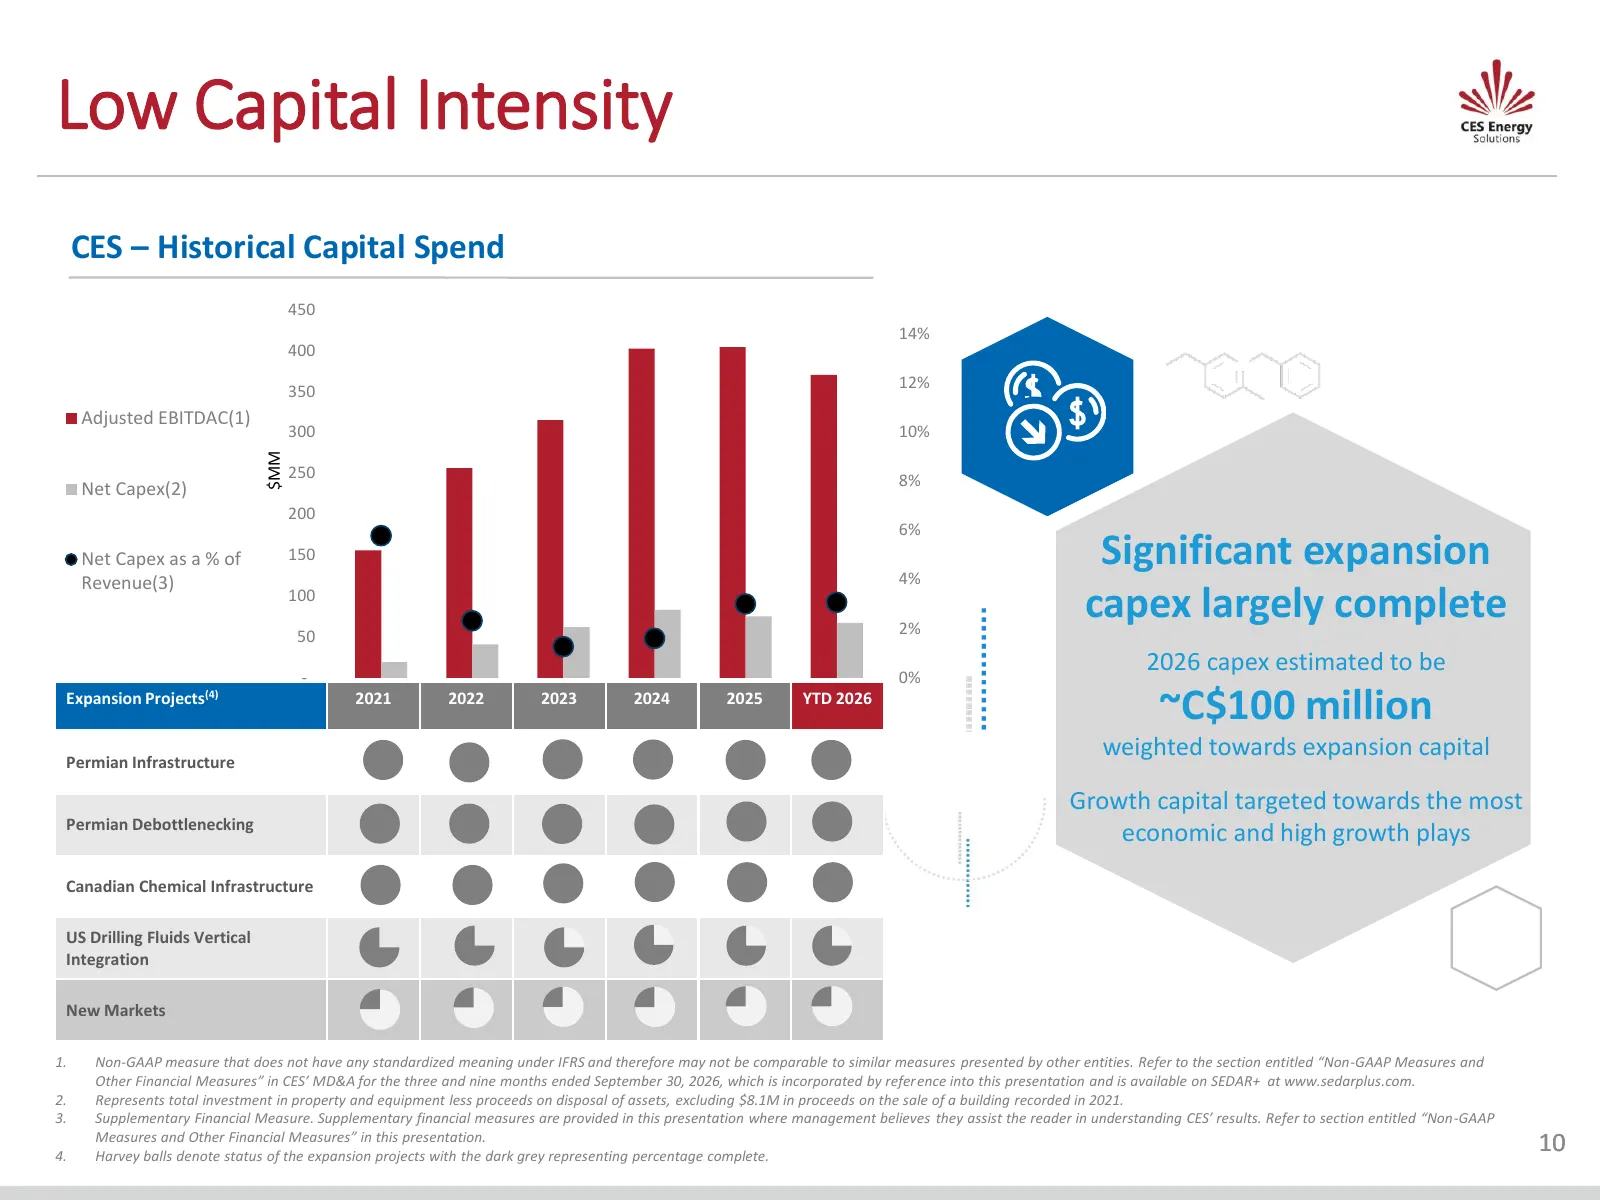
Slide 10: Low Capital Intensity
Low Capital Intensity CES – Historical Capital Spend 450 14% 400 350 12% Adjusted EBITDAC(1) 300 10% $MM 250 8% Net Capex(2) 200 6% Net Capex as a % of 150 4% Significant expansion Revenue(3) 100 2% capex largely complete 50 - 0% 2026 capex estimated to be Expansion Projects(4) 2021 2022 2023 2024 2
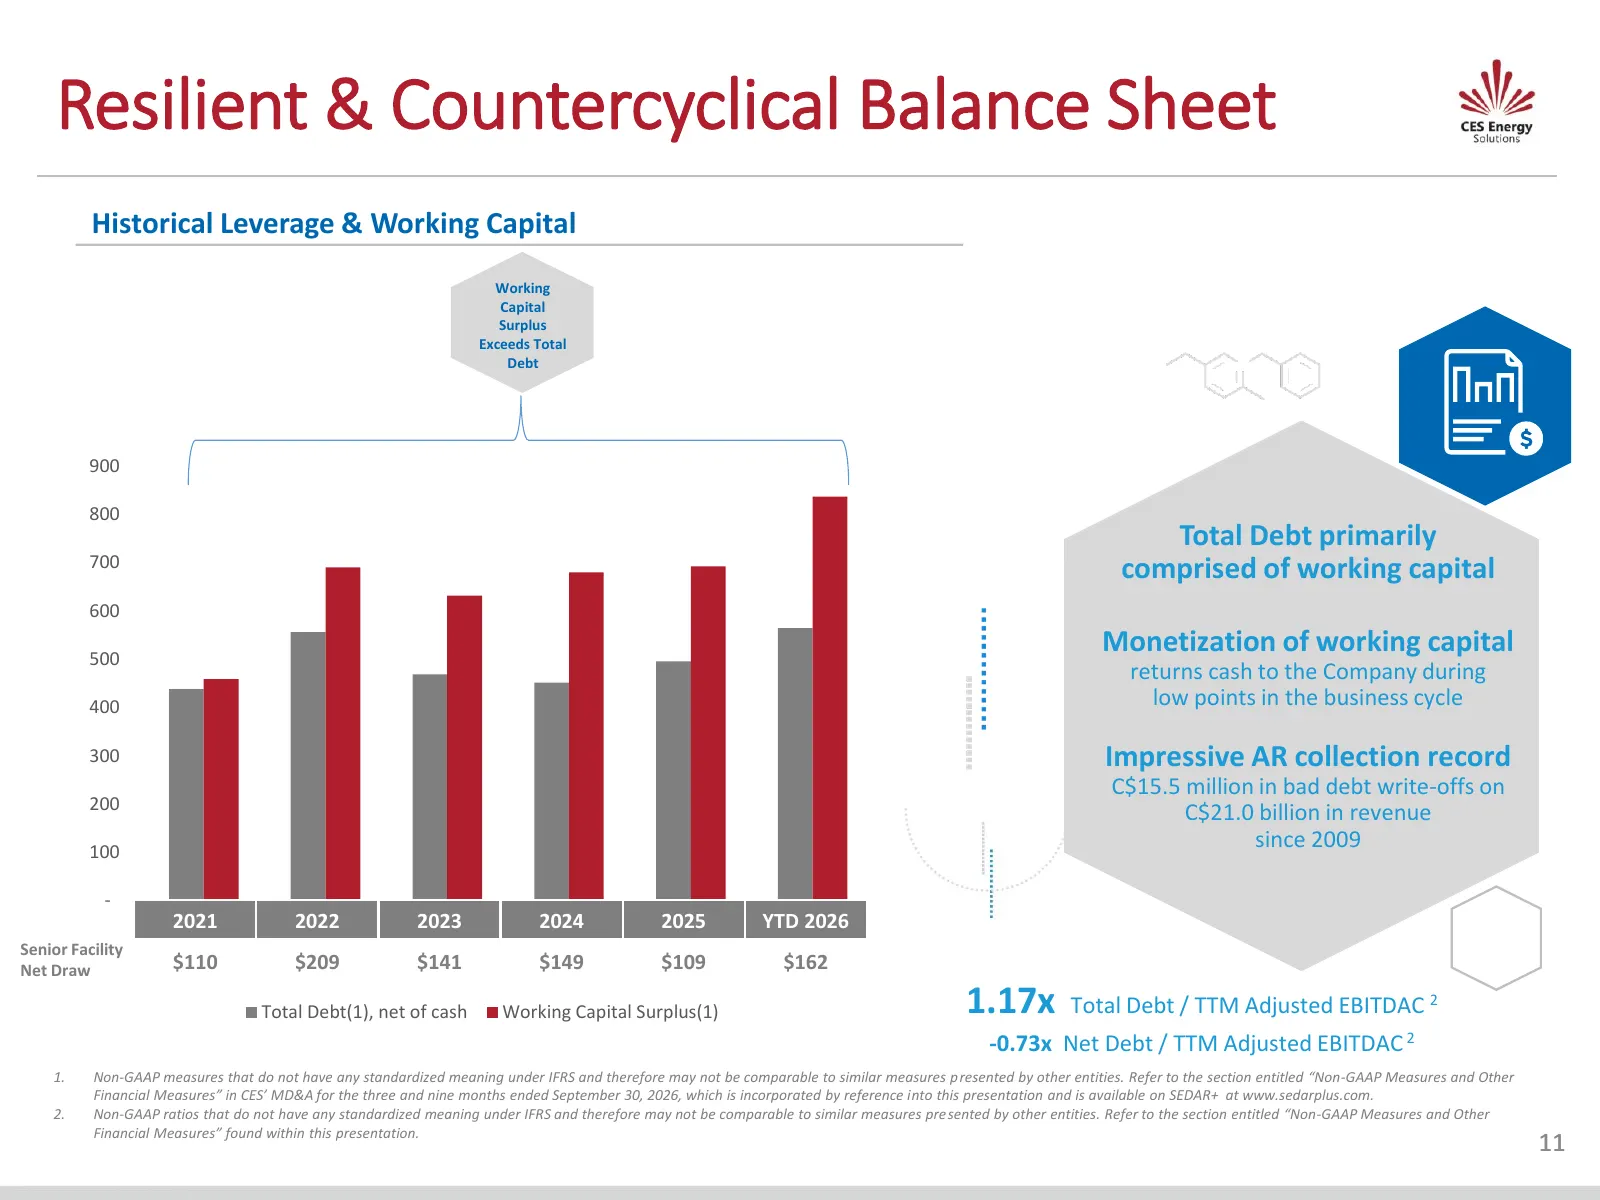
Slide 11: Resilient & Countercyclical Balance Sheet
Resilient & Countercyclical Balance Sheet Historical Leverage & Working Capital Working Capital Surplus Exceeds Total Debt 900 800 Total Debt primarily 700 comprised of working capital 600 500 Monetization of working capital returns cash to the Company during 400 low points in the business cycle 300
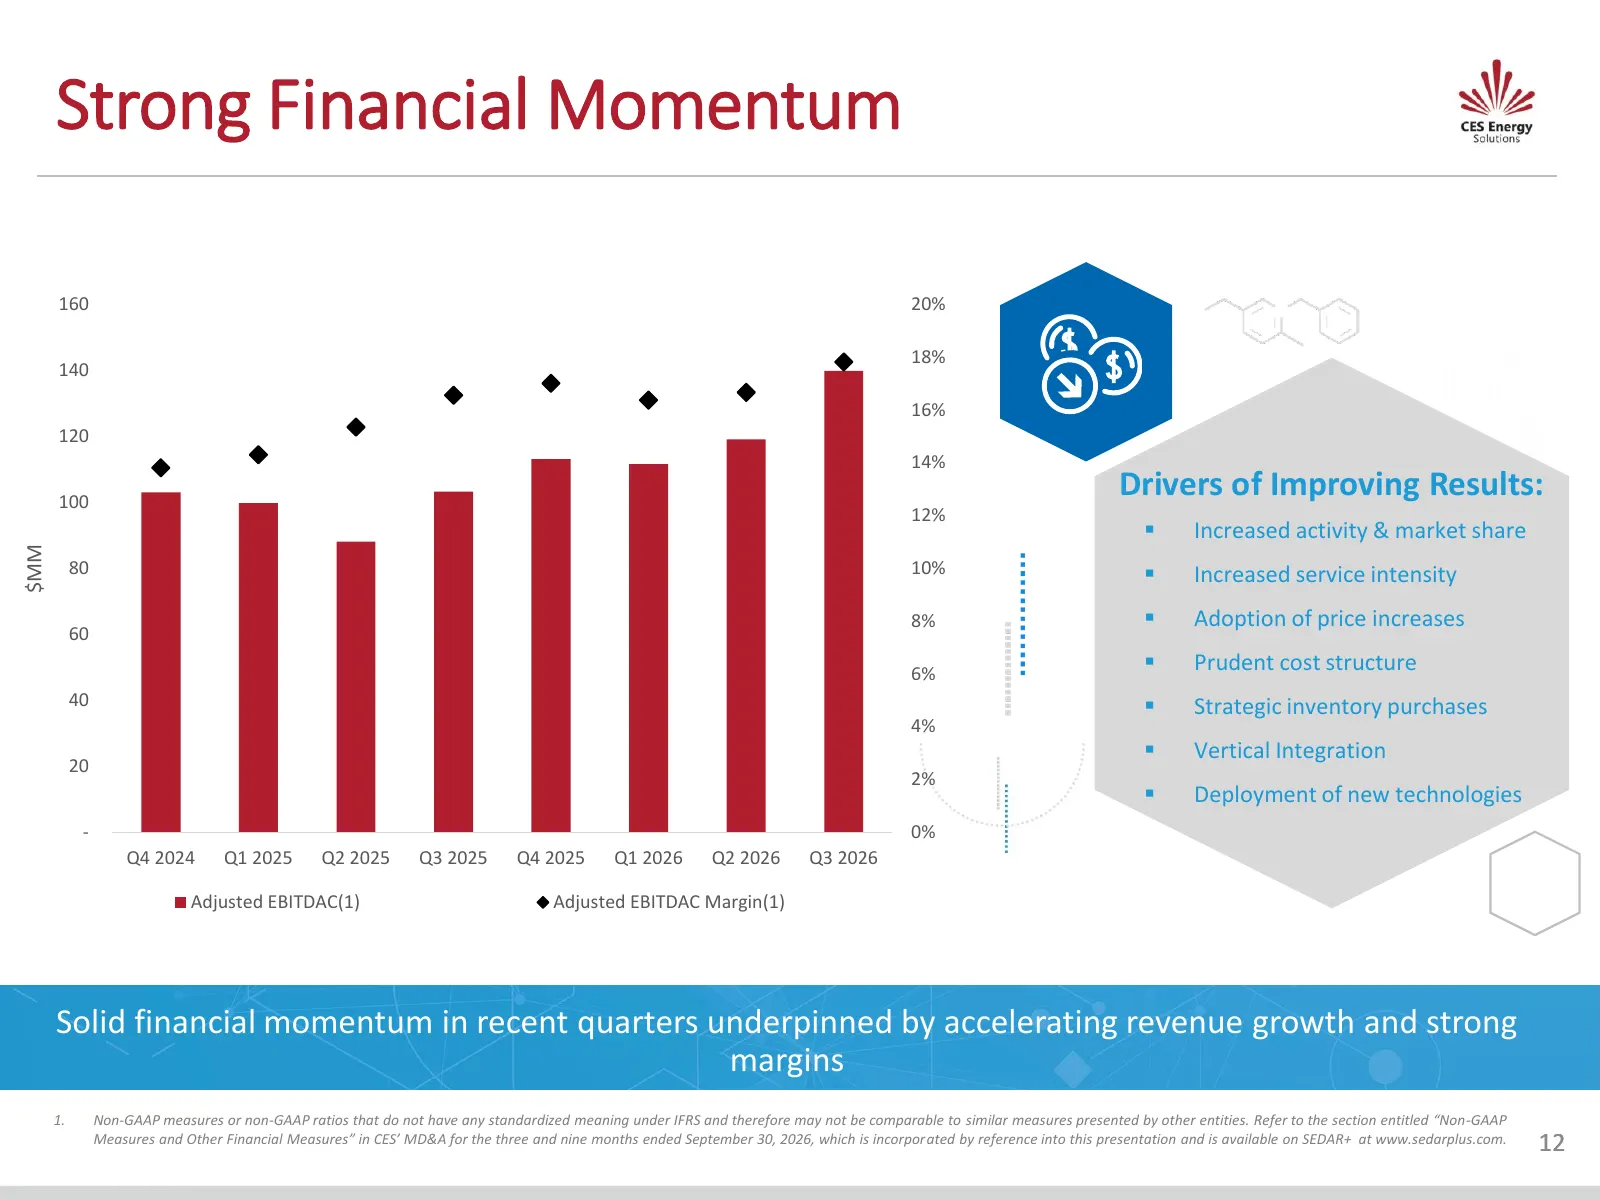
Slide 12: Strong Financial Momentum
Strong Financial Momentum 160 20% 18% 140 16% 120 14% 100 Drivers of Improving Results: 12% ▪ Increased activity & market share $MM 80 10% ▪ Increased service intensity 8% ▪ Adoption of price increases 60 6% ▪ Prudent cost structure 40 ▪ Strategic inventory purchases 4% ▪ Vertical Integration 20 2%
Slide 13: Strong Free Cash Flow Generation
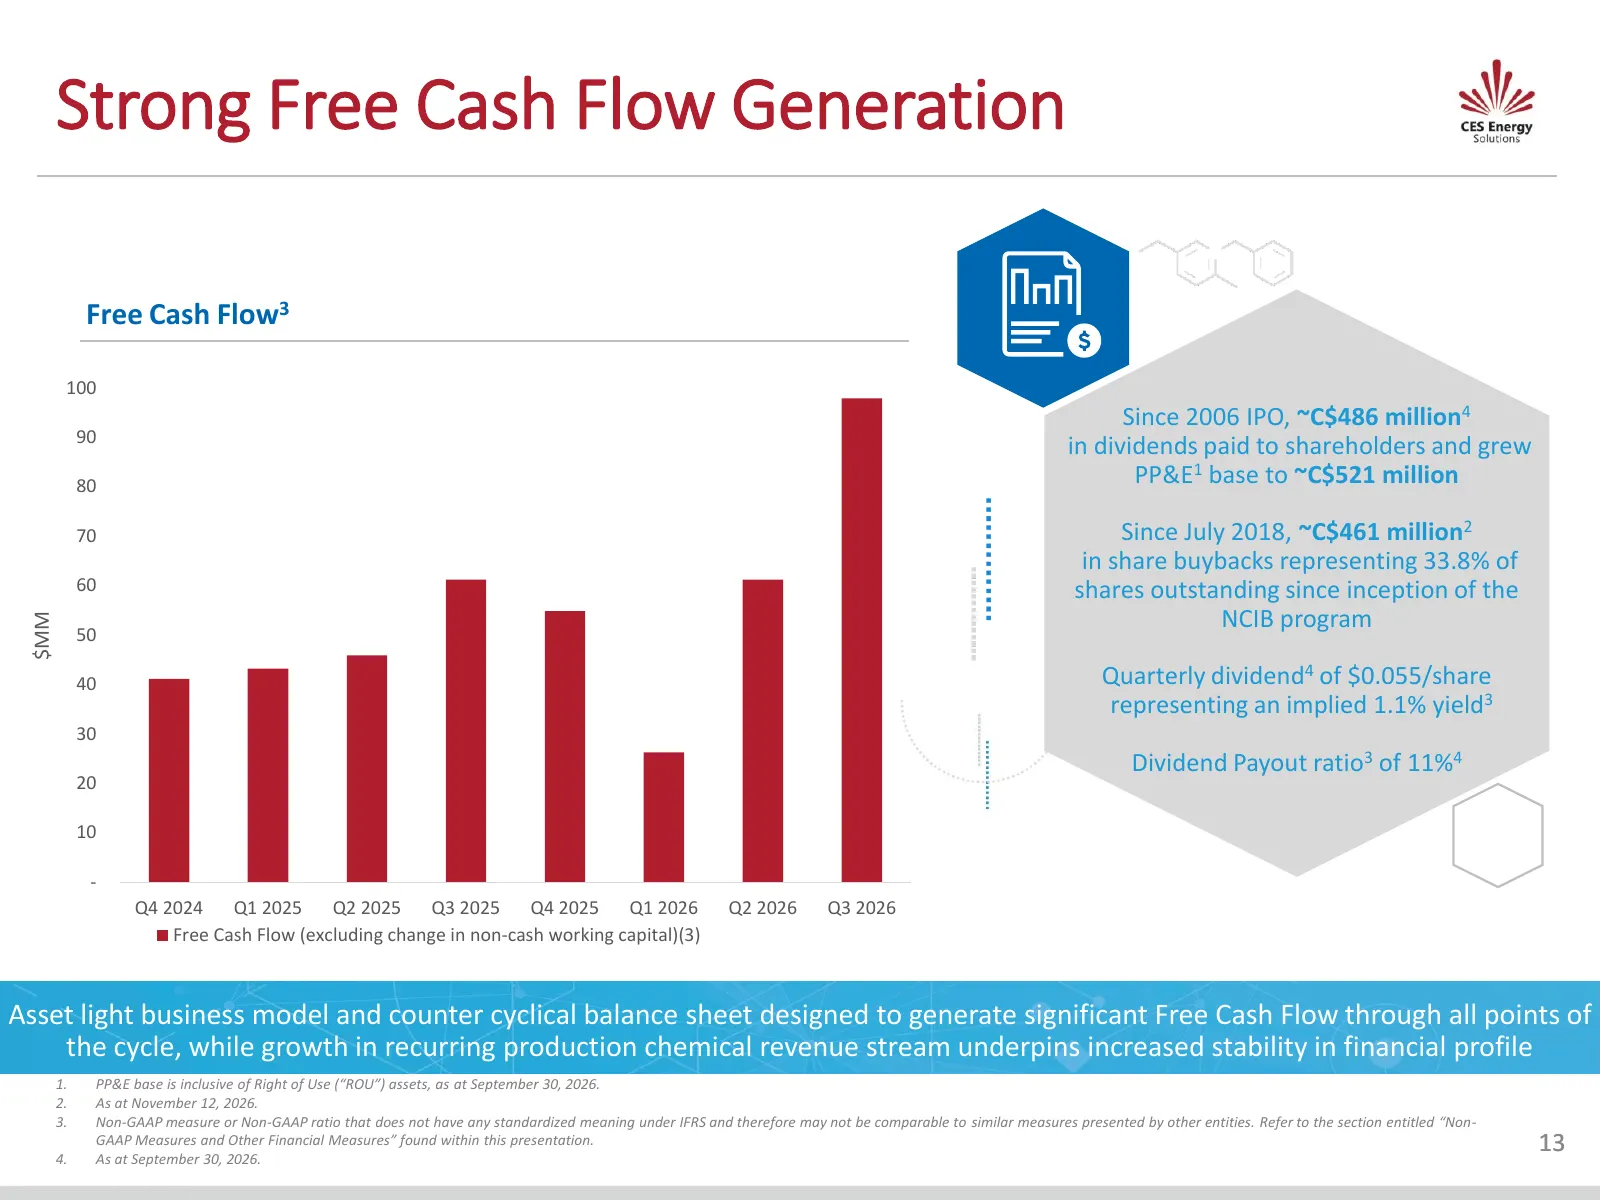
Strong Free Cash Flow Generation Free Cash Flow3 100 Since 2006 IPO, ~C$486 million4 90 in dividends paid to shareholders and grew 80 PP&E1 base to ~C$521 million 70 Since July 2018, ~C$461 million2 in share buybacks representing 33.8% of 60 shares outstanding since inception of the NCIB program $MM
Slide 14: Prudent Capital Structure & Liquidity Profile
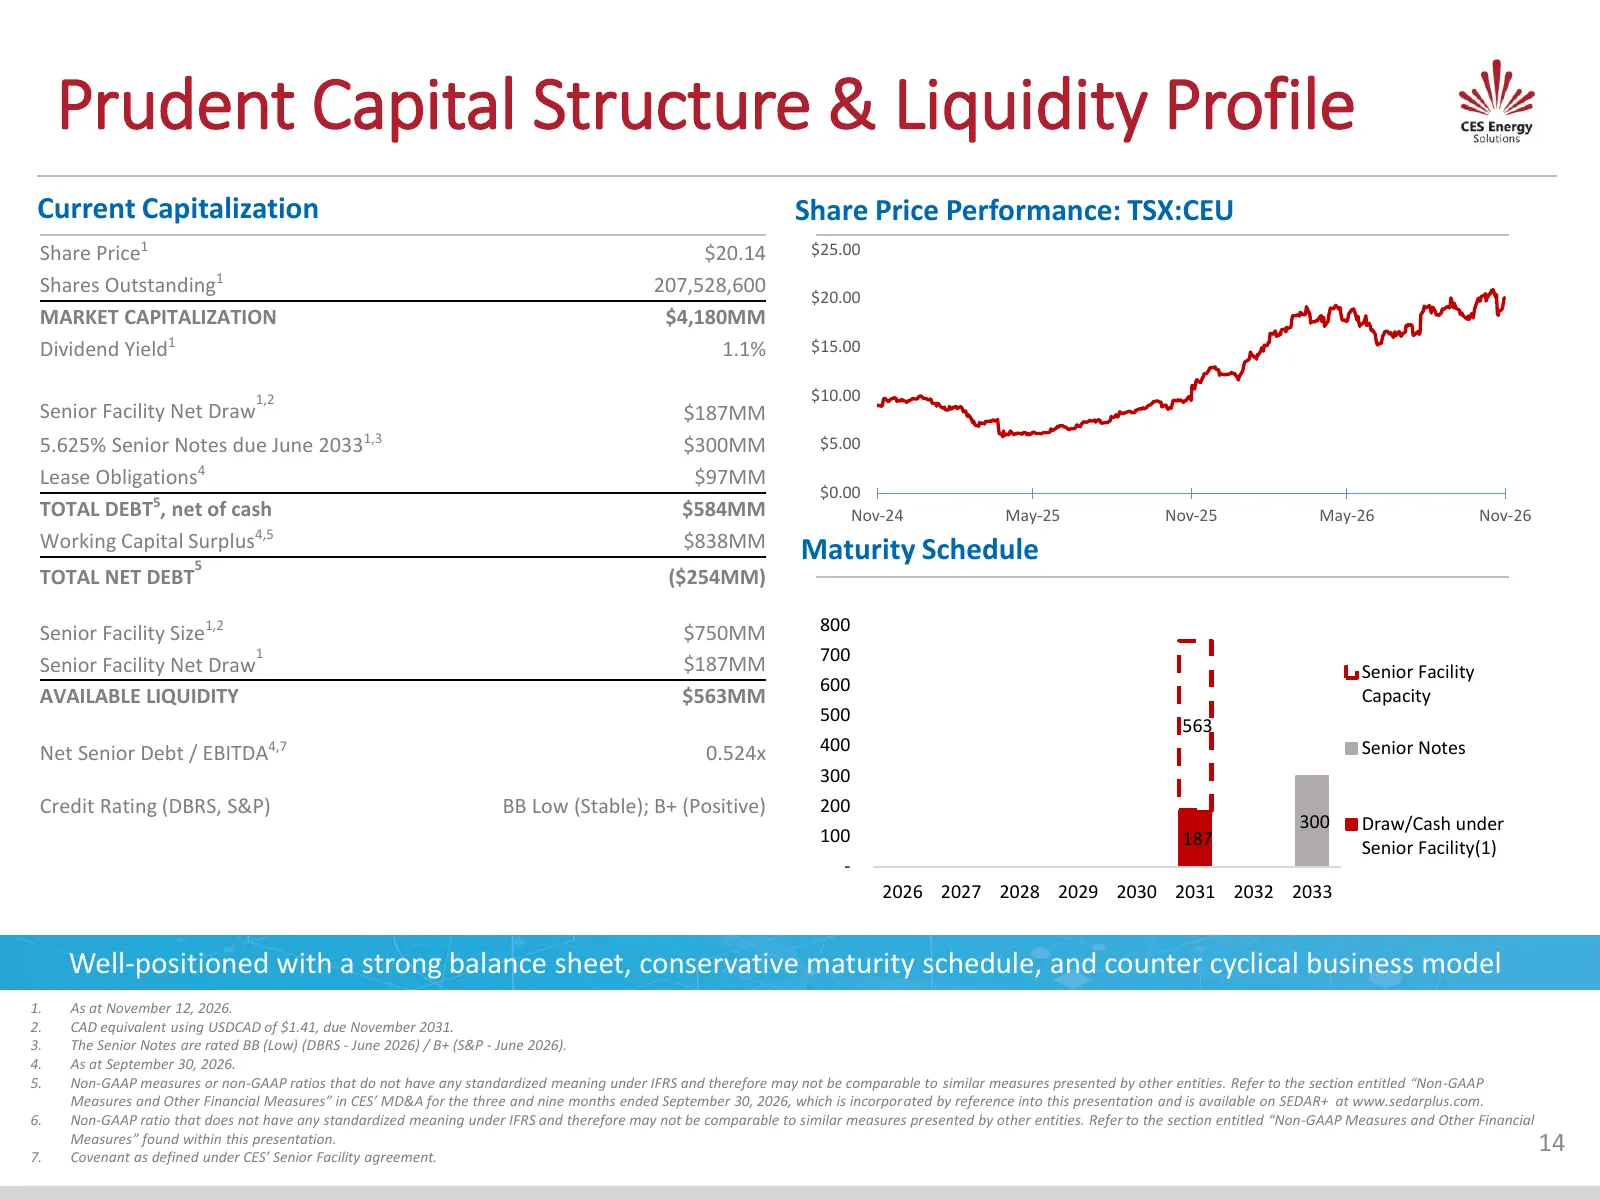
Prudent Capital Structure & Liquidity Profile Current Capitalization Share Price Performance: TSX:CEU Share Price1 $20.14 $25.00 Shares Outstanding1 207,528,600 $20.00 MARKET CAPITALIZATION $4,180MM Dividend Yield1 1.1% $15.00 1,2 $10.00 Senior Facility Net Draw $187MM 5.625% Senior Notes due June 2
Slide 15: Investment Highlights
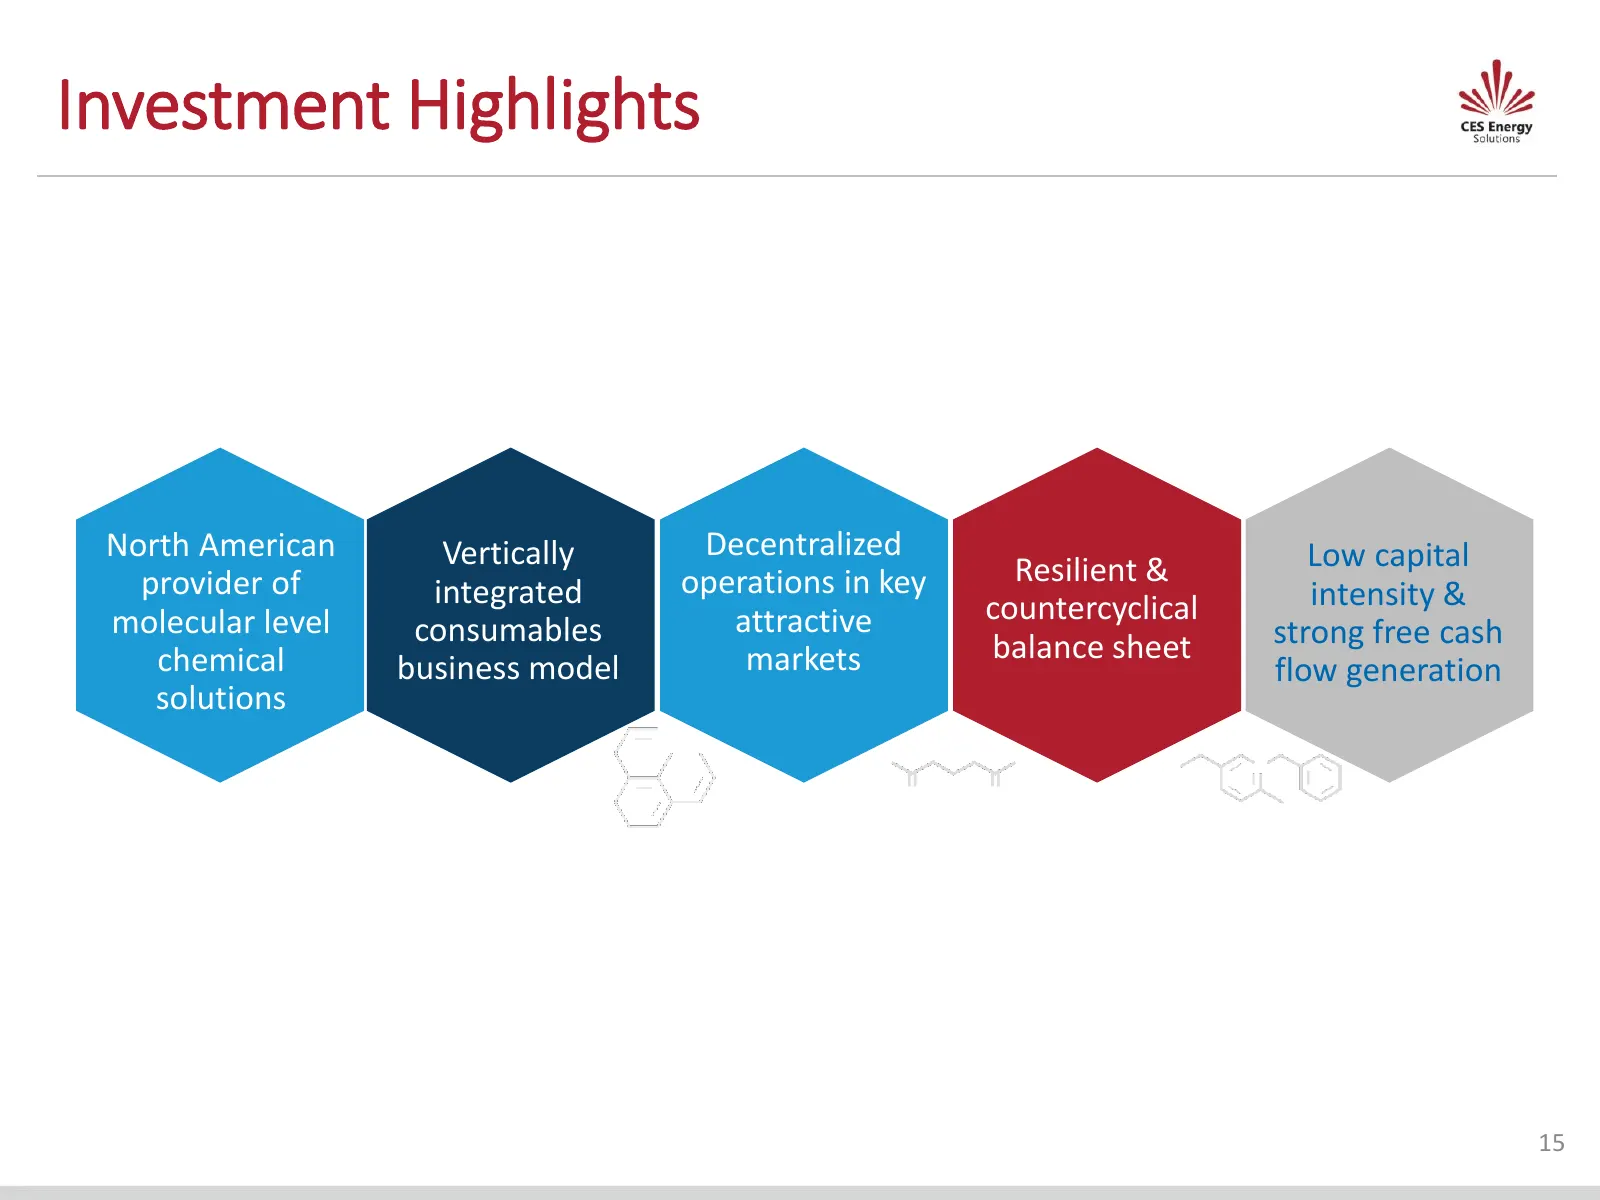
Investment Highlights North American Vertically Decentralized Low capital provider of operations in key Resilient & integrated countercyclical intensity & molecular level consumables attractive strong free cash chemical markets balance sheet business model flow generation solutions 15
Slide 16: Appendix
wh Cate APPENDIX
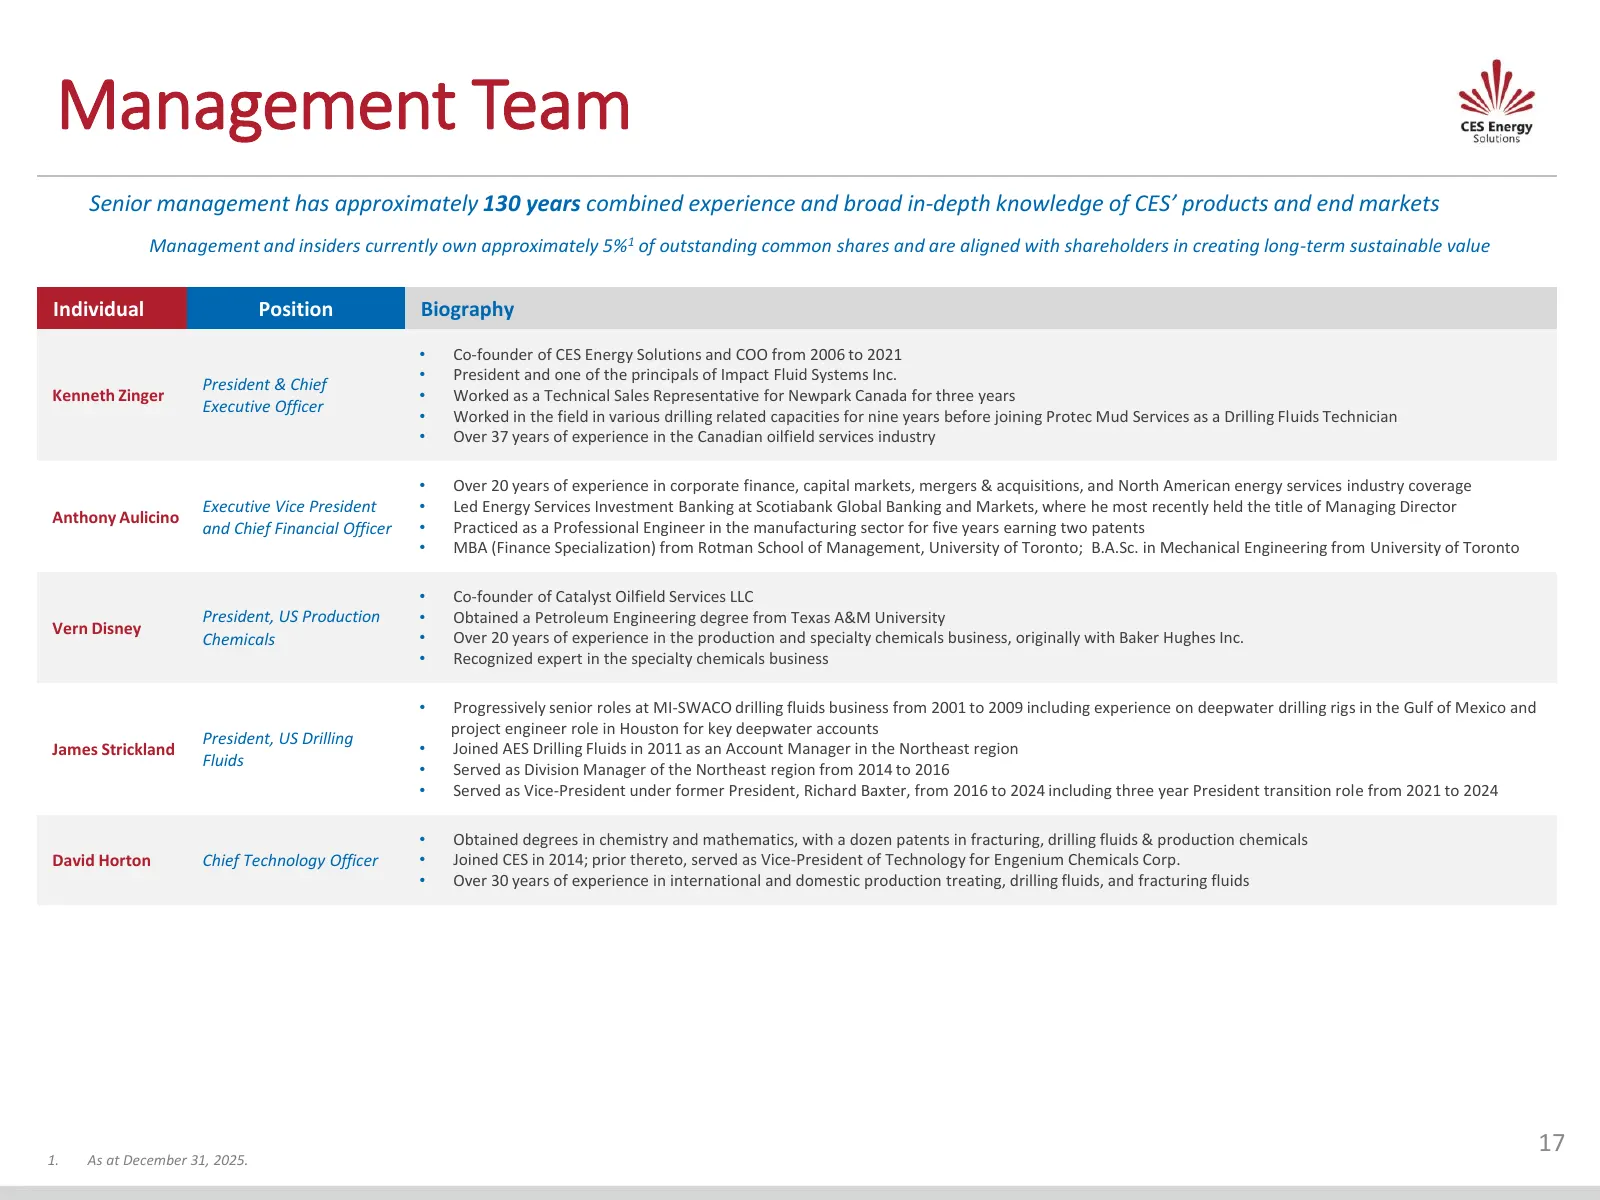
Slide 17: Management Team
Management Team Senior management has approximately 130 years combined experience and broad in-depth knowledge of CES’ products and end markets Management and insiders currently own approximately 5%1 of outstanding common shares and are aligned with shareholders in creating long-term sustainable val
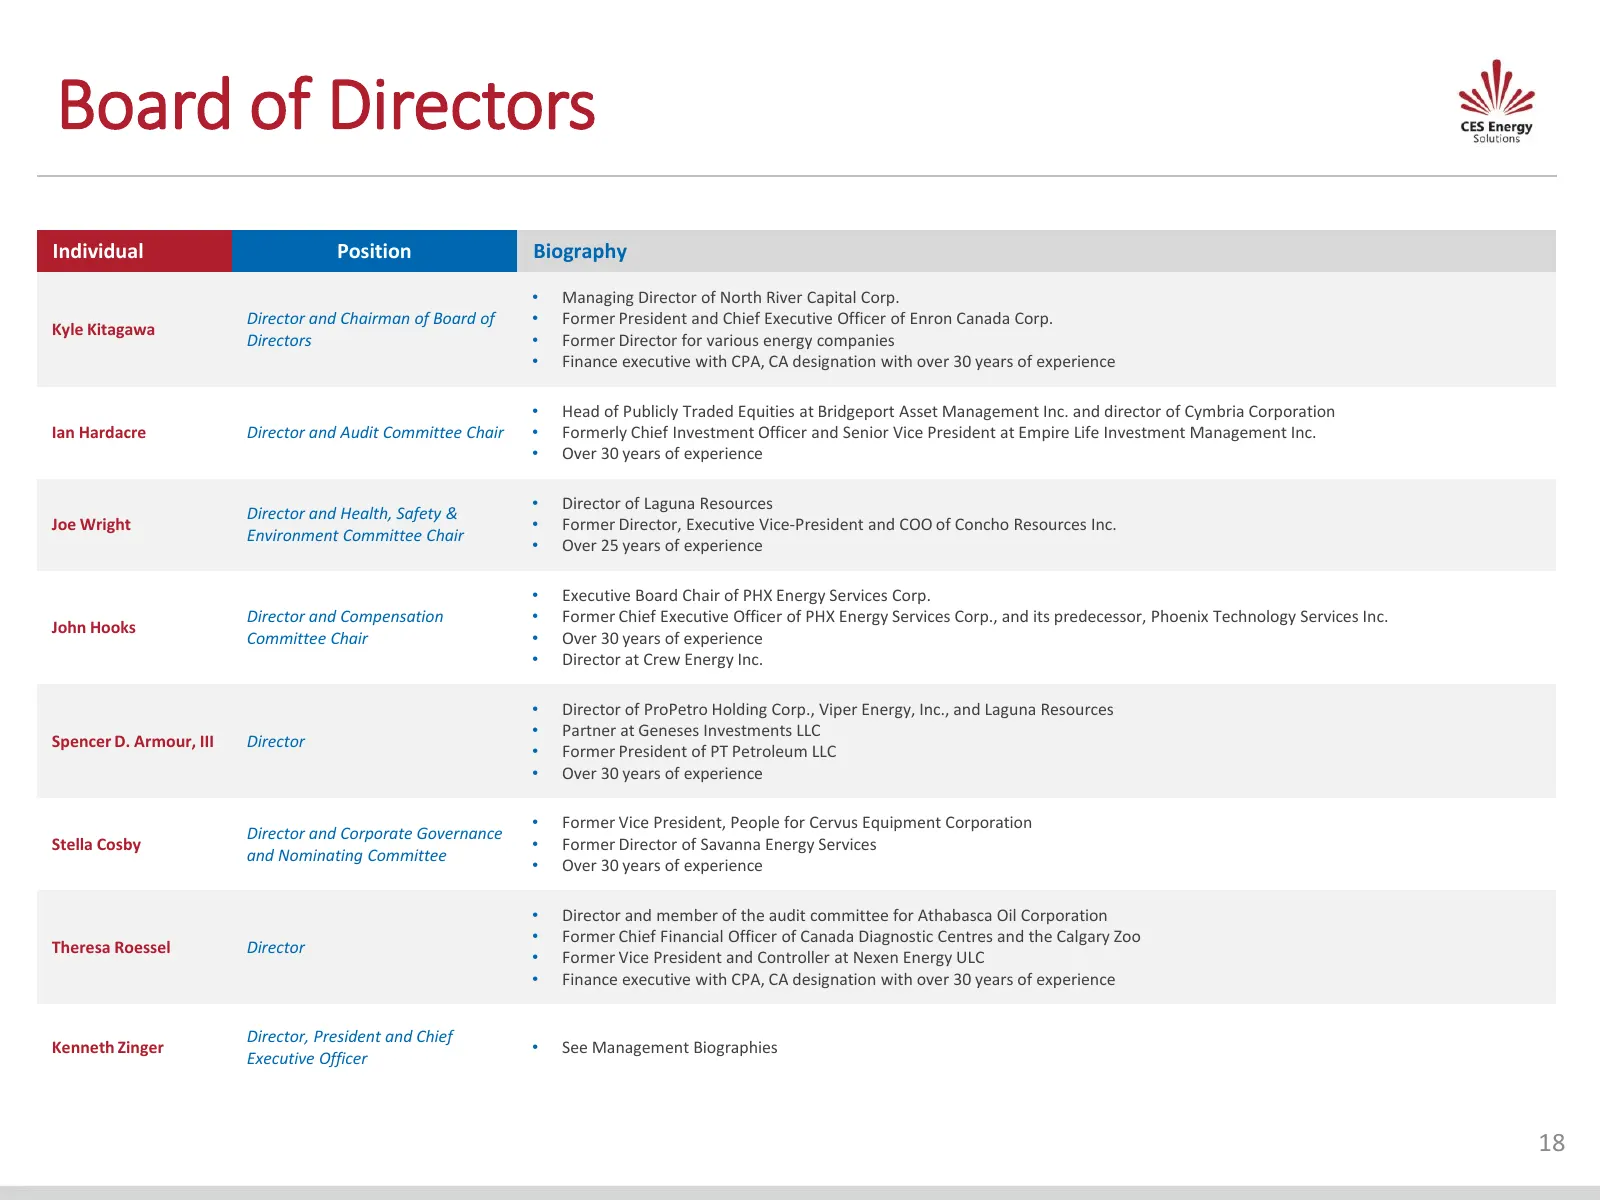
Slide 18: Board of Directors
Board of Directors Individual Position Biography • Managing Director of North River Capital Corp. Director and Chairman of Board of • Former President and Chief Executive Officer of Enron Canada Corp. Kyle Kitagawa Directors • Former Director for various energy companies • Finance executive with CPA
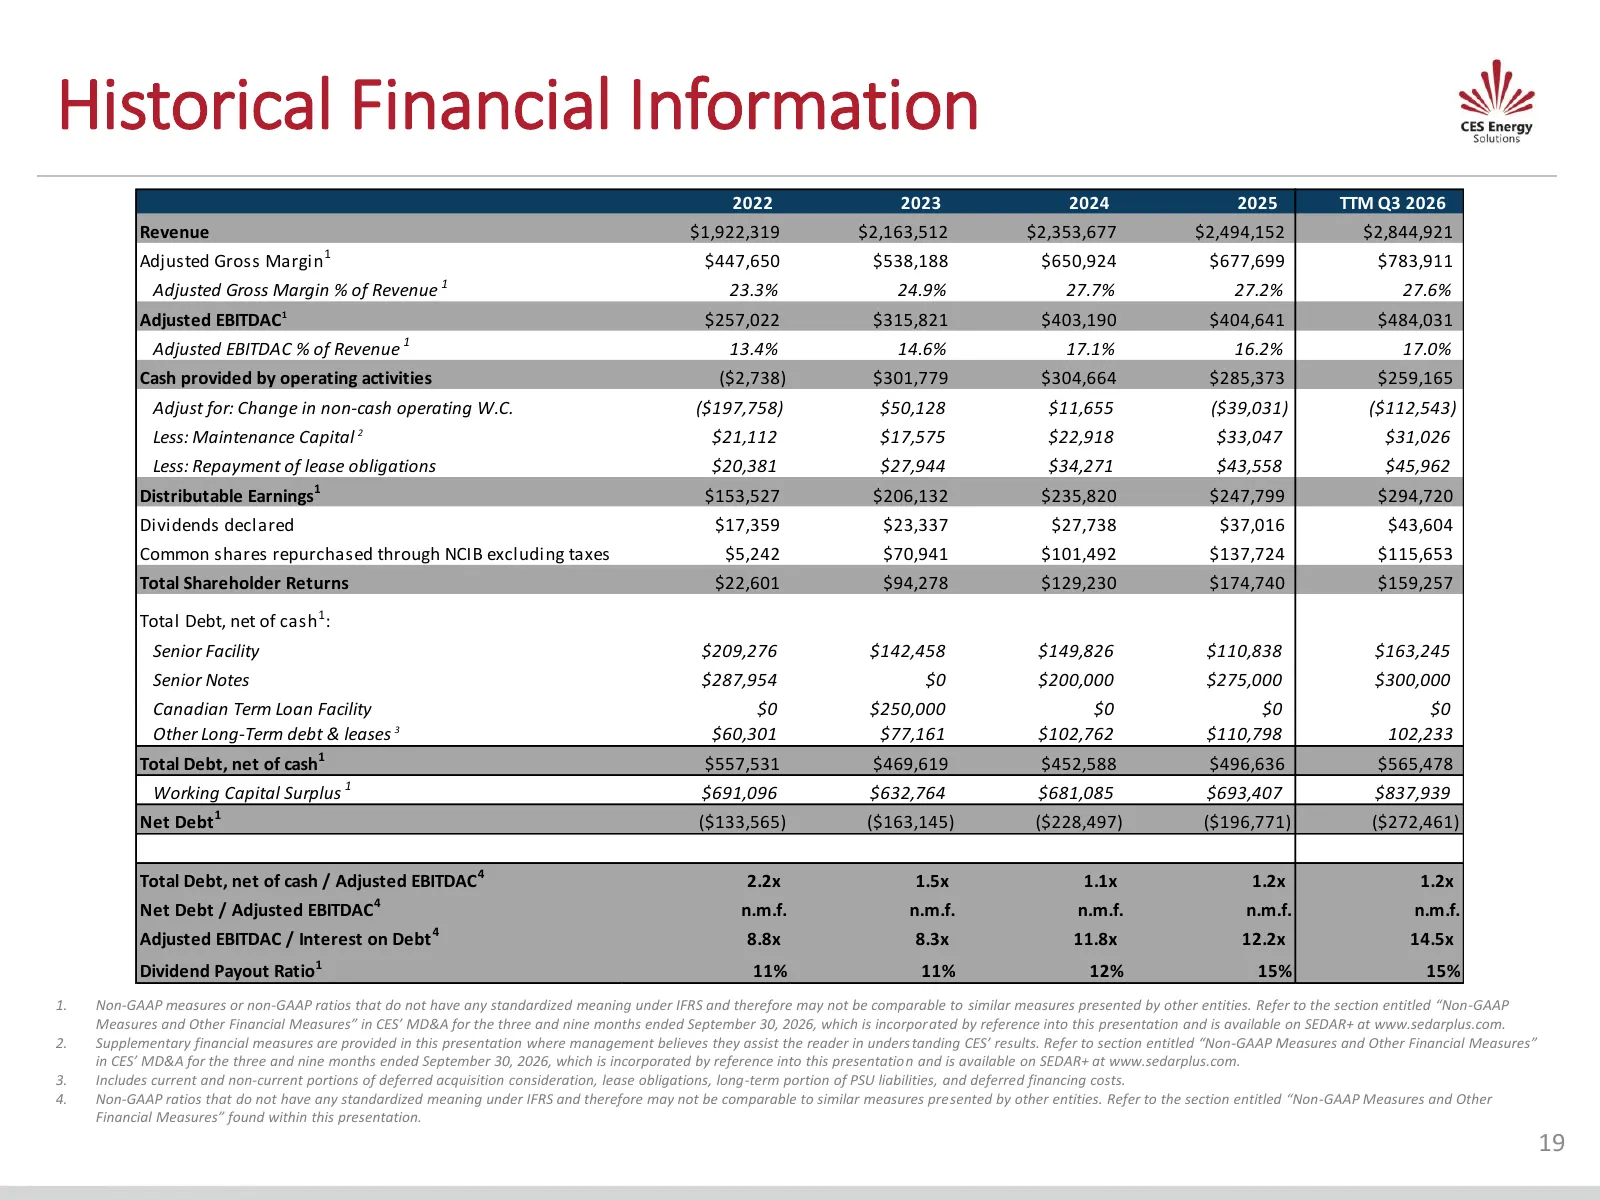
Slide 19: Historical Financial Information
Historical Financial Information 2022 2023 2024 2025 TTM Q3 2026 Revenue $1,922,319 $2,163,512 $2,353,677 $2,494,152 $2,844,921 1 Adjusted Gross Margin $447,650 $538,188 $650,924 $677,699 $783,911 Adjusted Gross Margin % of Revenue 1 23.3% 24.9% 27.7% 27.2% 27.6% Adjusted EBITDAC1 $257,022 $315,821
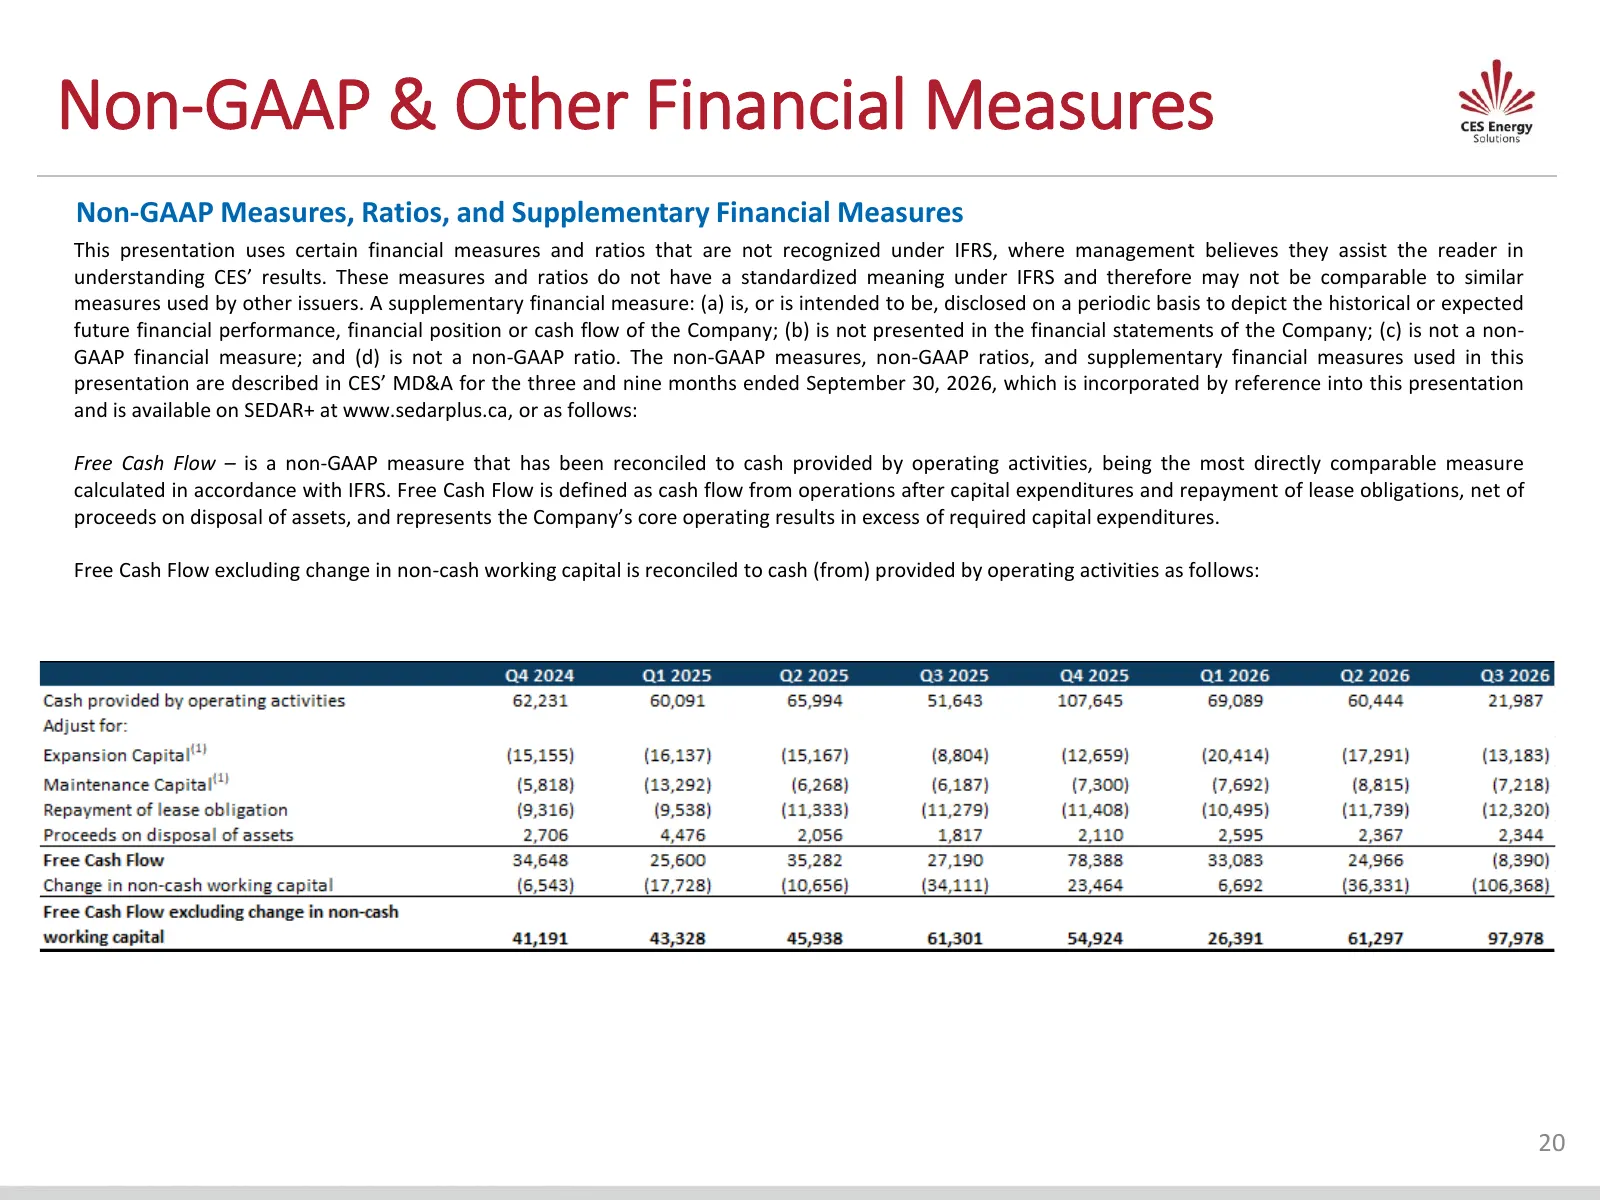
Slide 20: Non-GAAP & Other Financial Measures
Non-GAAP & Other Financial Measures Non-GAAP Measures, Ratios, and Supplementary Financial Measures This presentation uses certain financial measures and ratios that are not recognized under IFRS, where management believes they assist the reader in understanding CES’ results. These measures and rati
Slide 21: Non-GAAP & Other Financial Measures (cont.)
Non-GAAP & Other Financial Measures (cont.) Non-GAAP Measures, Ratios, and Supplementary Financial Measures Free Cash Flow / Adjusted EBITDAC - is a Non-GAAP ratio that management believes is a useful measure of the quality and convertibility of the Company's earnings, demonstrating the proportion o
Slide 22: Non-GAAP & Other Financial Measures (cont.)
Non-GAAP & Other Financial Measures (cont.) Non-GAAP Measures, Ratios, and Supplementary Financial Measures Trailing Twelve-Month Return on Invested Capital – is a Non-GAAP ratio that management believes is a useful measure of the returns generated by the Company on the capital actively invested in
Slide 23: Non-GAAP & Other Financial Measures (cont.)
Non-GAAP & Other Financial Measures (cont.) Non-GAAP Measures, Ratios, and Supplementary Financial Measures Total Debt / Adjusted EBITDAC – is a non-GAAP ratio that Management believes is a useful measure of the Company’s liquidity and leverage levels, and is calculated as Total Debt divided by Adju
Slide 24: Contact information
Contact information CES Energy Solutions Suite 1400, 332 – 6th Avenue SW Calgary, Alberta Canada T2P 0B2 T 403.269.2800 F 403.266.5708 Toll Free 1.888.785.6695 TSX | CEU WWW.CESENERGYSOLUTIONS.COM/IR 24
Source: company website
More decks from CES Energy Solutions Corp
 Investor Presentation (August 2026)24 slides · Aug 6, 2026
 Investor Presentation (May 2026)24 slides · May 7, 2026
 Q4 2025 Earnings Presentation22 slides · Mar 11, 2026
 Investor Presentation (November 2025)22 slides · Nov 13, 2025
 Investor Presentation (October 2025)22 slides · Oct 2, 2025
 Q1 2025 Earnings Presentation22 slides · May 9, 2025