Naspers Limited Class N · JSE:NPN
Naspers Limited Class N — FY2015 Earnings Presentation
39 slides from Naspers Limited Class N's earnings presentation, June 2015

Slide 1: Financial Results Presentation
Financial Results Presentation For the year ended 31 March 2015
Slide 2: Important information
Important information This presentation contains forward-looking statements as defined in the United States Private Securities Litigation Reform Act of 1995. Words such as “believe”, “anticipate”, “intend”, “seek”, “will”, “plan”, “could”, “may”, “endeavour” and similar expressions are intended to i
Slide 3: Overview Financials Internet Video Entertainment Outlook Appendix
Overview Financials Internet Video Entertainment Outlook Appendix 3
Slide 4: FY15 Overview: building technology platforms in growth markets
FY15 Overview: building technology platforms in growth markets 1 Leadership in ecommerce 2 Continue focus on fast growing segments 3 Target high growth markets 4 Transform further 5 into mobile Optimise returns 4
Slide 5: 1. Leadership in ecommerce
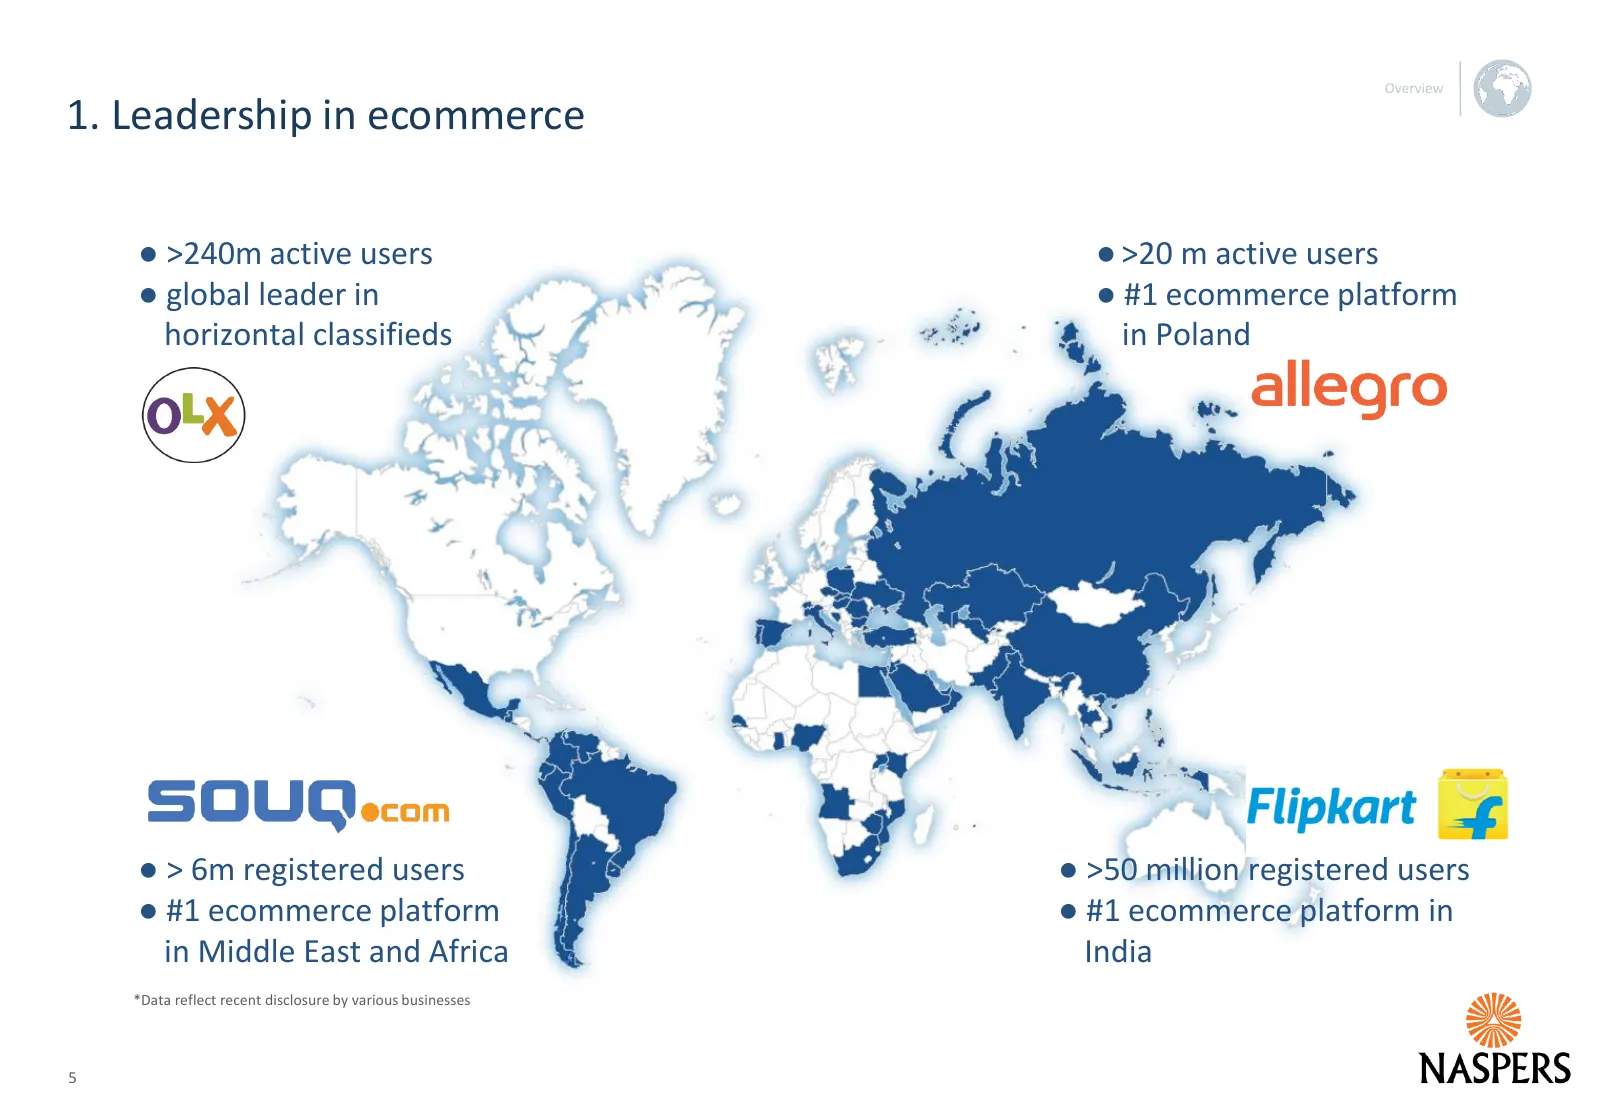
1. Leadership in ecommerce ● >240m active users ● >20 m active users ● global leader in ● #1 ecommerce platform horizontal classifieds in Poland ● > 6m registered users ● >50 million registered users ● #1 ecommerce platform ● #1 ecommerce platform in in Middle East and Africa India *Data reflect rec
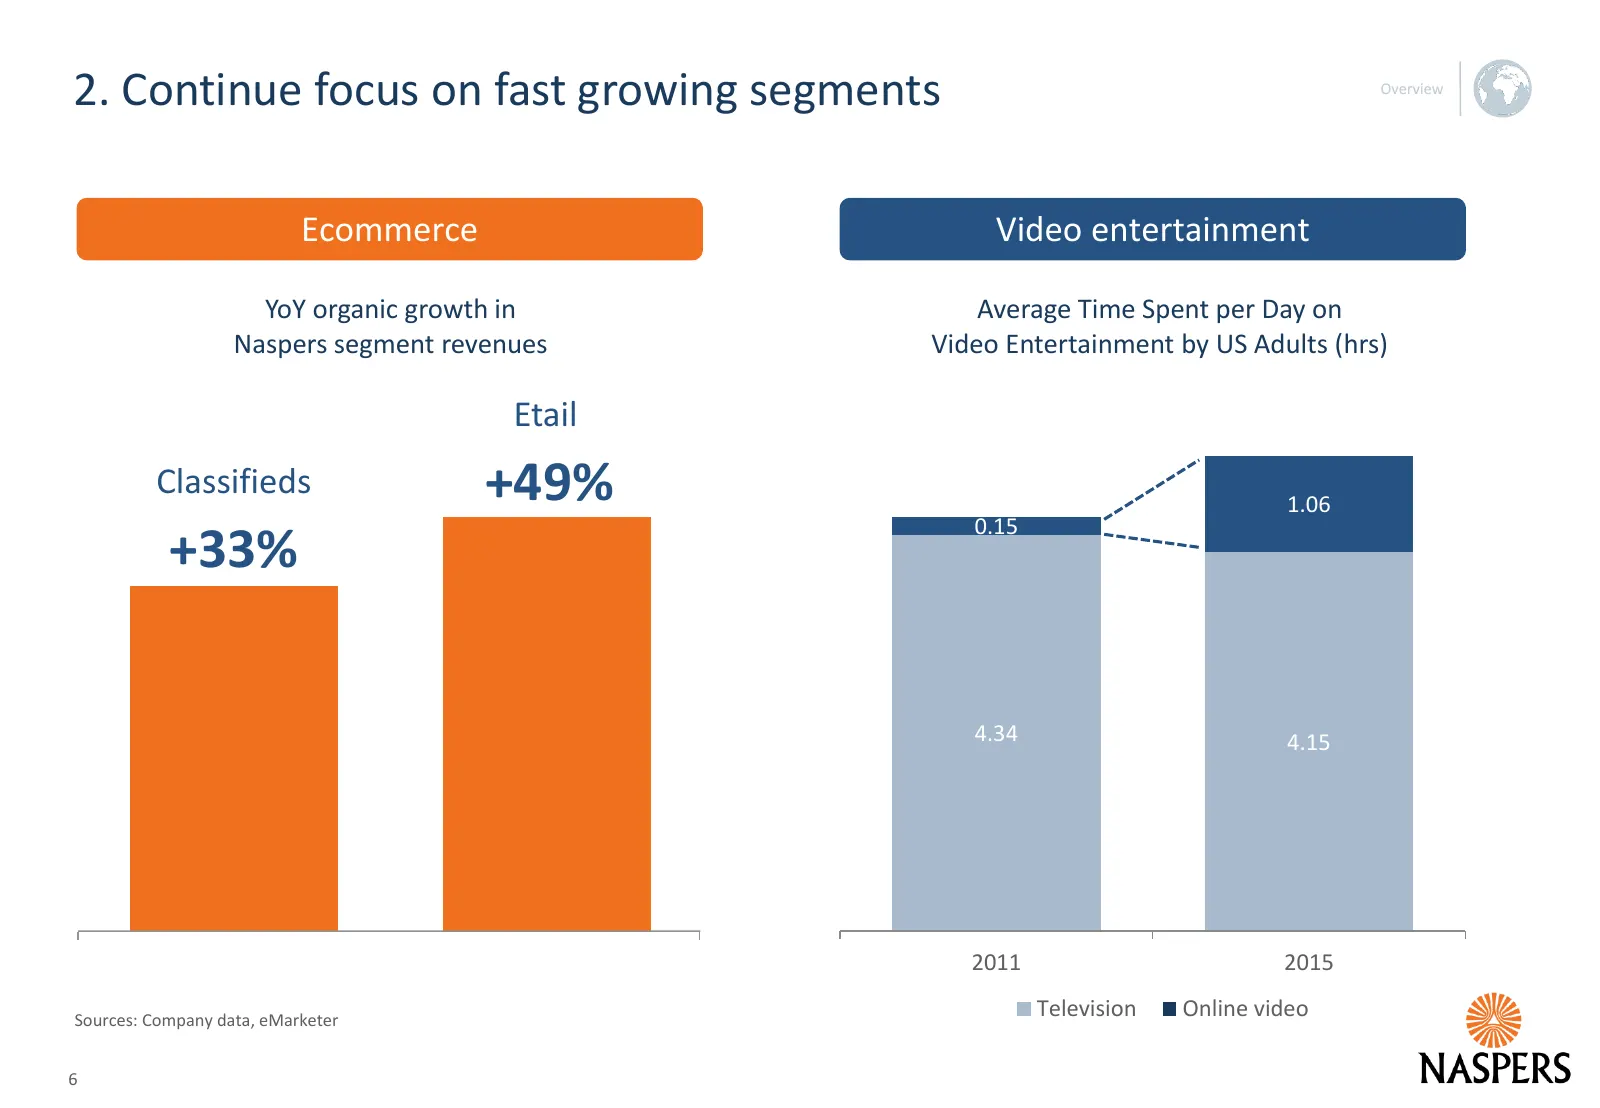
Slide 6: 2. Continue focus on fast growing segments
2. Continue focus on fast growing segments Ecommerce Video entertainment YoY organic growth in Average Time Spent per Day on Naspers segment revenues Video Entertainment by US Adults (hrs) Etail Classifieds +49% 1.06 0.15 +33% 4.34 4.15 2011 2015 Sources: Company data, eMarketer Television Online vi
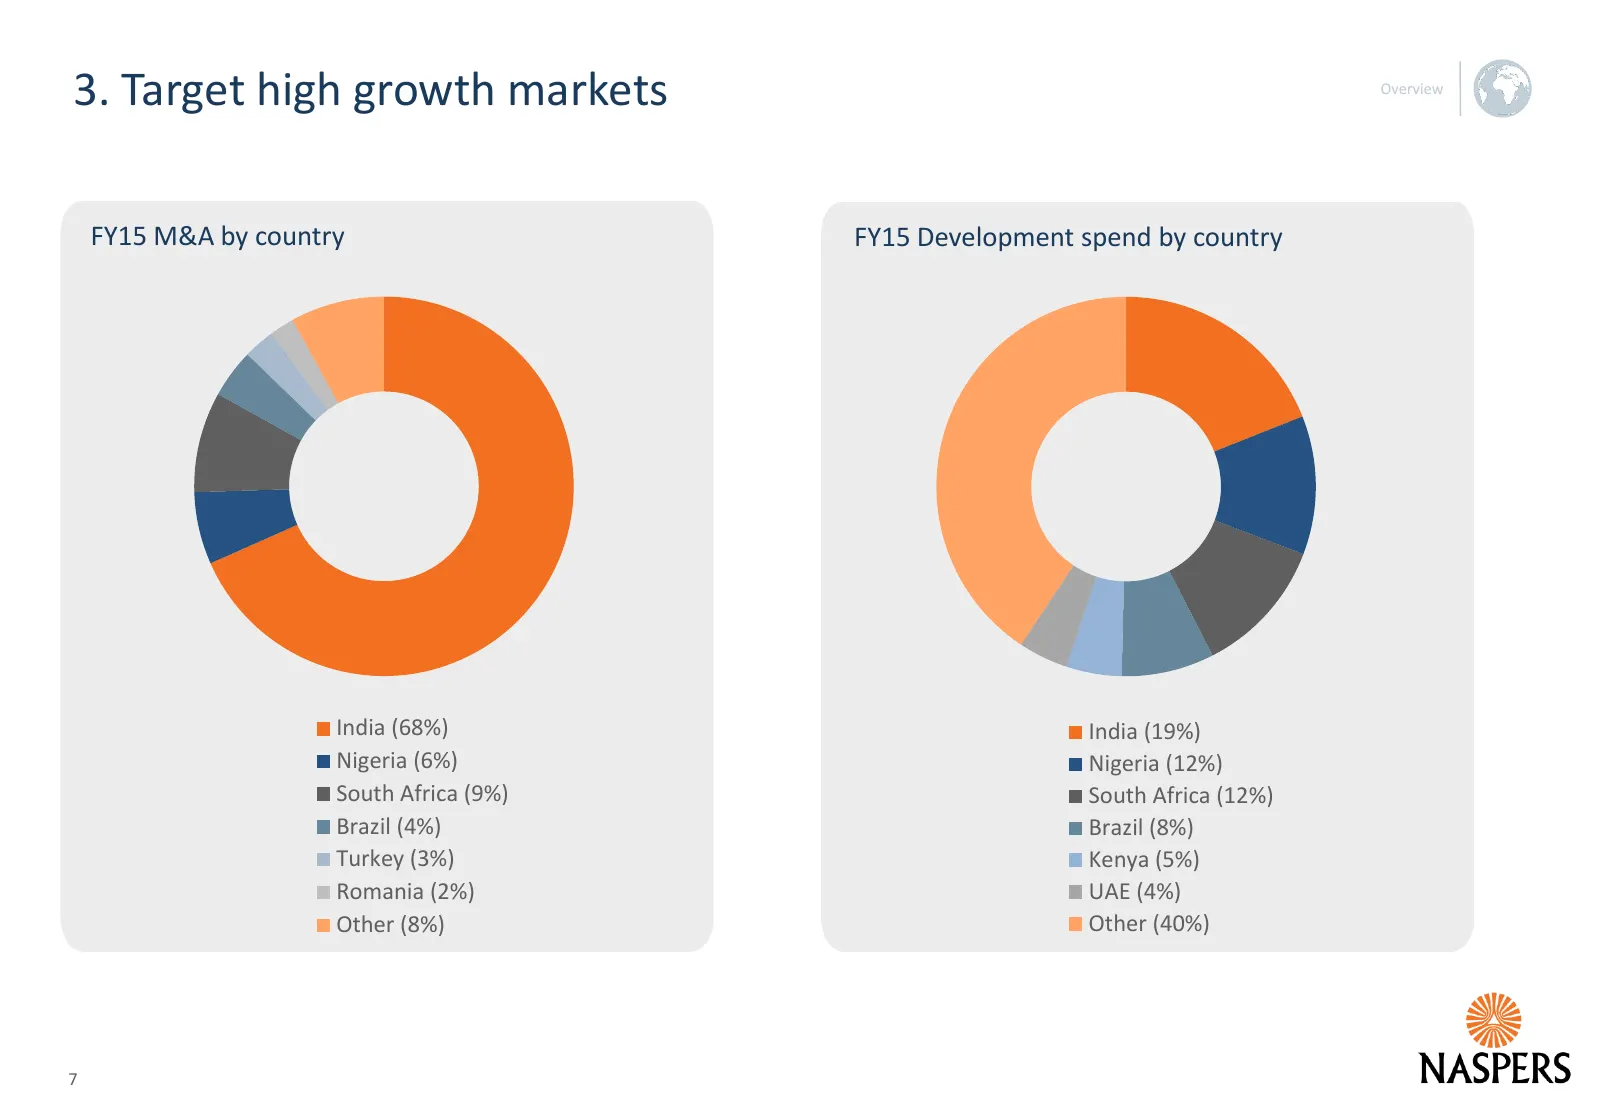
Slide 7: 3. Target high growth markets
3. Target high growth markets FY15 M&A by country FY15 Development spend by country India (68%) India (19%) Nigeria (6%) Nigeria (12%) South Africa (9%) South Africa (12%) Brazil (4%) Brazil (8%) Turkey (3%) Kenya (5%) Romania (2%) UAE (4%) Other (8%) Other (40%) 7
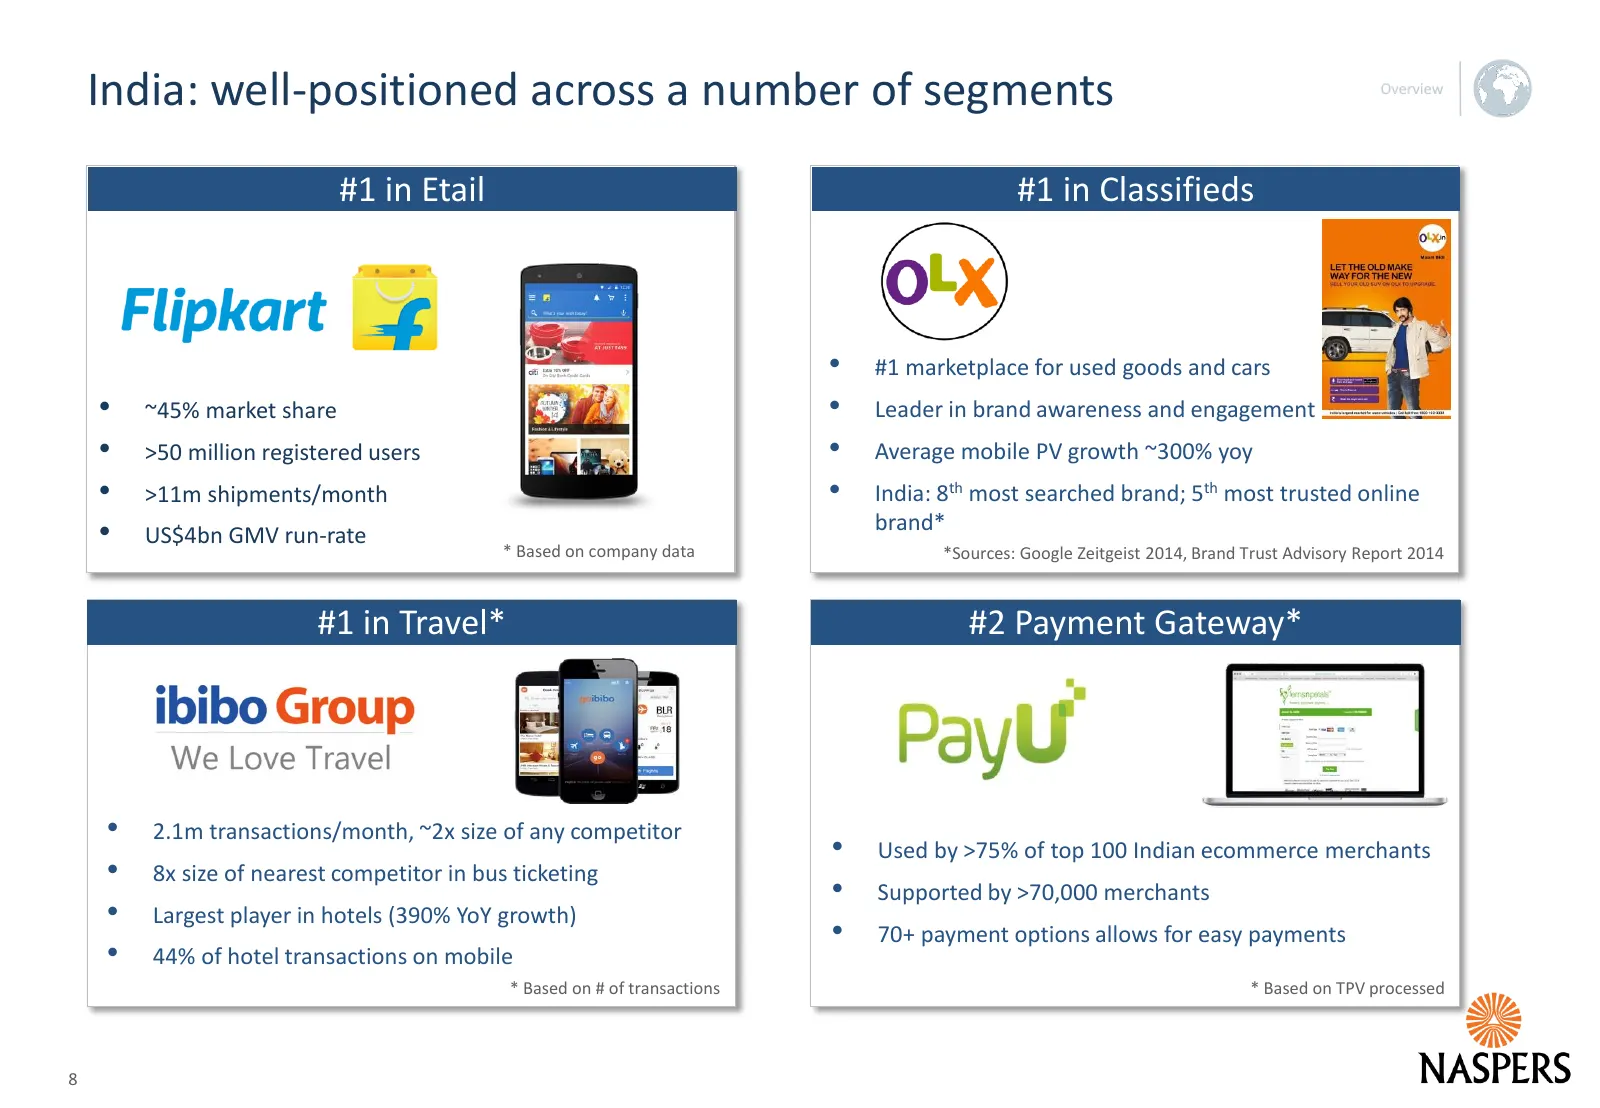
Slide 8: India: well-positioned across a number of segments
India: well-positioned across a number of segments Etail #1 in Etail Etail #1 in Classifieds • #1 marketplace for used goods and cars • ~45% market share • Leader in brand awareness and engagement • >50 million registered users • Average mobile PV growth ~300% yoy • >11m shipments/month • India: 8th
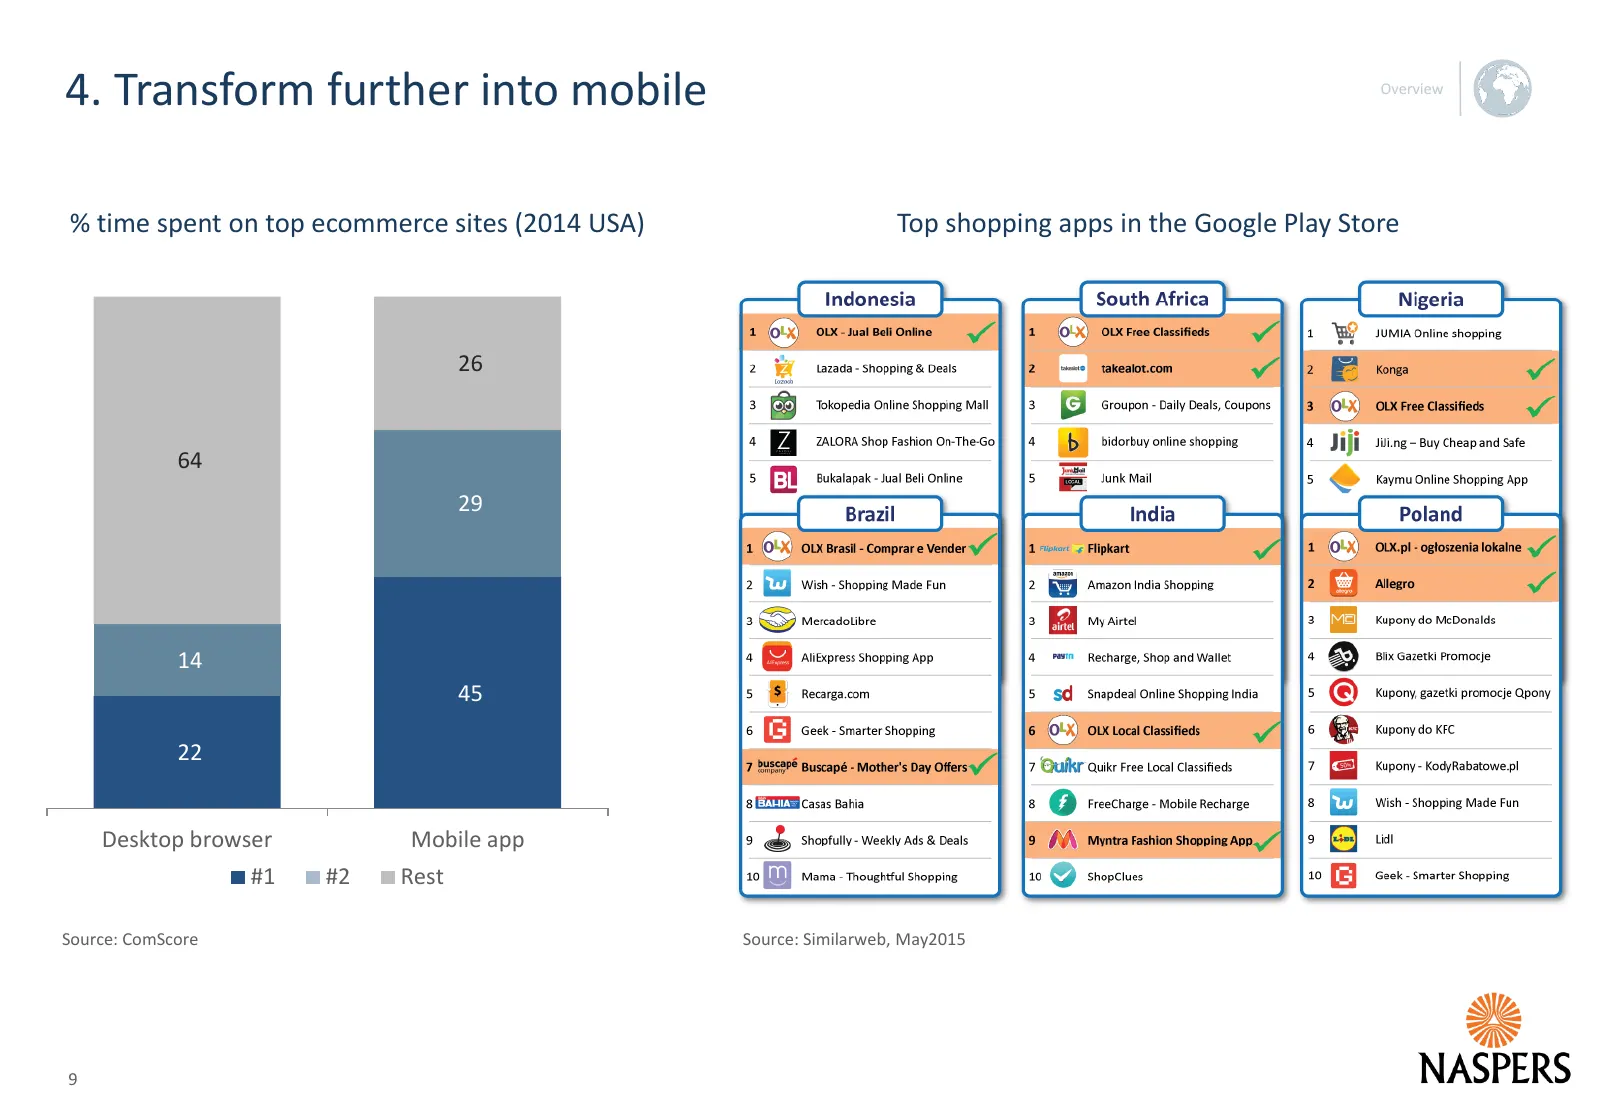
Slide 9: 4. Transform further into mobile
4. Transform further into mobile % time spent on top ecommerce sites (2014 USA) Top shopping apps in the Google Play Store 26 64 29 14 45 22 Desktop browser Mobile app #1 #2 Rest Source: ComScore Source: Similarweb, May2015 9
Slide 10: 5. Optimise returns
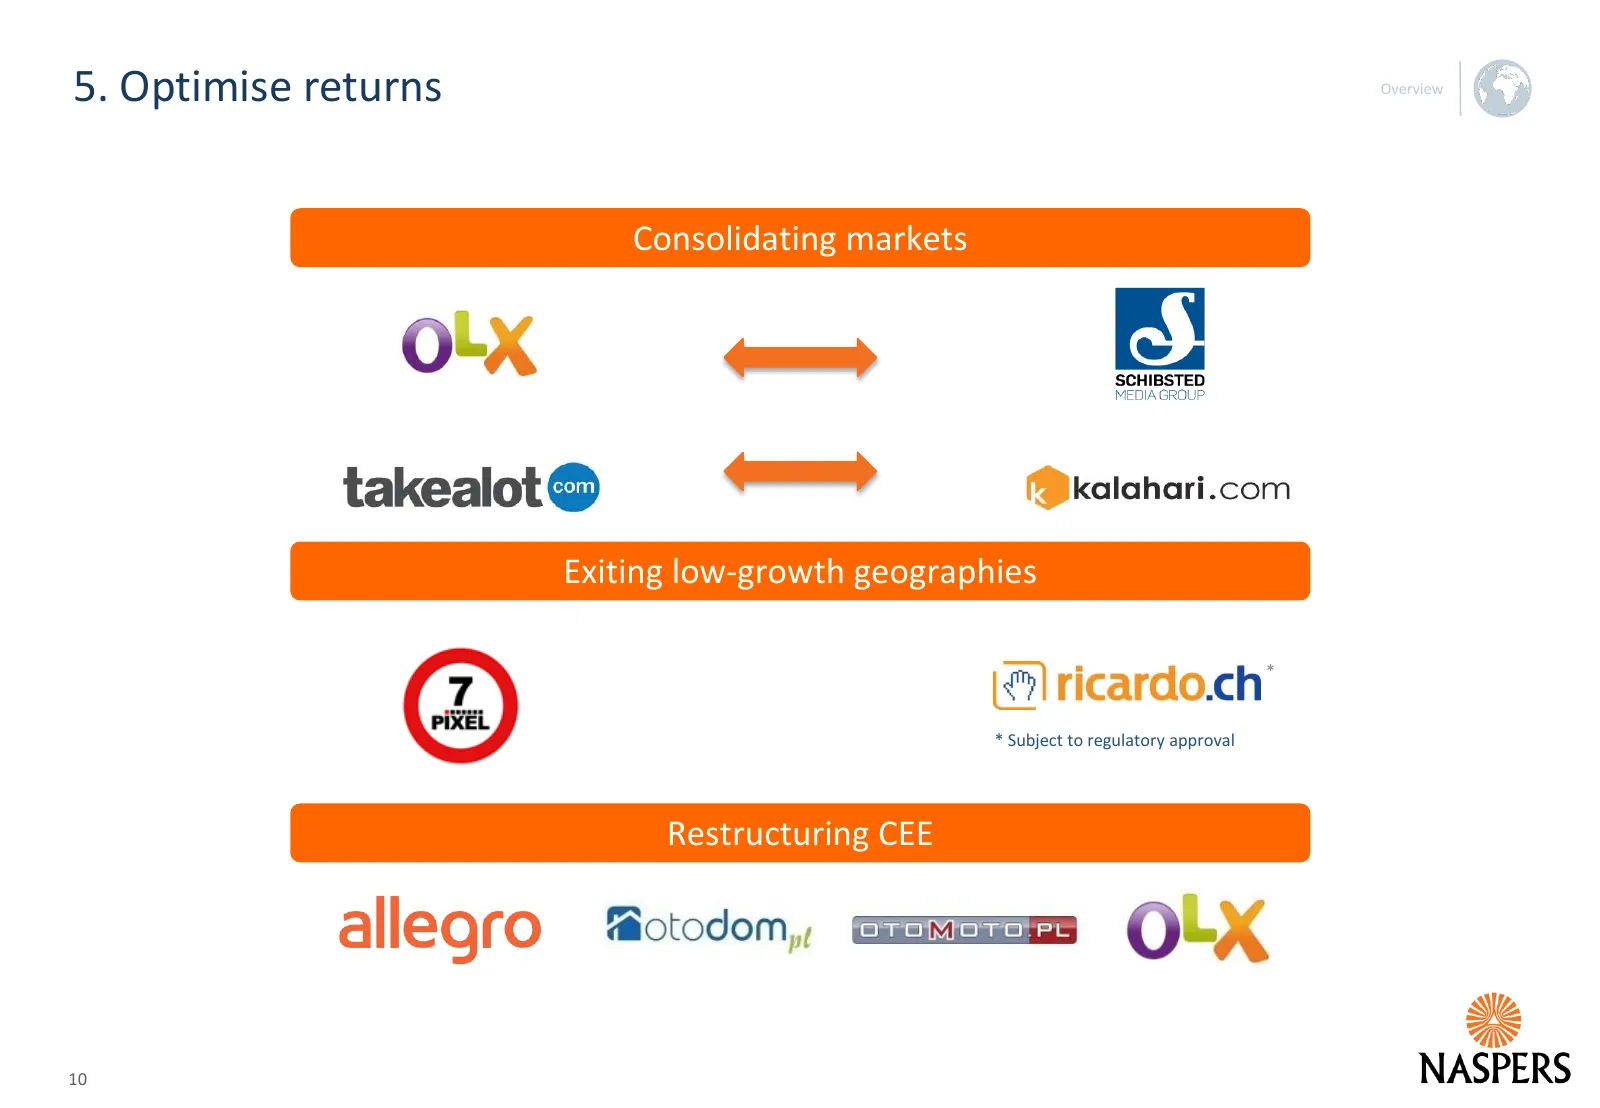
5. Optimise returns Consolidating markets Exiting low-growth geographies * * Subject to regulatory approval Restructuring CEE 10
Slide 11: Overview Financials Internet
Overview Financials Internet Video Entertainment Outlook Appendix 11
Slide 12: FY15: Synopsis of financials
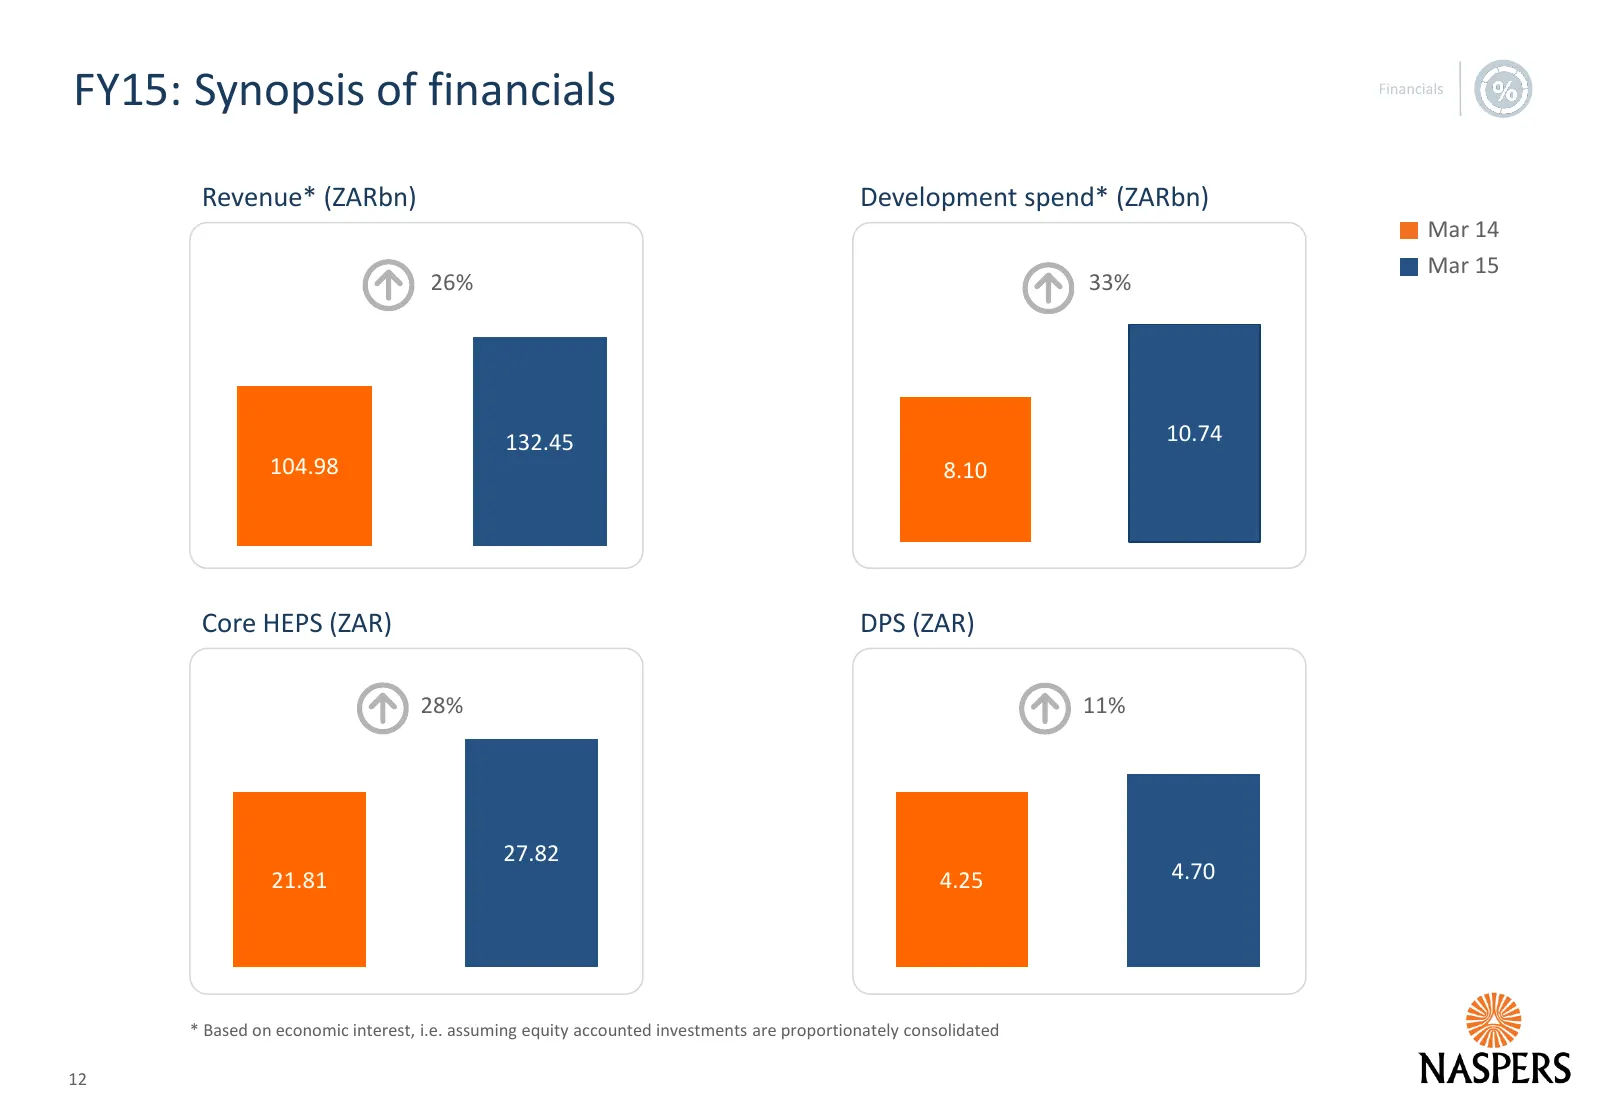
FY15: Synopsis of financials Revenue* (ZARbn) Development spend* (ZARbn) Mar 14 Mar 15 26% 33% 132.45 10.74 104.98 8.10 Core HEPS (ZAR) DPS (ZAR) 28% 11% 27.82 21.81 4.25 4.70 * Based on economic interest, i.e. assuming equity accounted investments are proportionately consolidated 12
Slide 13: Strong market positions drove solid revenue growth
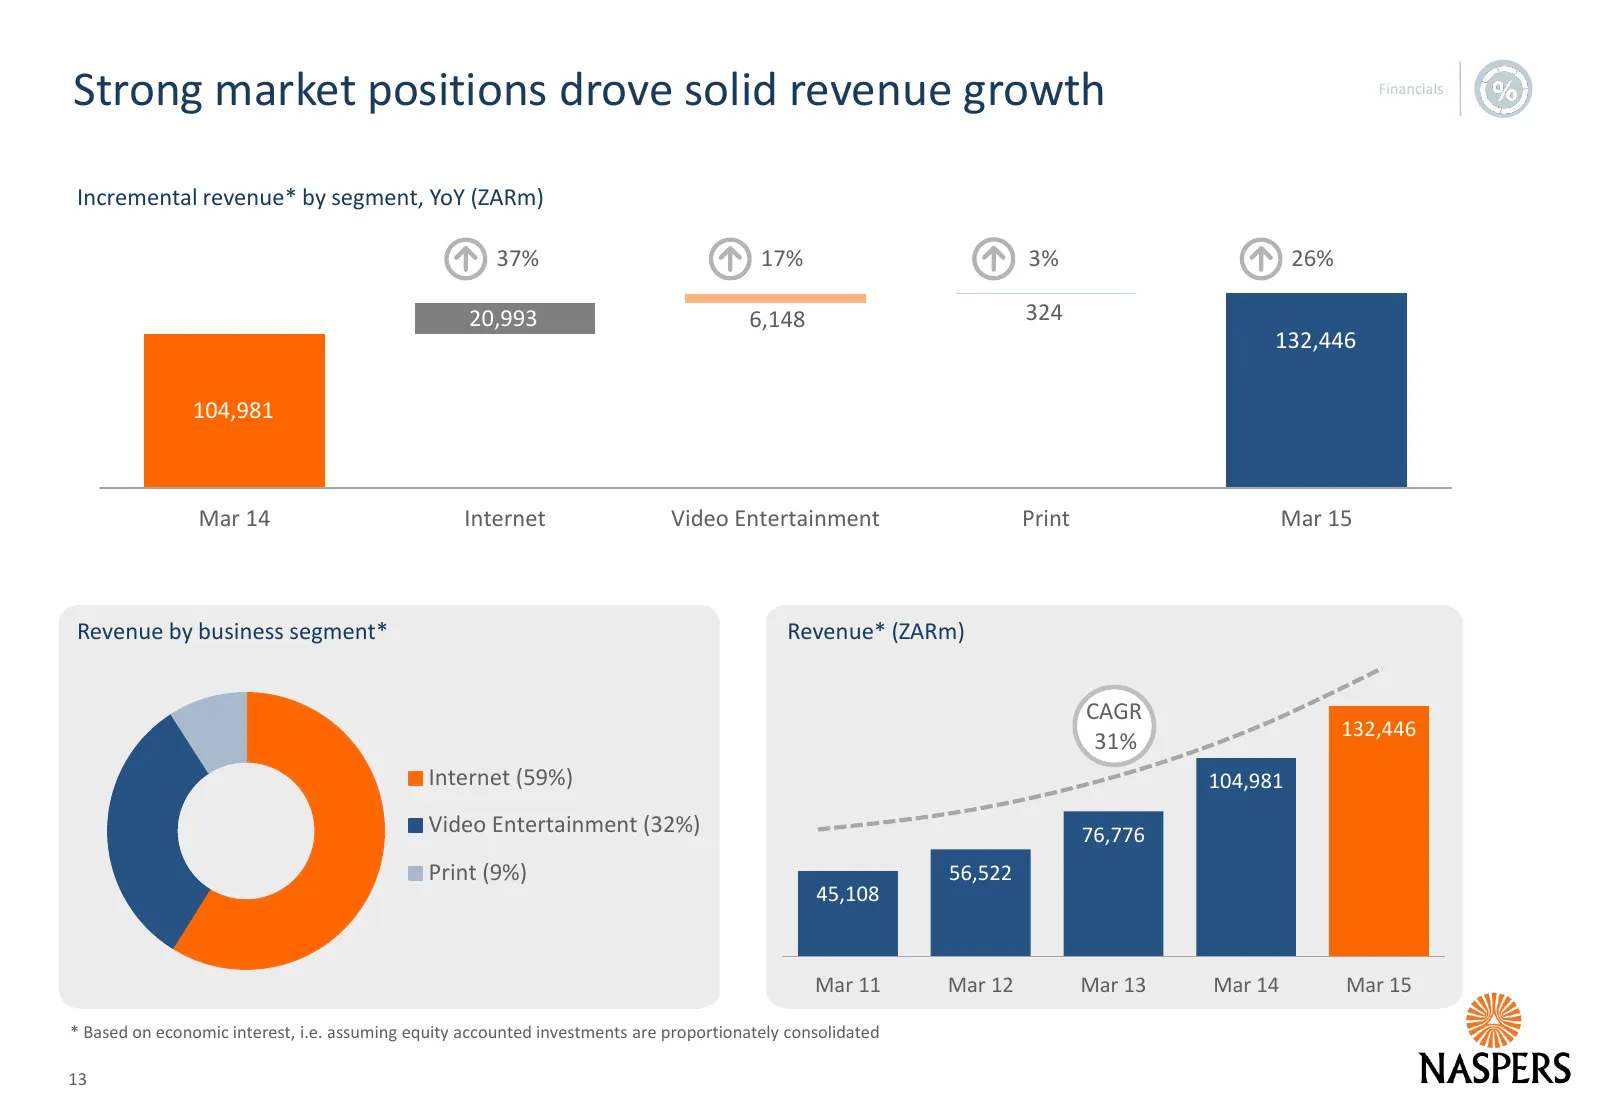
Strong market positions drove solid revenue growth Incremental revenue* by segment, YoY (ZARm) 37% 17% 3% 26% 20,993 6,148 324 132,446 132,446 104,981 Mar 14 Internet Video Entertainment Print Mar 15 Revenue by business segment* Revenue* (ZARm) CAGR 132,446 31% Internet (59%) 104,981 Video Entertain
Slide 14: Further investment in etail and DTT
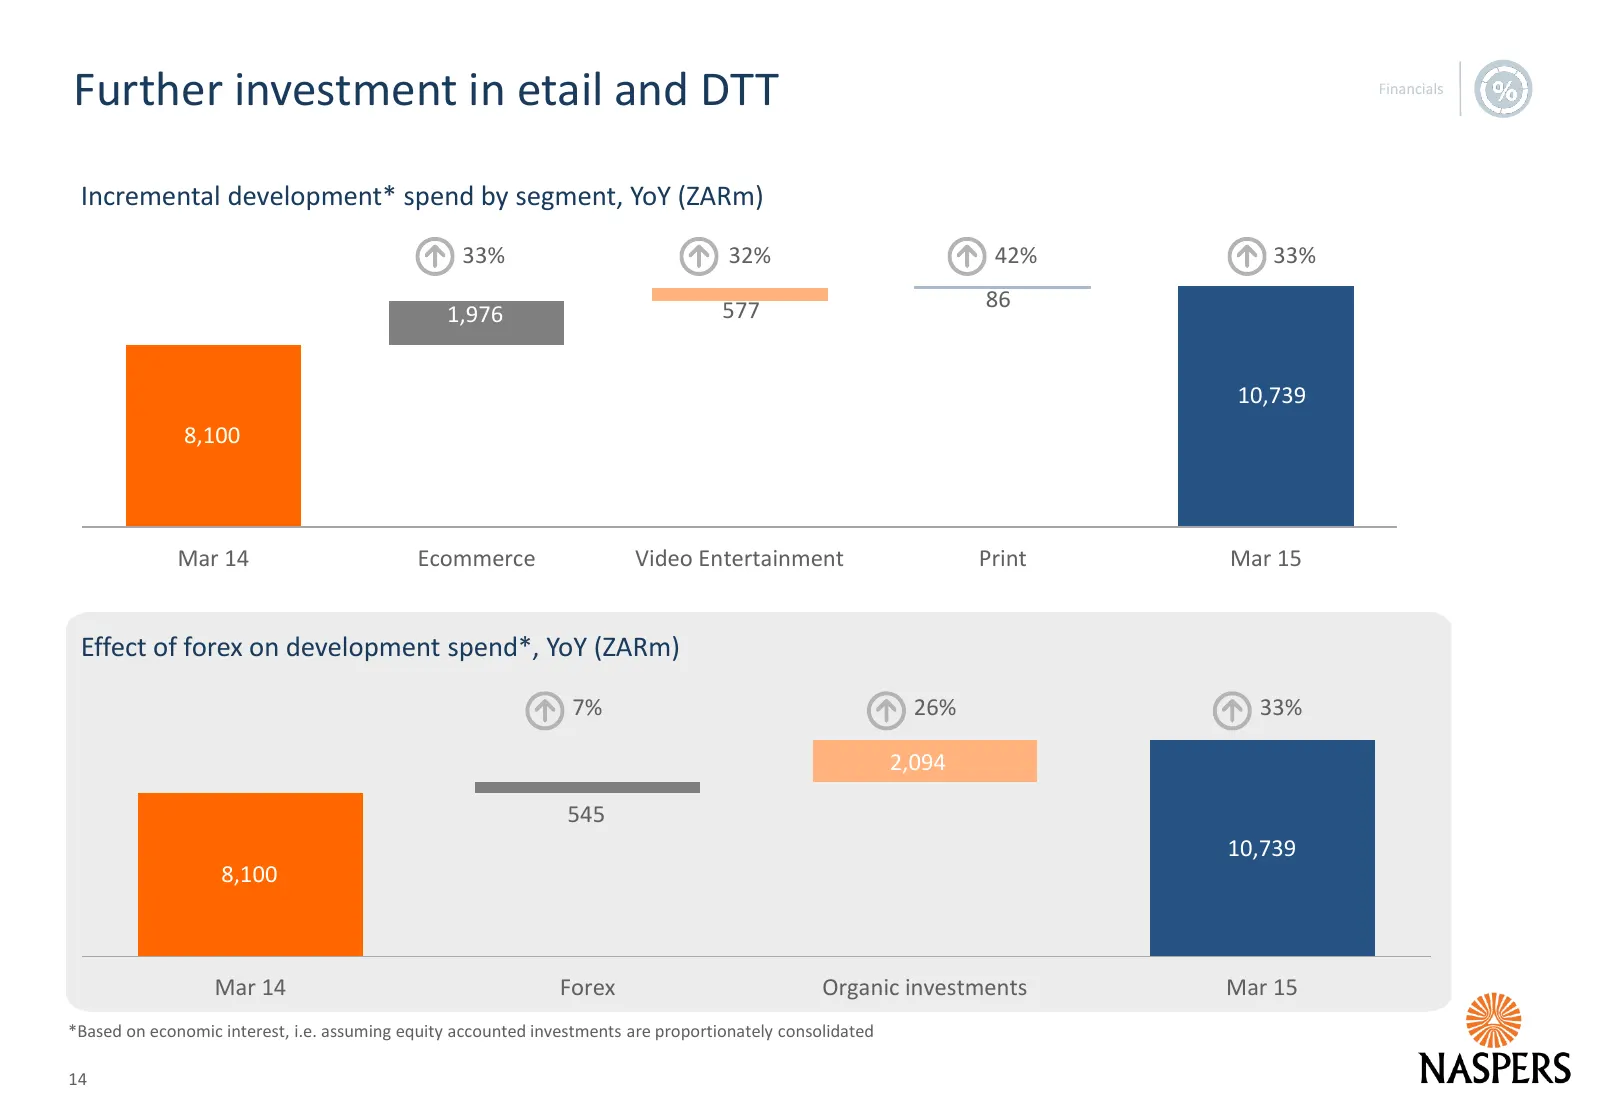
Further investment in etail and DTT Incremental development* spend by segment, YoY (ZARm) 33% 32% 42% 33% 577 86 1,976 10,739 8,100 Mar 14 Ecommerce Video Entertainment Print Mar 15 Effect of forex on development spend*, YoY (ZARm) 7% 26% 33% 2,094 545 10,739 8,100 Mar 14 Forex Organic investments M
Slide 15: Core headline earnings up 30% YoY
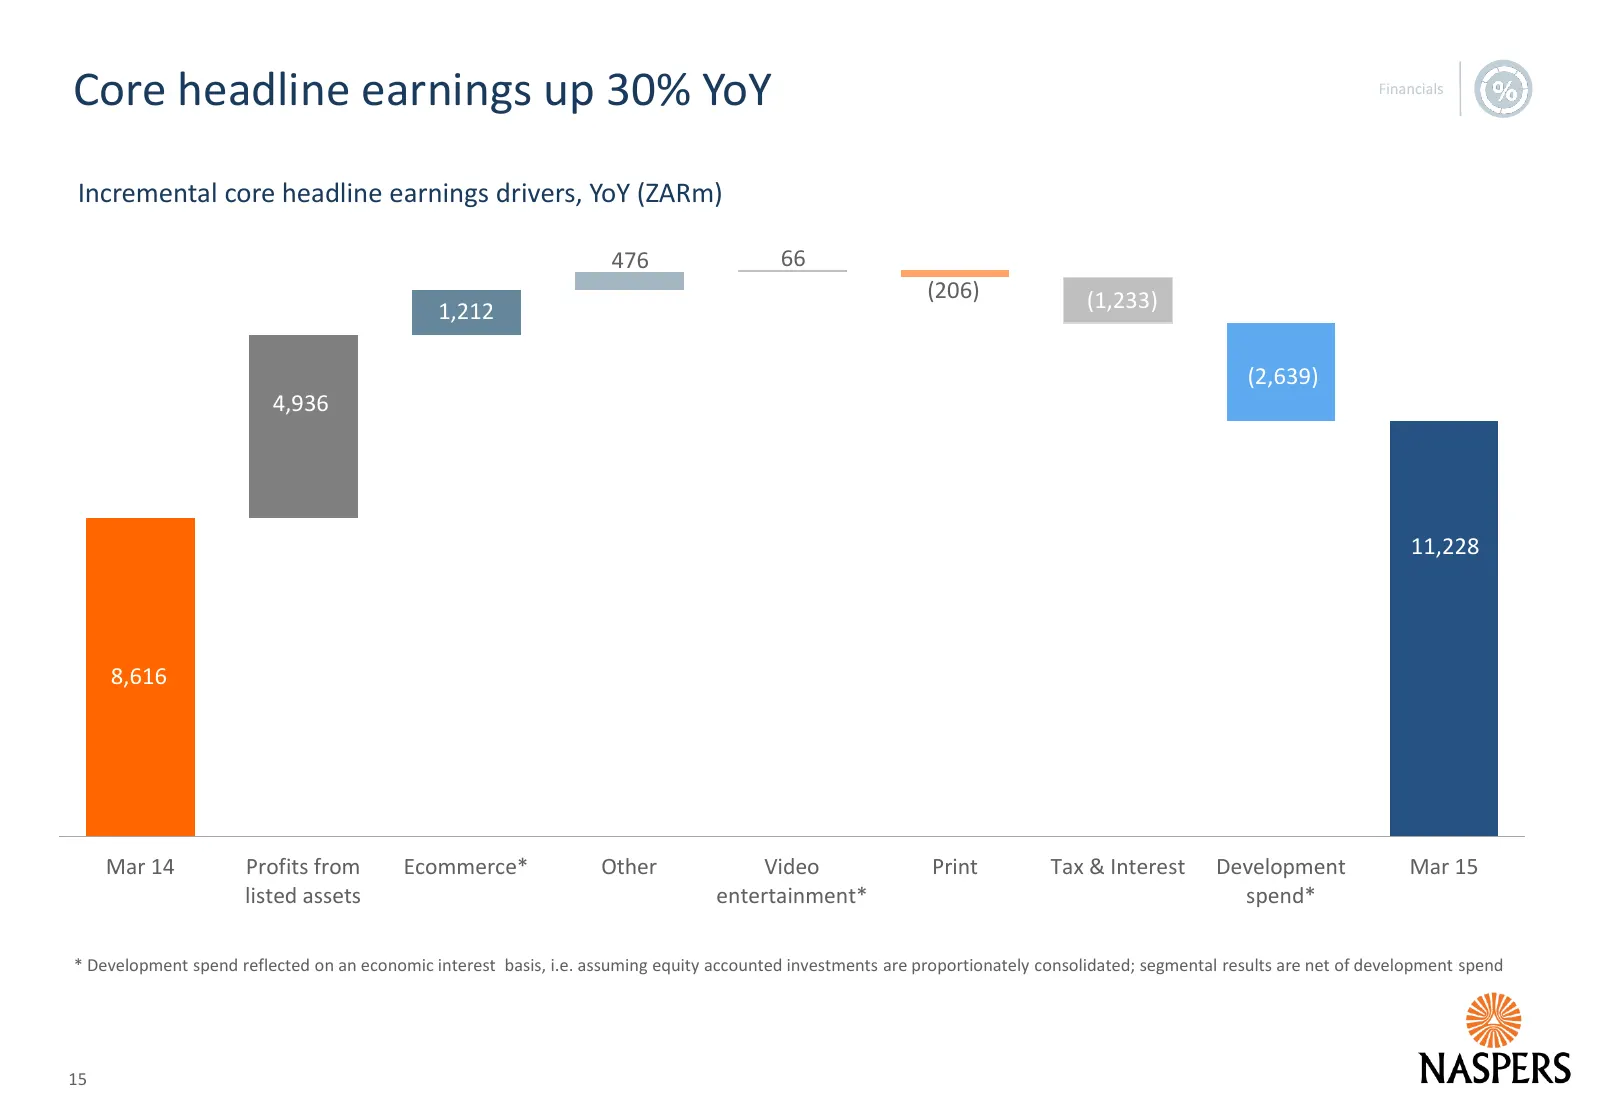
Core headline earnings up 30% YoY Incremental core headline earnings drivers, YoY (ZARm) (1,560) 476 66 (206) (1,233) 1,212 1,490 (2,639) (2,639) 4,936 11 229 5,008 11,228 8,616 Mar 14 Profits from Ecommerce* Other Video Print Tax & Interest Development Mar 15 listed assets entertainment* spend* * D
Slide 16: Summarised consolidated income statement
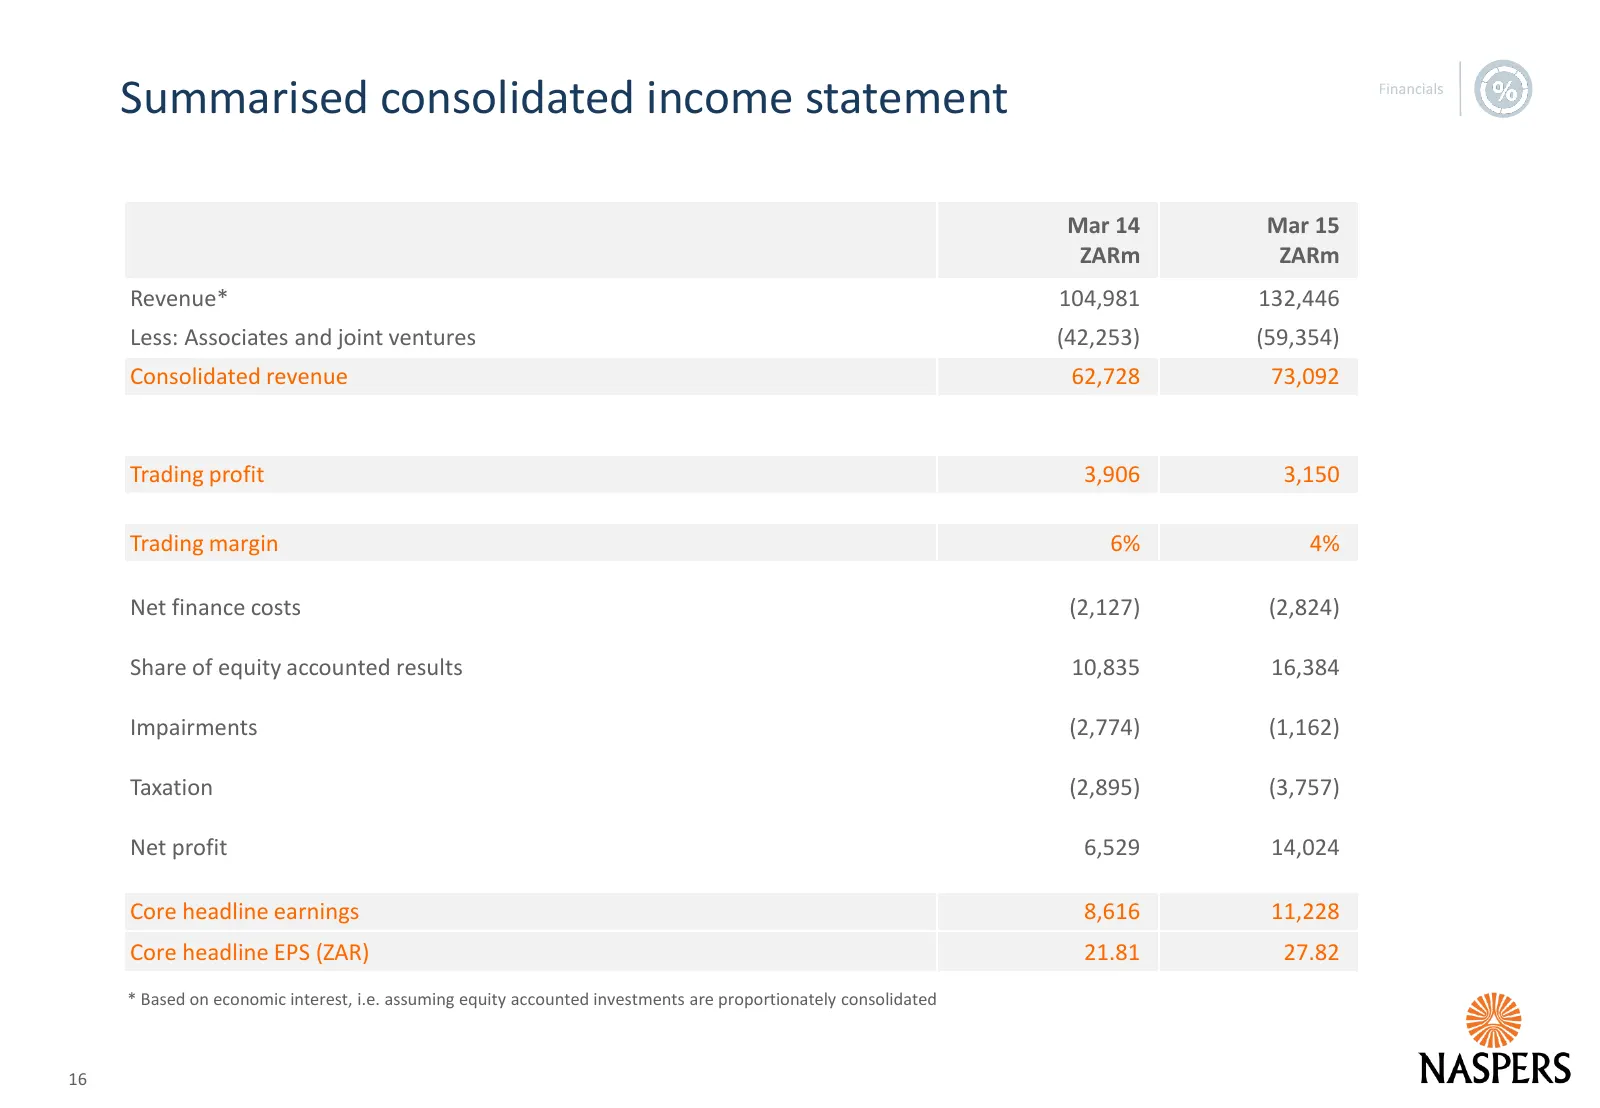
Summarised consolidated income statement Mar 14 Mar 15 ZARm ZARm Revenue* 104,981 132,446 Less: Associates and joint ventures (42,253) (59,354) Consolidated revenue 62,728 73,092 Trading profit 3,906 3,150 Trading margin 6% 4% Net finance costs (2,127) (2,824) Share of equity accounted results 10,83
Slide 17: FC outflow due to increased investment in growth
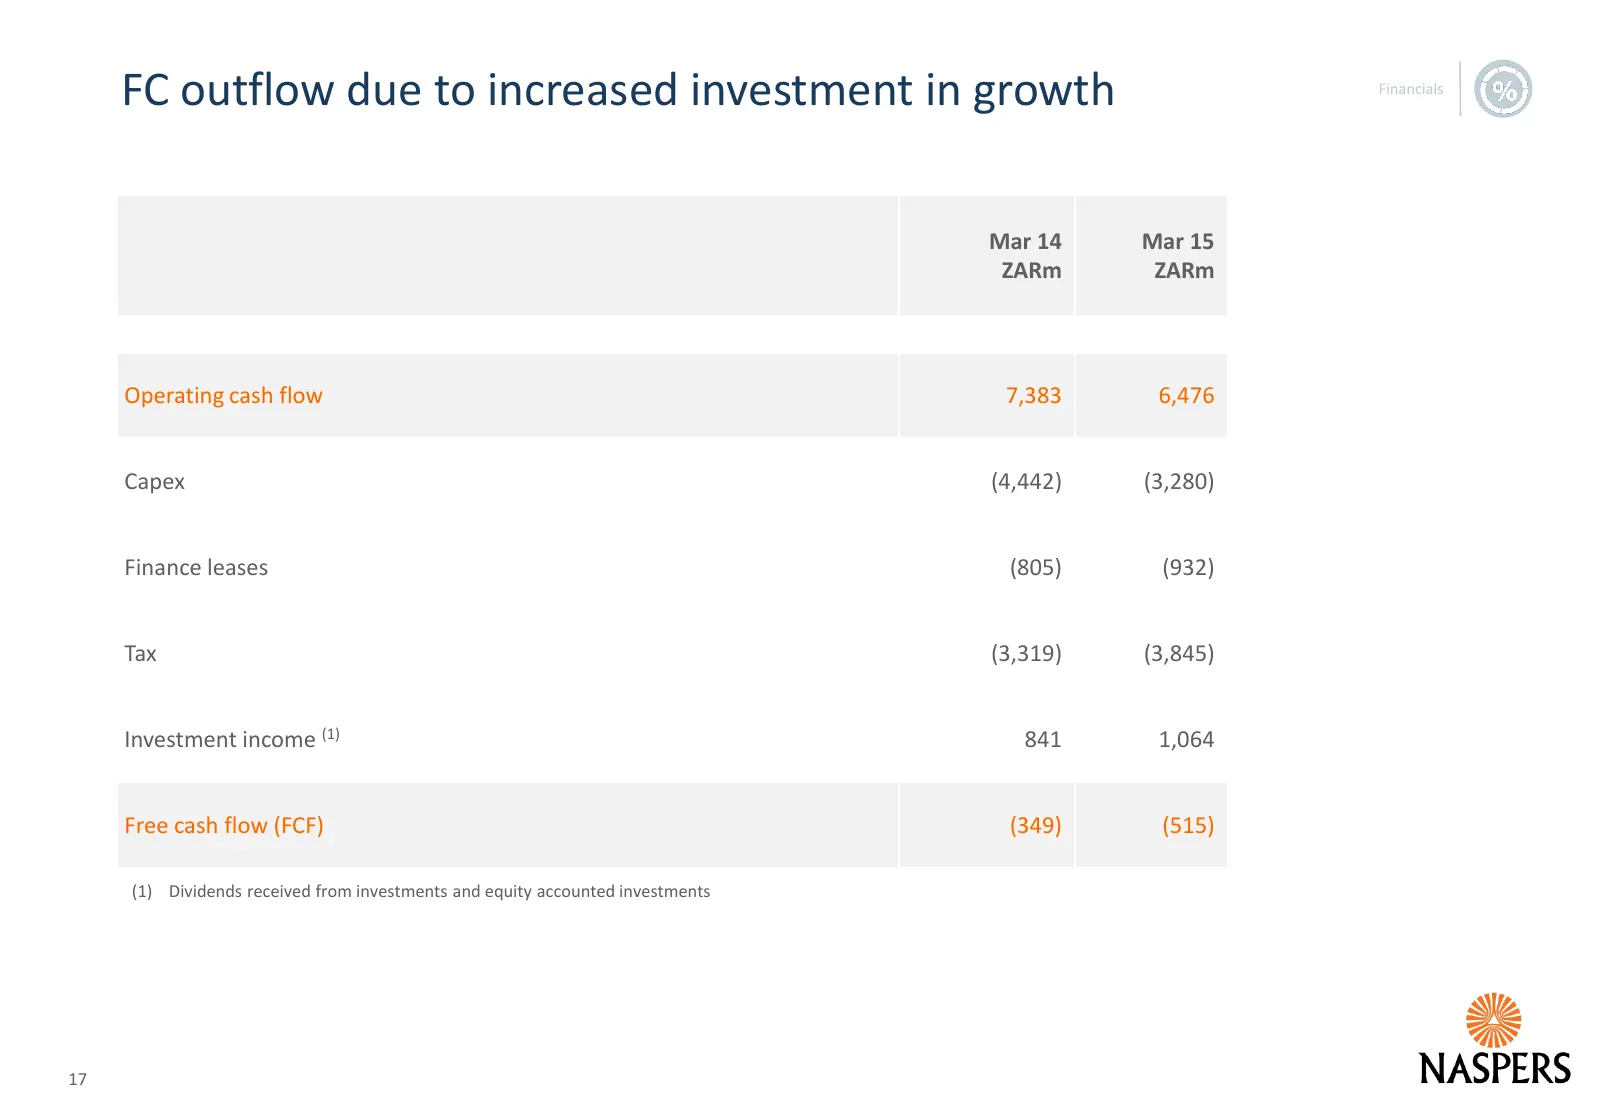
FC outflow due to increased investment in growth Mar 14 Mar 15 ZARm ZARm Operating cash flow 7,383 6,476 Capex (4,442) (3,280) Finance leases (805) (932) Tax (3,319) (3,845) Investment income (1) 841 1,064 Free cash flow (FCF) (349) (515) (1) Dividends received from investments and equity accounted
Slide 18: Balance sheet remains solid
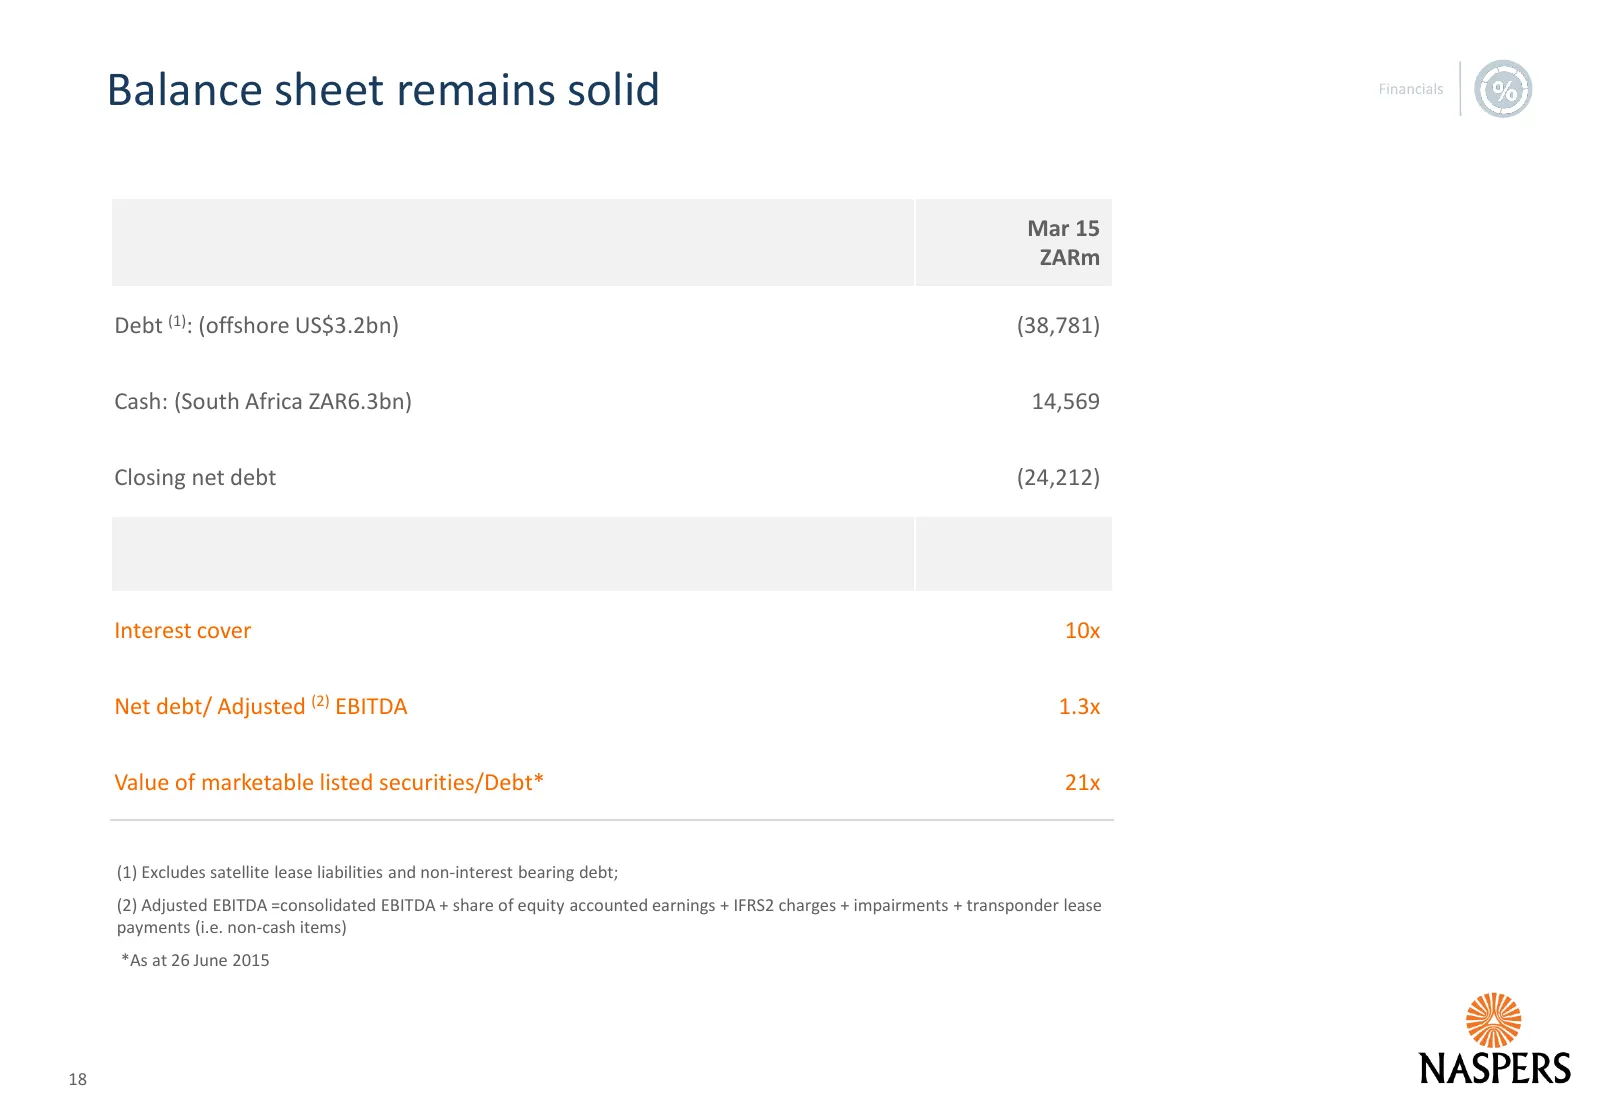
Balance sheet remains solid Mar 15 ZARm Debt (1): (offshore US$3.2bn) (38,781) Cash: (South Africa ZAR6.3bn) 14,569 Closing net debt (24,212) Interest cover 10x Net debt/ Adjusted (2) EBITDA 1.3x Value of marketable listed securities/Debt* 21x (1) Excludes satellite lease liabilities and non-interes
Slide 19: Overview Financials Internet
Overview Financials Internet Video Entertainment Outlook Appendix 19
Slide 20: Ecommerce: expansive global footprint
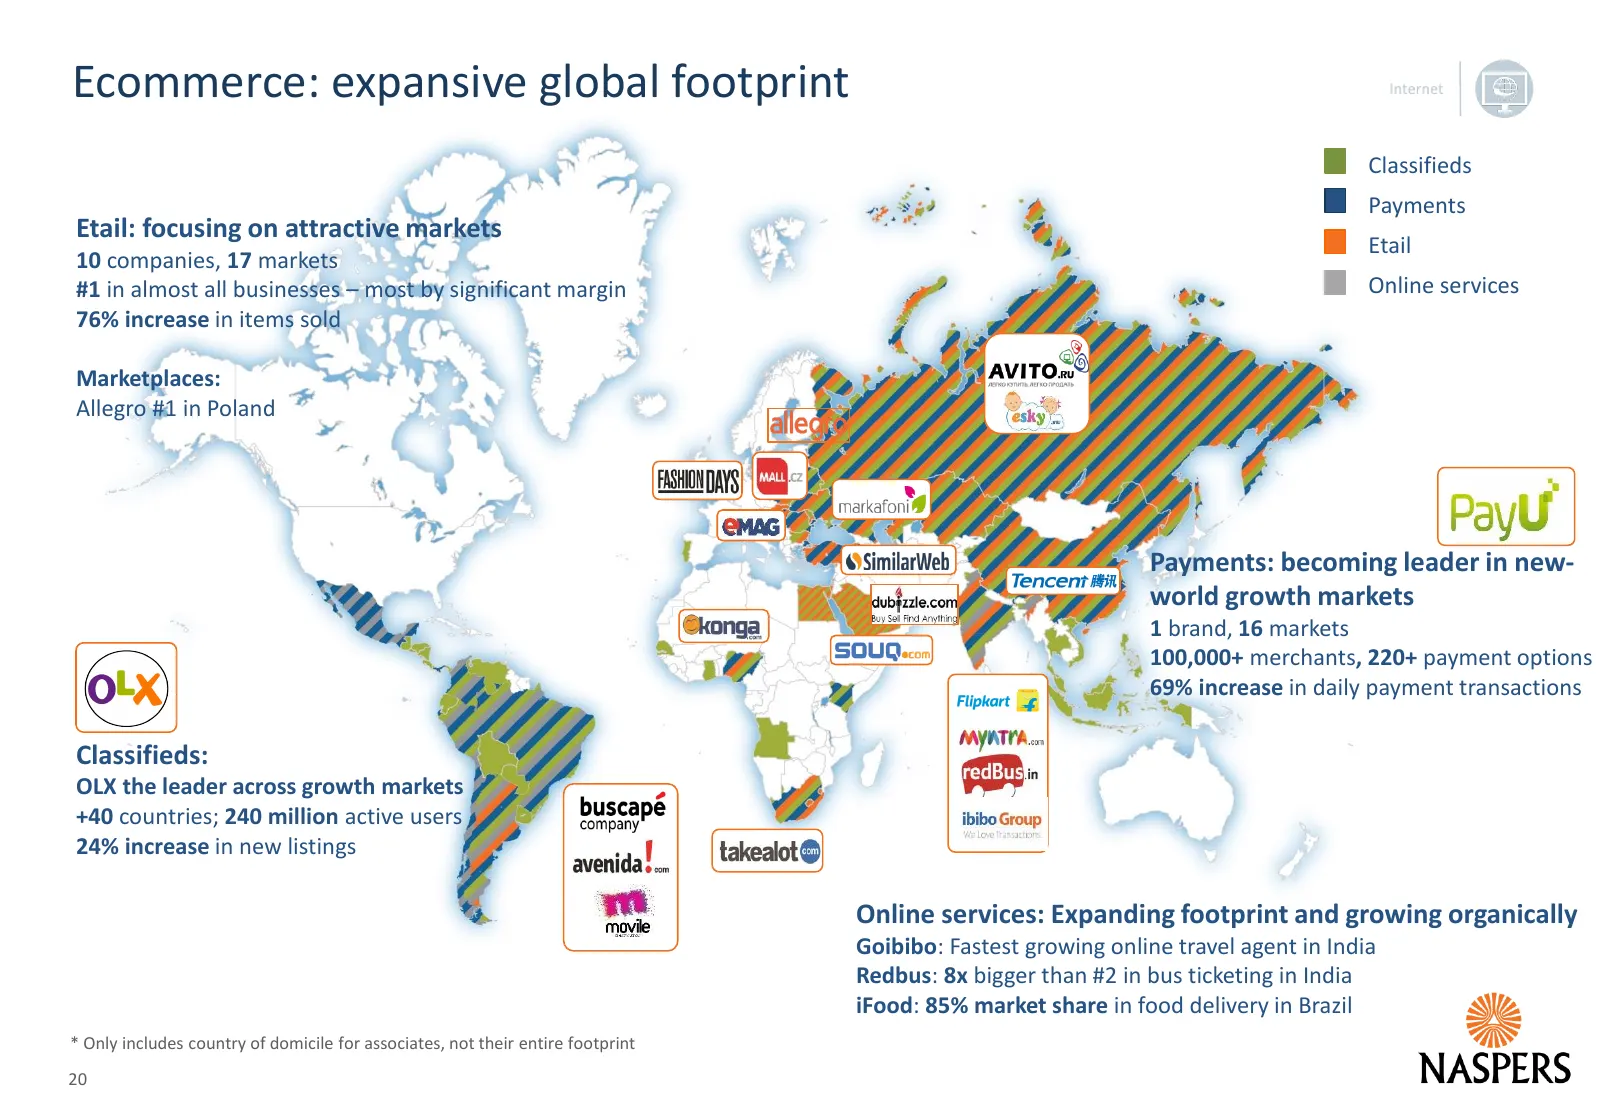
Ecommerce: expansive global footprint Classifieds ETAIL Payments Etail: focusing on attractive markets Etail 10 companies, 17 markets #1 in almost all businesses – most by significant margin Online services 76% increase in items sold Marketplaces: Allegro #1 in Poland Payments: becoming leader in ne
Slide 21: Ecommerce: segment overview
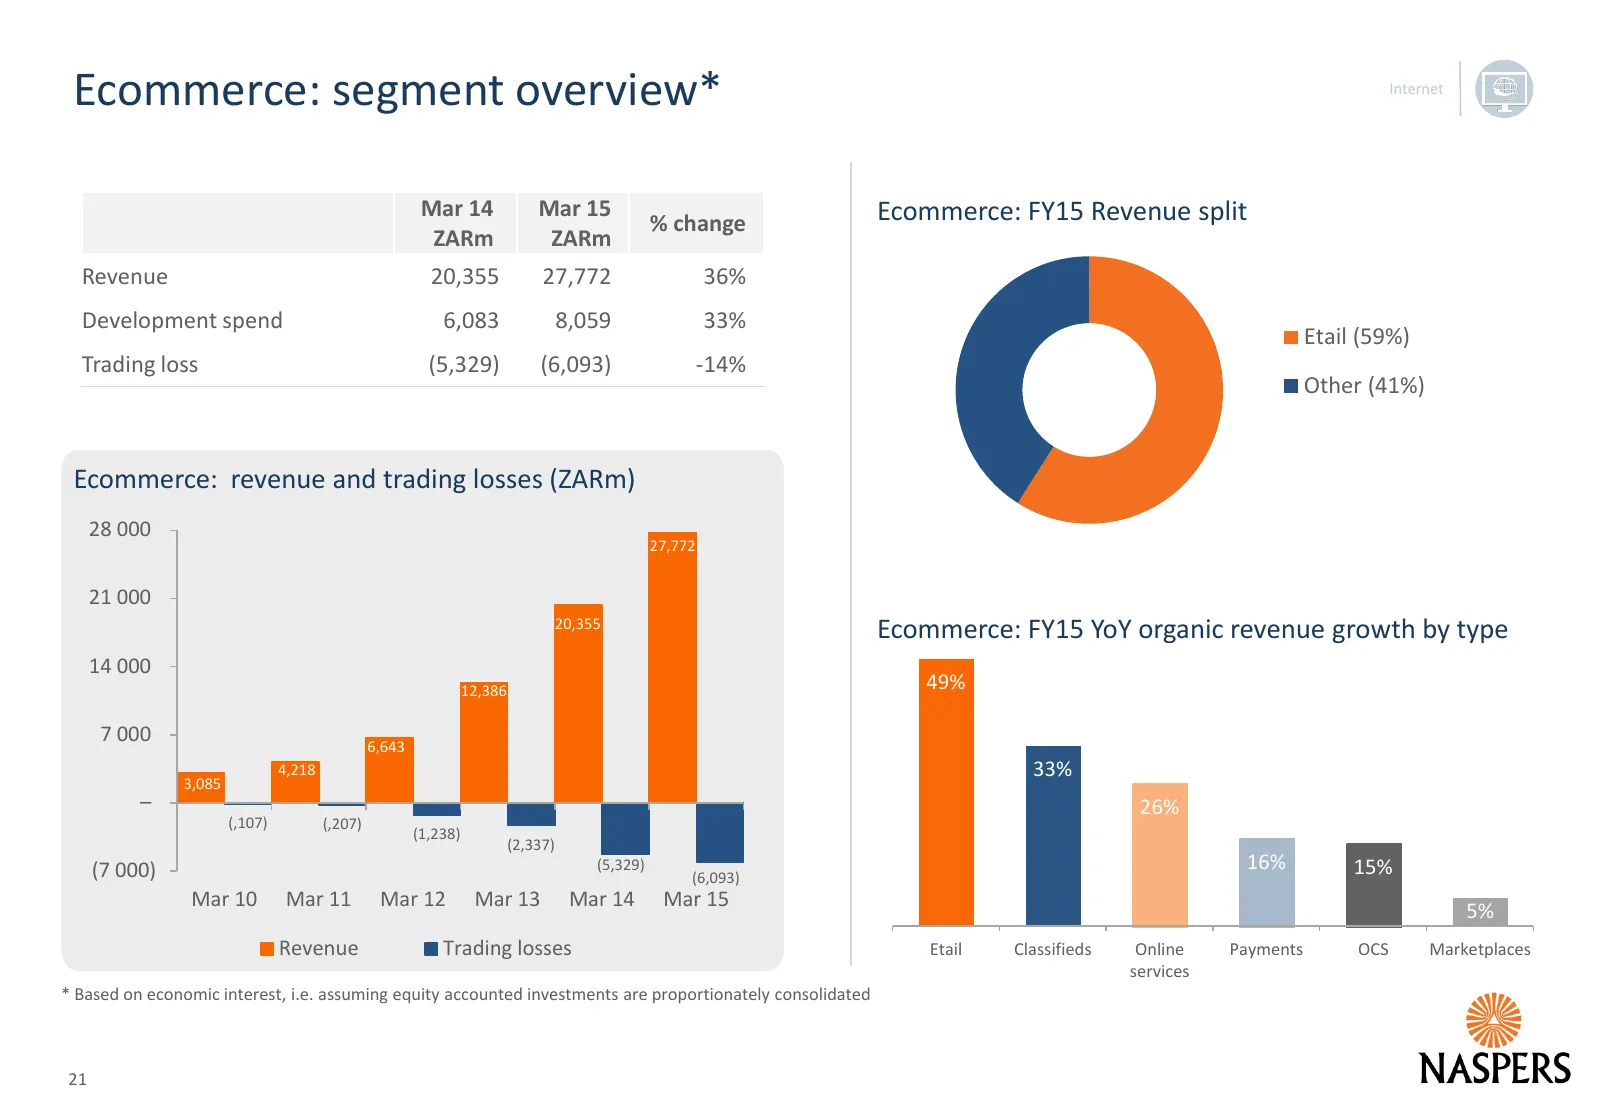
Ecommerce: segment overview* Mar 14 Mar 15 Ecommerce: FY15 Revenue split % change ZARm ZARm Revenue 20,355 27,772 36% Development spend 6,083 8,059 33% Etail (59%) Trading loss (5,329) (6,093) -14% Other (41%) Ecommerce: revenue and trading losses (ZARm) 28 000 27,772 21 000 20,355 Ecommerce: FY15 Y
Slide 22: Etail: increased scale driving revenue momentum
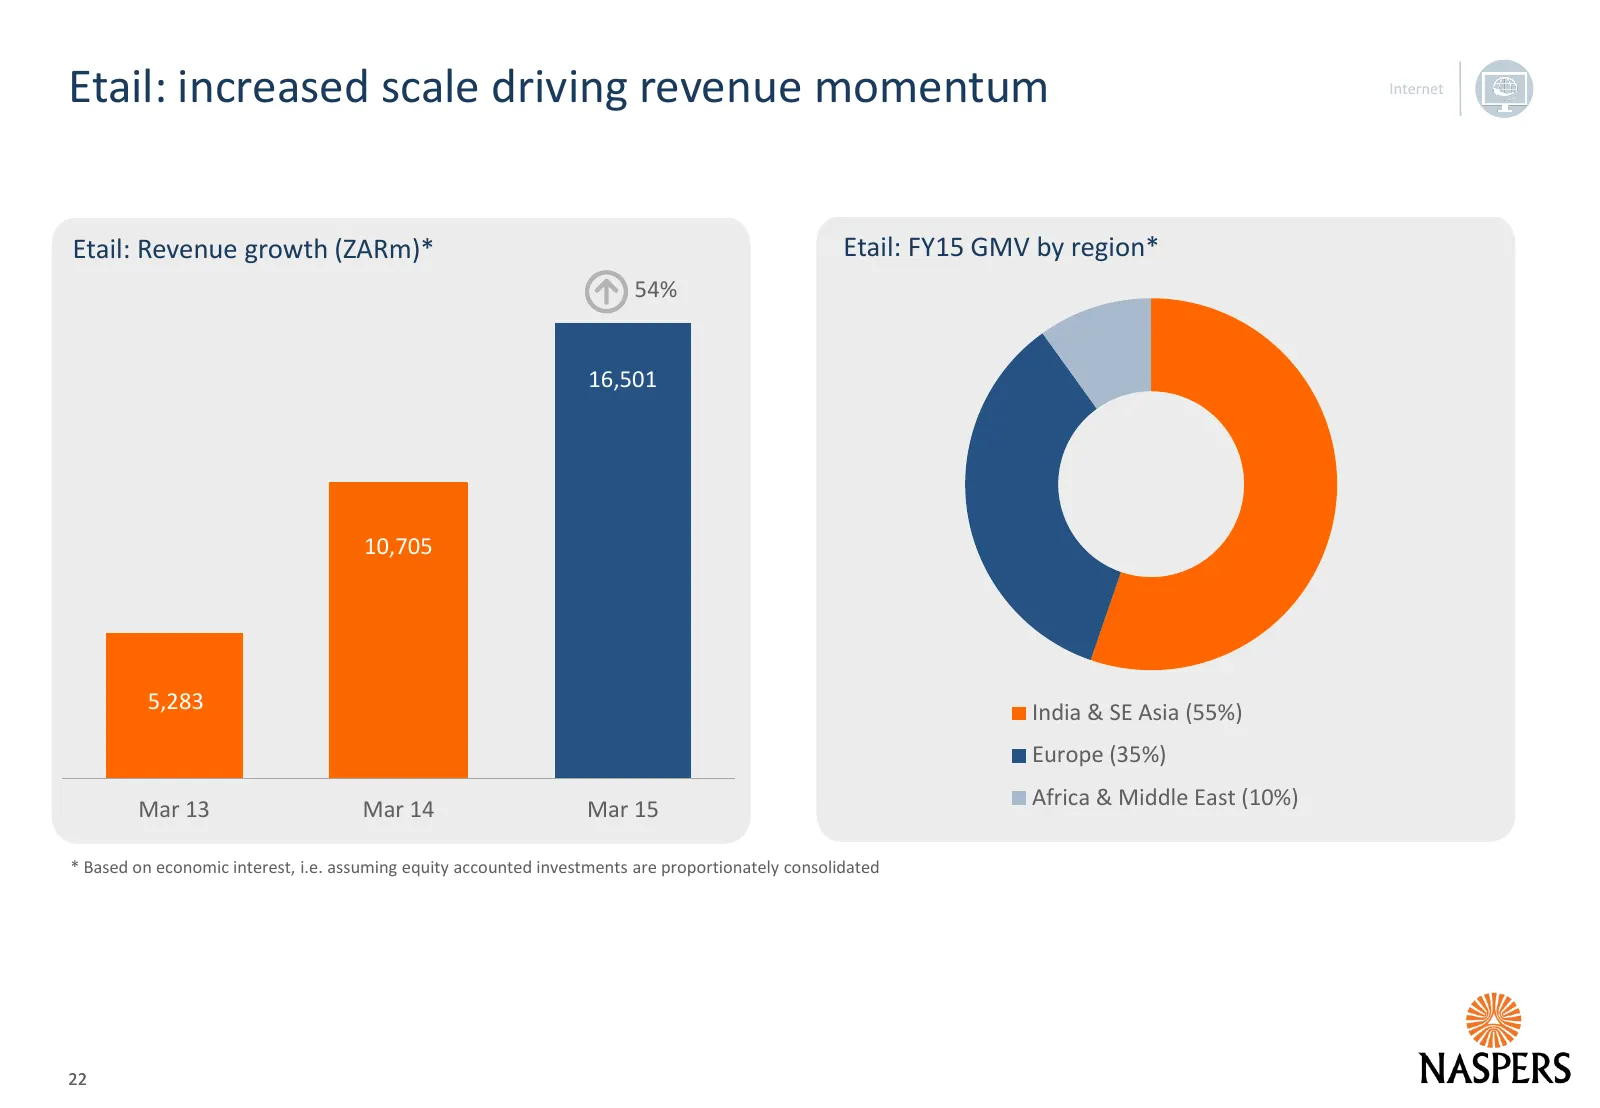
Etail: increased scale driving revenue momentum Etail: Revenue growth (ZARm)* Etail: FY15 GMV by region* 54% 16,501 10,705 5,283 India & SE Asia (55%) Europe (35%) Africa & Middle East (10%) Mar 13 Mar 14 Mar 15 * Based on economic interest, i.e. assuming equity accounted investments are proportiona
Slide 23: Online Services: gaining good traction in travel
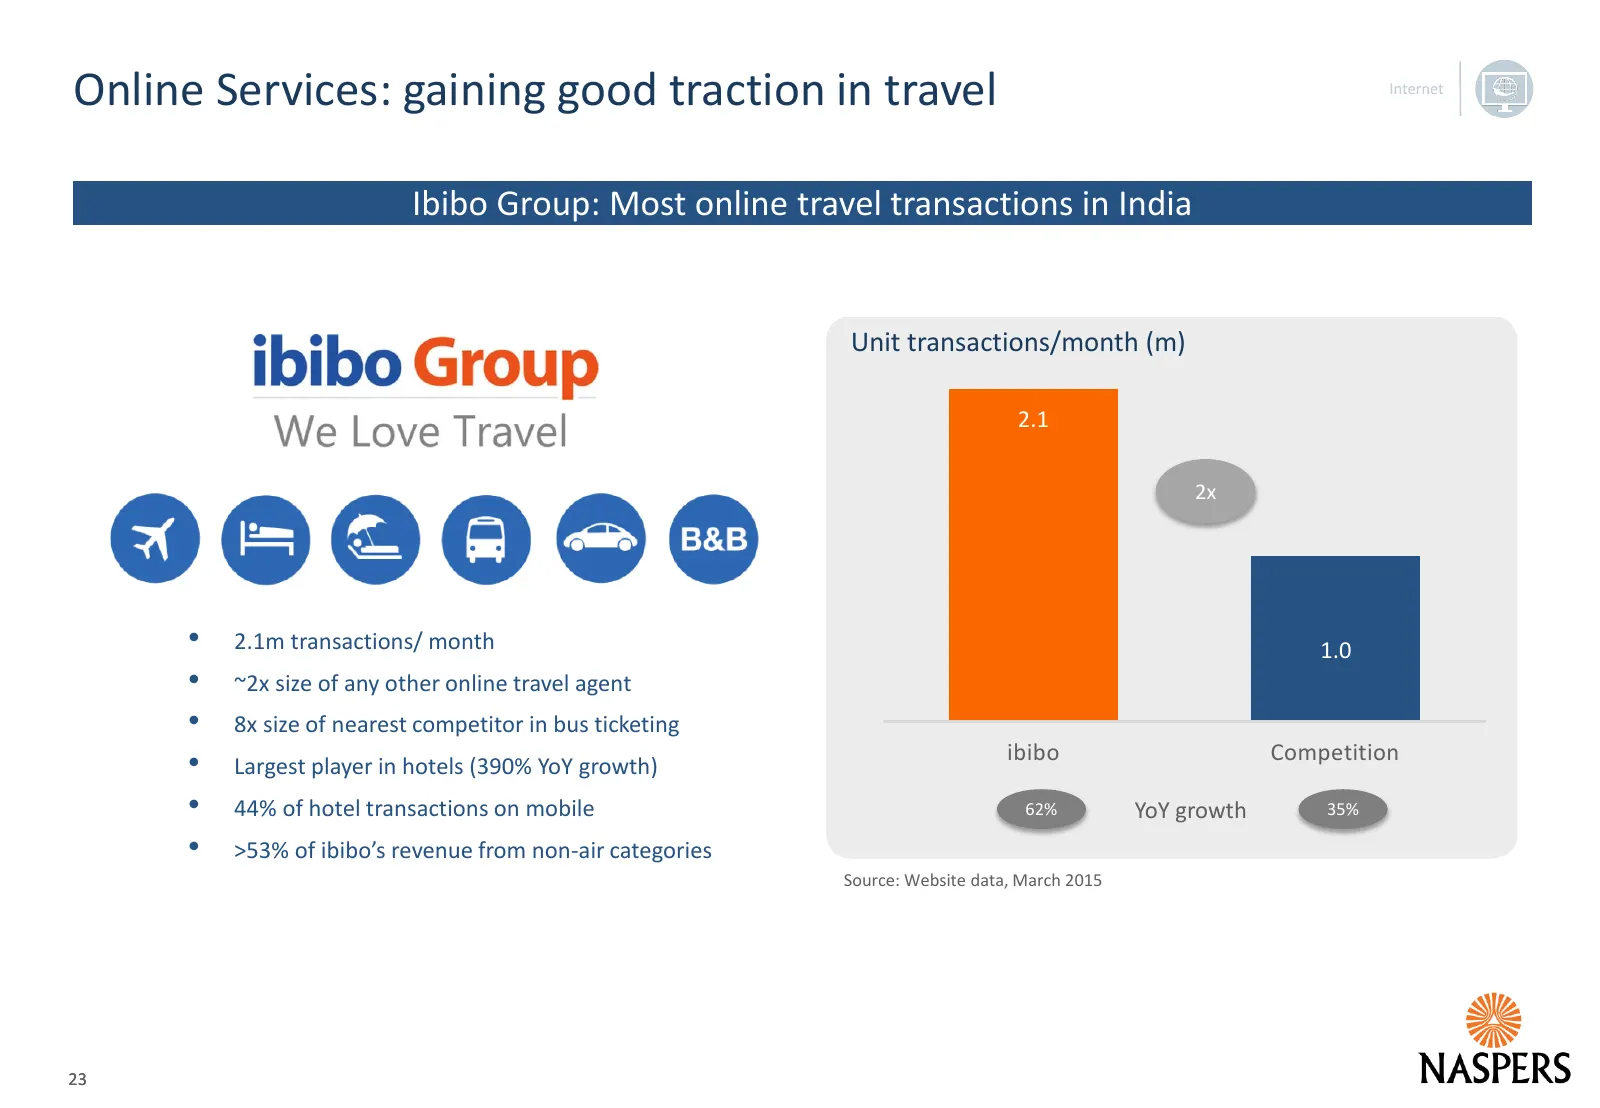
Online Services: gaining good traction in travel Ibibo Group: Most online travel transactions in India Unit transactions/month (m) 2.1 2x • 2.1m transactions/ month 1.0 • ~2x size of any other online travel agent • 8x size of nearest competitor in bus ticketing ibibo Competition • Largest player in
Slide 24: Classifieds: OLX clear leader in emerging markets
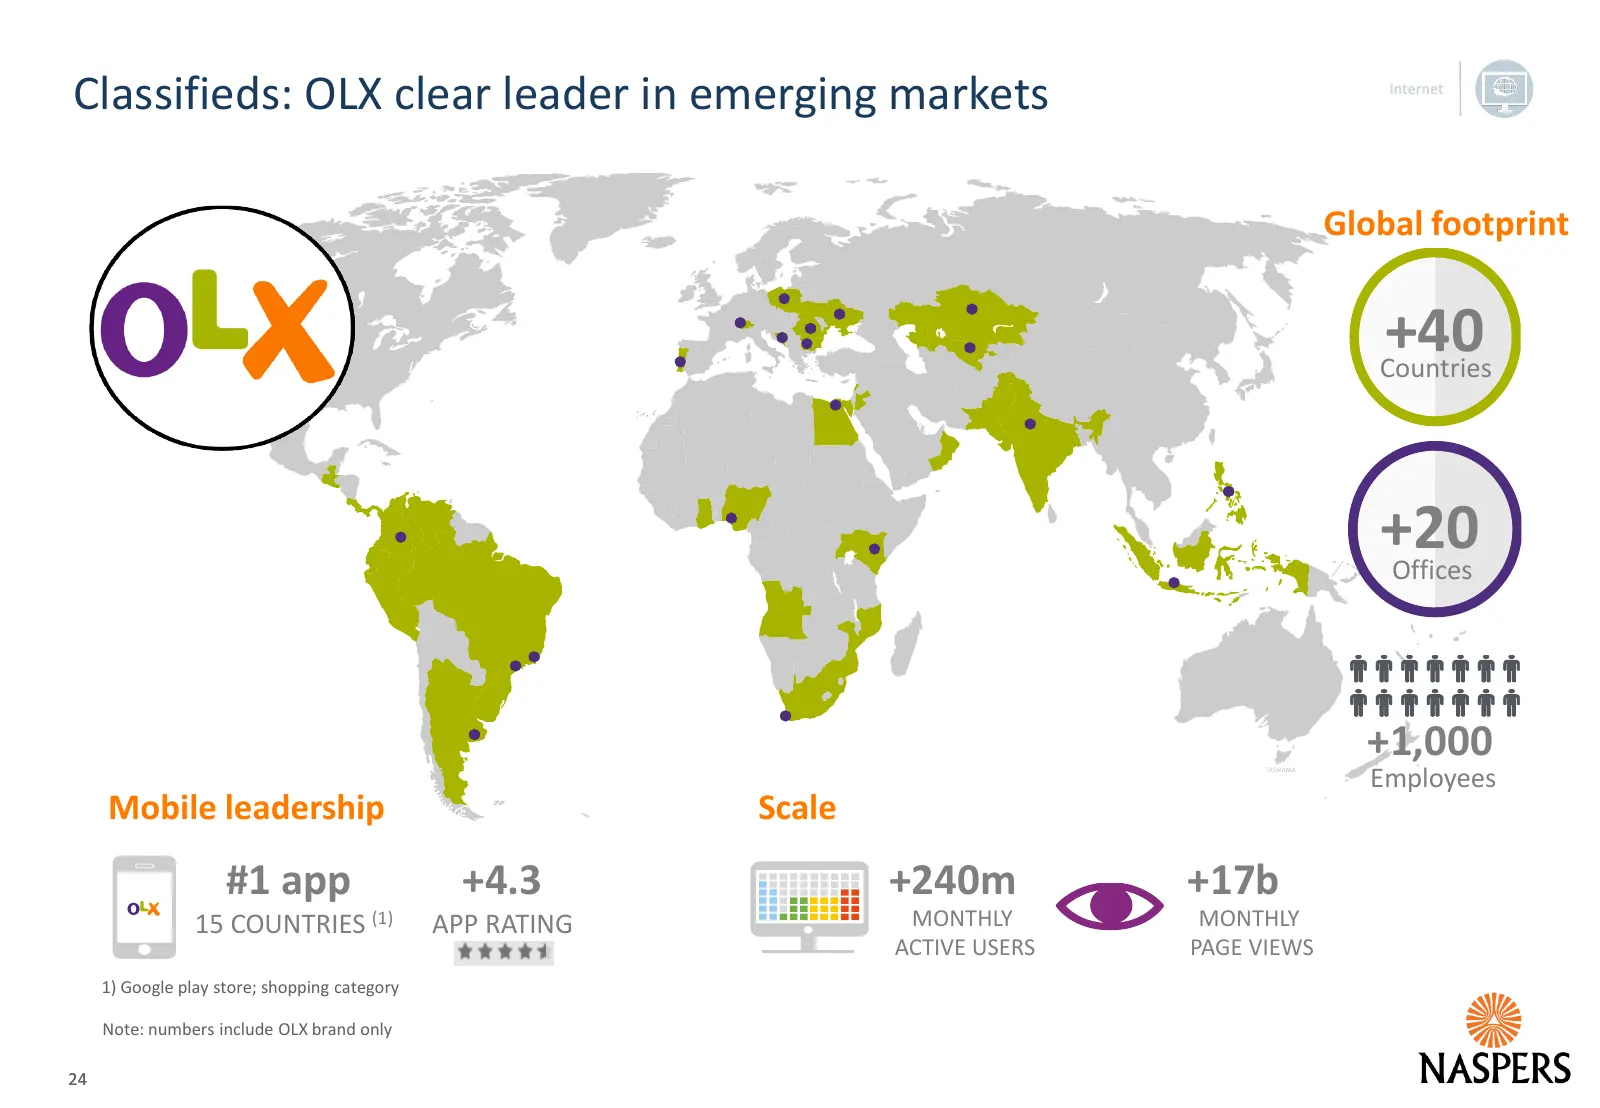
Classifieds: OLX clear leader in emerging markets Global footprint +40 Countries +20 Offices +1,000 Employees Mobile leadership Scale #1 app +4.3 +240m +17b 15 COUNTRIES (1) APP RATING MONTHLY MONTHLY ACTIVE USERS PAGE VIEWS 1) Google play store; shopping category Note: numbers include OLX brand onl
Slide 25: Classifieds: operational overview
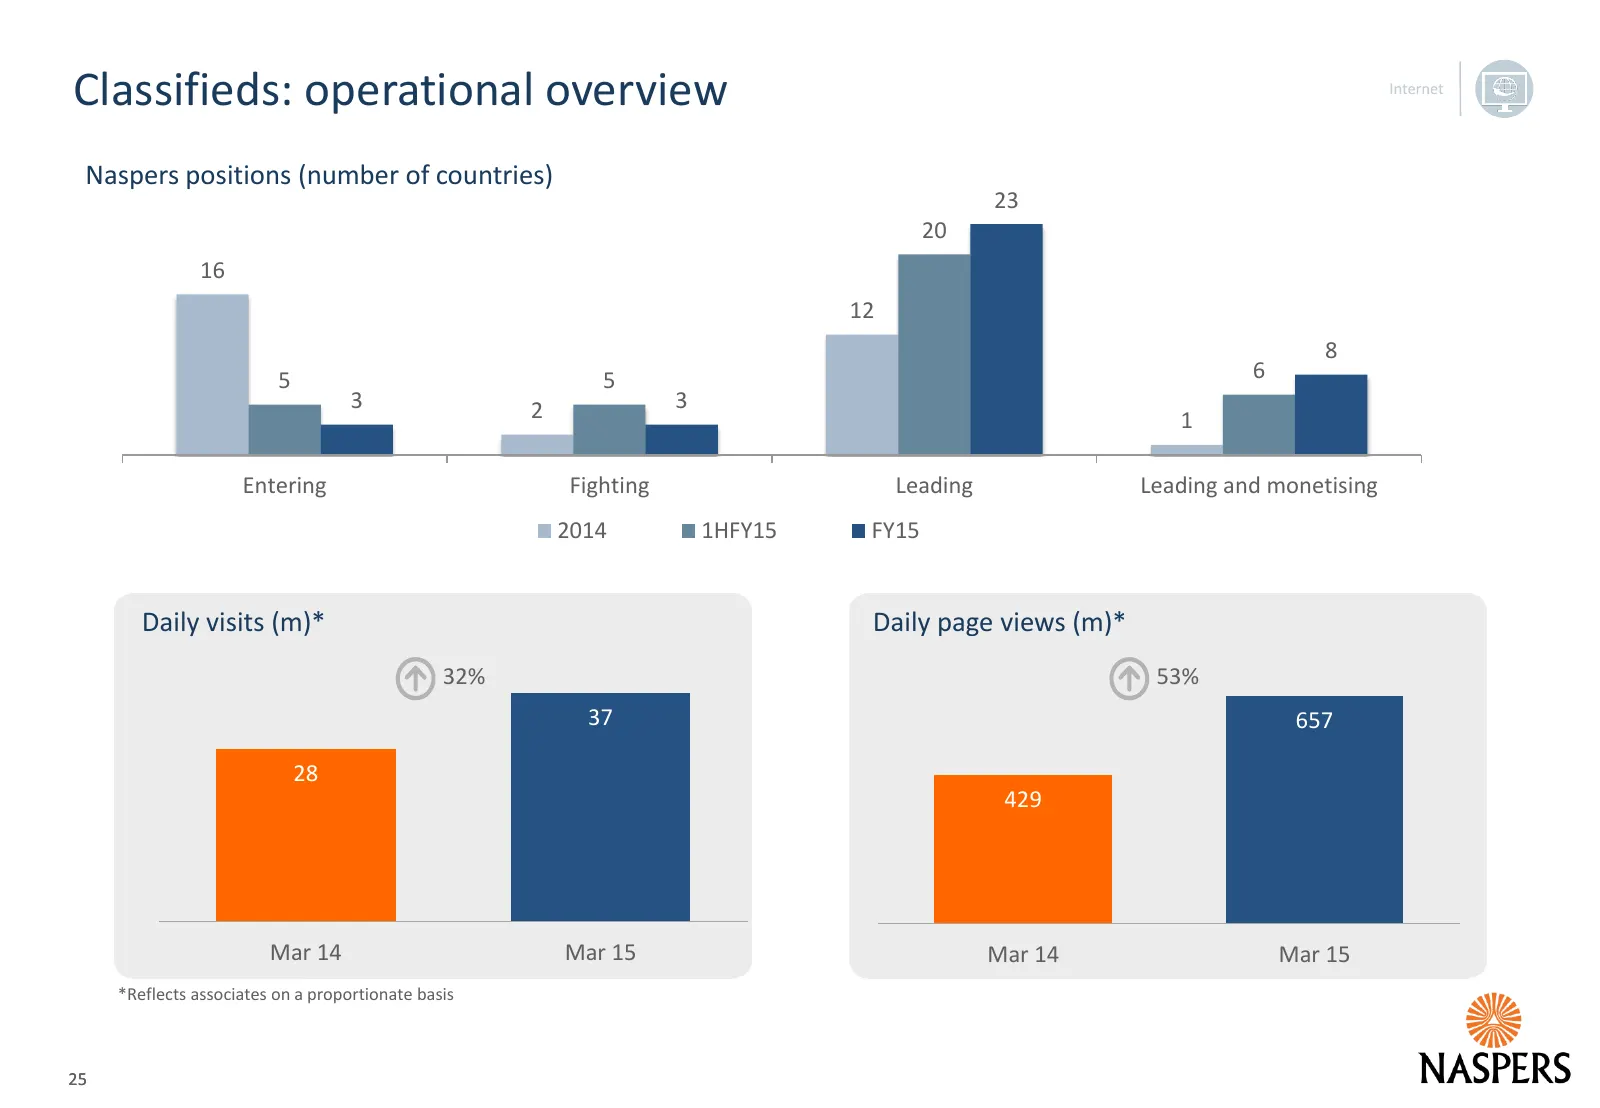
Classifieds: operational overview Naspers positions (number of countries) 23 20 16 12 8 5 5 6 3 2 3 1 Entering Fighting Leading Leading and monetising 2014 1HFY15 FY15 Daily visits (m)* Daily page views (m)* 32% 53% 37 657 28 429 Mar 14 Mar 15 Mar 14 Mar 15 *Reflects associates on a proportionate ba
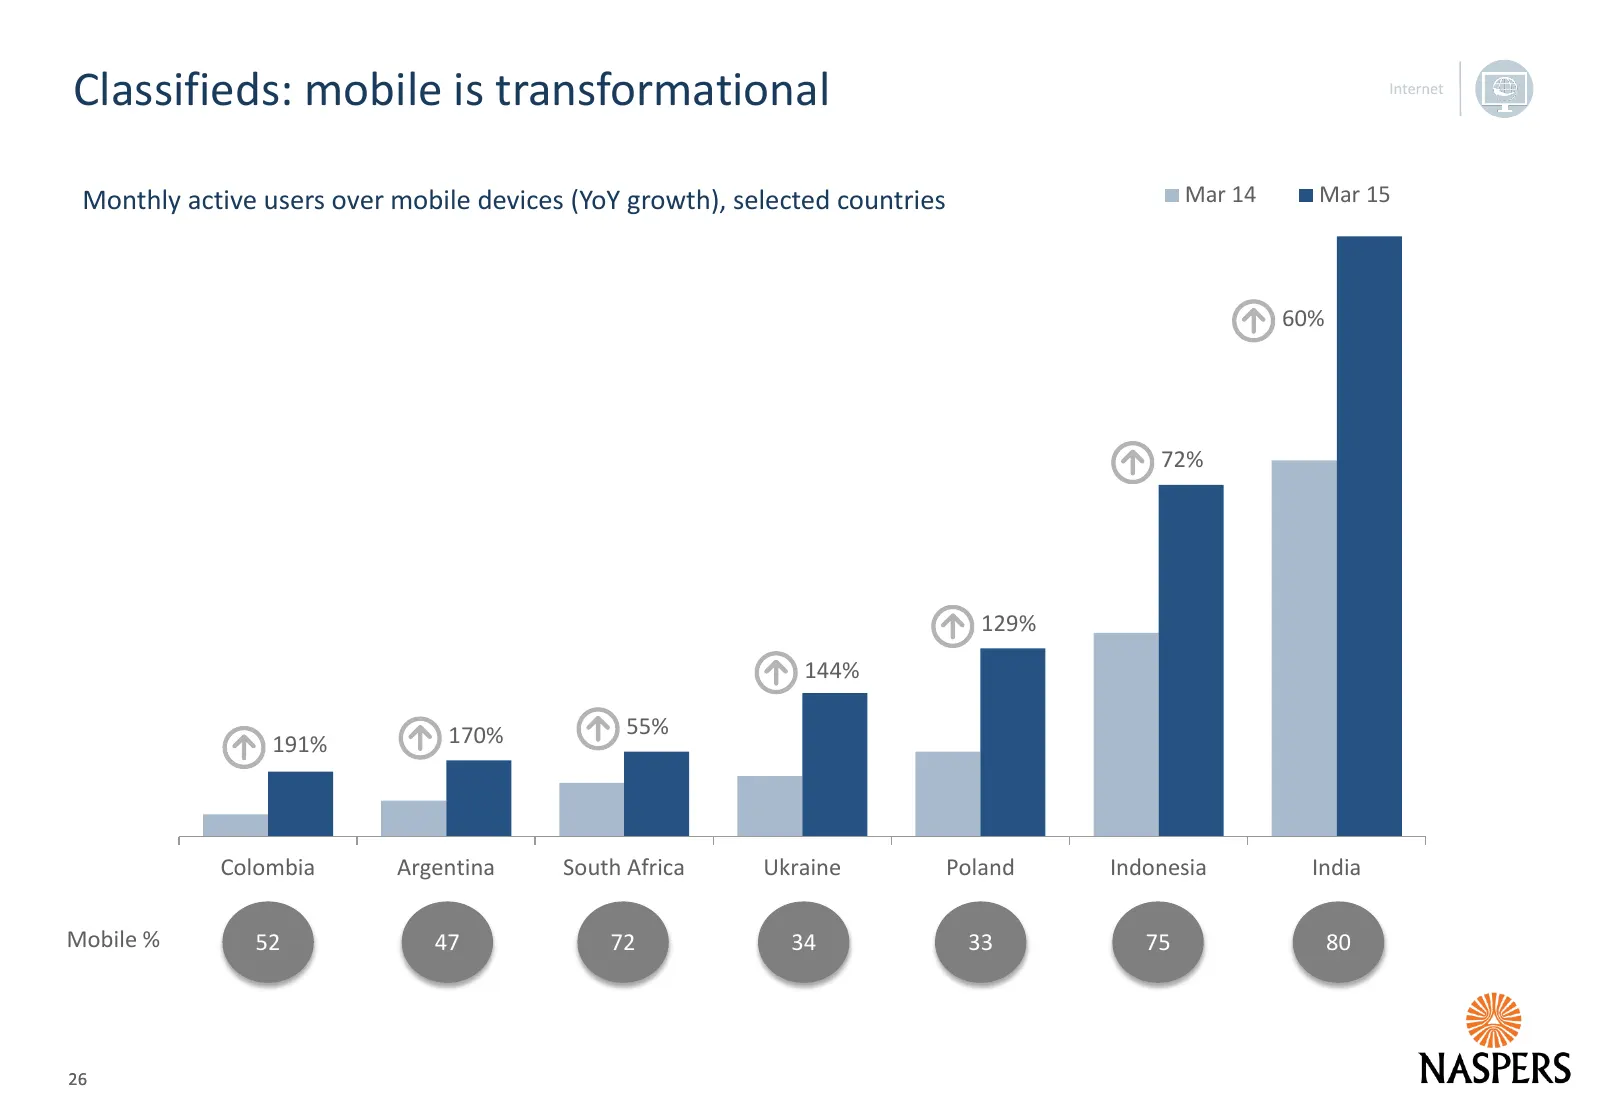
Slide 26: Classifieds: mobile is transformational
Classifieds: mobile is transformational Monthly active users over mobile devices (YoY growth), selected countries Mar 14 Mar 15 60% 72% 129% 144% 170% 55% 191% Colombia Argentina South Africa Ukraine Poland Indonesia India Mobile % 52 47 72 34 33 75 80 26
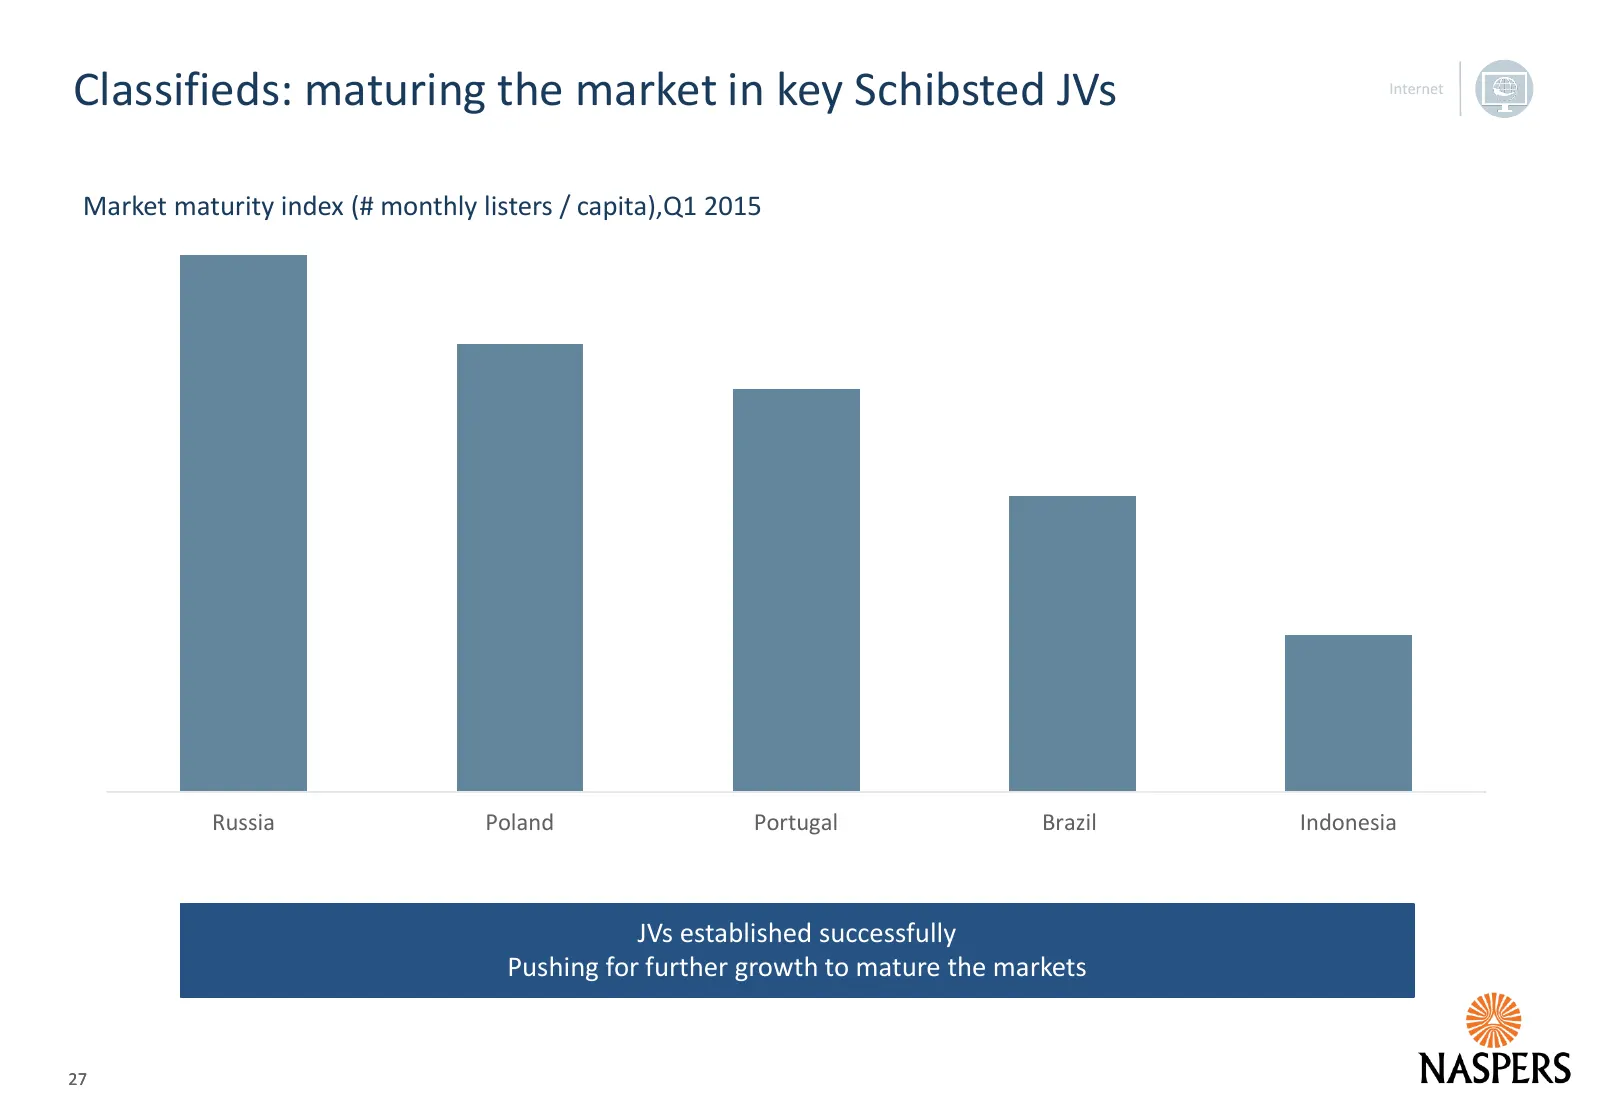
Slide 27: Classifieds: maturing the market in key Schibsted JVs
Classifieds: maturing the market in key Schibsted JVs Market maturity index (# monthly listers / capita),Q1 2015 Russia Poland Portugal Brazil Indonesia JVs established successfully Pushing for further growth to mature the markets 27
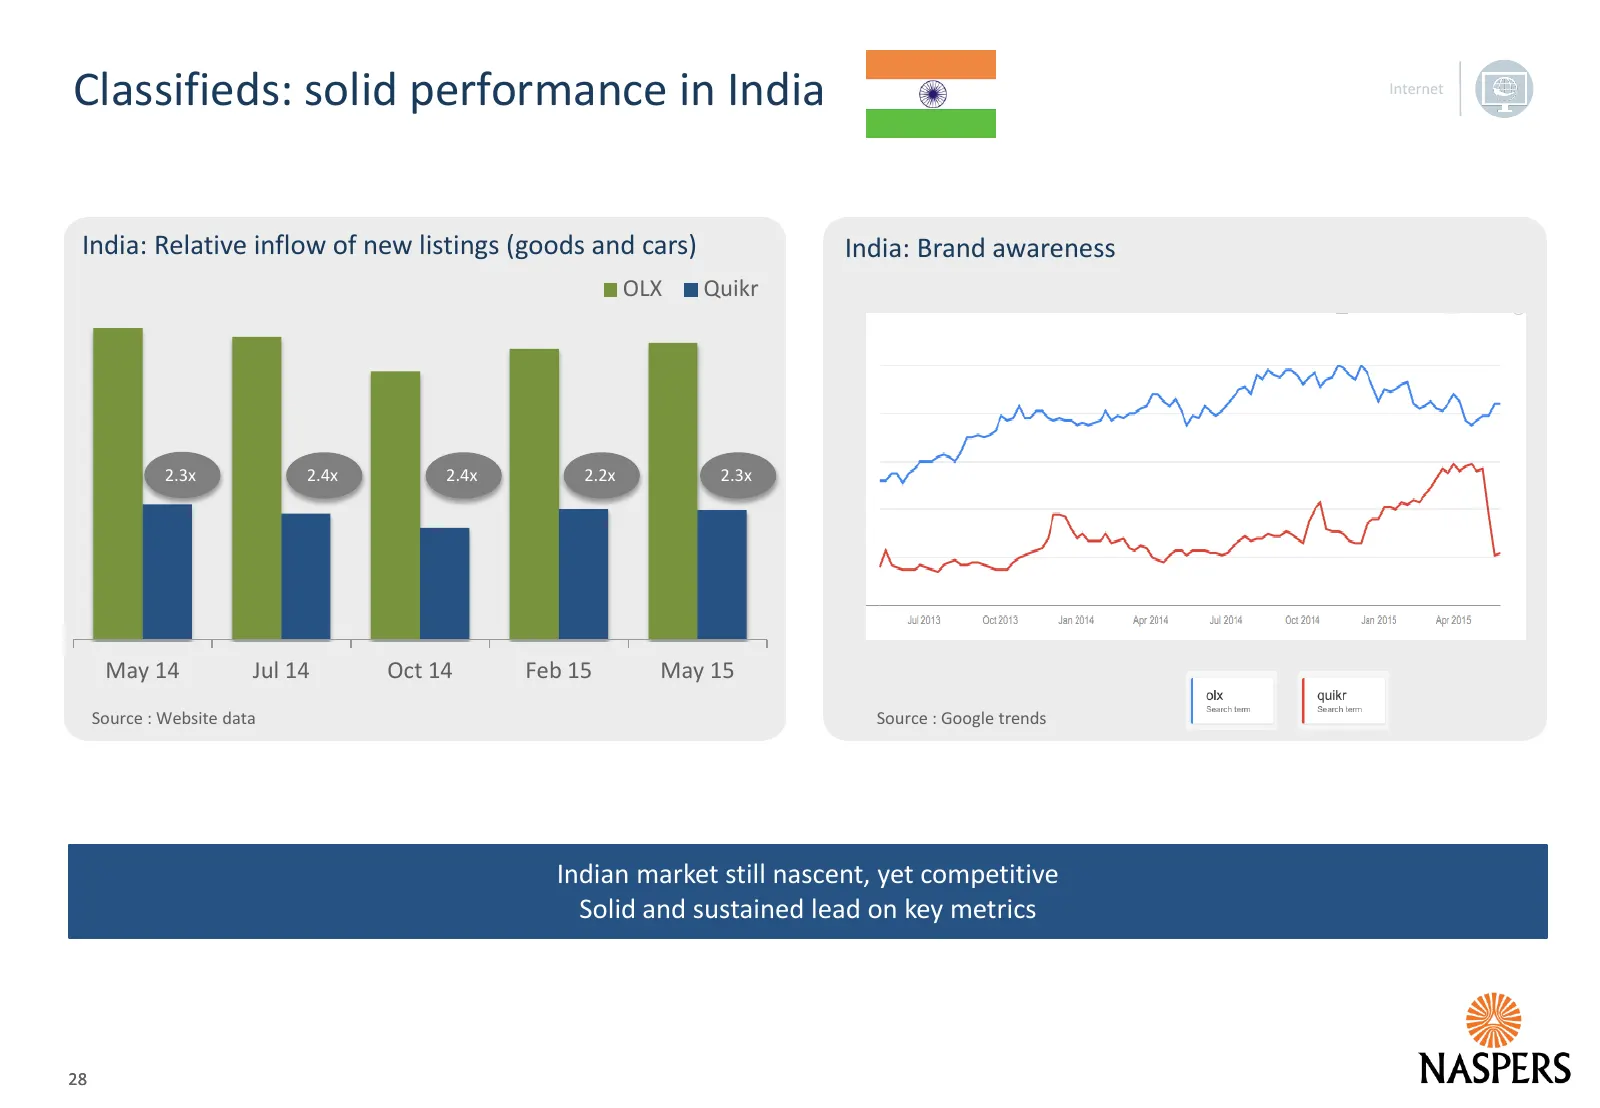
Slide 28: Classifieds: solid performance in India
Classifieds: solid performance in India India: Relative inflow of new listings (goods and cars) India: Brand awareness OLX Quikr 2.3x 2.4x 2.4x 2.2x 2.3x May 14 Jul 14 Oct 14 Feb 15 May 15 Source : Website data Source : Google trends Indian market still nascent, yet competitive Solid and sustained l
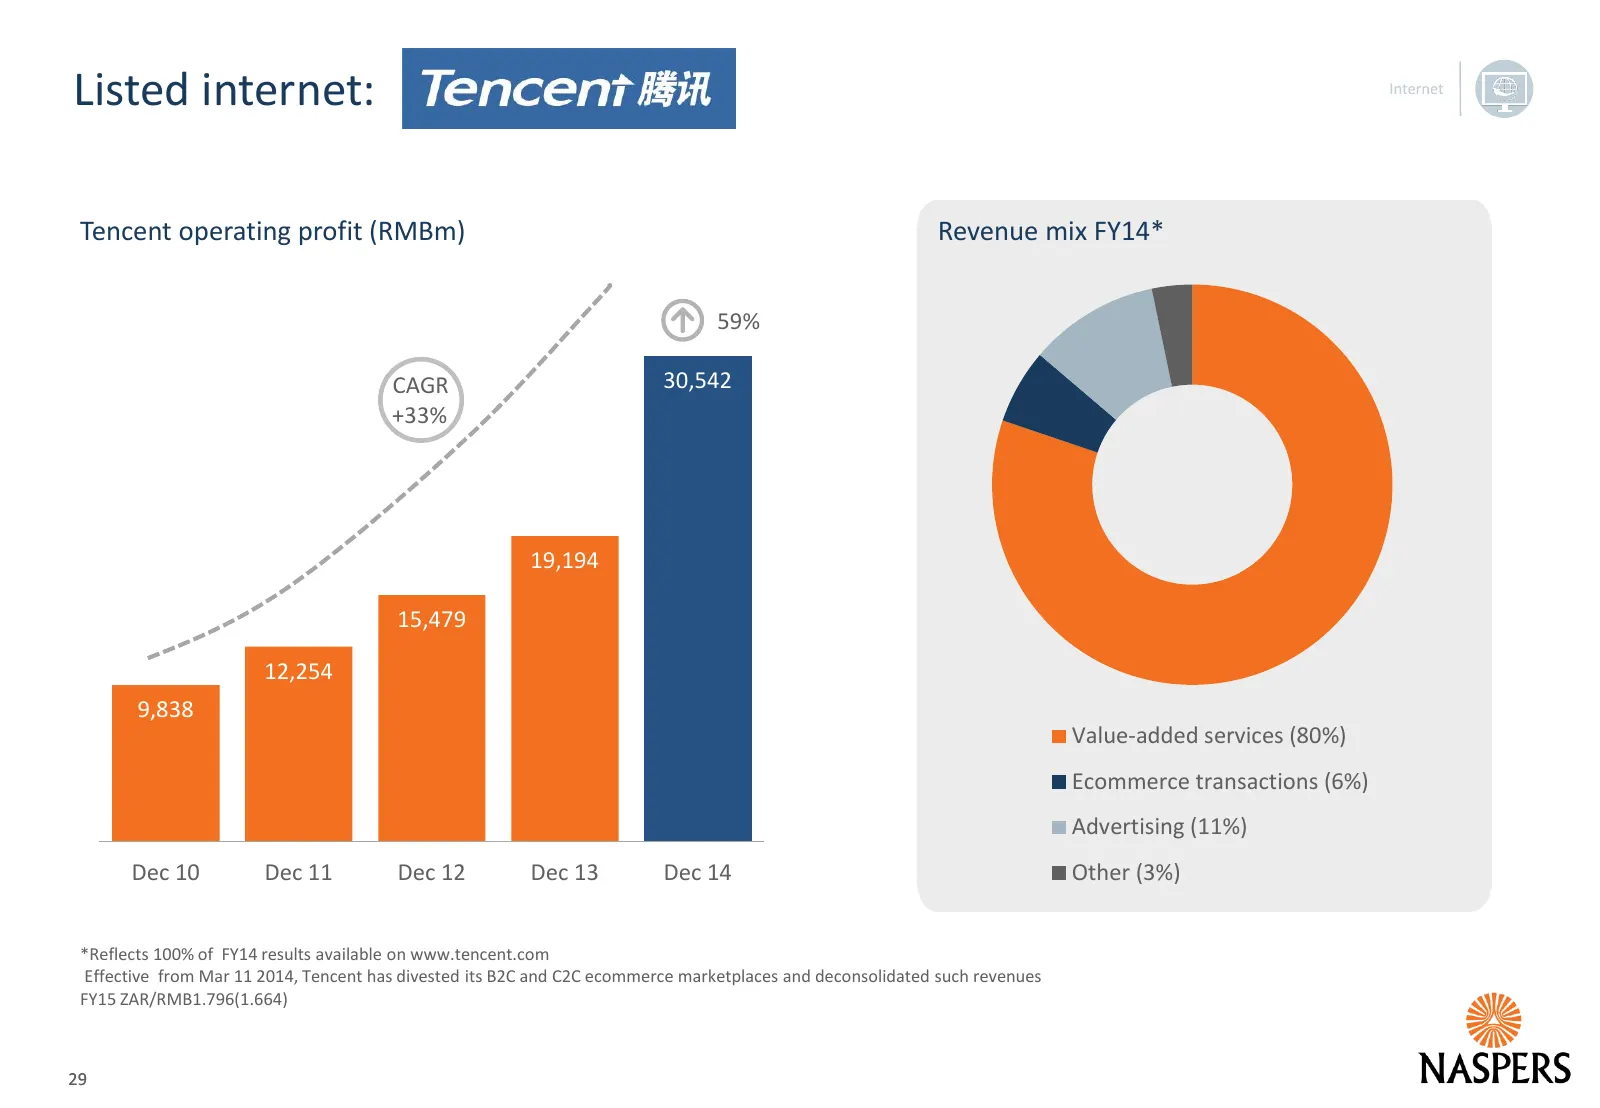
Slide 29: Listed internet: Tencent
Listed internet: Tencent operating profit (RMBm) Revenue mix FY14* 59% CAGR 30,542 +33% 19,194 15,479 12,254 9,838 Value-added services (80%) Ecommerce transactions (6%) Advertising (11%) Dec 10 Dec 11 Dec 12 Dec 13 Dec 14 Other (3%) *Reflects 100% of FY14 results available on www.tencent.com Effect
Slide 30: Listed internet: Mail.ru
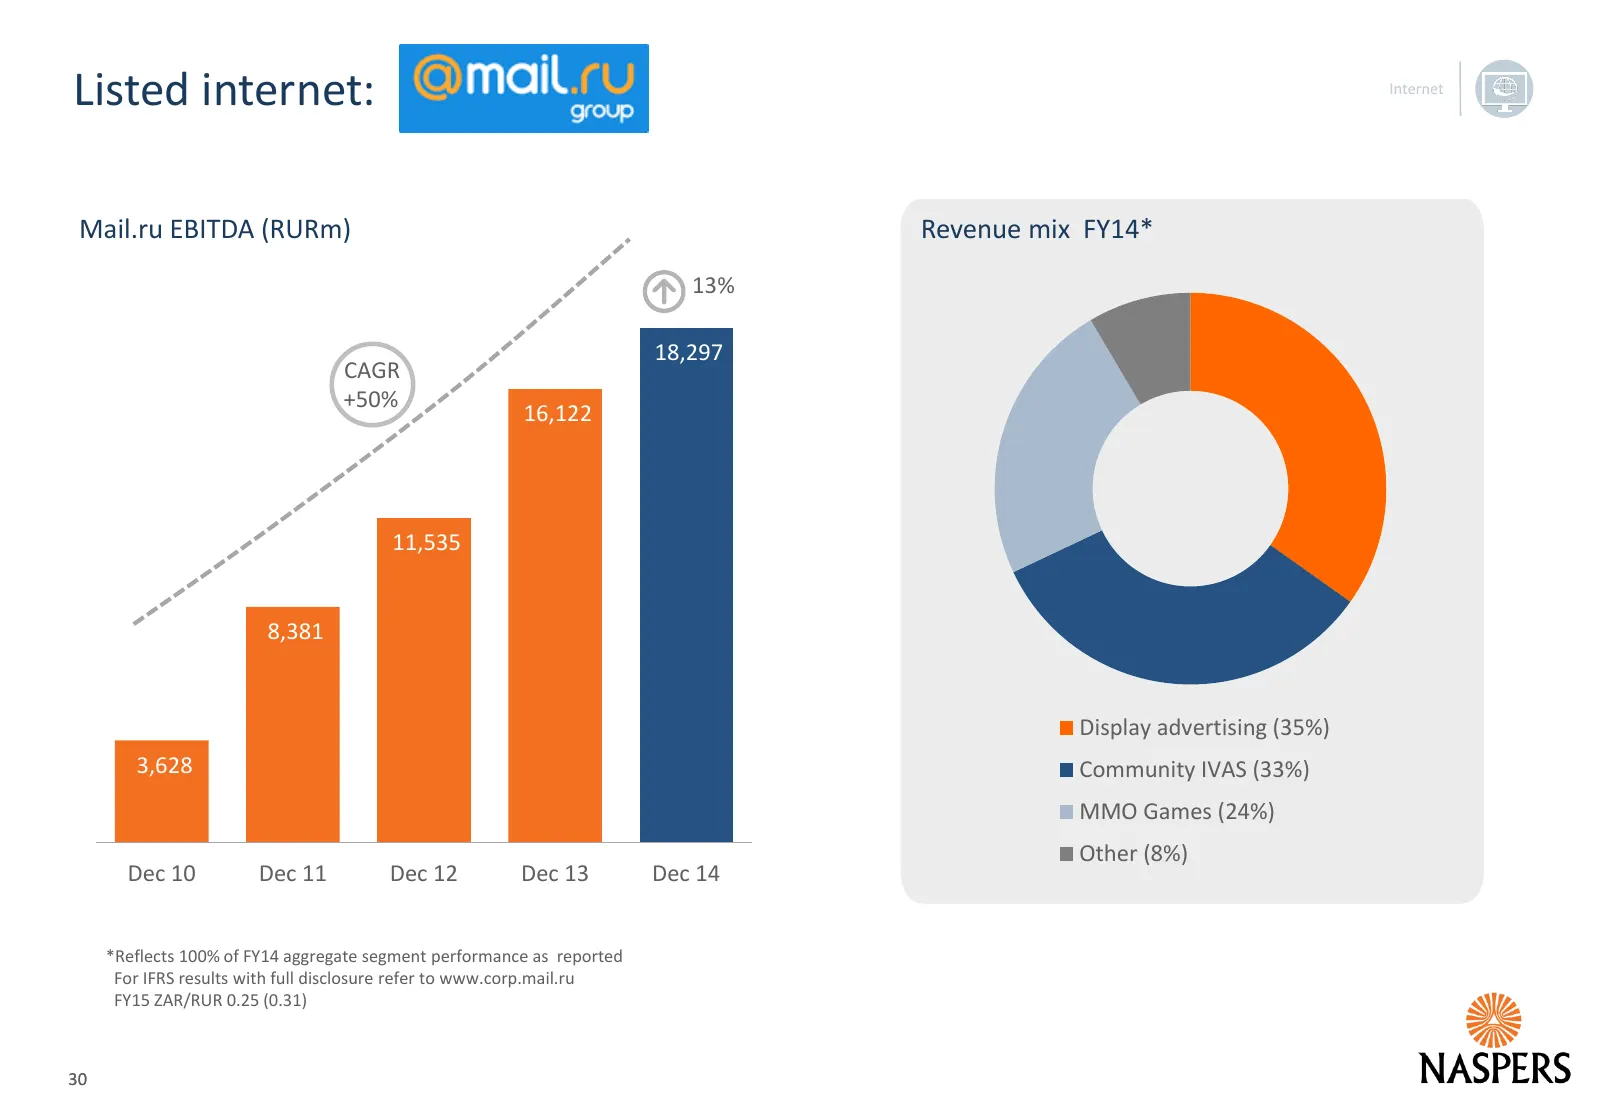
Listed internet: Mail.ru EBITDA (RURm) Revenue mix FY14* 13% 18,297 CAGR +50% 16,122 11,535 8,381 Display advertising (35%) 3,628 Community IVAS (33%) MMO Games (24%) Other (8%) Dec 10 Dec 11 Dec 12 Dec 13 Dec 14 *Reflects 100% of FY14 aggregate segment performance as reported For IFRS results with
Slide 31: Overview Financials Internet
Overview Financials Internet Video Entertainment Outlook Appendix 31
Slide 32: Video Entertainment strategy: ongoing investment in our platforms
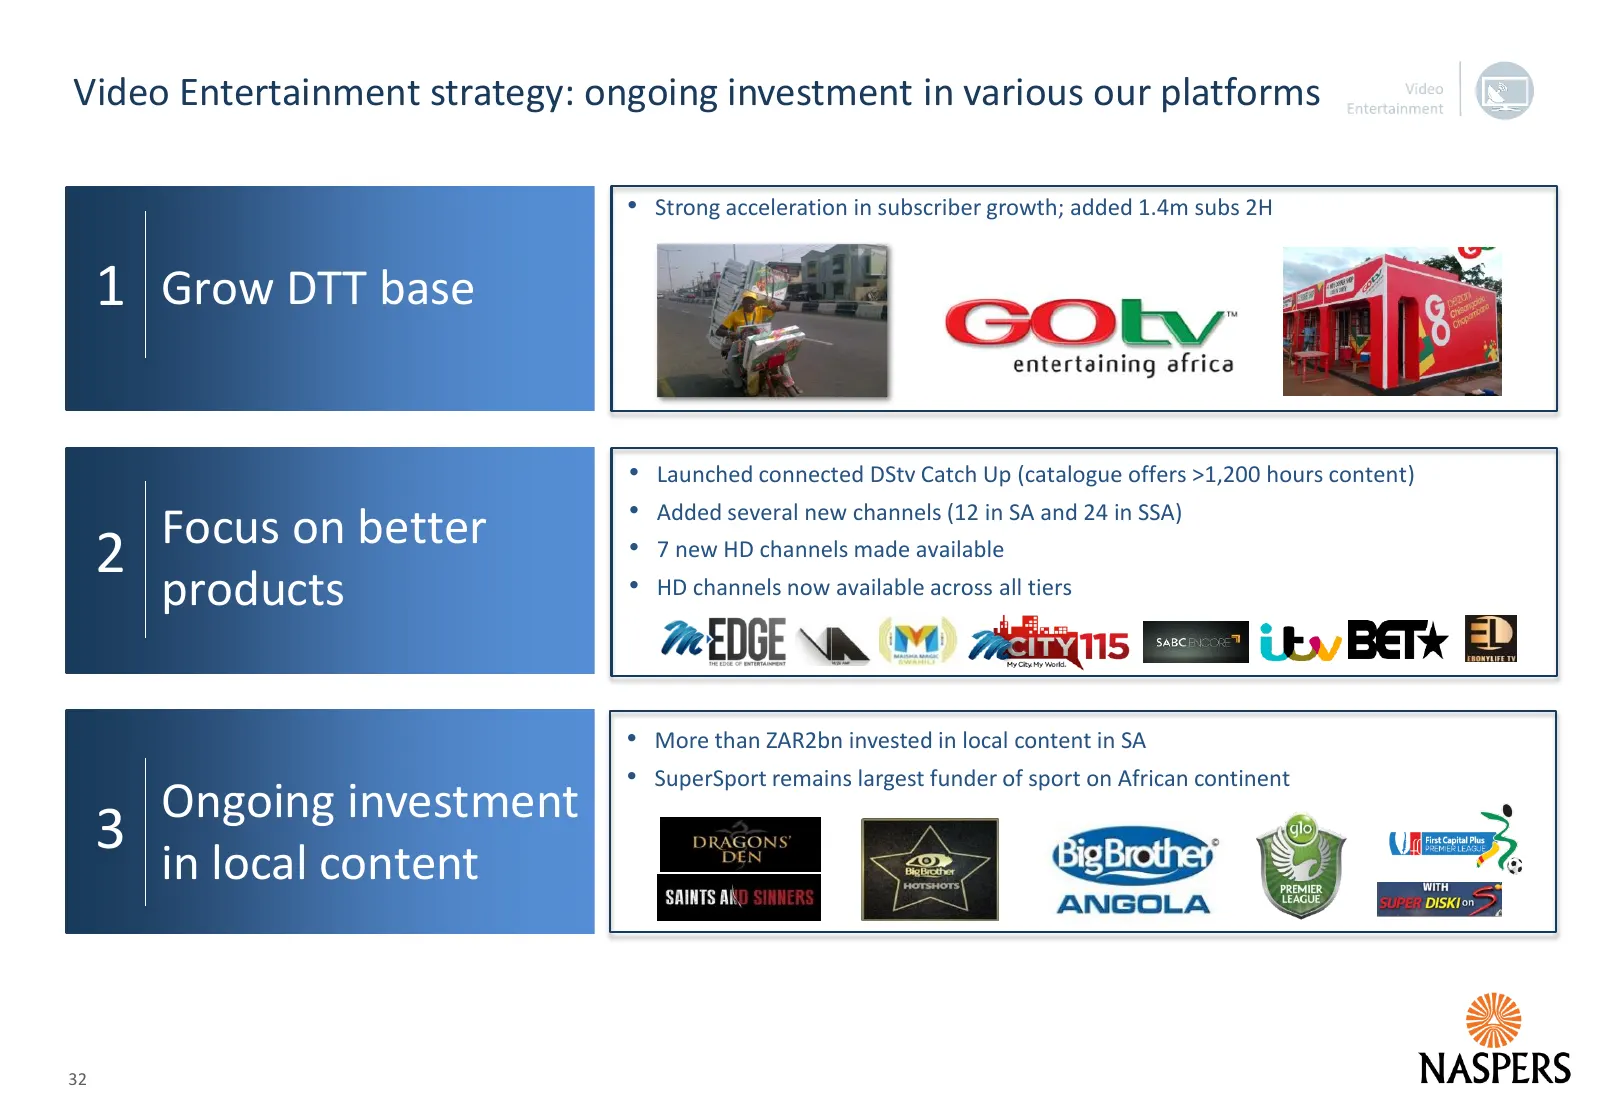
Video Entertainment strategy: ongoing investment in various our platforms • Strong acceleration in subscriber growth; added 1.4m subs 2H 1 Grow DTT base • Launched connected DStv Catch Up (catalogue offers >1,200 hours content) • Added several new channels (12 in SA and 24 in SSA) 2 Focus on better
Slide 33: Video Entertainment: consistent solid performance
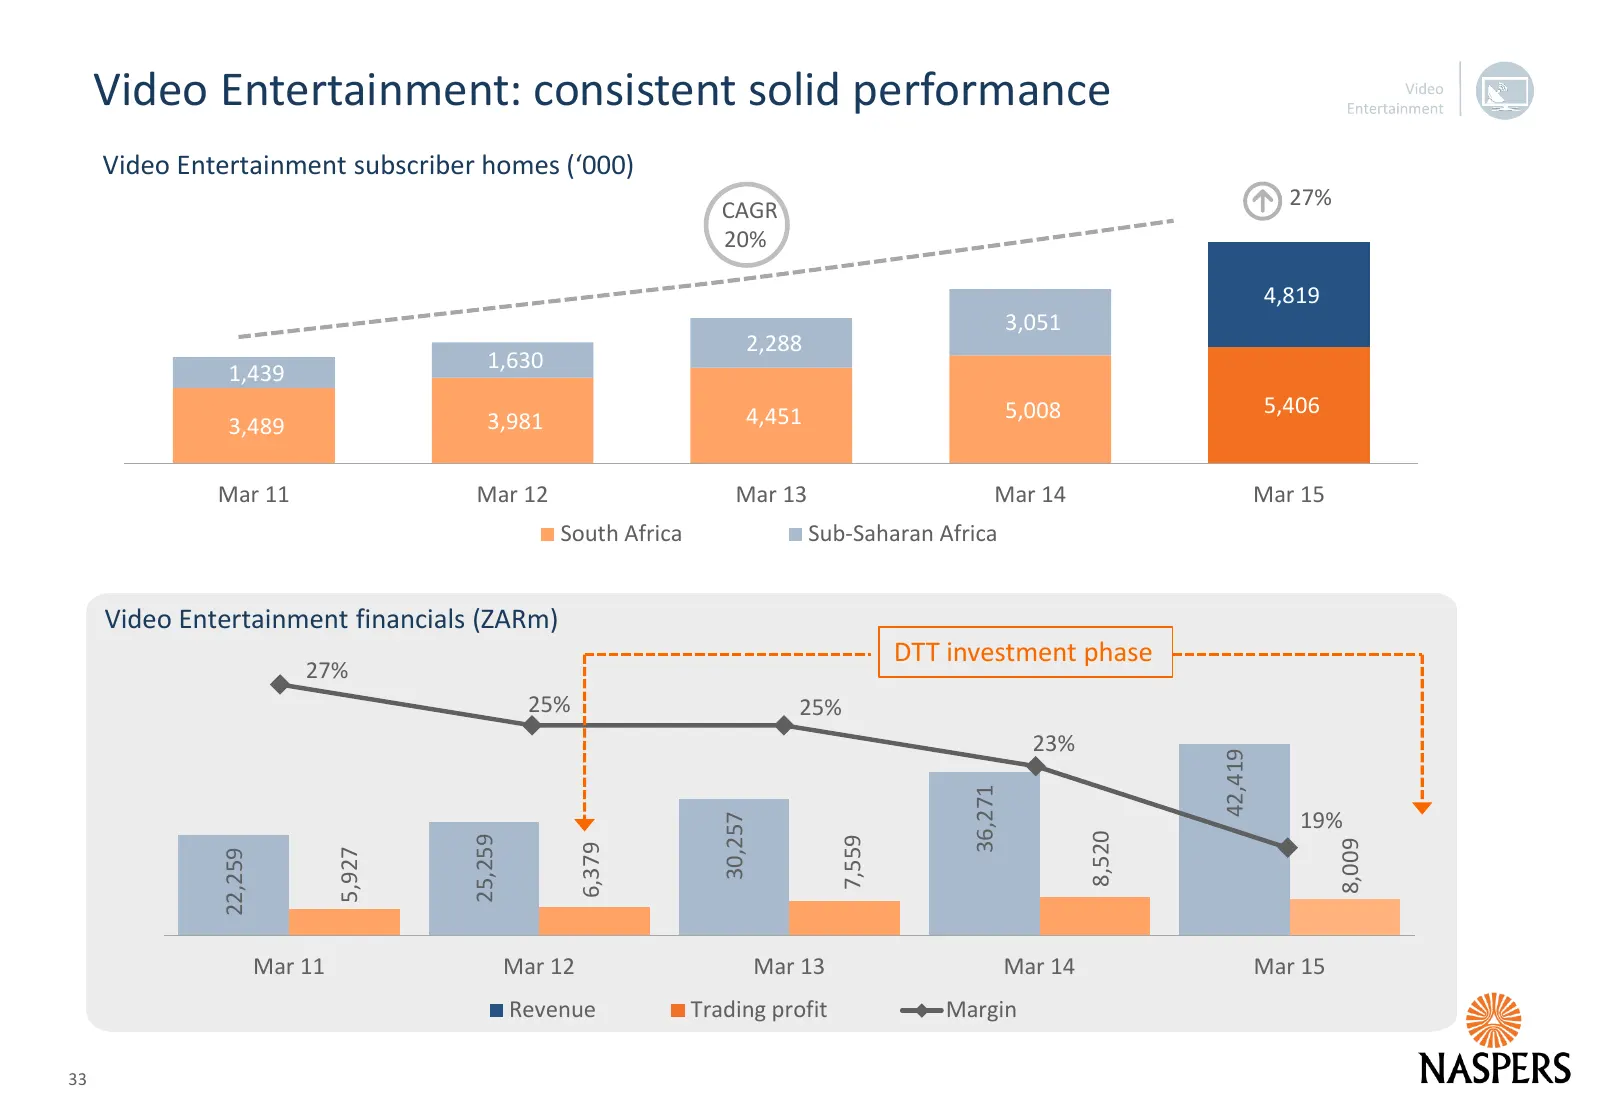
Video Entertainment: consistent solid performance Video Entertainment subscriber homes (‘000) 27% CAGR 20% 4,819 3,051 2,288 1,630 1,439 4,451 5,008 5,406 3,489 3,981 Mar 11 Mar 12 Mar 13 Mar 14 Mar 15 South Africa Sub-Saharan Africa Video Entertainment financials (ZARm) DTT investment phase 27% 25%
Slide 34: DTT: strong acceleration in subscriber growth
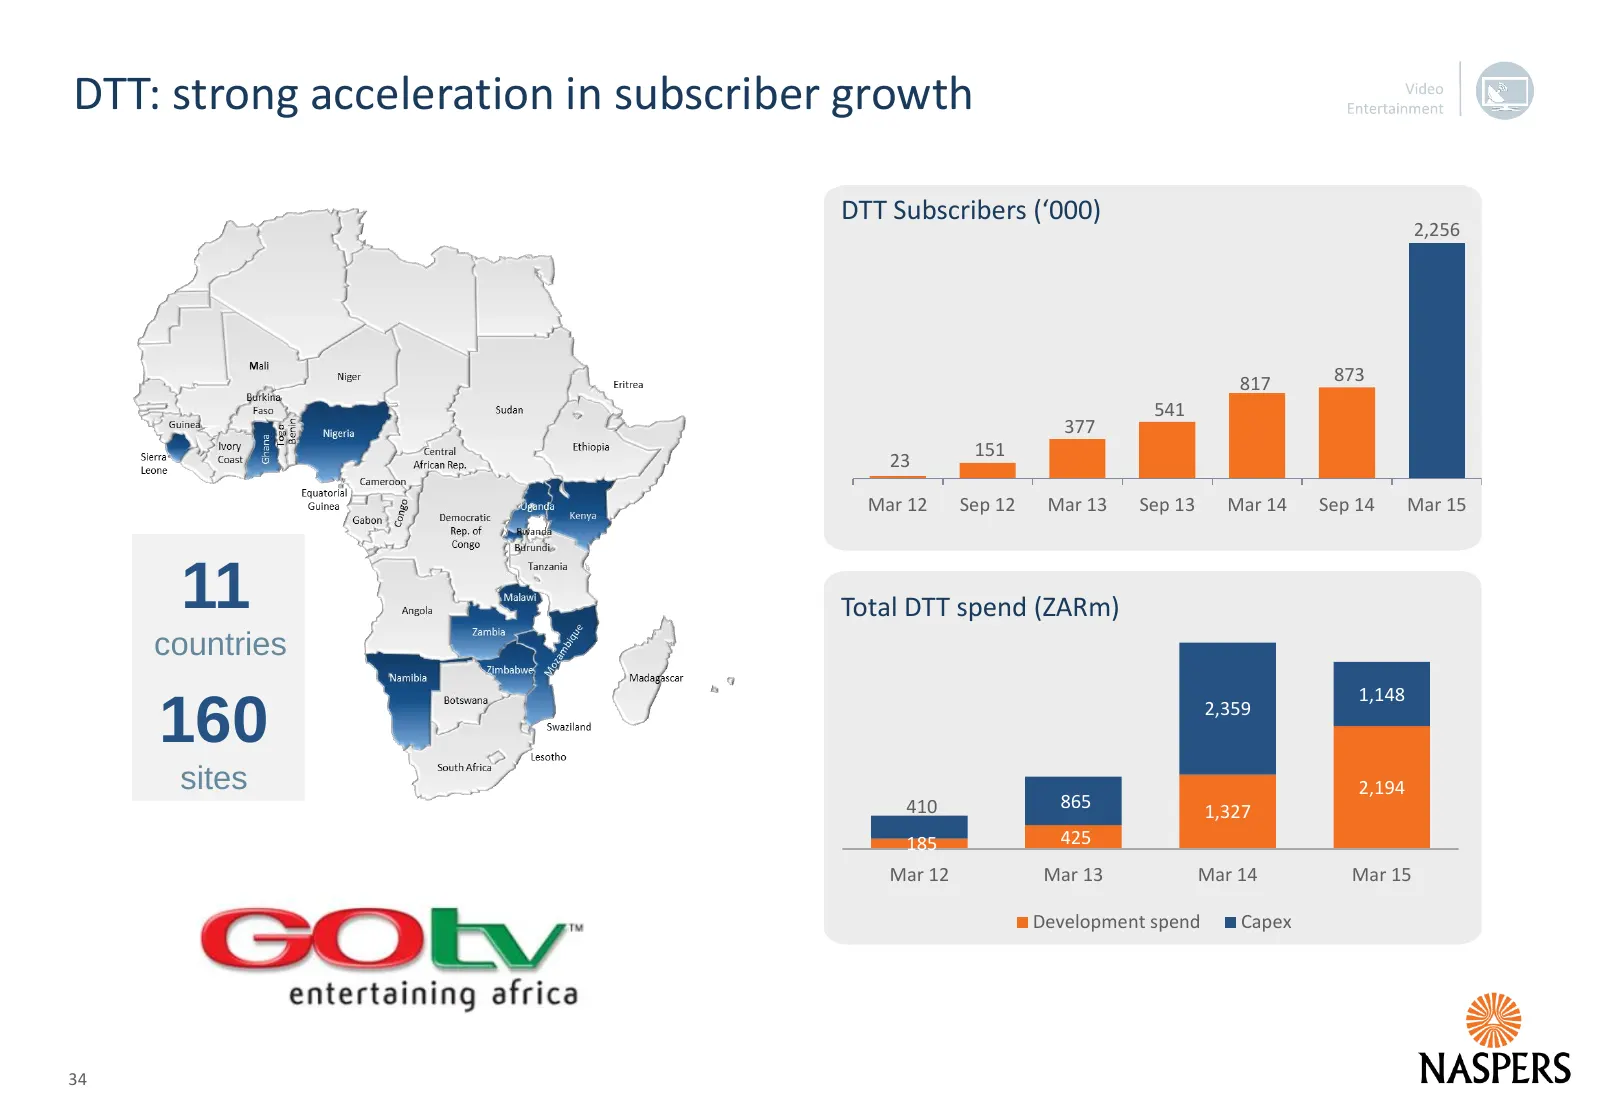
DTT: strong acceleration in subscriber growth DTT Subscribers (‘000) 2,256 817 873 541 377 151 23 Mar 12 Sep 12 Mar 13 Sep 13 Mar 14 Sep 14 Mar 15 11 Total DTT spend (ZARm) countries 1,148 160 2,359 sites 2,194 410 865 1,327 185 425 Mar 12 Mar 13 Mar 14 Mar 15 Development spend Capex Jun 15 34
Slide 35: Overview Financials Internet
Overview Financials Internet Video Entertainment Outlook Appendix 35
Slide 36: FY16 Outlook: continue building our platforms
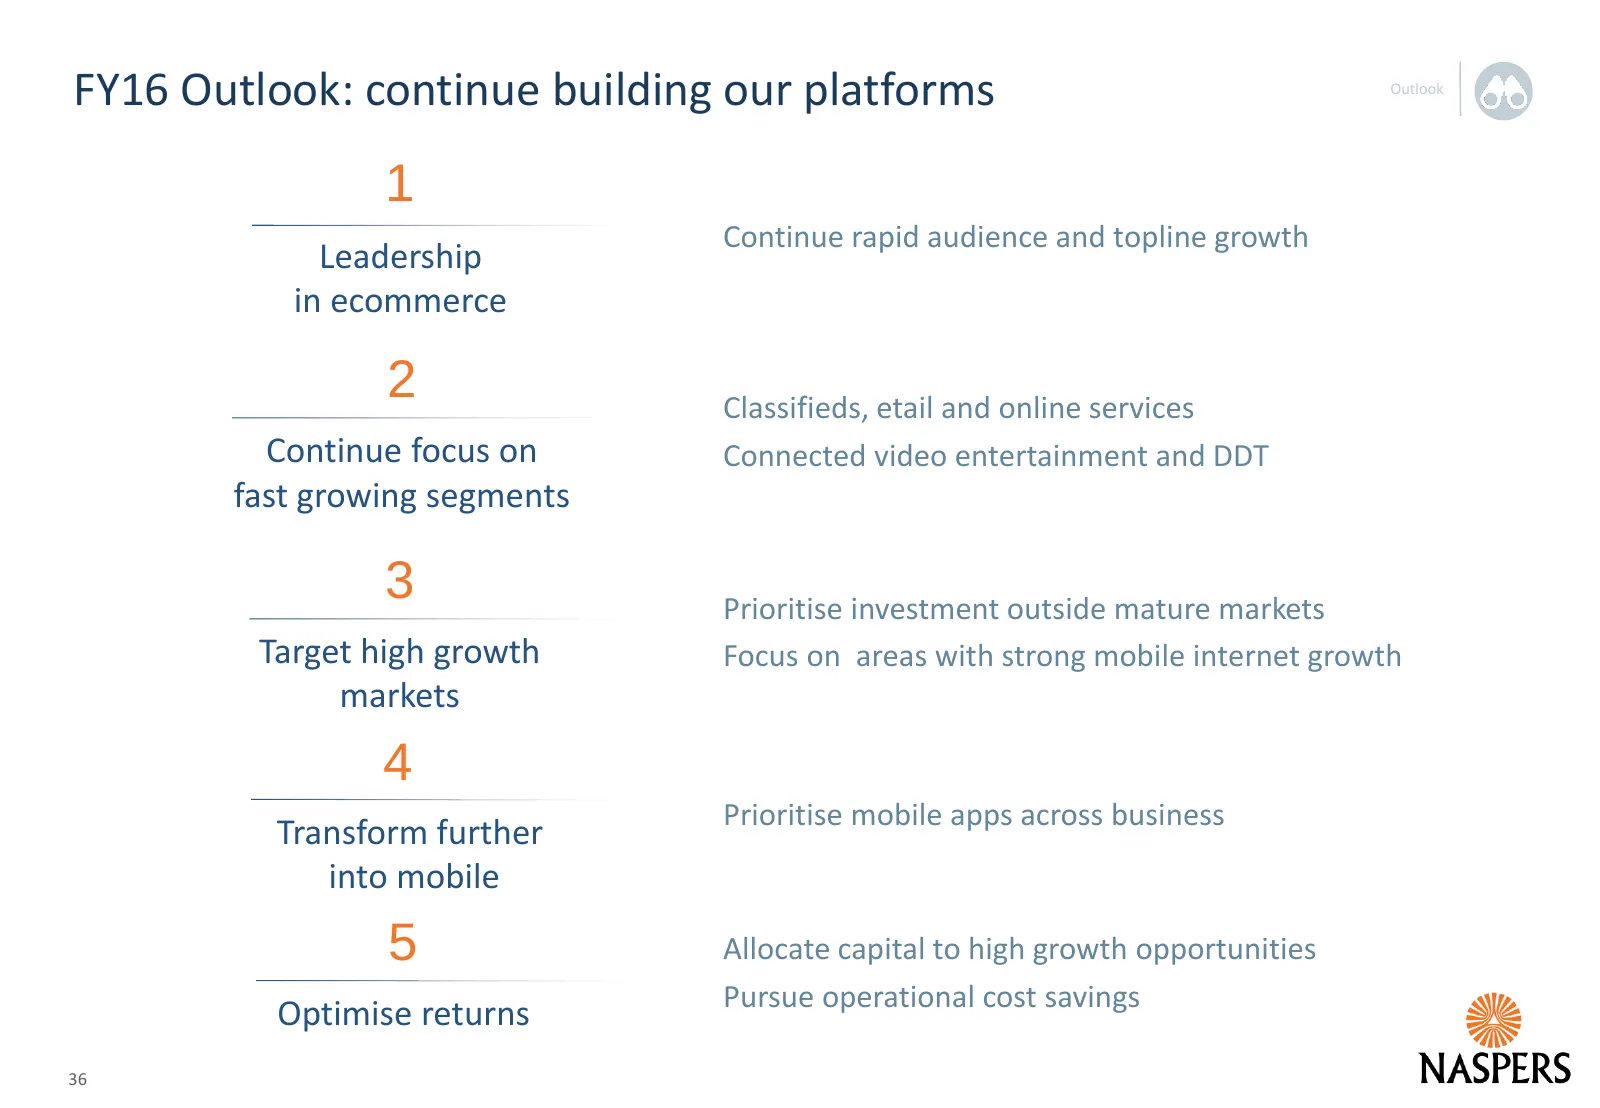
FY16 Outlook: continue building our platforms 1 Continue rapid audience and topline growth Leadership in ecommerce 2 Classifieds, etail and online services Continue focus on Connected video entertainment and DDT fast growing segments 3 Prioritise investment outside mature markets Target high growth
Slide 37: Overview Financials Internet
Overview Financials Internet Video Entertainment Outlook Appendix 37
Slide 38: Glossary of terms
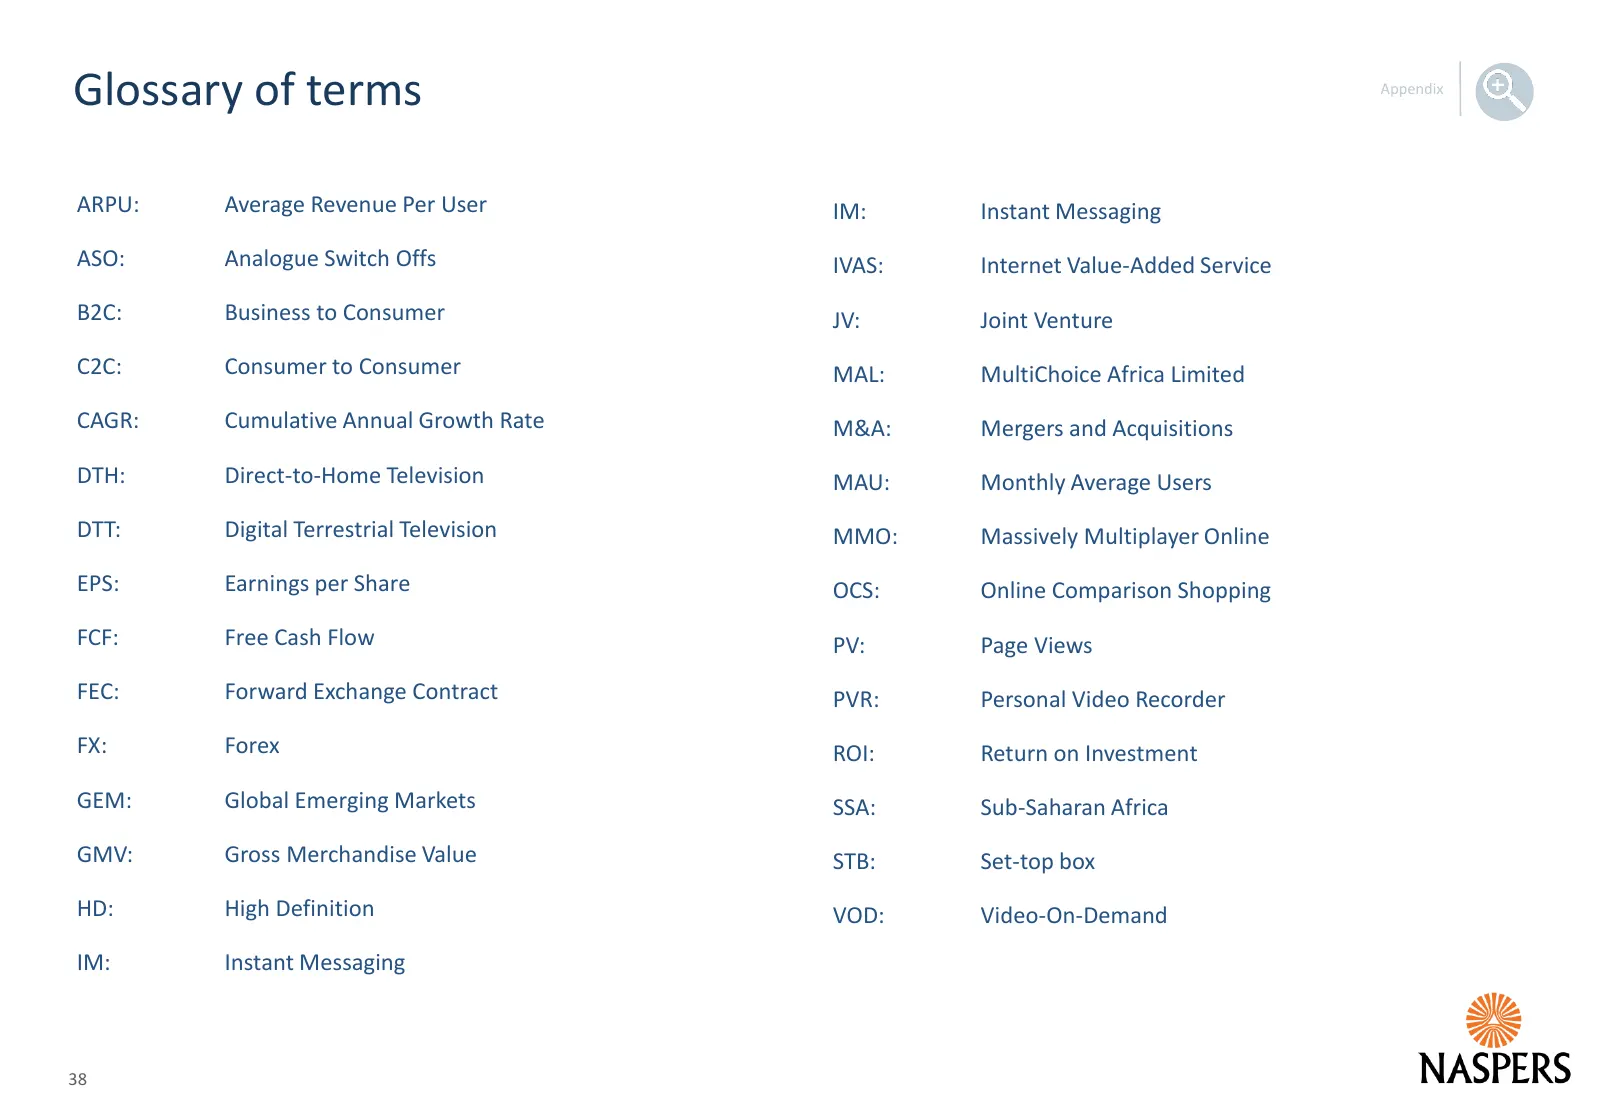
Glossary of terms ARPU: Average Revenue Per User IM: Instant Messaging ASO: Analogue Switch Offs IVAS: Internet Value-Added Service B2C: Business to Consumer JV: Joint Venture C2C: Consumer to Consumer MAL: MultiChoice Africa Limited CAGR: Cumulative Annual Growth Rate M&A: Mergers and Acquisitions
Slide 39: Investor Relations
Investor Relations Meloy Horn Office: +27 11 289 3320 Mobile: +27 82 7727 123 E-mail: InvestorRelations@naspers.com Website: www.naspers.com 39 39
Source: Internet Archive copy of naspers.com
More decks from Naspers Limited Class N
 FY2026 Earnings Presentation60 slides · Jun 29, 2026
 FY2026 Earnings Presentation17 slides · Mar 31, 2026
 H1 2026 Earnings Presentation64 slides · Nov 24, 2025
 H1 FY26 Earnings Presentation17 slides · November 2025
 FY2025 Earnings Presentation51 slides · June 2025
 FY2025 Earnings Presentation17 slides · 2025