Ambuja Cements Limited · NSE:AMBUJACEM
Ambuja Cements — Q2 2019 Earnings Presentation
22 slides from Ambuja Cements's earnings presentation, Jul 25, 2019
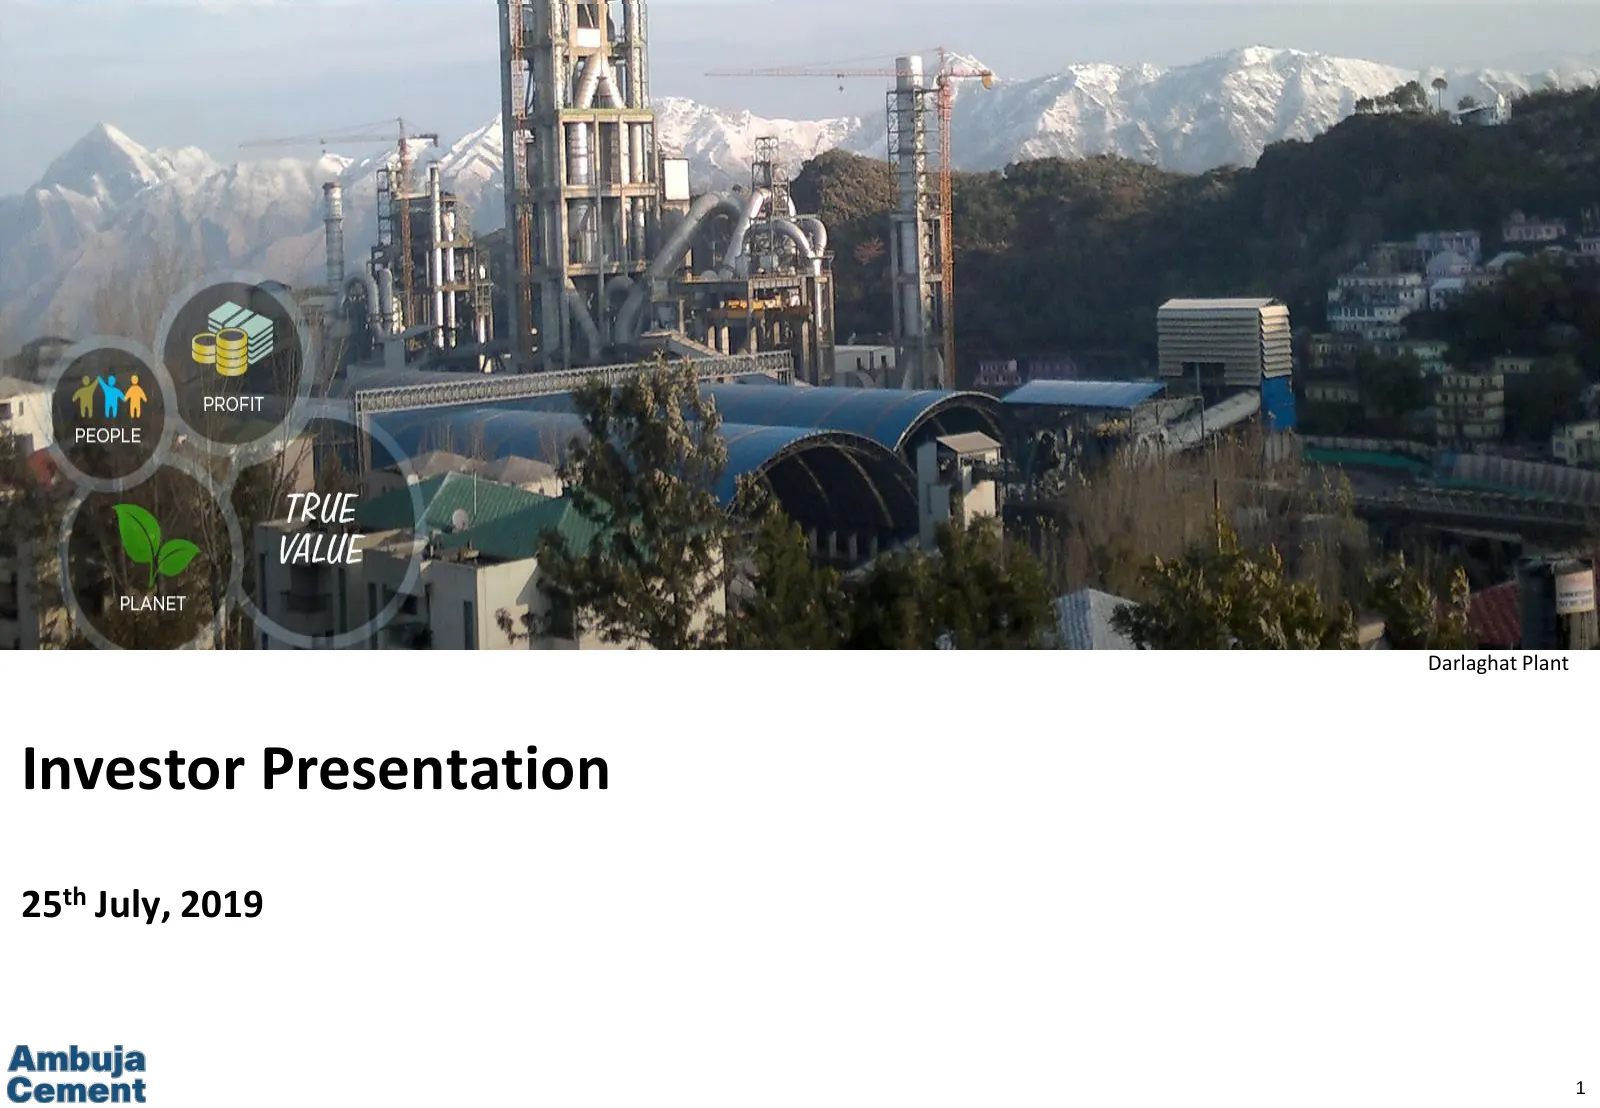
Slide 1: Investor Presentation
Darlaghat Plant Investor Presentation 25th July, 2019 1
Slide 2: Disclaimer / Safe Harbour
Disclaimer / Safe Harbour Cautionary statement regarding forward-looking statements This presentation may contain certain forward-looking statements relating to Ambuja Cements Ltd. (“Ambuja”, or “Company”) and its future business, development and economic performance. These statements include descri
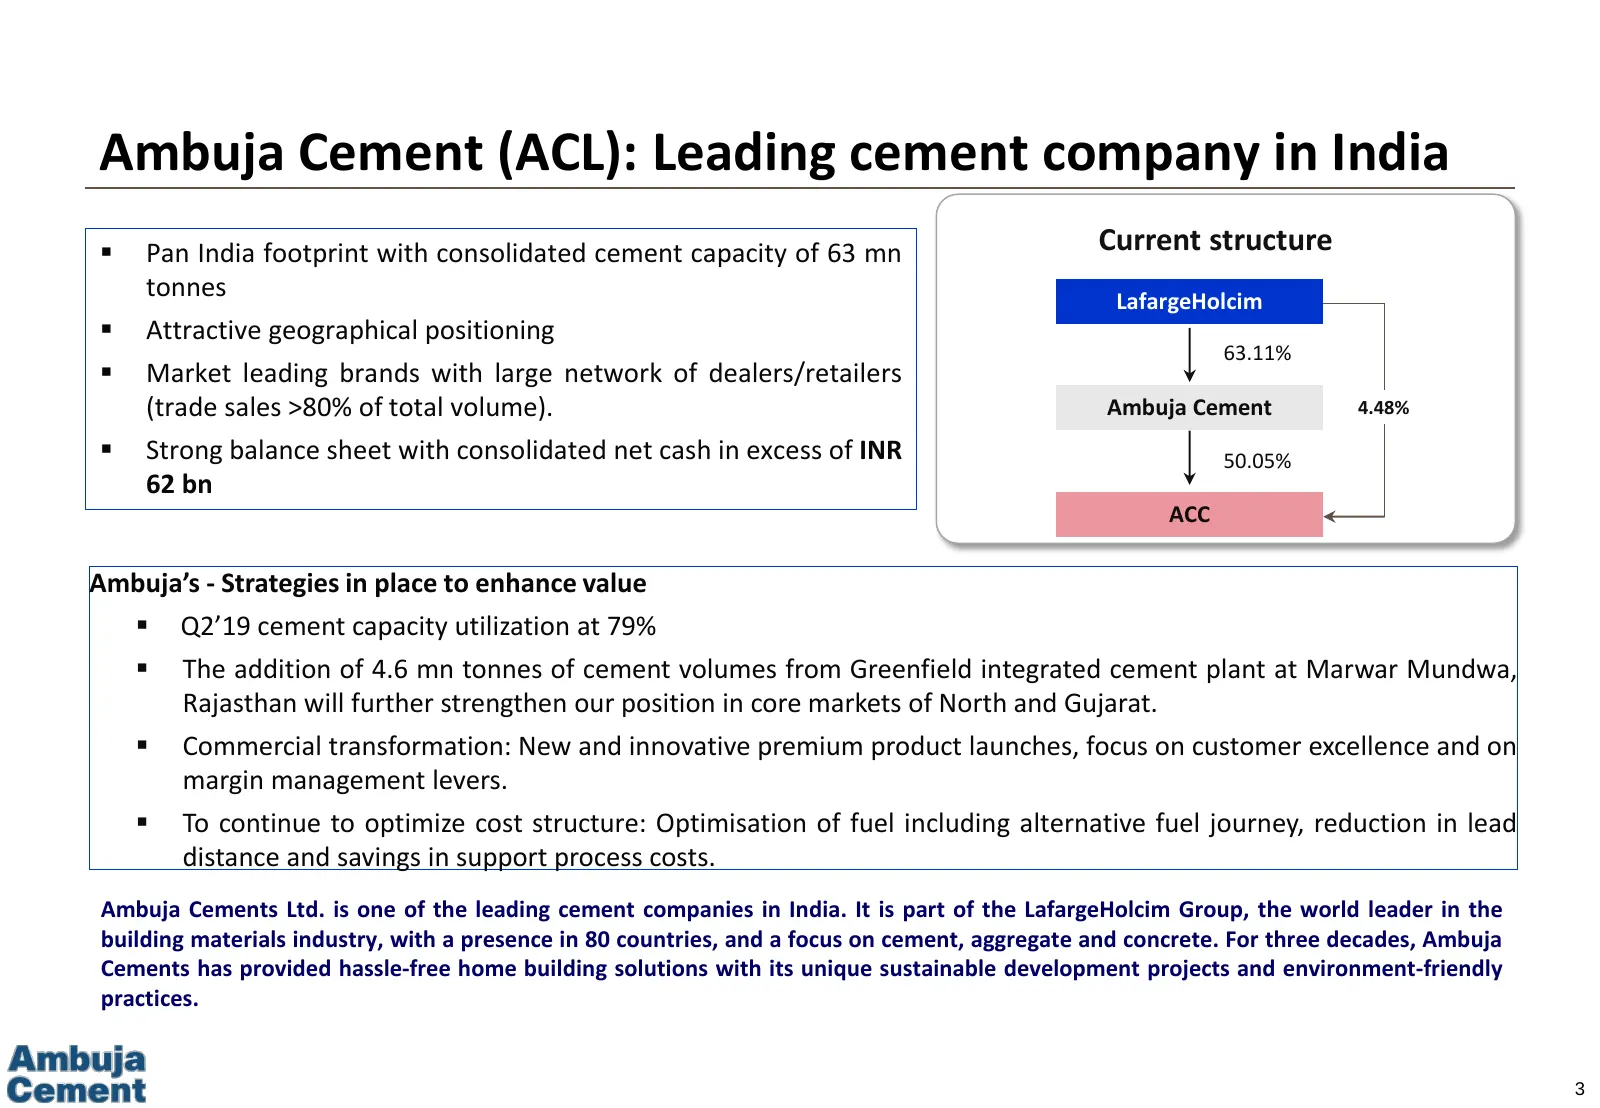
Slide 3: Ambuja Cement (ACL): Leading cement company in India
Ambuja Cement (ACL): Leading cement company in India Pan India footprint with consolidated cement capacity of 63 mn Current structure tonnes LafargeHolcim Attractive geographical positioning 63.11% Market leading brands with large network of dealers/retailers (trade sales >80% of total volume)
Slide 4: Contents
Contents Performance Highlights Performance Analysis Standalone, Consolidated Financial Performance Other New Initiatives undertaken in the Quarter 4
Slide 5: Performance Highlights
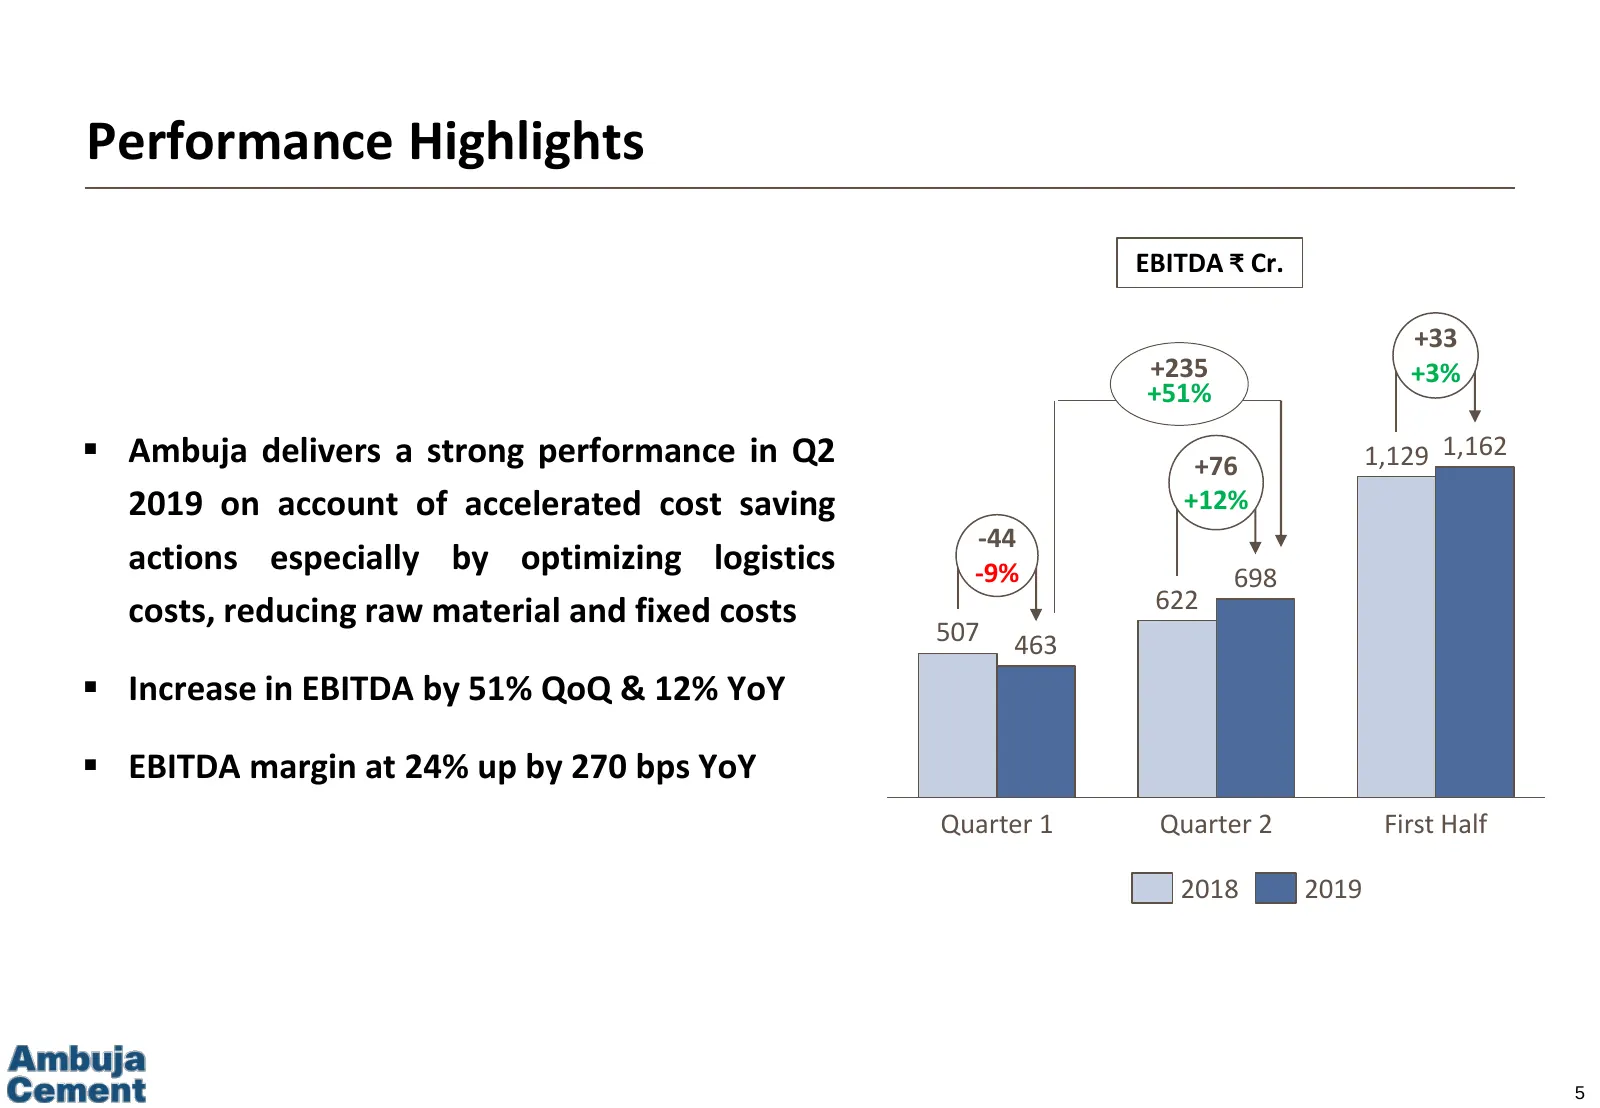
Performance Highlights EBITDA ₹ Cr. +33 +235 +3% +51% Ambuja delivers a strong performance in Q2 +76 1,129 1,162 2019 on account of accelerated cost saving +12% -44 actions especially by optimizing logistics -9% 698 costs, reducing raw material and fixed costs 622 507 463 Increase in EBITDA by 5
Slide 6: Performance Analysis
Performance Highlights Performance Analysis Standalone, Consolidated Financial Performance Other New Initiatives undertaken in the Quarter 6
Slide 7: Cement Sales Volumes
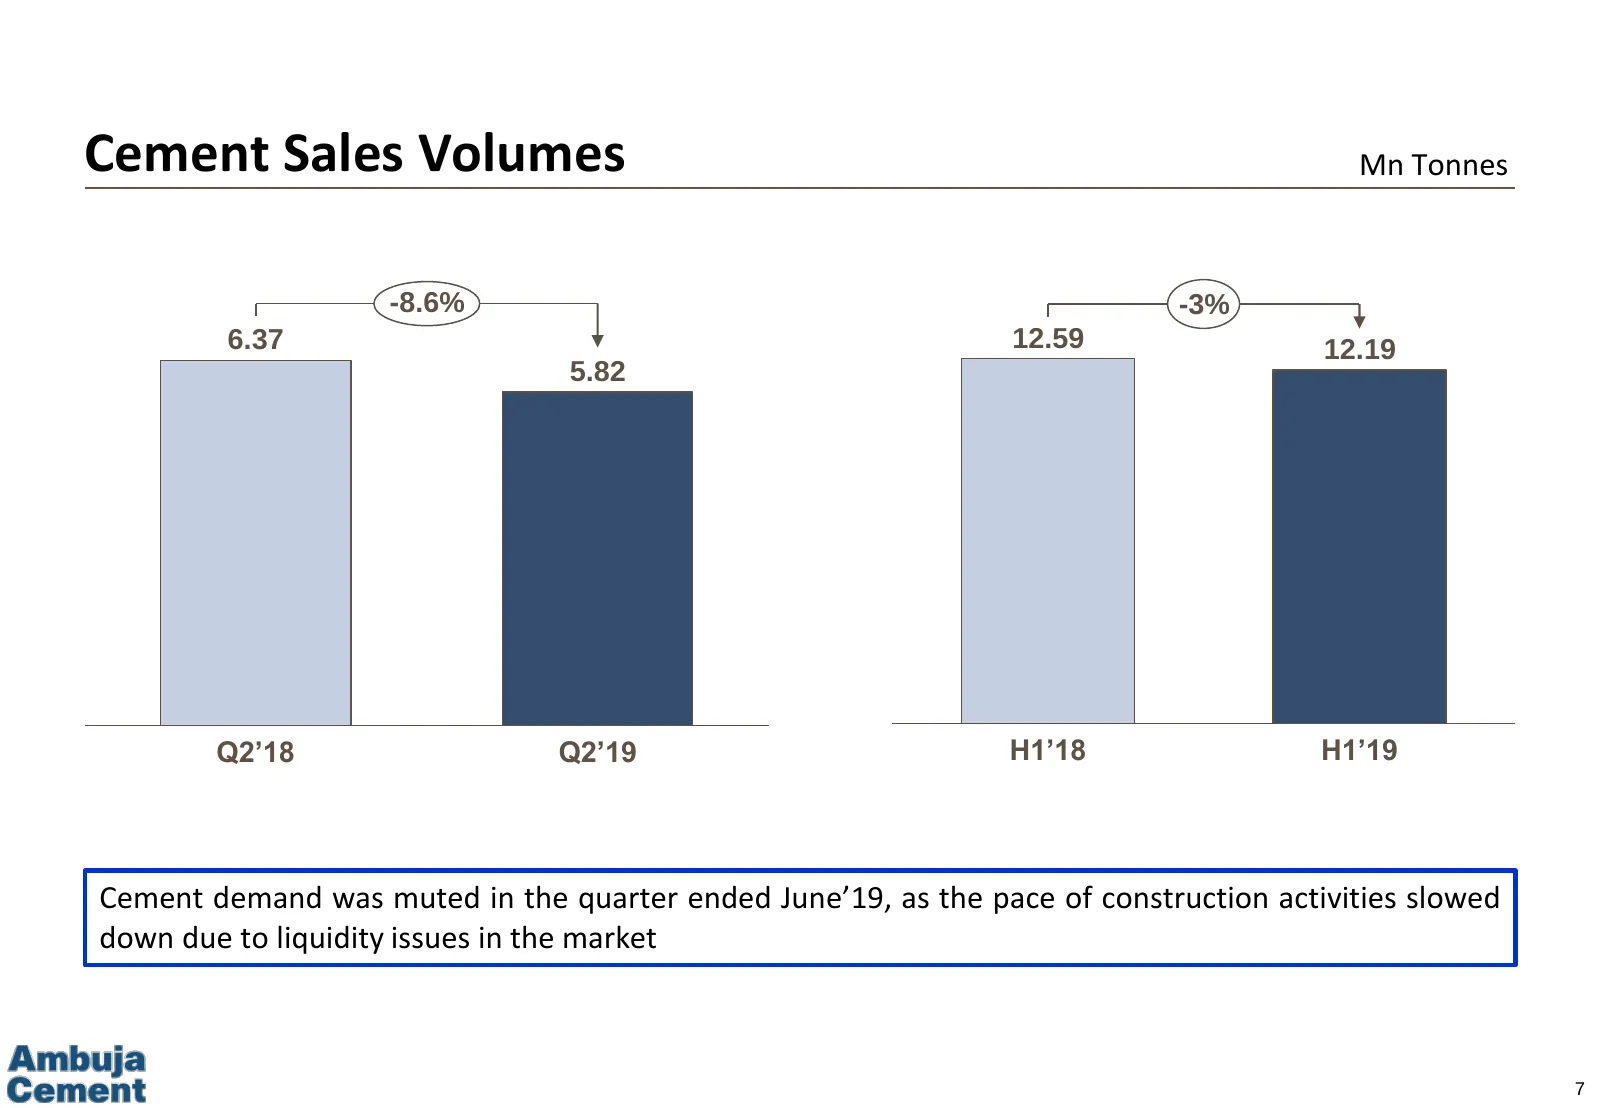
Cement Sales Volumes Mn Tonnes -8.6% -3% 6.37 12.59 12.19 5.82 Q2’18 Q2’19 H1’18 H1’19 Cement demand was muted in the quarter ended June’19, as the pace of construction activities slowed down due to liquidity issues in the market 7
Slide 8: Net Sales
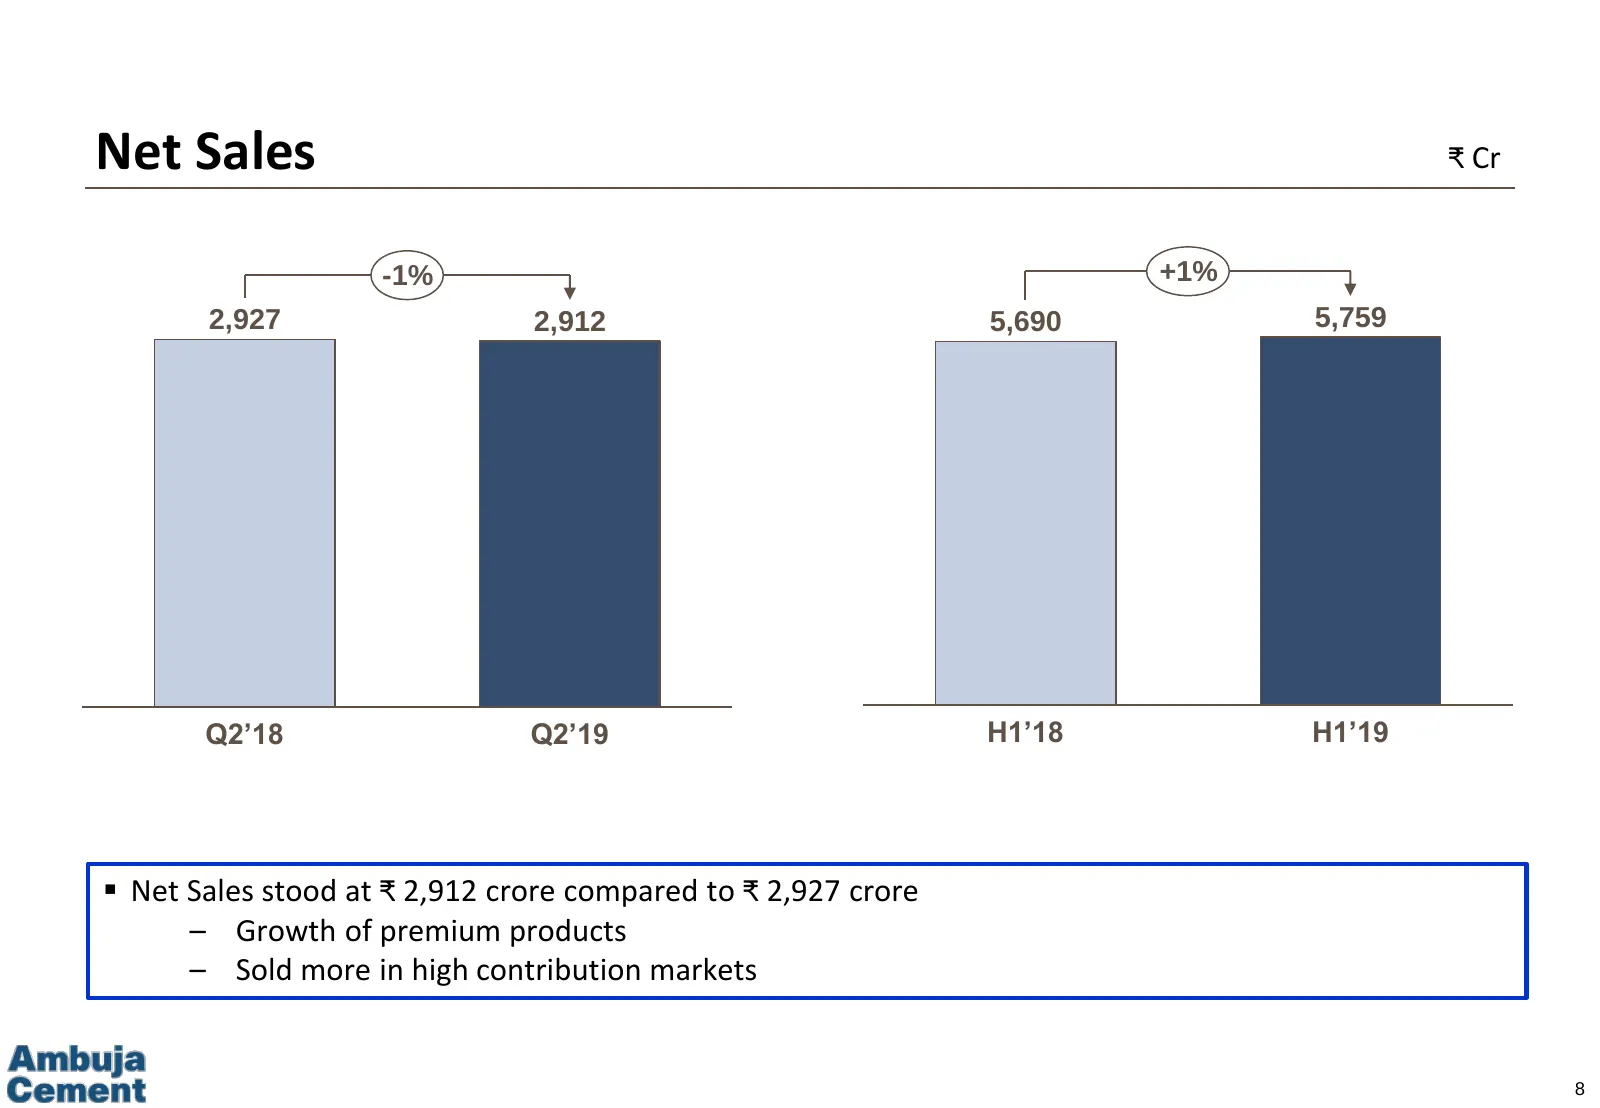
Net Sales ₹ Cr -1% +1% 2,927 2,912 5,690 5,759 Q2’18 Q2’19 H1’18 H1’19 Net Sales stood at ₹ 2,912 crore compared to ₹ 2,927 crore – Growth of premium products – Sold more in high contribution markets 8
Slide 9: EBITDA
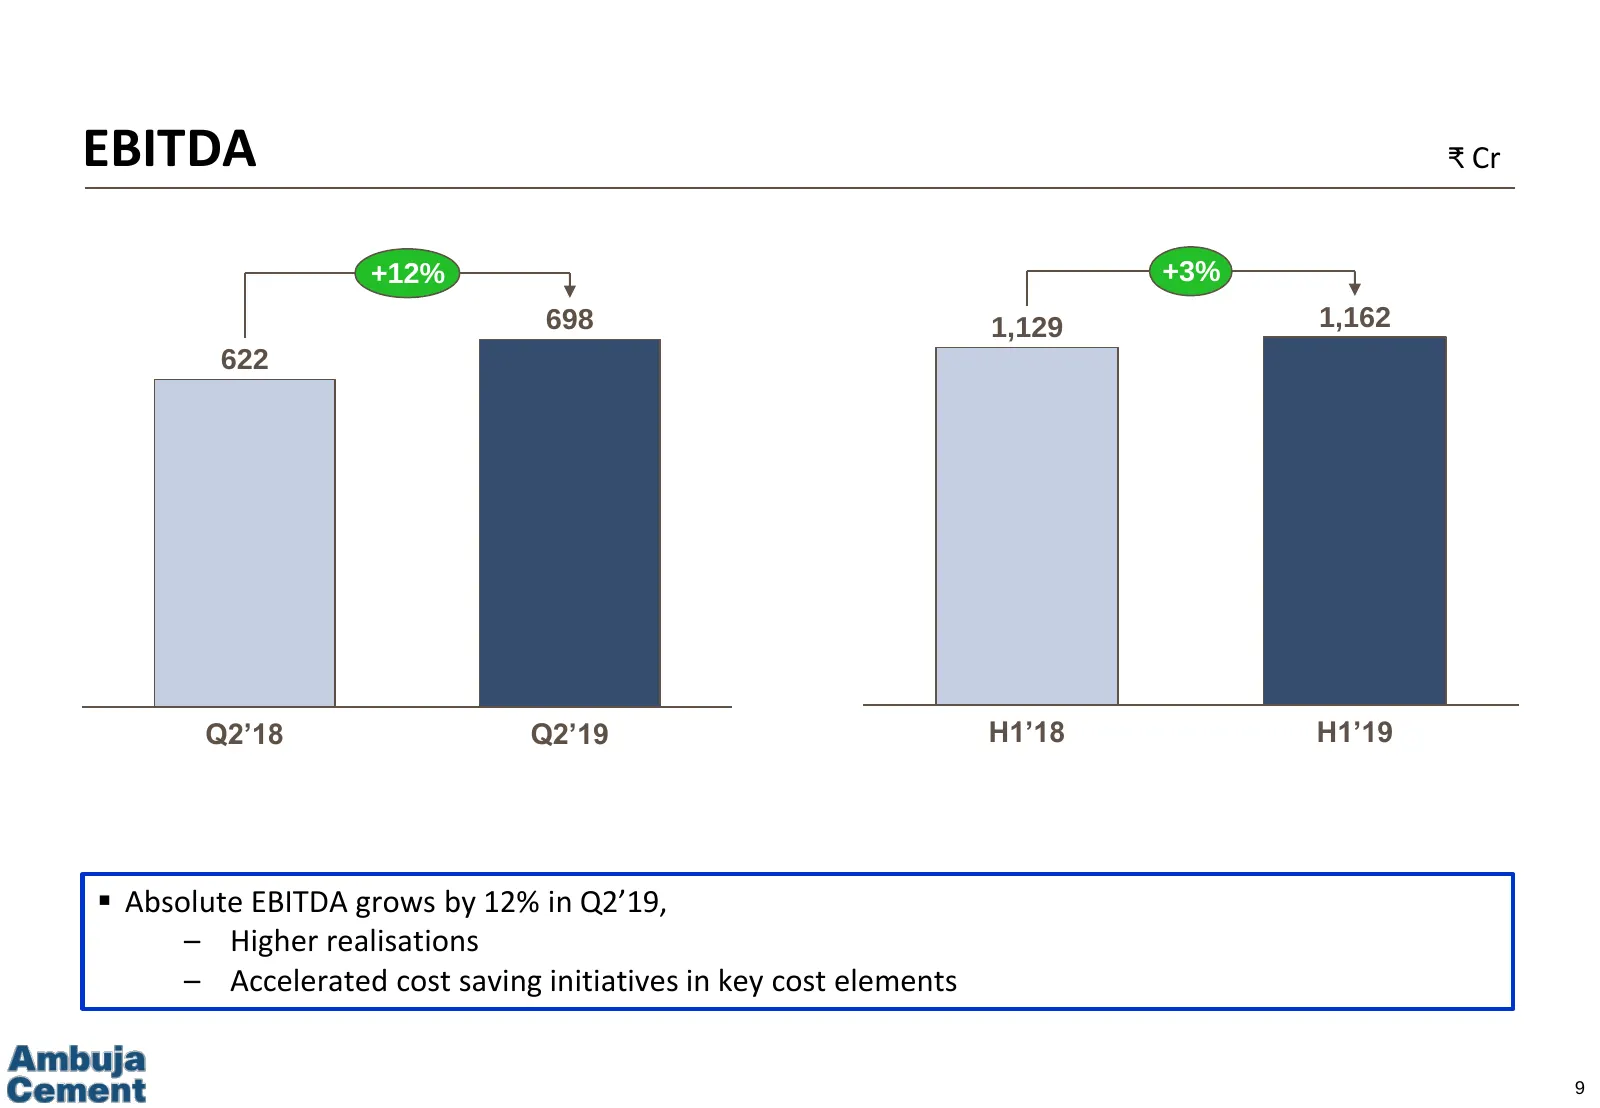
EBITDA ₹ Cr +12% +3% 698 1,129 1,162 622 Q2’18 Q2’19 H1’18 H1’19 Absolute EBITDA grows by 12% in Q2’19, – Higher realisations – Accelerated cost saving initiatives in key cost elements 9
Slide 10: Raw Material Cost
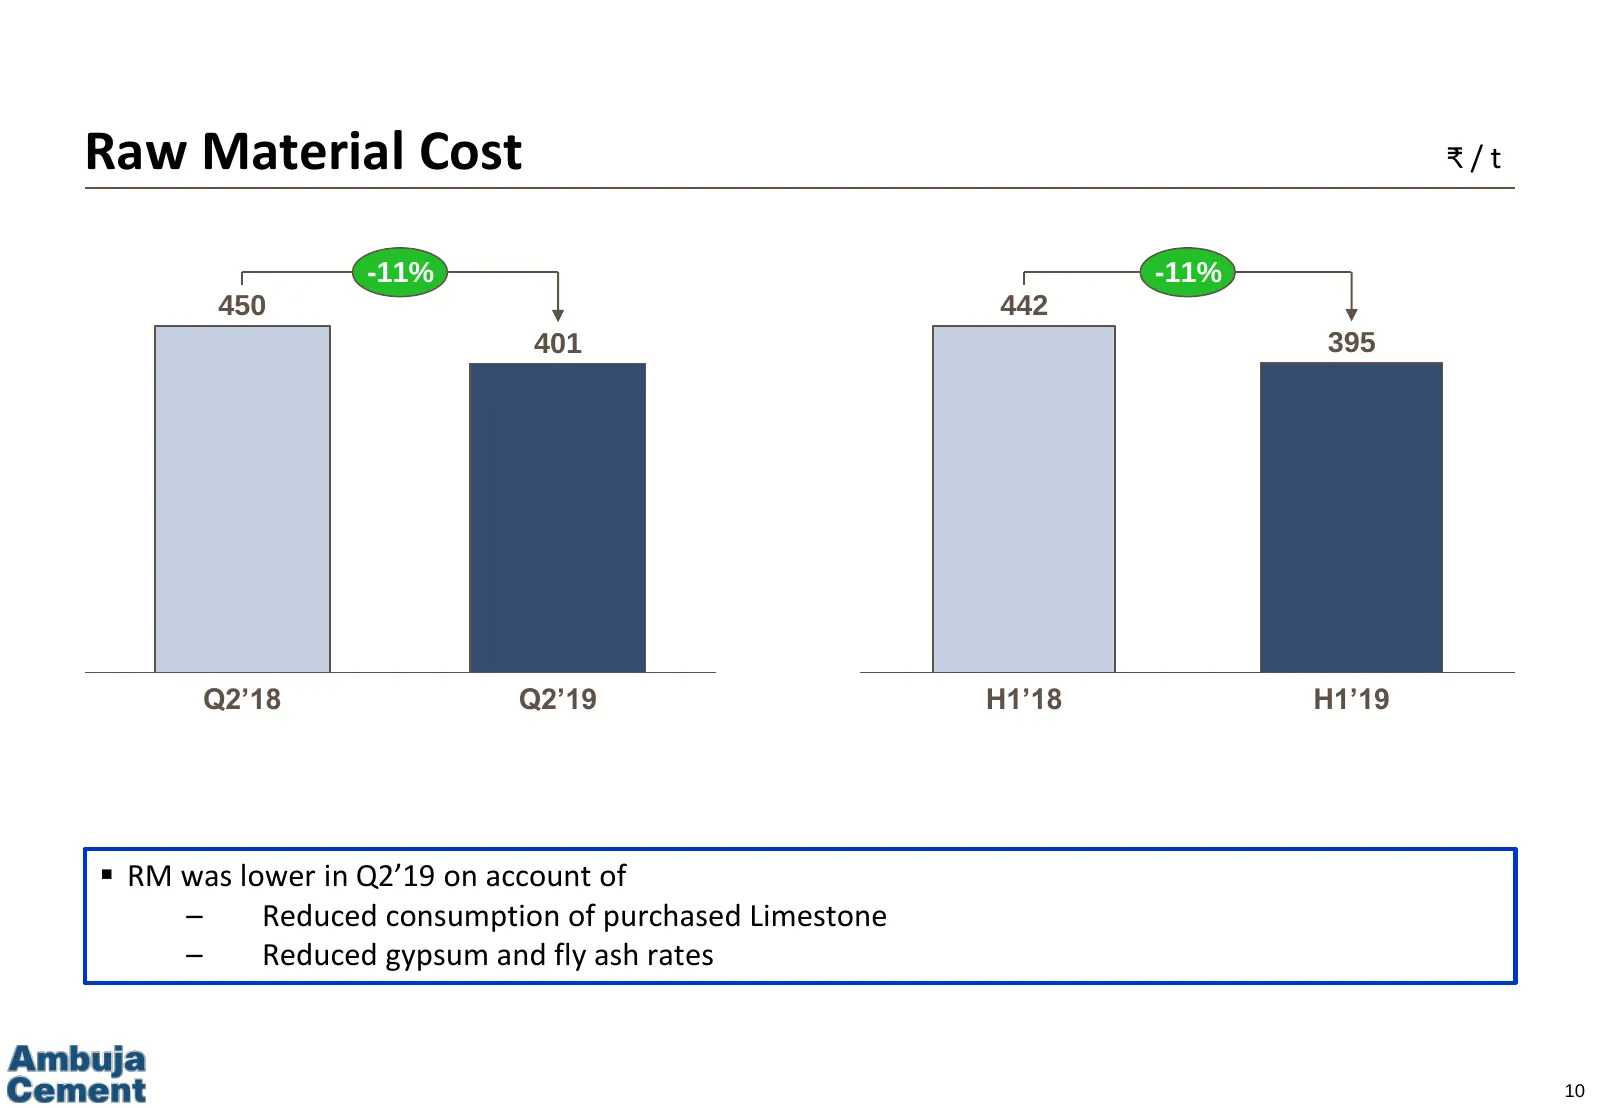
Raw Material Cost ₹/t -11% -11% 450 442 401 395 Q2’18 Q2’19 H1’18 H1’19 RM was lower in Q2’19 on account of – Reduced consumption of purchased Limestone – Reduced gypsum and fly ash rates 10
Slide 11: Power & Fuel Cost
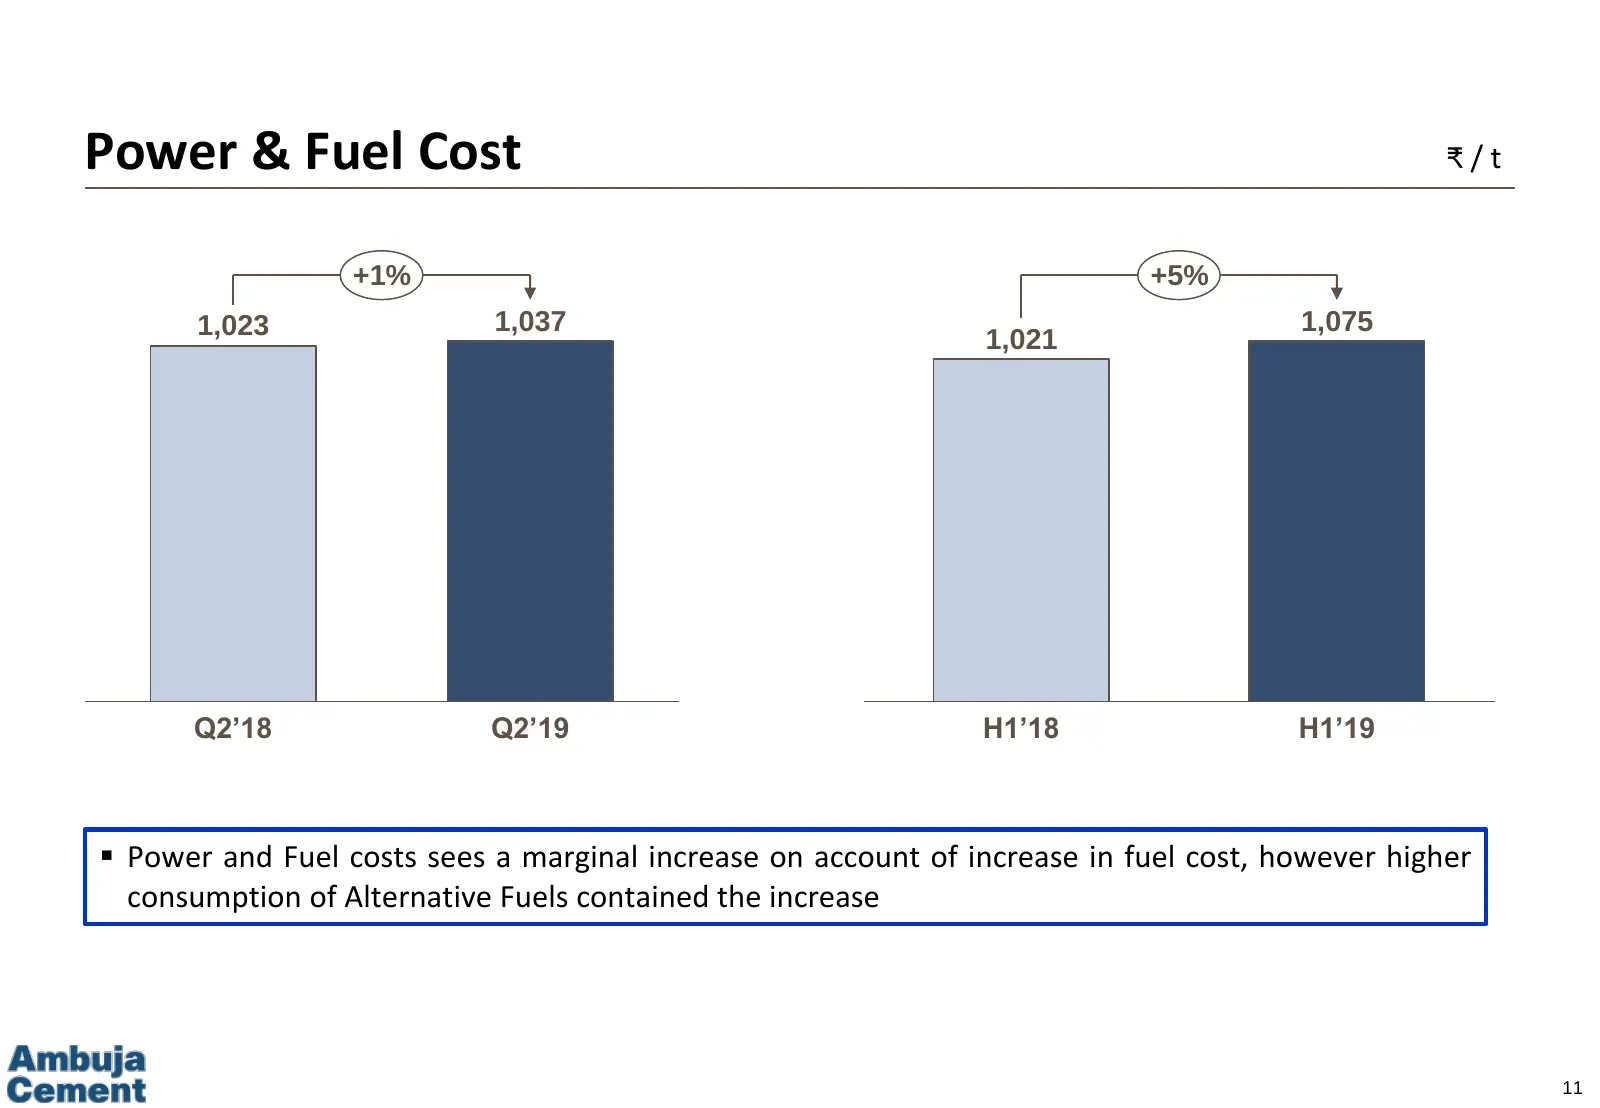
Power & Fuel Cost ₹/t +1% +5% 1,023 1,037 1,075 1,021 Q2’18 Q2’19 H1’18 H1’19 Power and Fuel costs sees a marginal increase on account of increase in fuel cost, however higher consumption of Alternative Fuels contained the increase 11
Slide 12: Freight & Forwarding Cost
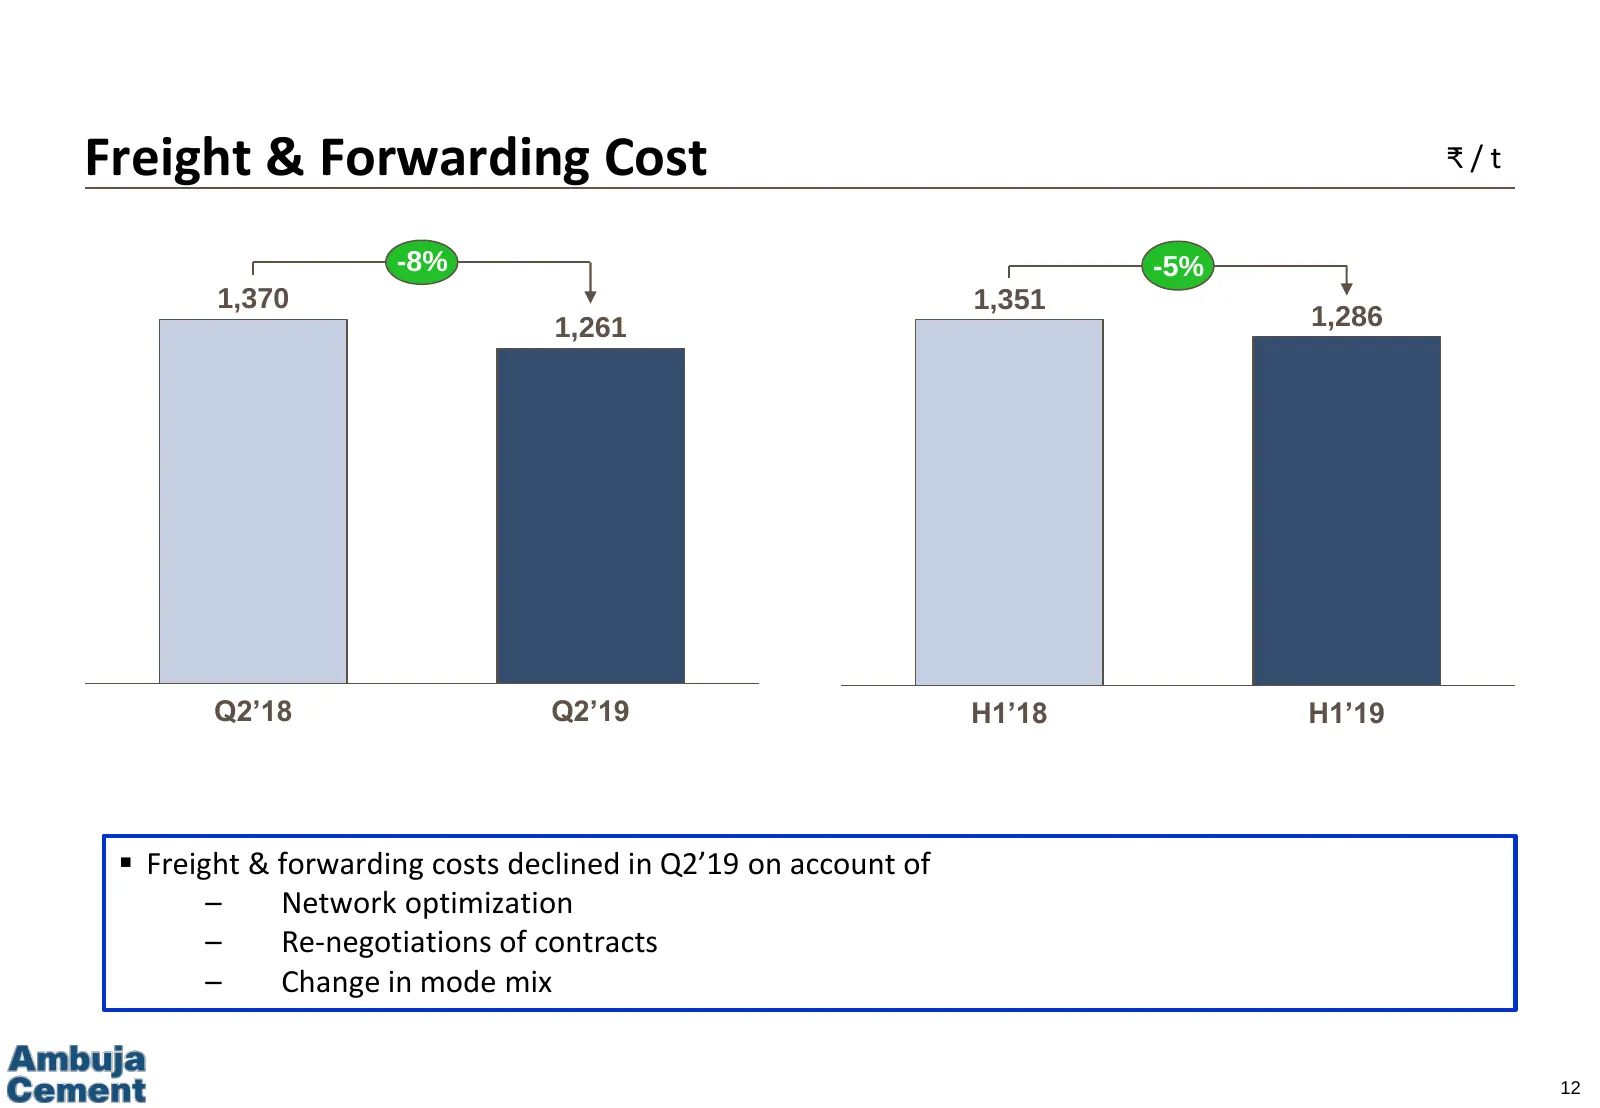
Freight & Forwarding Cost ₹/t -8% -5% 1,370 1,351 1,261 1,286 Q2’18 Q2’19 H1’18 H1’19 Freight & forwarding costs declined in Q2’19 on account of – Network optimization – Re-negotiations of contracts – Change in mode mix 12
Slide 13: Other Expenses
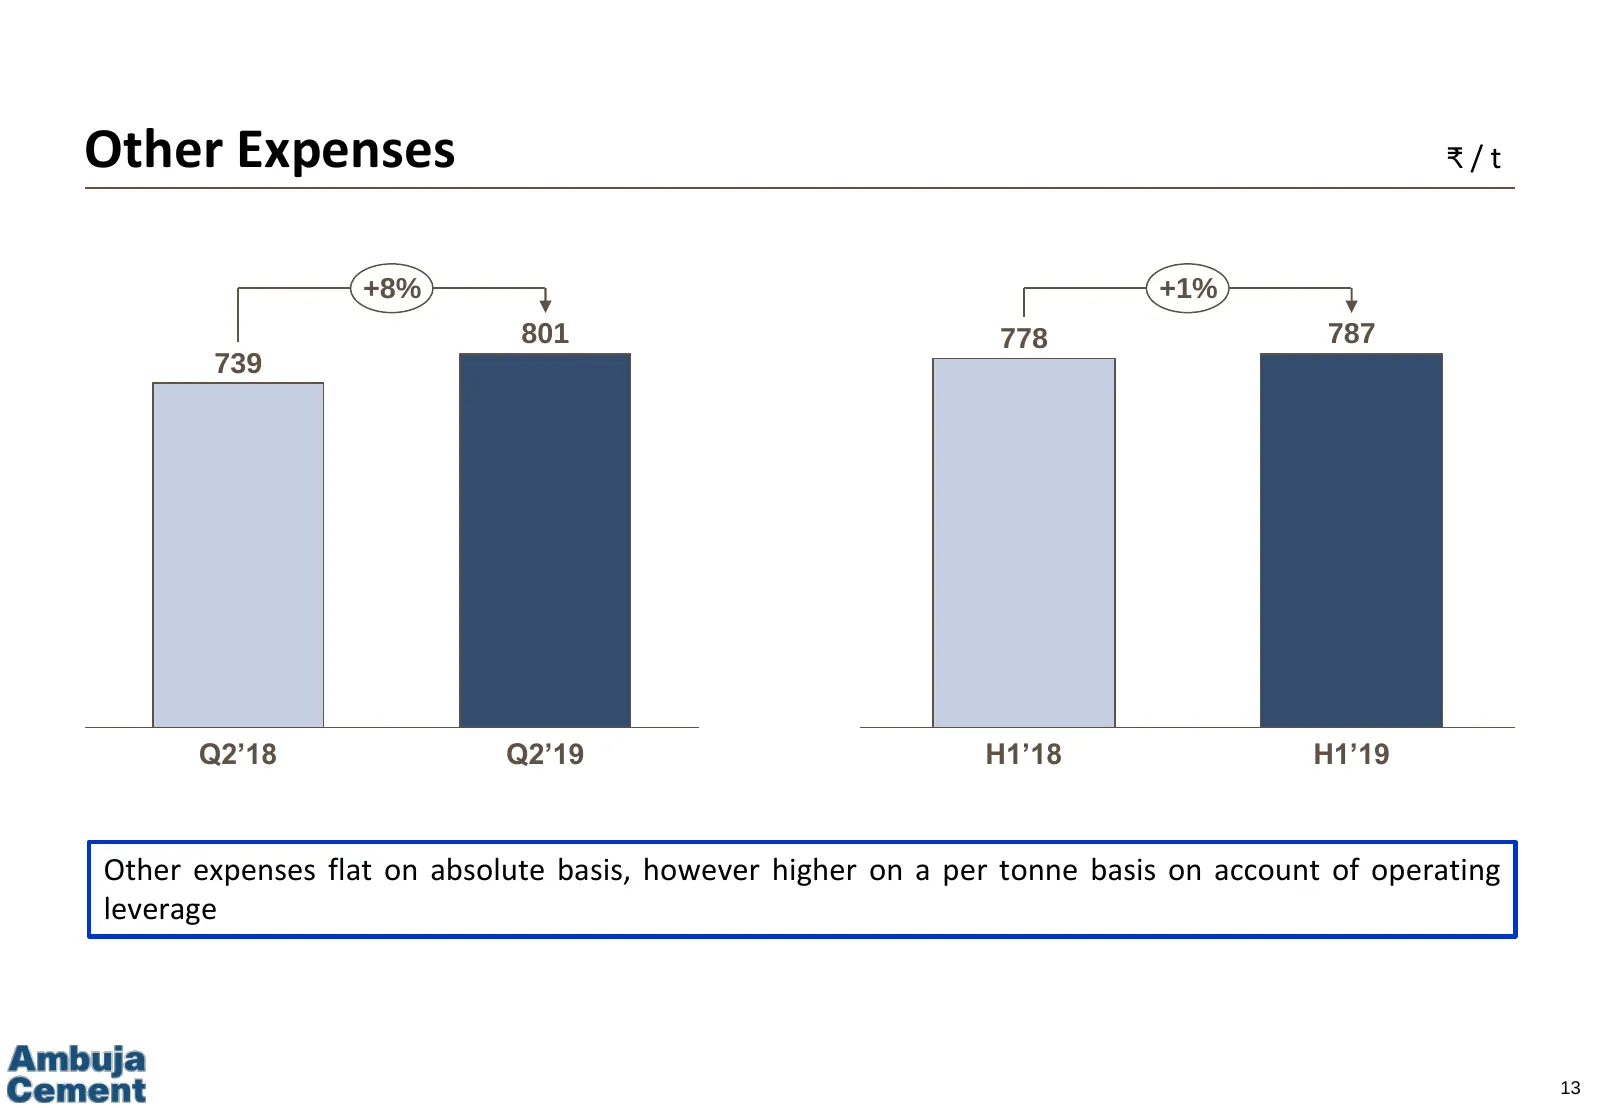
Other Expenses ₹/t +8% +1% 801 778 787 739 Q2’18 Q2’19 H1’18 H1’19 Other expenses flat on absolute basis, however higher on a per tonne basis on account of operating leverage 13
Slide 14: Standalone, Consolidated Financial Performance
Performance Highlights Performance Analysis Standalone, Consolidated Financial Performance Other New Initiatives undertaken in the Quarter 14
Slide 15: Standalone Results
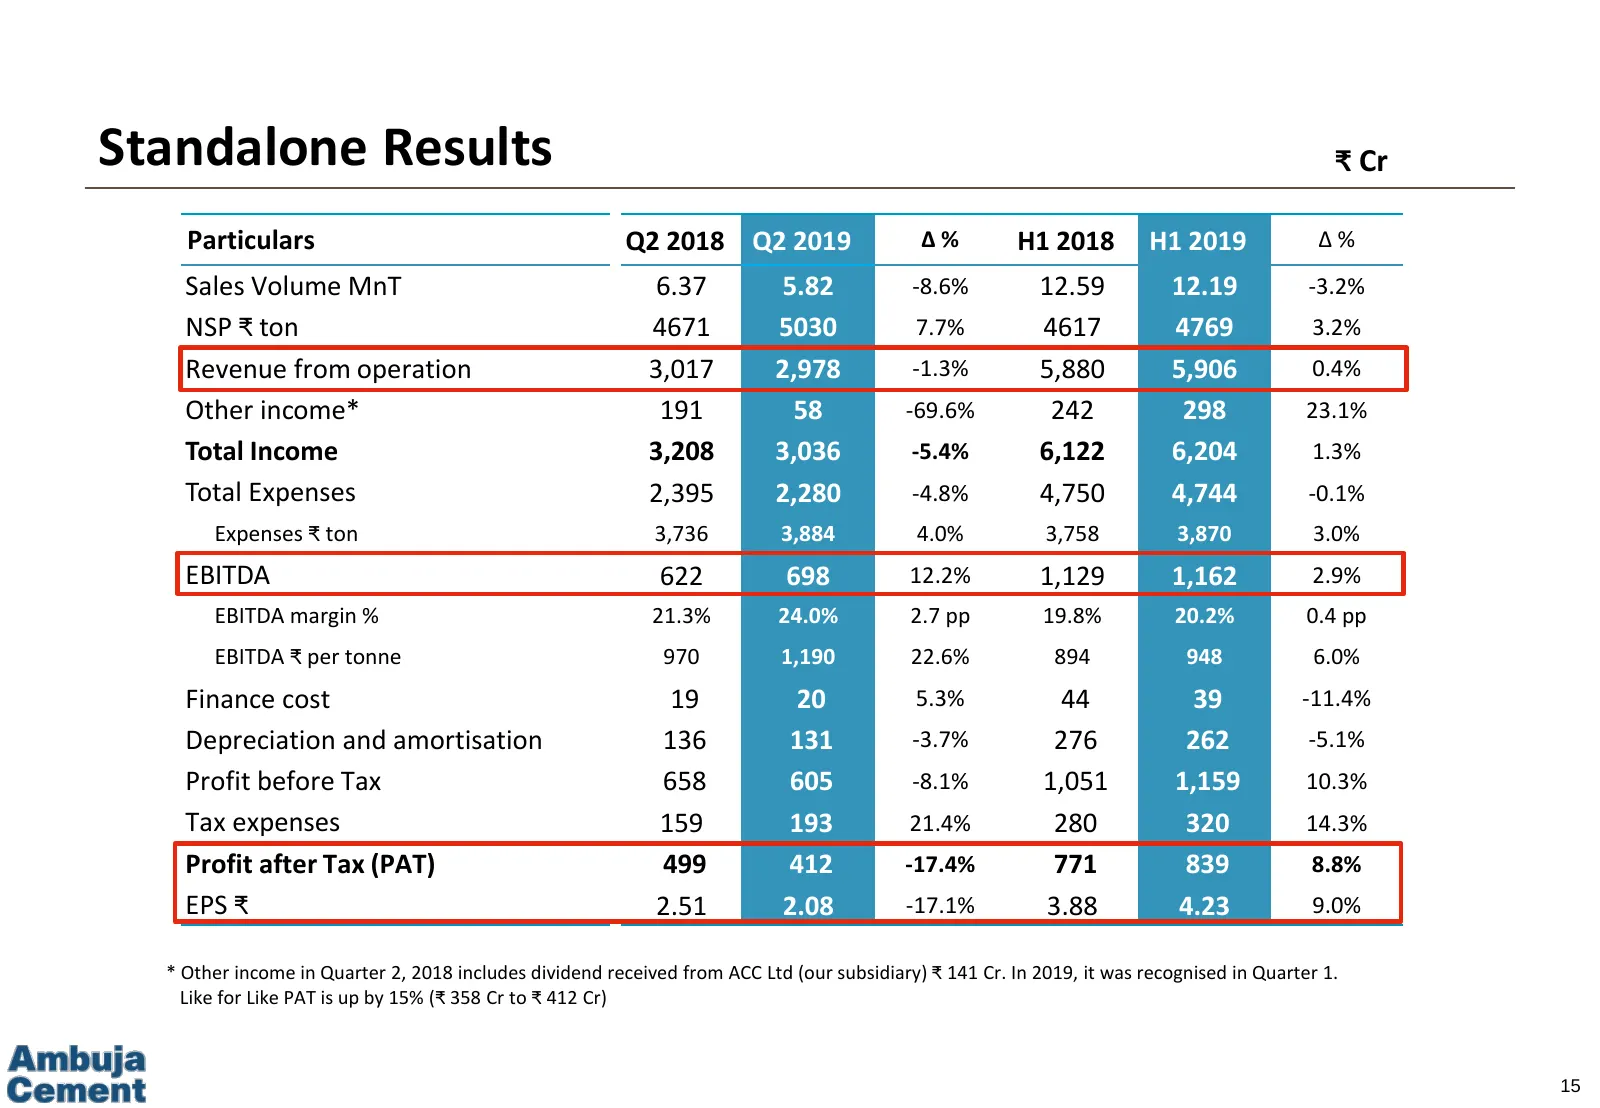
Standalone Results ₹ Cr Particulars Q2 2018 Q2 2019 ∆% H1 2018 H1 2019 ∆% Sales Volume MnT 6.37 5.82 -8.6% 12.59 12.19 -3.2% NSP ₹ ton 4671 5030 7.7% 4617 4769 3.2% Revenue from operation 3,017 2,978 -1.3% 5,880 5,906 0.4% Other income* 191 58 -69.6% 242 298 23.1% Total Income 3,208 3,036 -5.4% 6,12
Slide 16: Consolidated Results
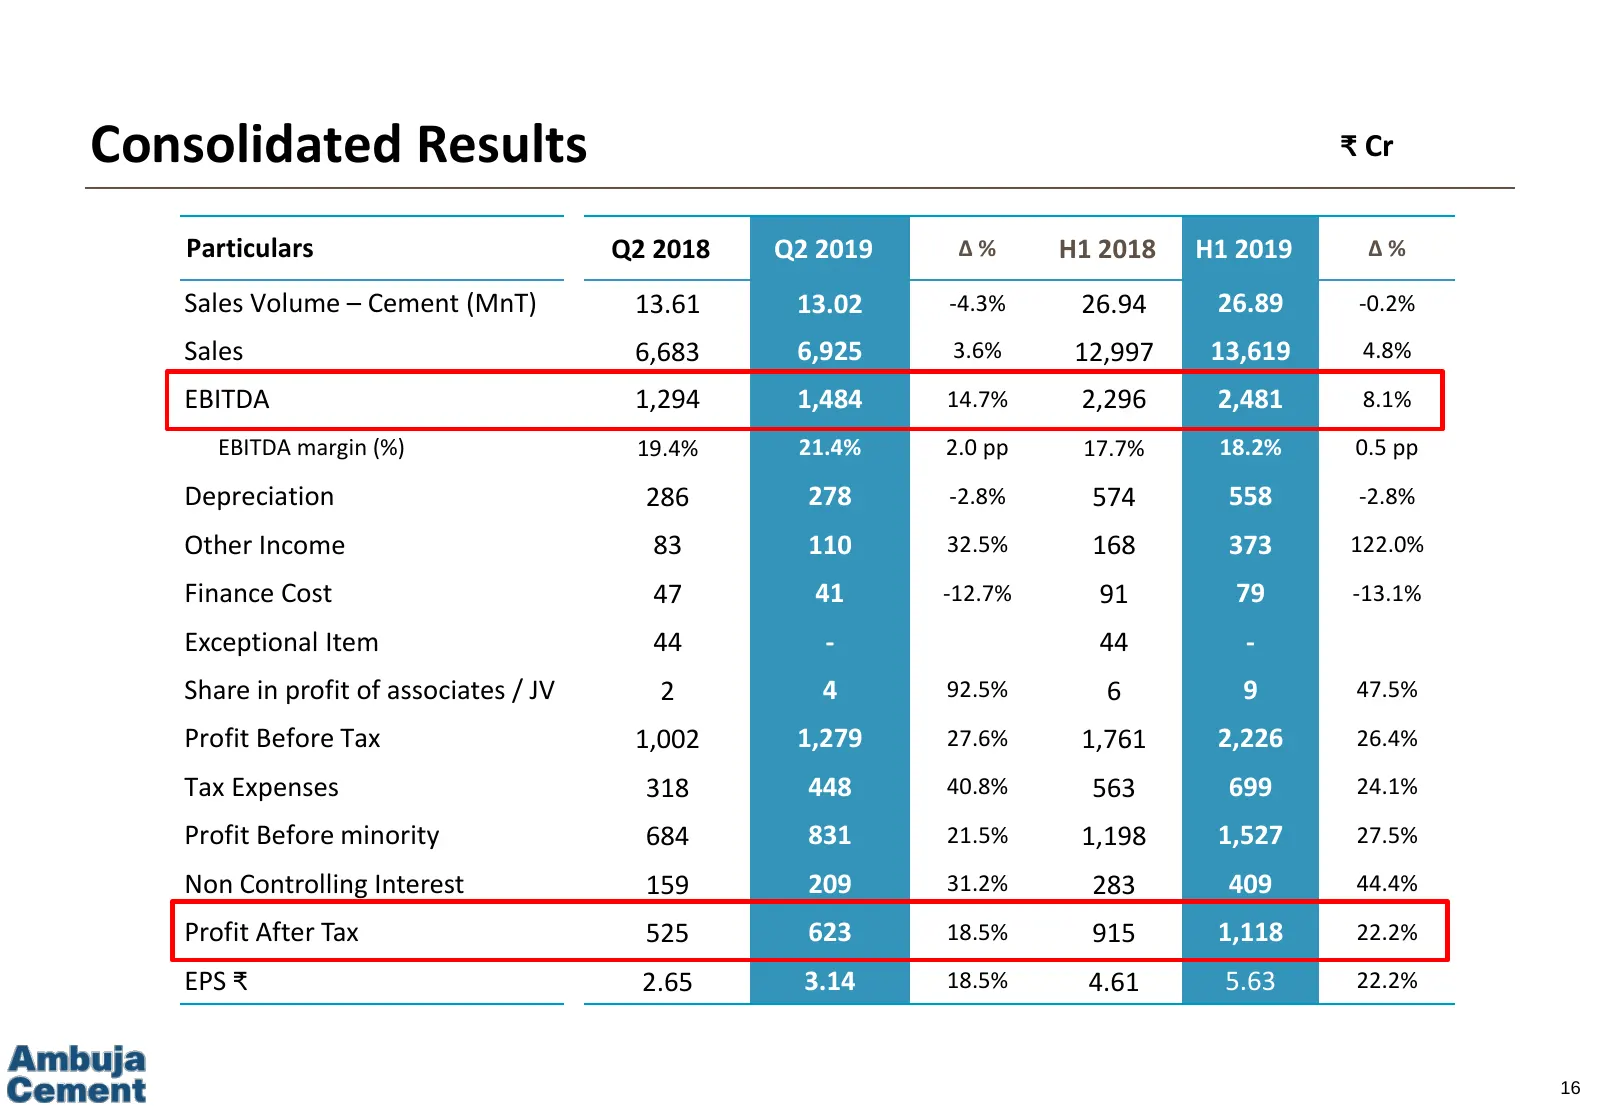
Consolidated Results ₹ Cr Particulars Q2 2018 Q2 2019 ∆% H1 2018 H1 2019 ∆% Sales Volume – Cement (MnT) 13.61 13.02 -4.3% 26.94 26.89 -0.2% Sales 6,683 6,925 3.6% 12,997 13,619 4.8% EBITDA 1,294 1,484 14.7% 2,296 2,481 8.1% EBITDA margin (%) 19.4% 21.4% 2.0 pp 17.7% 18.2% 0.5 pp Depreciation 286 278
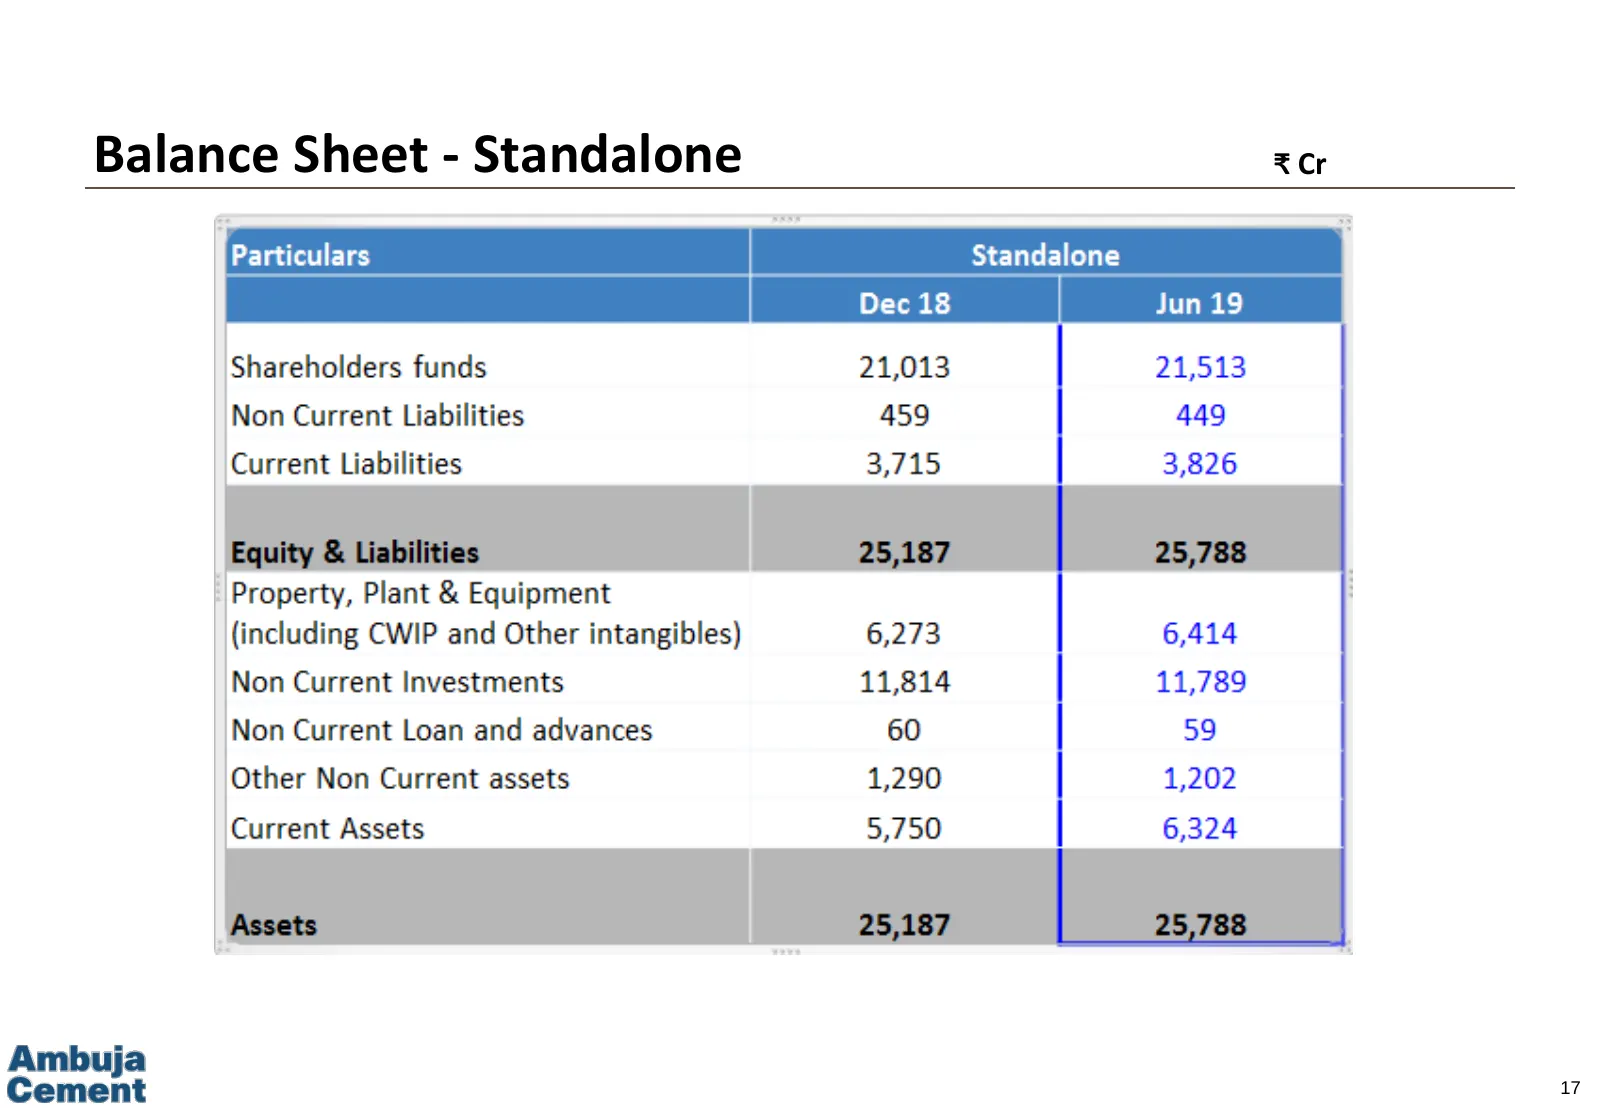
Slide 17: Balance Sheet - Standalone
Balance Sheet - Standalone ₹ Cr 17
Slide 18: Other New Initiatives undertaken in the Quarter
Performance Highlights Performance Analysis Standalone, Consolidated Finance Performance Other New Initiatives undertaken in the Quarter 18
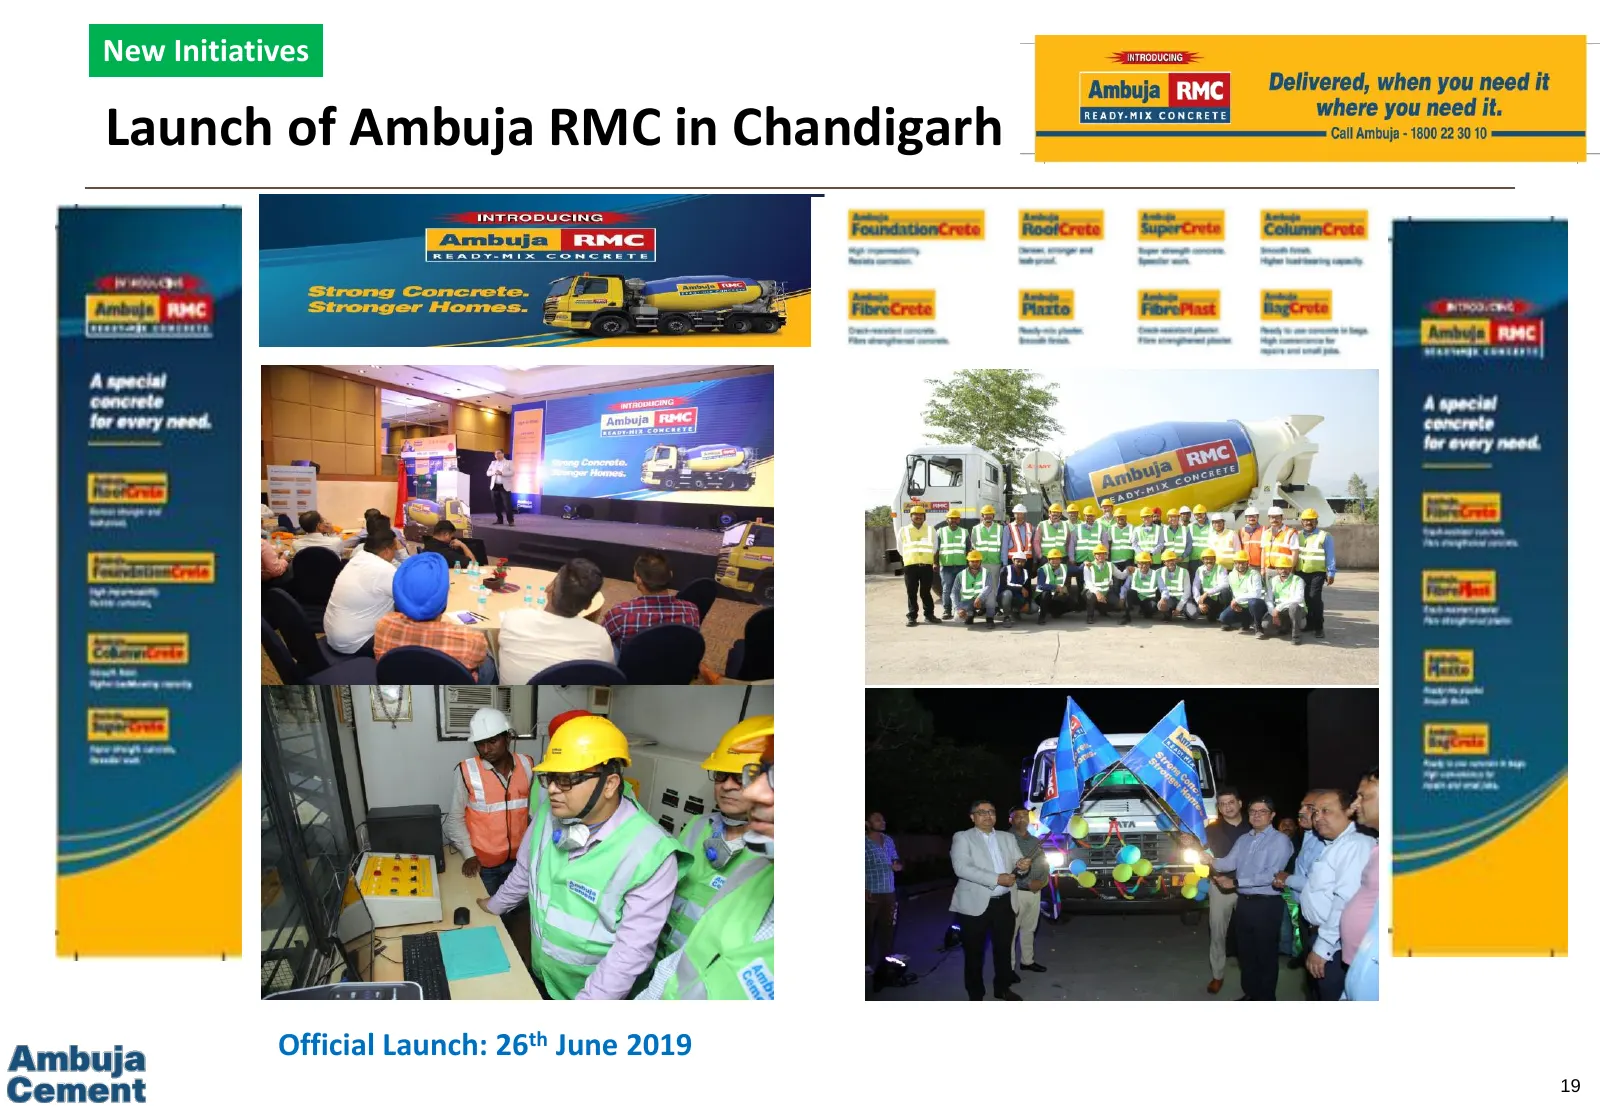
Slide 19: Launch of Ambuja RMC in Chandigarh
New Initiatives Launch of Ambuja RMC in Chandigarh Official Launch: 26th June 2019 19
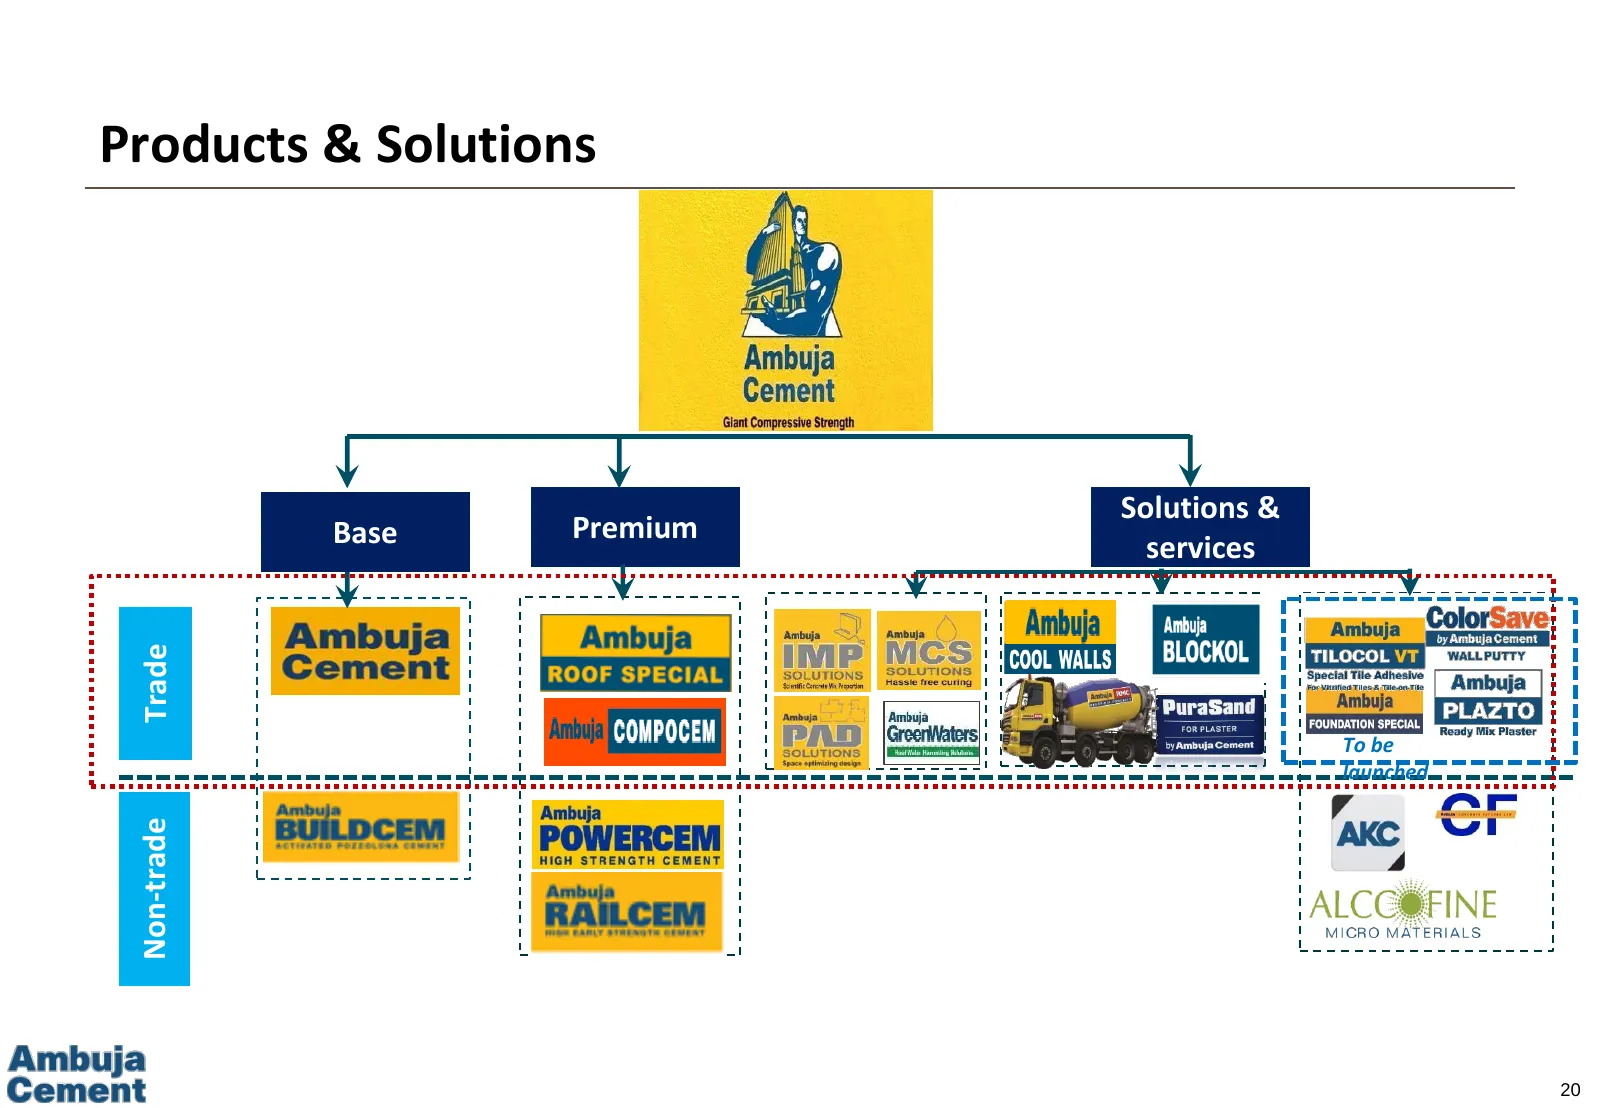
Slide 20: Products & Solutions
Products & Solutions Solutions & Base Premium services Trade To be launched Non-trade C 2017 LafargeHolcim O 20
Slide 21: ACL Product Portfolio
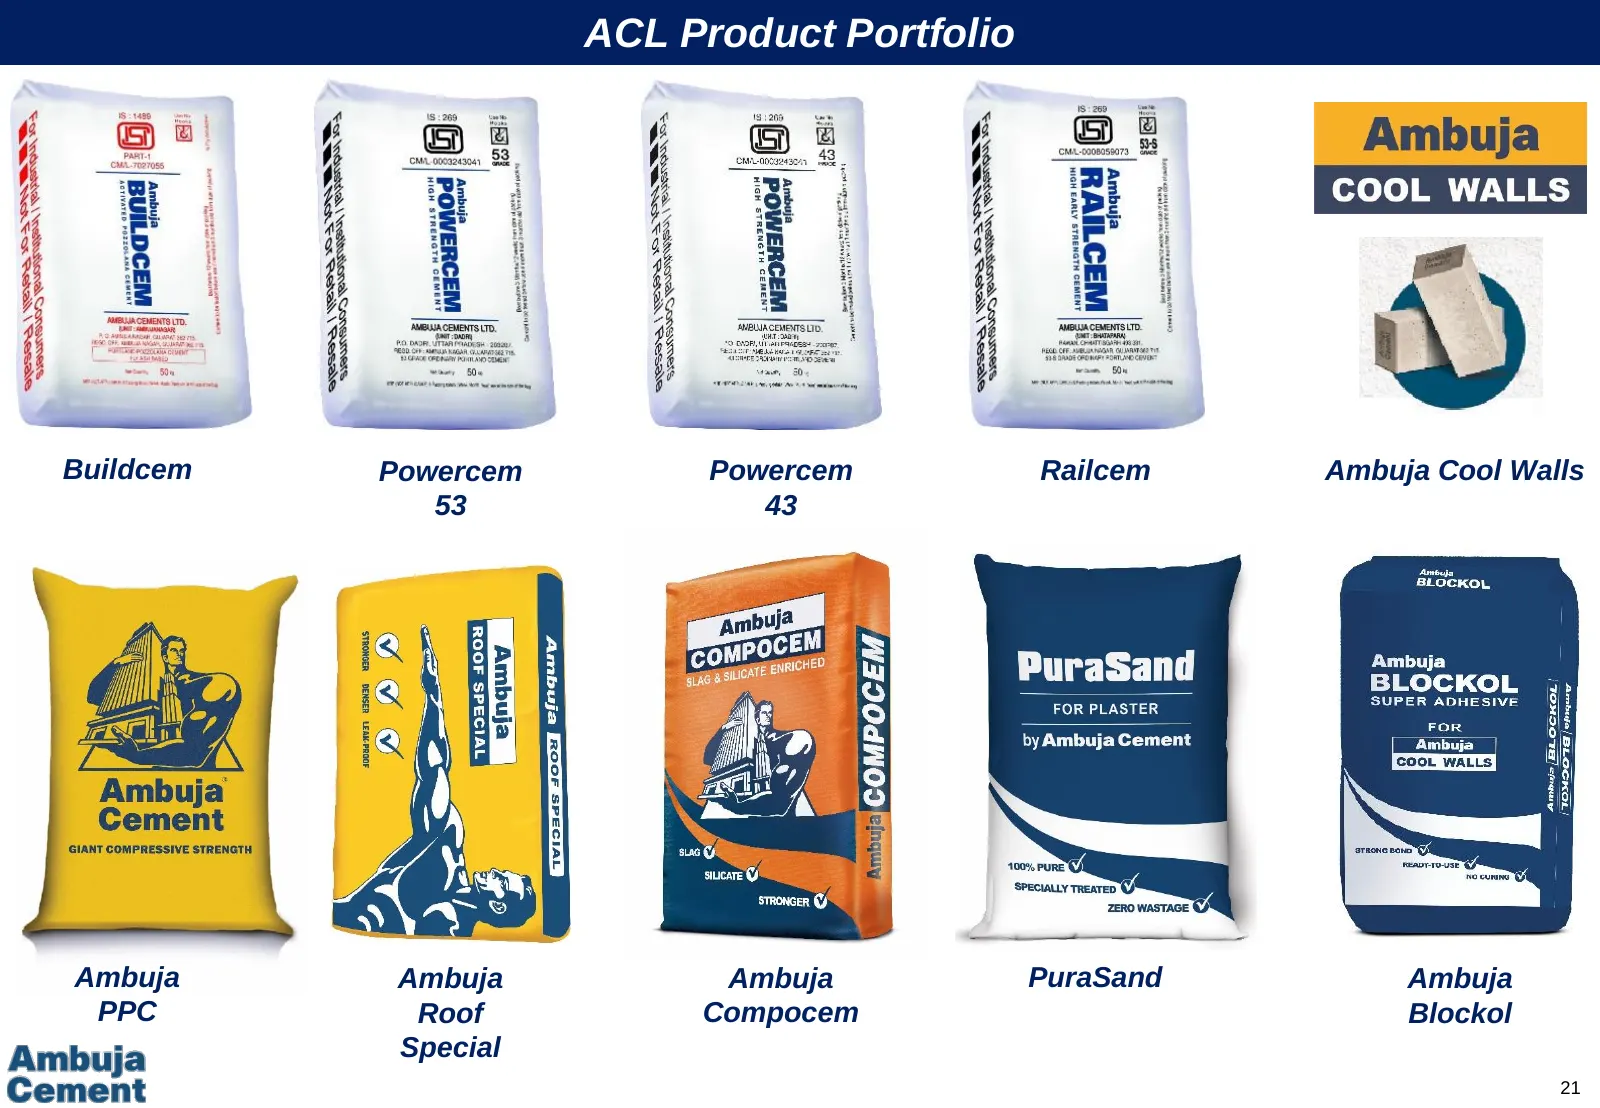
ACL Product Portfolio Buildcem Powercem Powercem Railcem Ambuja Cool Walls 53 43 Ambuja Ambuja Ambuja PuraSand Ambuja PPC Roof Compocem Blockol Special 21
Slide 22: Sustainability a way of life
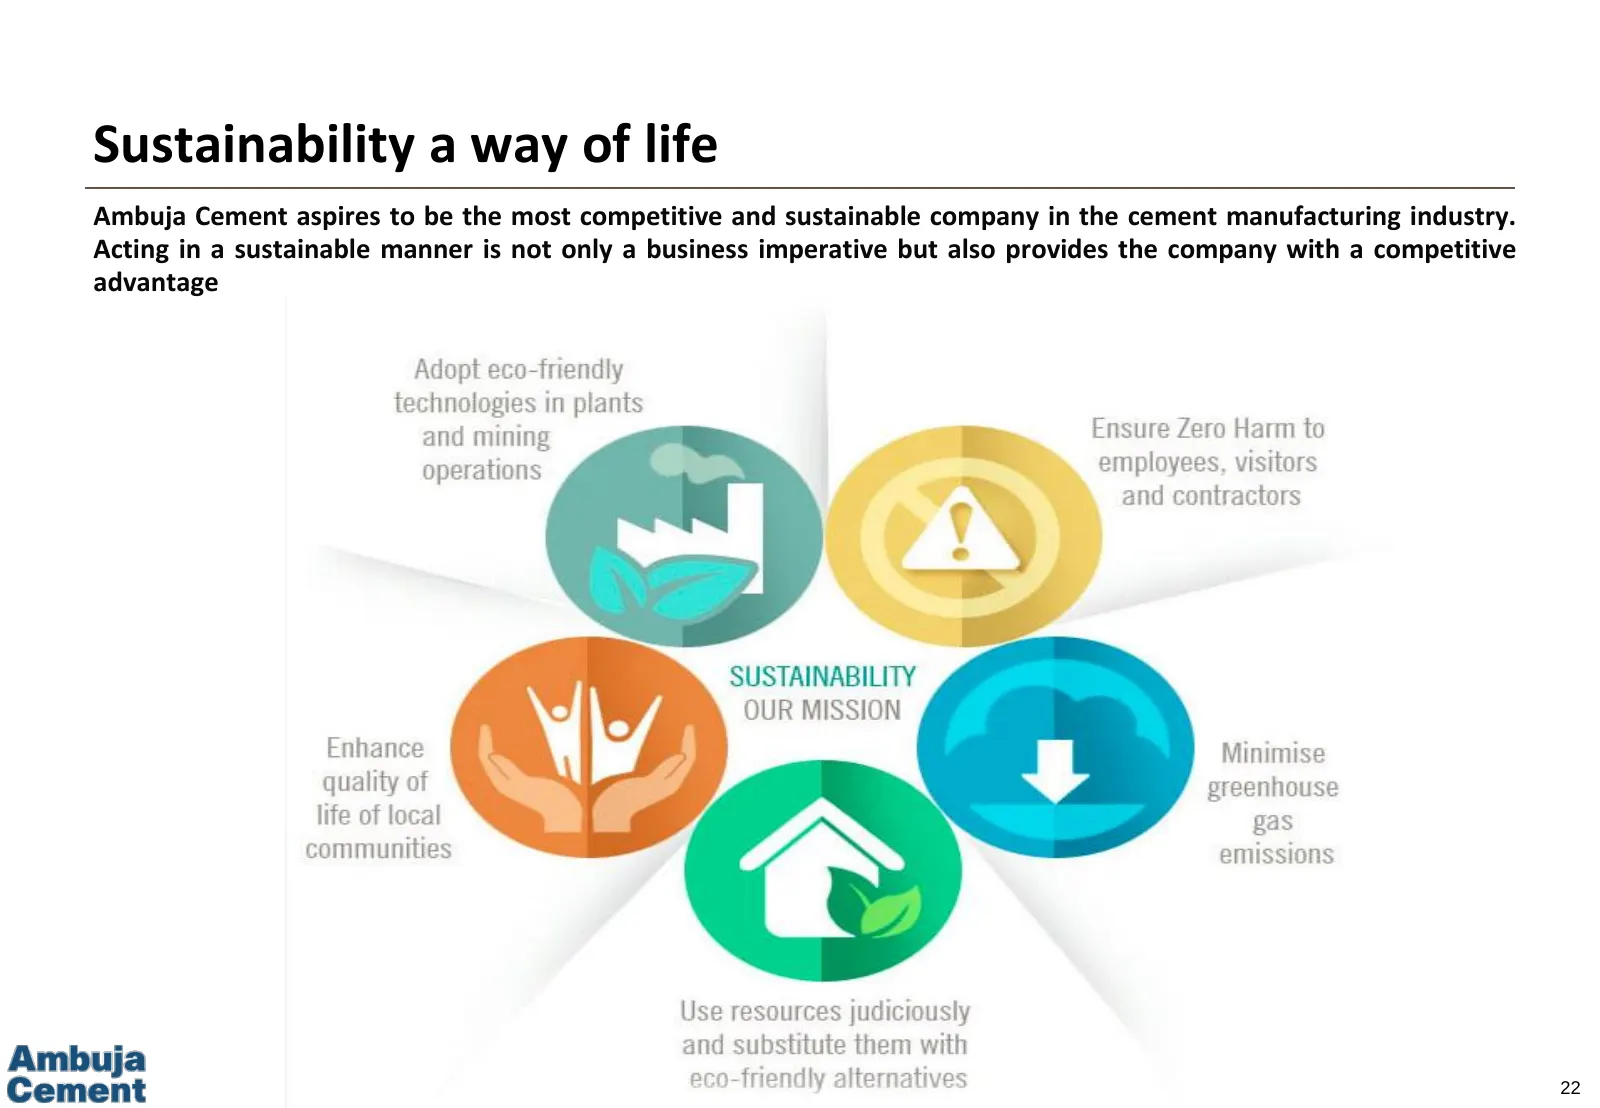
Sustainability a way of life Ambuja Cement aspires to be the most competitive and sustainable company in the cement manufacturing industry. Acting in a sustainable manner is not only a business imperative but also provides the company with a competitive advantage 22
Source: Internet Archive copy of ambujacement.com
More decks from Ambuja Cements Limited
 Adani Portfolio — Investor Presentation (November 2026)56 slides · November 2026
 H1 FY27 Earnings Presentation40 slides · November 2026
 H1 FY27 Earnings Presentation40 slides · November 2026
 Adani Portfolio — ESG Presentation (November 2026)18 slides · November 2026
 Q2 FY2027 Earnings Presentation39 slides · Oct 29, 2026
 Q2 FY2027 Earnings Presentation40 slides · Oct 29, 2026