CyberAgent Incorporated · TSE:4751
CyberAgent — Q2 FY2010 Earnings Presentation
44 slides from CyberAgent's earnings presentation, April 2010
Slide 1: Table of Contents
0 Table of Contents 1 Overview of Consolidated Financial Results 2 Consolidated Business Forecast 3 Major Business 4 Ameba Business 5 Summary 1
Slide 2: Overview of Consolidated Financial Results for 2Q
1 Overview of Consolidated Financial Results Overview of Consolidated Financial Results for 2Q (January-March 2010) 2
Slide 3: Second Quarter Highlights (Jan. – Mar. 2010)
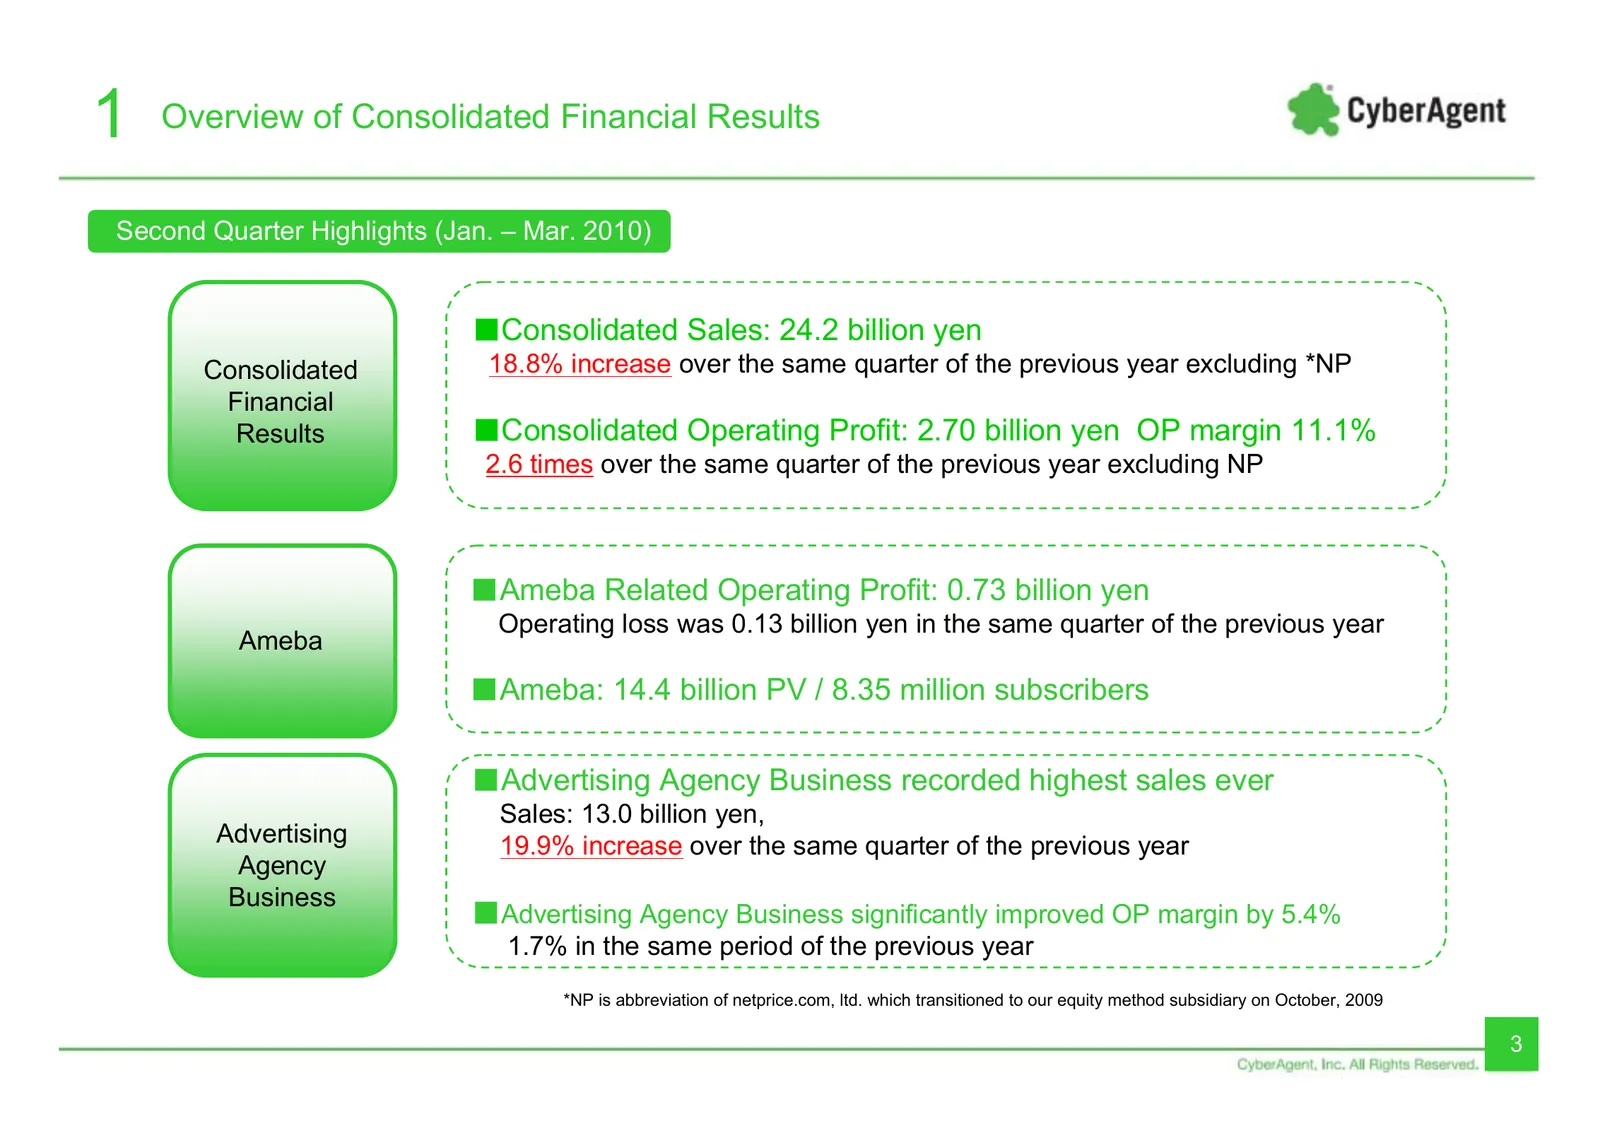
1 Overview of Consolidated Financial Results Second Quarter Highlights (Jan. – Mar. 2010) ■Consolidated Sales: 24.2 billion yen Consolidated 18.8% increase over the same quarter of the previous year excluding *NP Financial Results ■Consolidated Operating Profit: 2.70 billion yen OP margin 11.1% 2.6
Slide 4: Quarterly Consolidated Sales
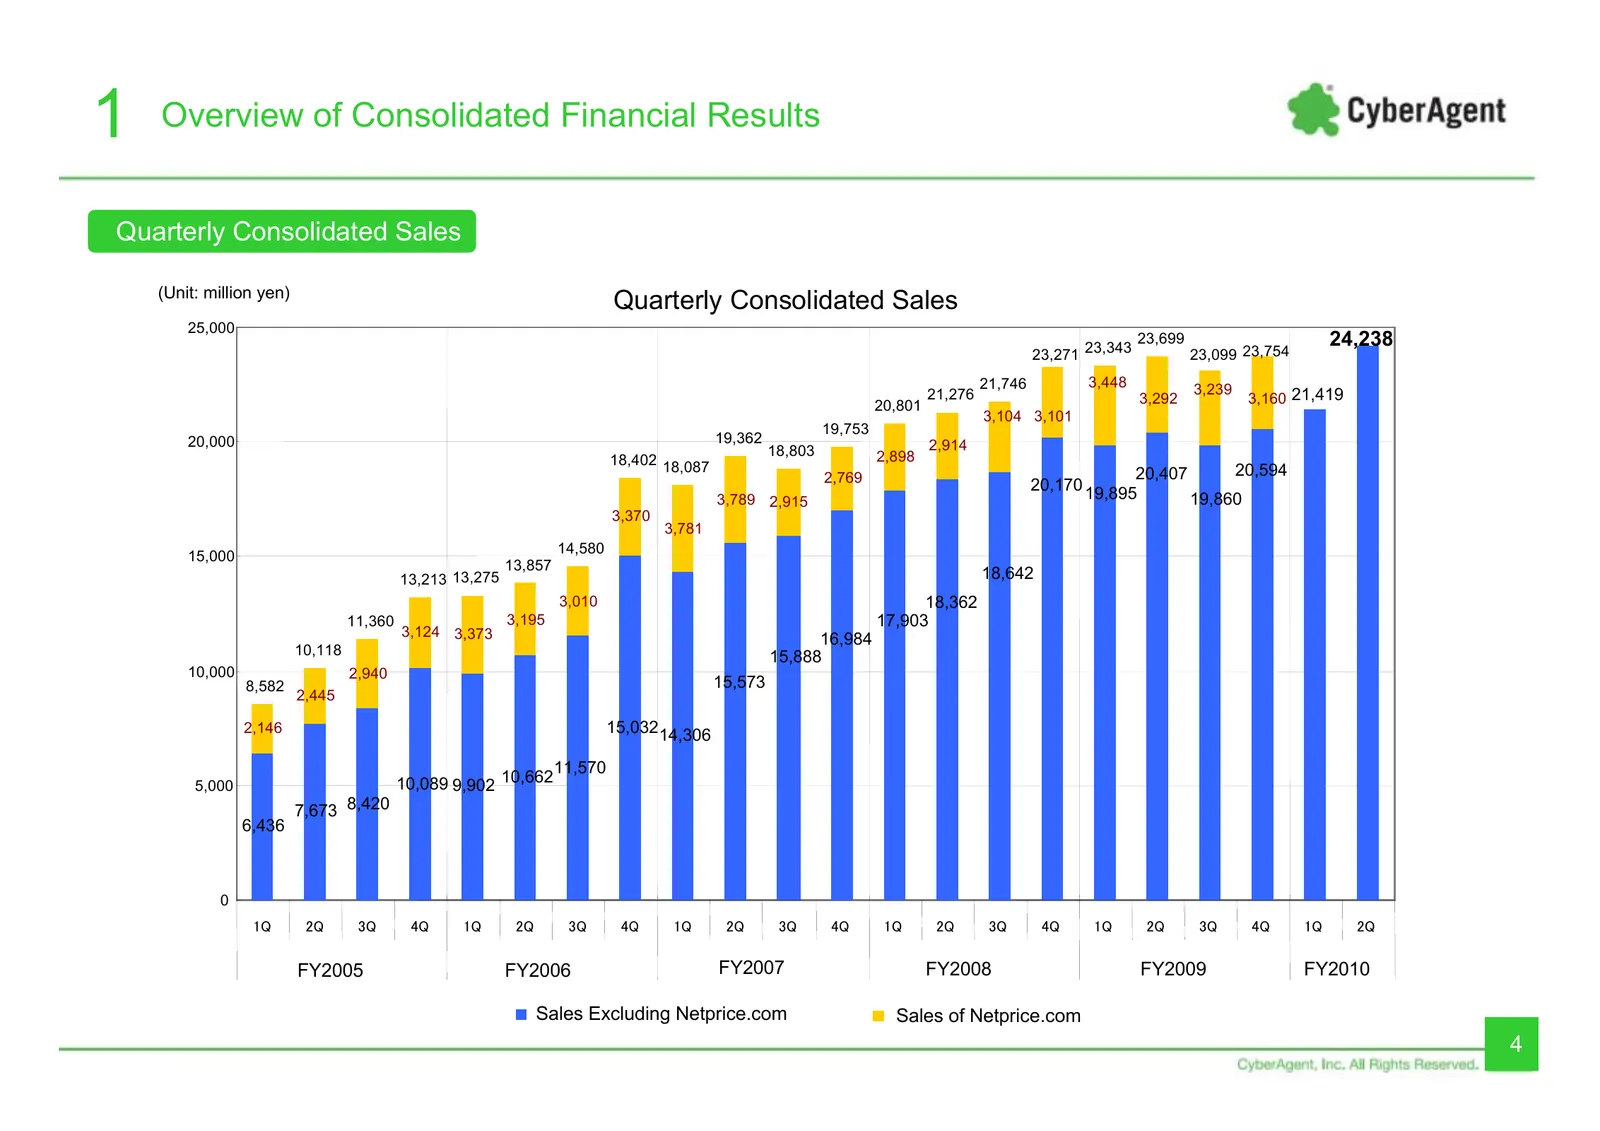
1 Overview of Consolidated Financial Results Quarterly Consolidated Sales (Unit: million yen) Quarterly Consolidated Sales 25,000 23,699 24,238 23,271 23,343 23,099 23,754 21,746 3,448 3,239 20,801 21,276 3,292 3,160 21,419 3,104 3,101 19,753 20,000 19,362 2,914 18,803 2,898 18,402 18,087 2,769 20,4
Slide 5: Quarterly Operating Profit by Business Segments
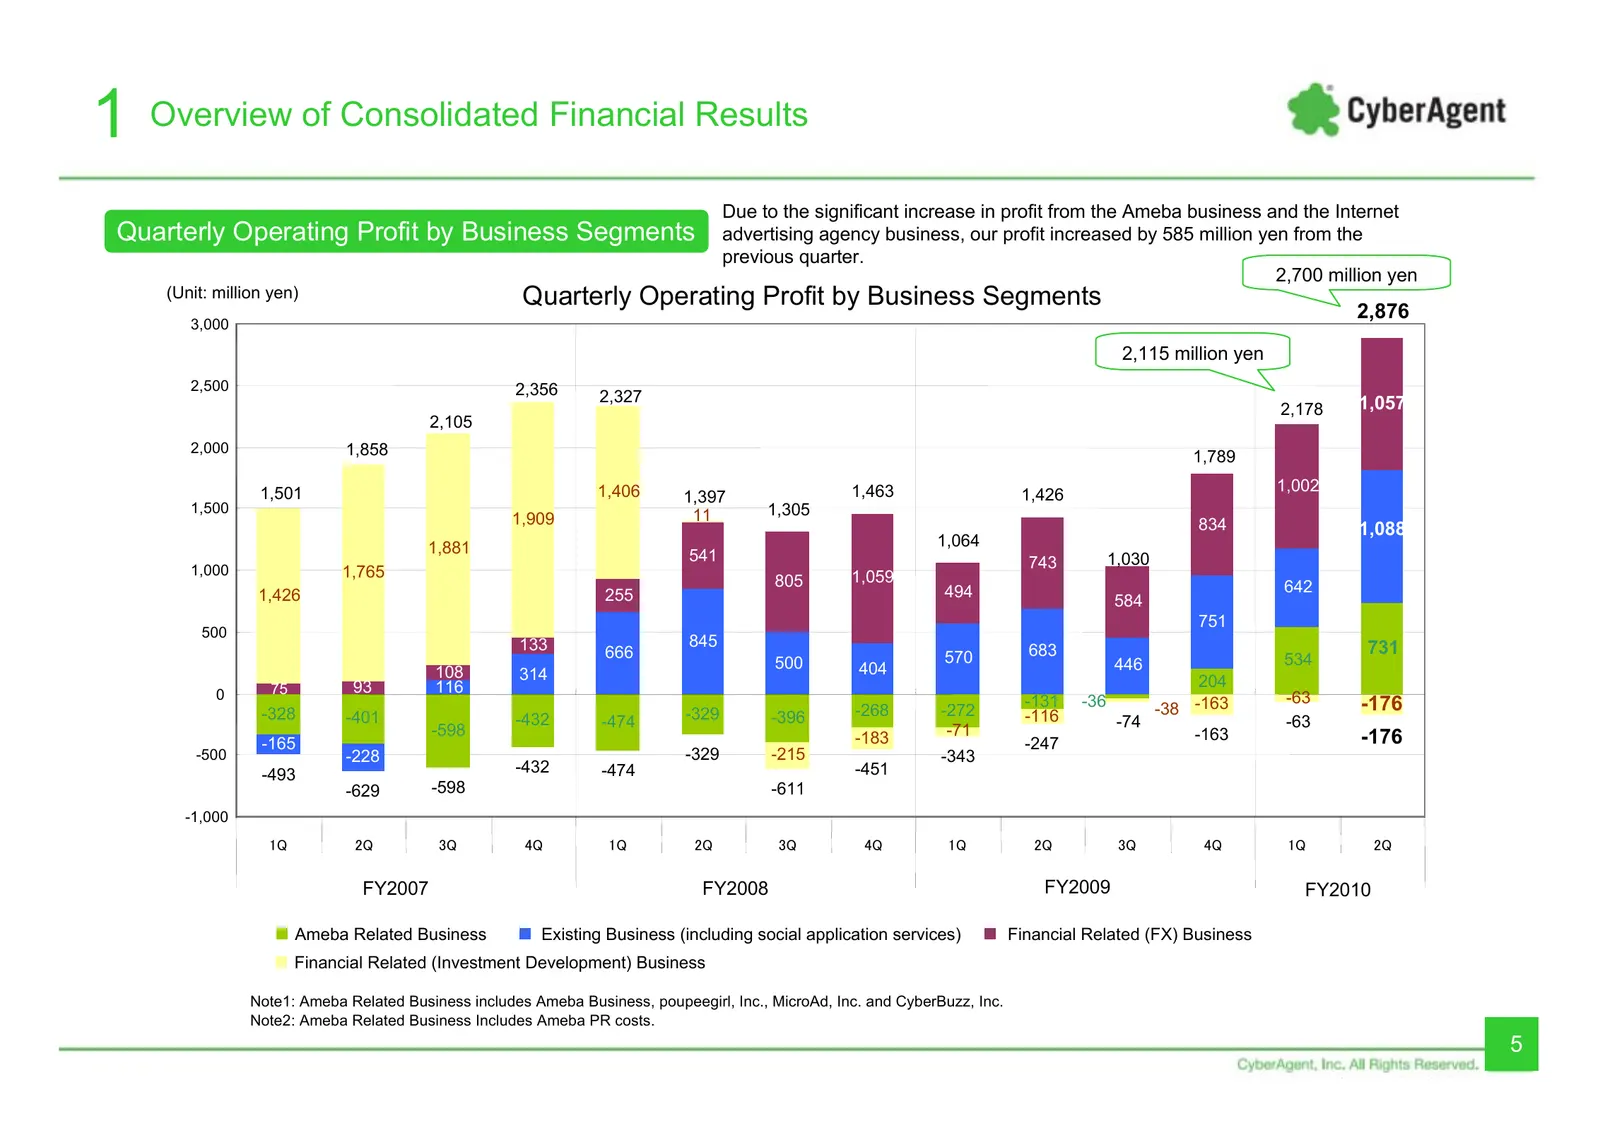
1 Overview of Consolidated Financial Results Due to the significant increase in profit from the Ameba business and the Internet Quarterly Operating Profit by Business Segments advertising agency business, our profit increased by 585 million yen from the previous quarter. 2,700 million yen (Unit: mil
Slide 6: PL
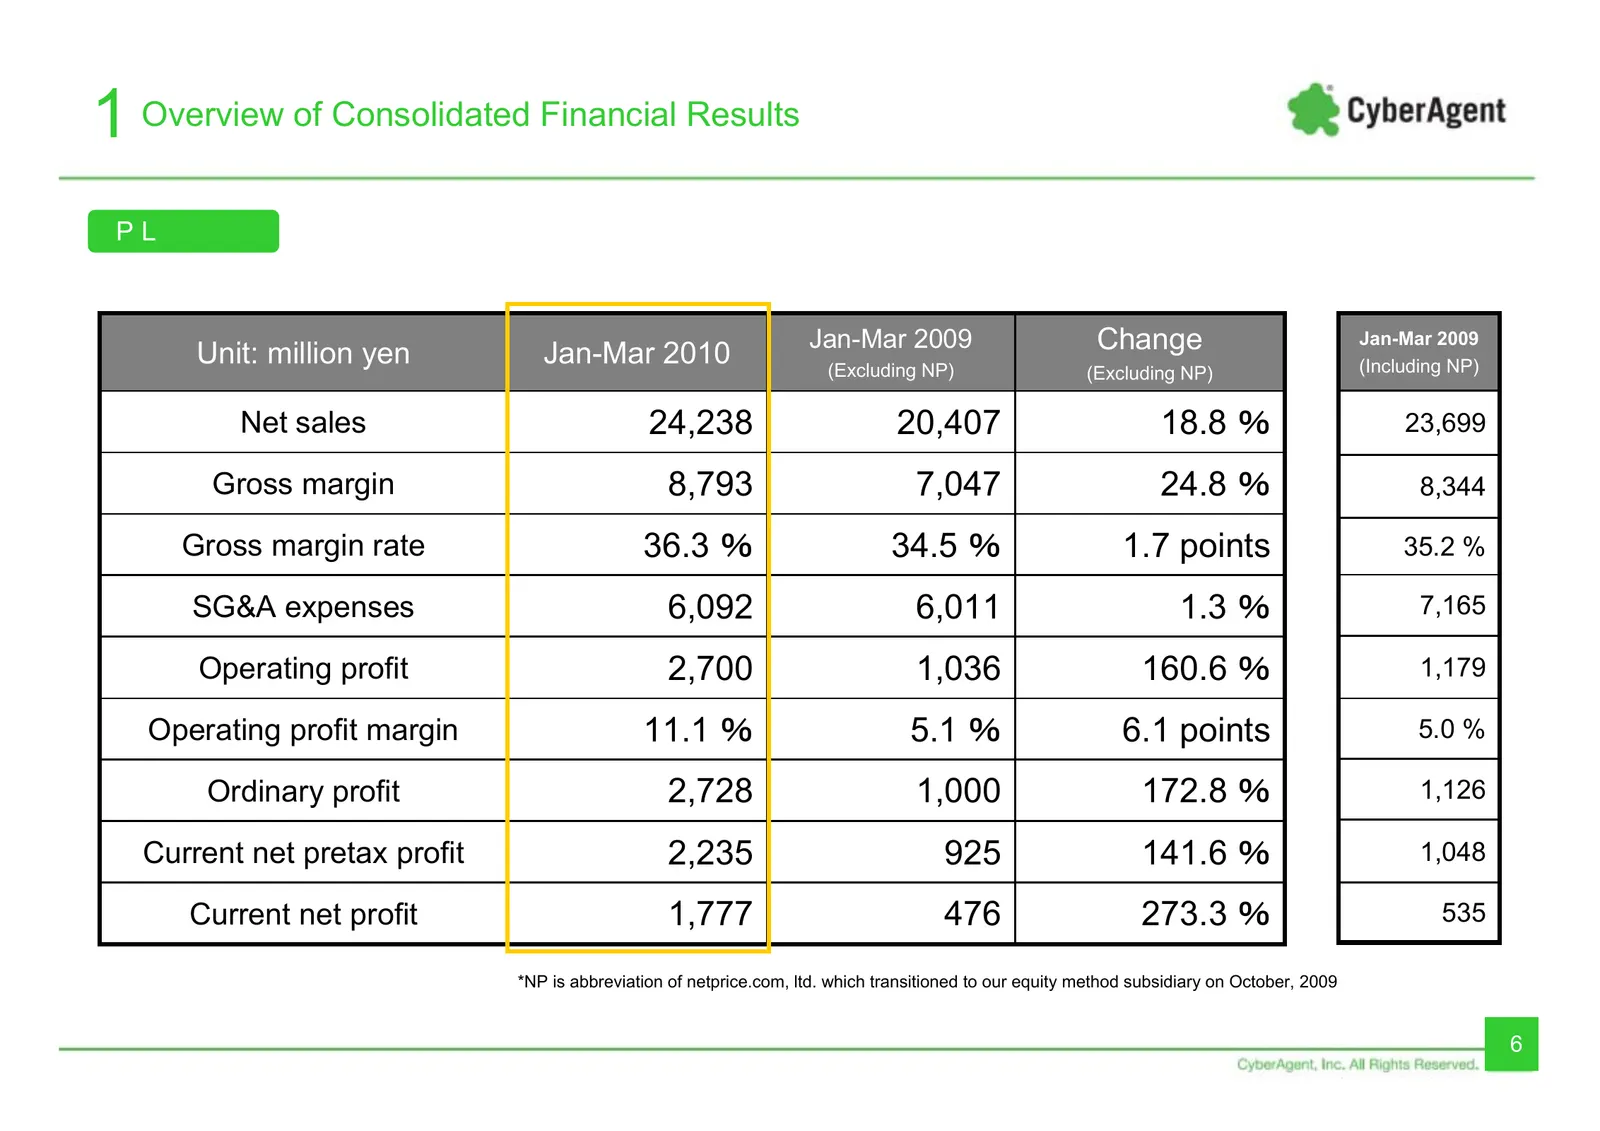
1 Overview of Consolidated Financial Results PL Unit: million yen Jan-Mar 2010 Jan-Mar 2009 Change Jan-Mar 2009 (Excluding NP) (Excluding NP) (Including NP) Net sales 24,238 20,407 18.8 % 23,699 Gross margin 8,793 7,047 24.8 % 8,344 Gross margin rate 36.3 % 34.5 % 1.7 points 35.2 % SG&A expenses 6,0
Slide 7: Quarterly SG&A Expenses
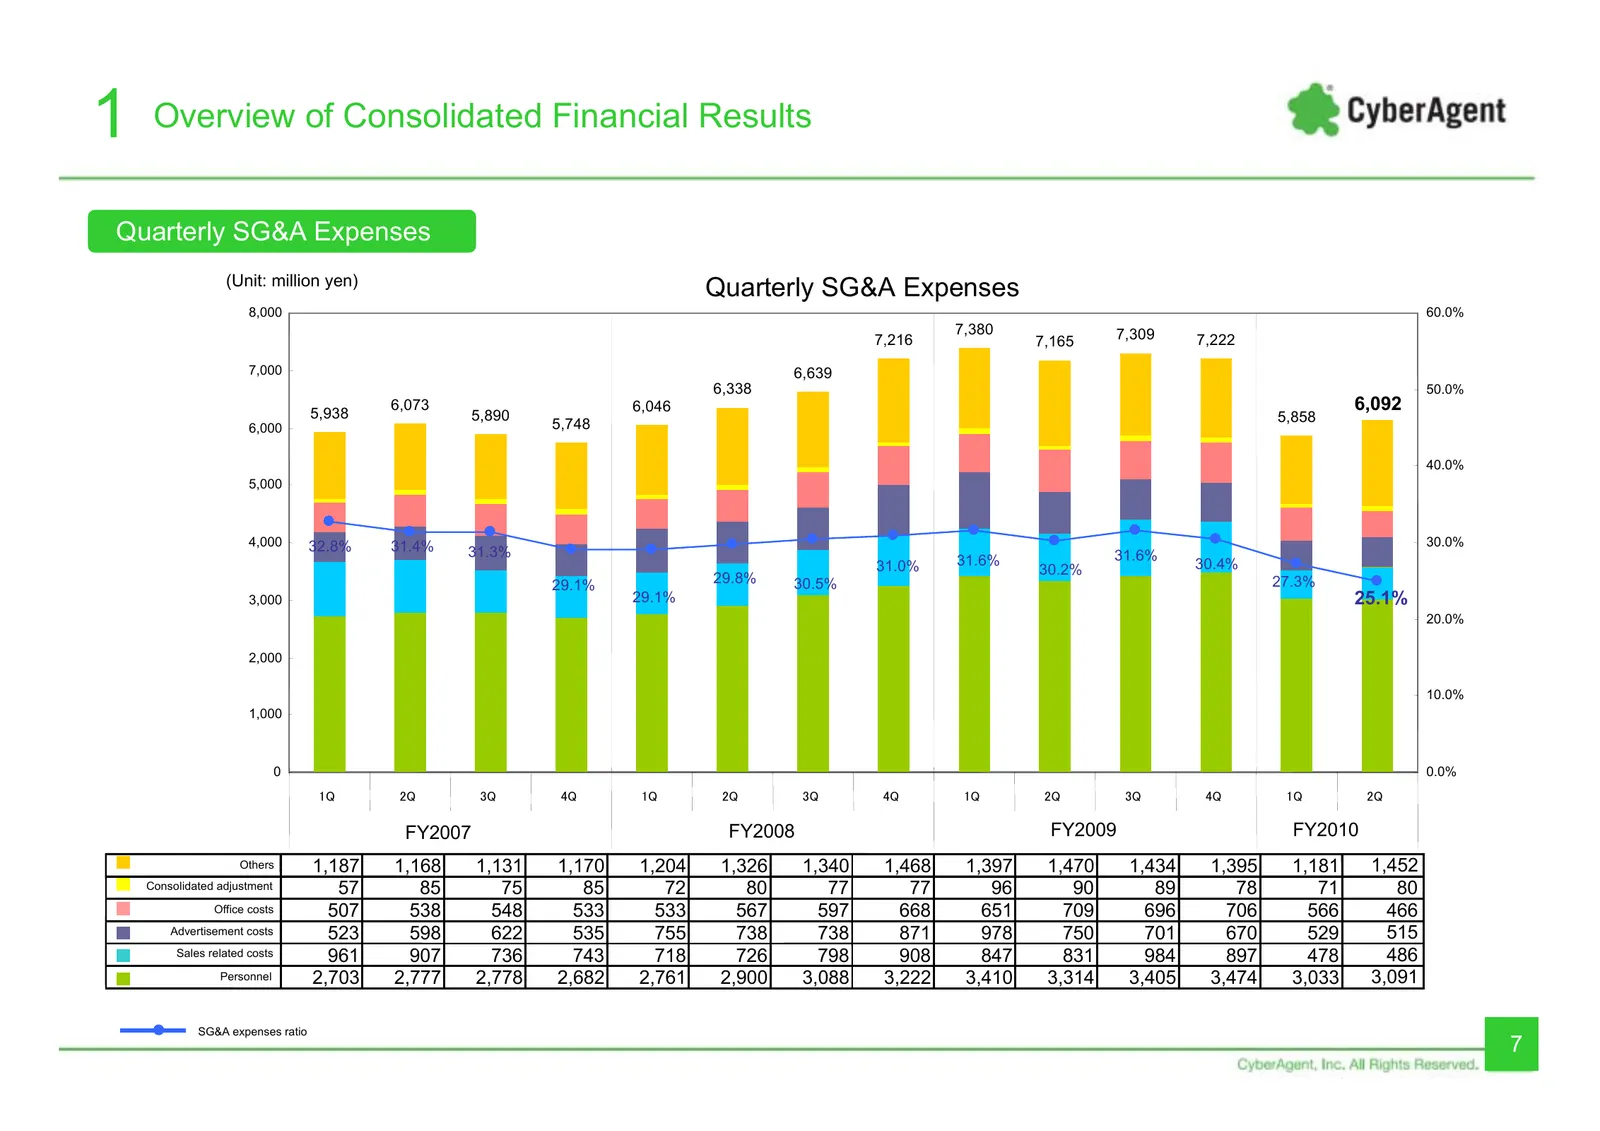
1 Overview of Consolidated Financial Results Quarterly SG&A Expenses (Unit: million yen) Quarterly SG&A Expenses 8,000 60.0% 7,380 7,309 7,216 7,165 7,222 7,000 6,639 6,338 50.0% 5,938 6,073 6,046 6,092 5,890 5,858 6,000 5,748 40.0% 5,000 4,000 32.8% 31.4% 30.0% 31.3% 31.6% 31.0% 31.6% 30.4% 30.2% 2
Slide 8: Quarterly Number of Employees in Consolidated Companies
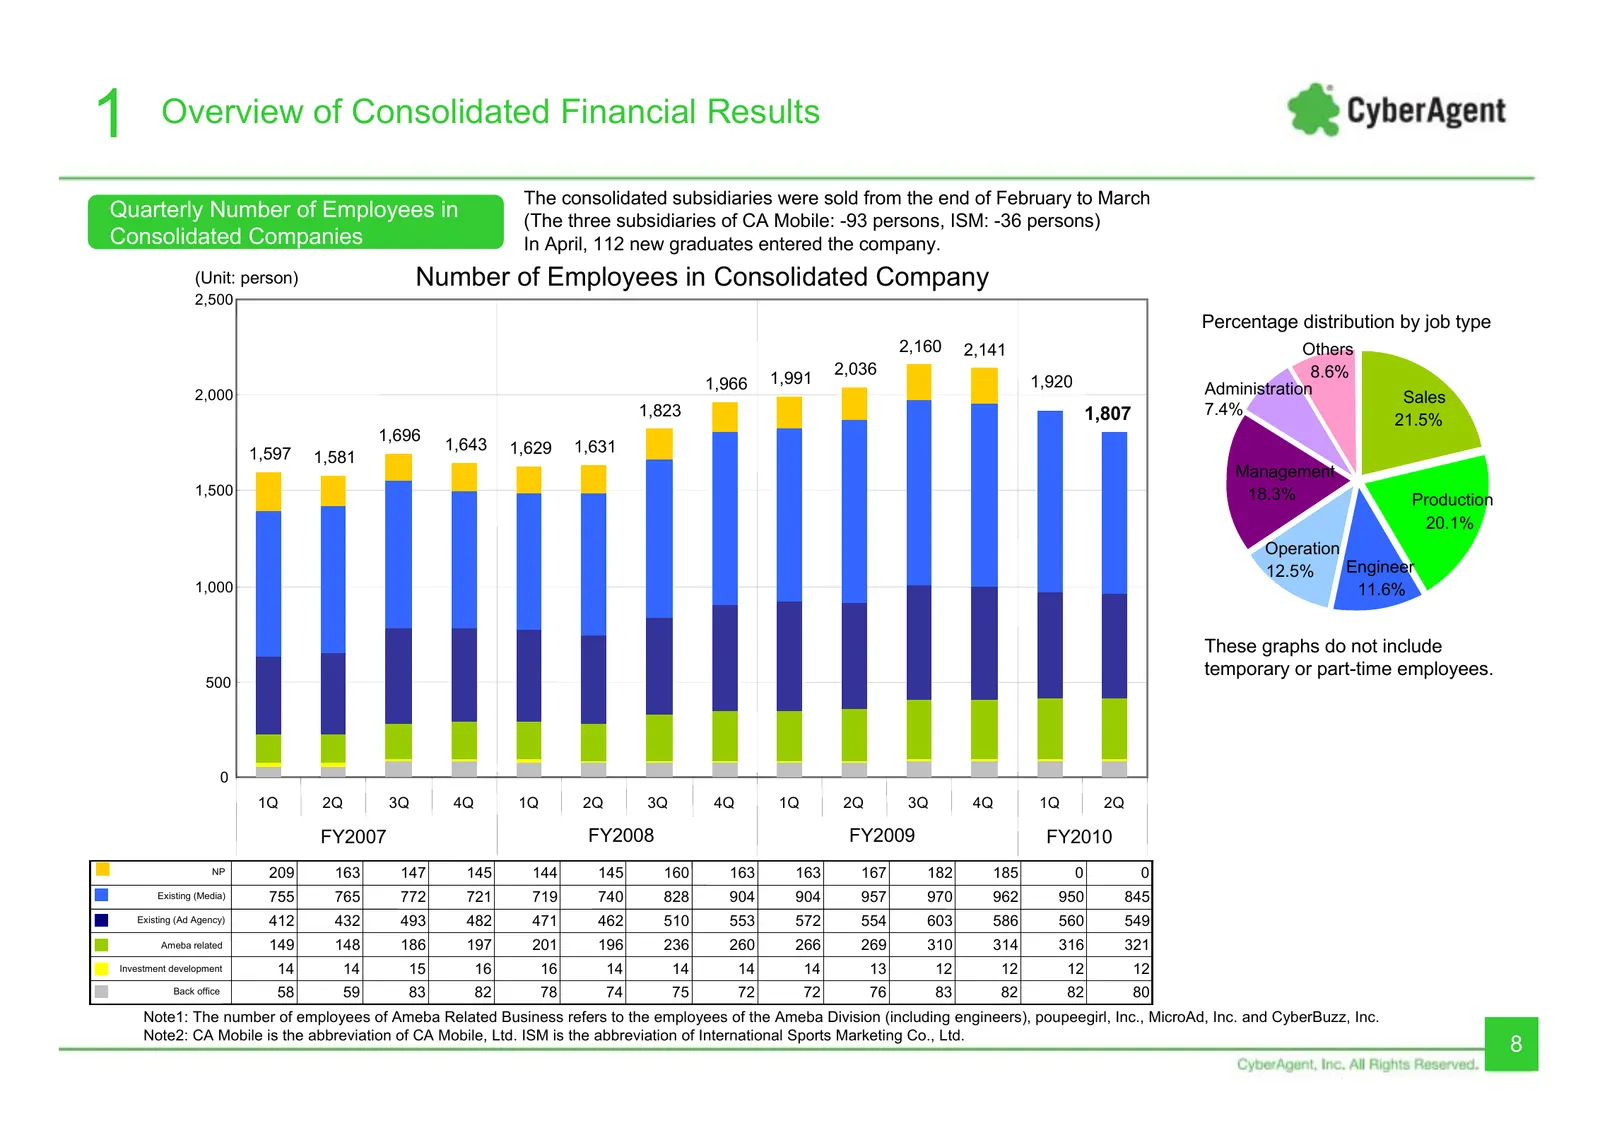
1 Overview of Consolidated Financial Results The consolidated subsidiaries were sold from the end of February to March Quarterly Number of Employees in (The three subsidiaries of CA Mobile: -93 persons, ISM: -36 persons) Consolidated Companies In April, 112 new graduates entered the company. 単位: (Un
Slide 9: BS
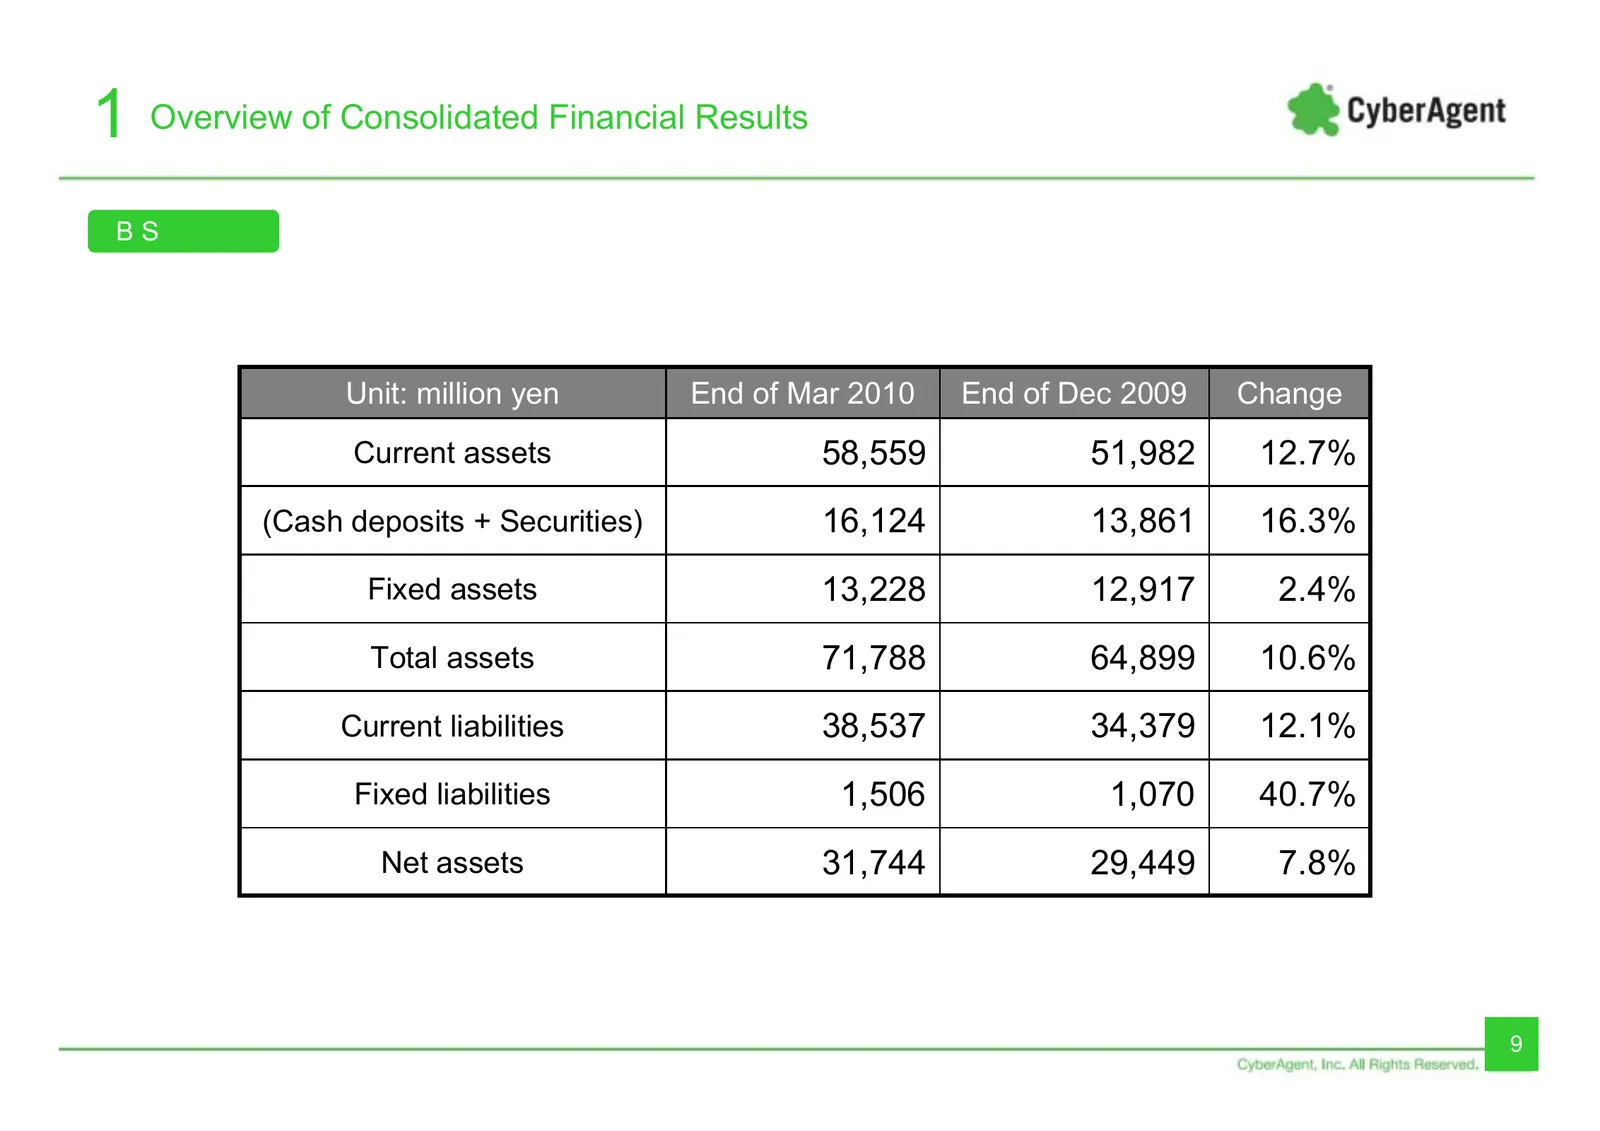
1 Overview of Consolidated Financial Results BS Unit: million yen End of Mar 2010 End of Dec 2009 Change Current assets 58,559 51,982 12.7% (Cash deposits + Securities) 16,124 13,861 16.3% Fixed assets 13,228 12,917 2.4% Total assets 71,788 64,899 10.6% Current liabilities 38,537 34,379 12.1% Fixed
Slide 10: CF
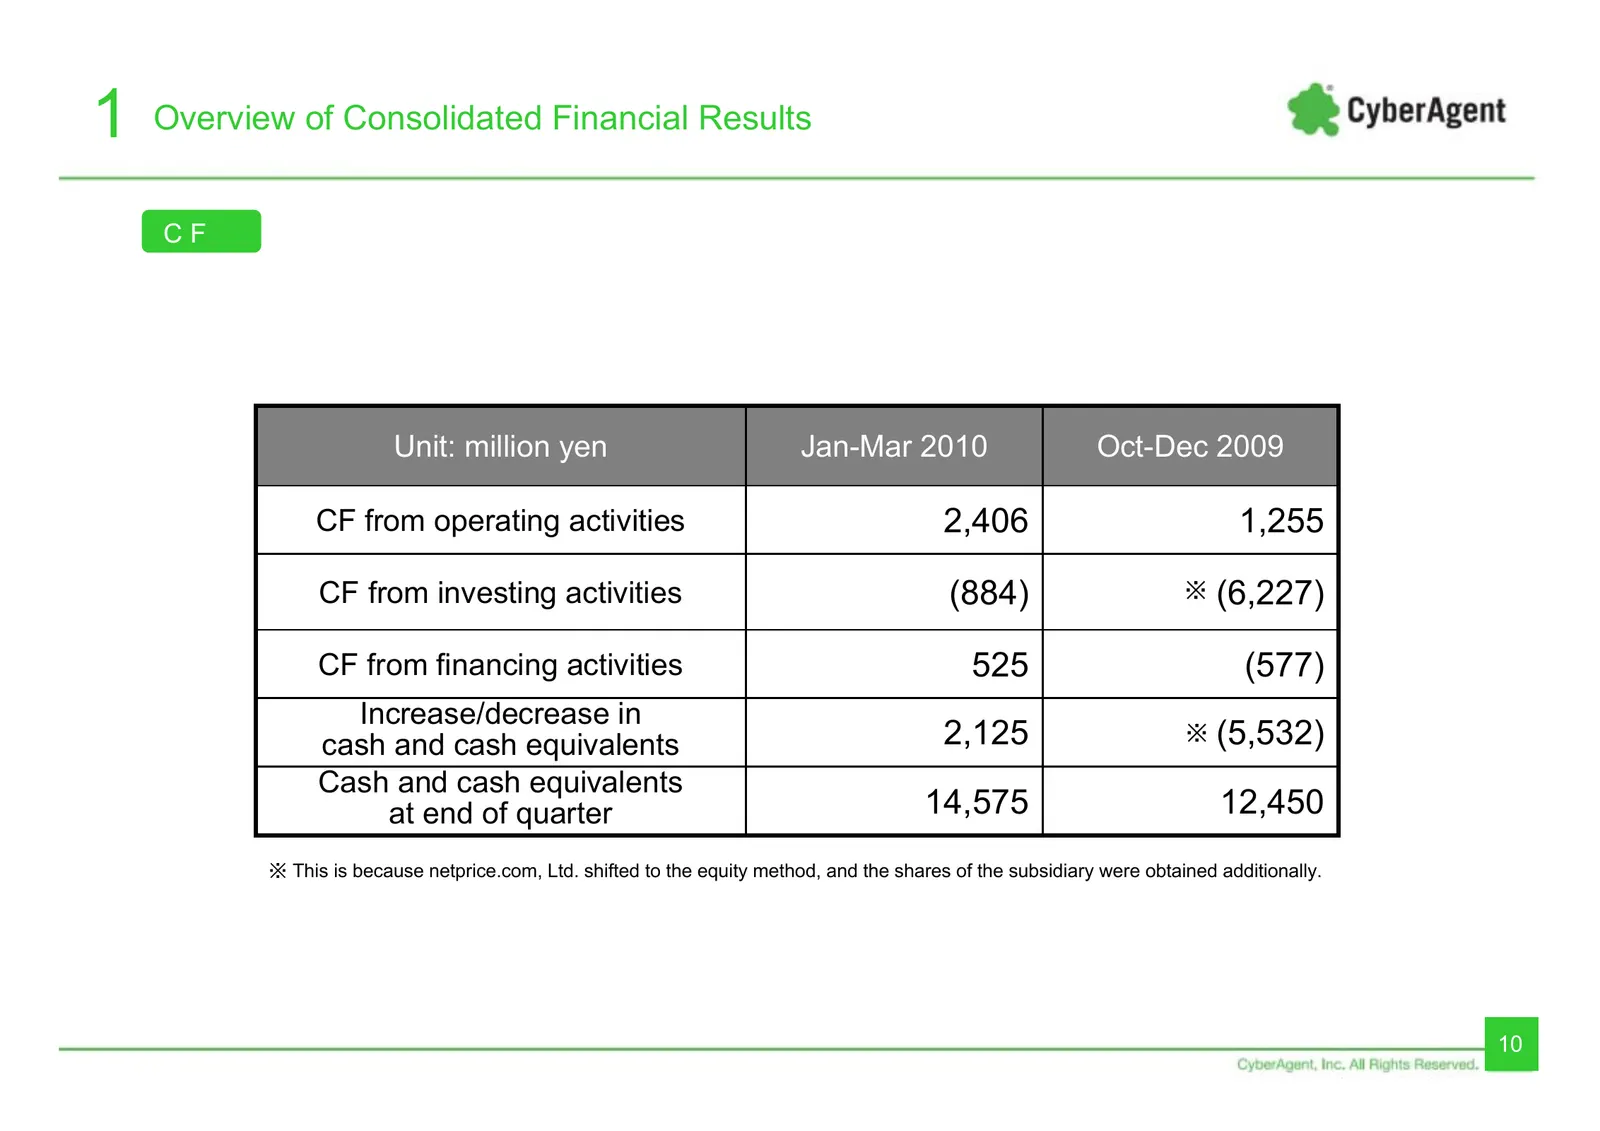
1 Overview of Consolidated Financial Results CF Unit: million yen Jan-Mar 2010 Oct-Dec 2009 CF from operating activities 2,406 1,255 CF from investing activities (884) ※ (6,227) CF from financing activities 525 (577) Increase/decrease in cash and cash equivalents 2,125 ※ (5,532) Cash and cash equiva

Slide 11: Consolidated Business Forecast for the Year Ending September 2010
2 Consolidated Business Forecast Consolidated Business Forecast for the Year Ending September 2010 11
Slide 12: Consolidated Business Forecast for FY2010
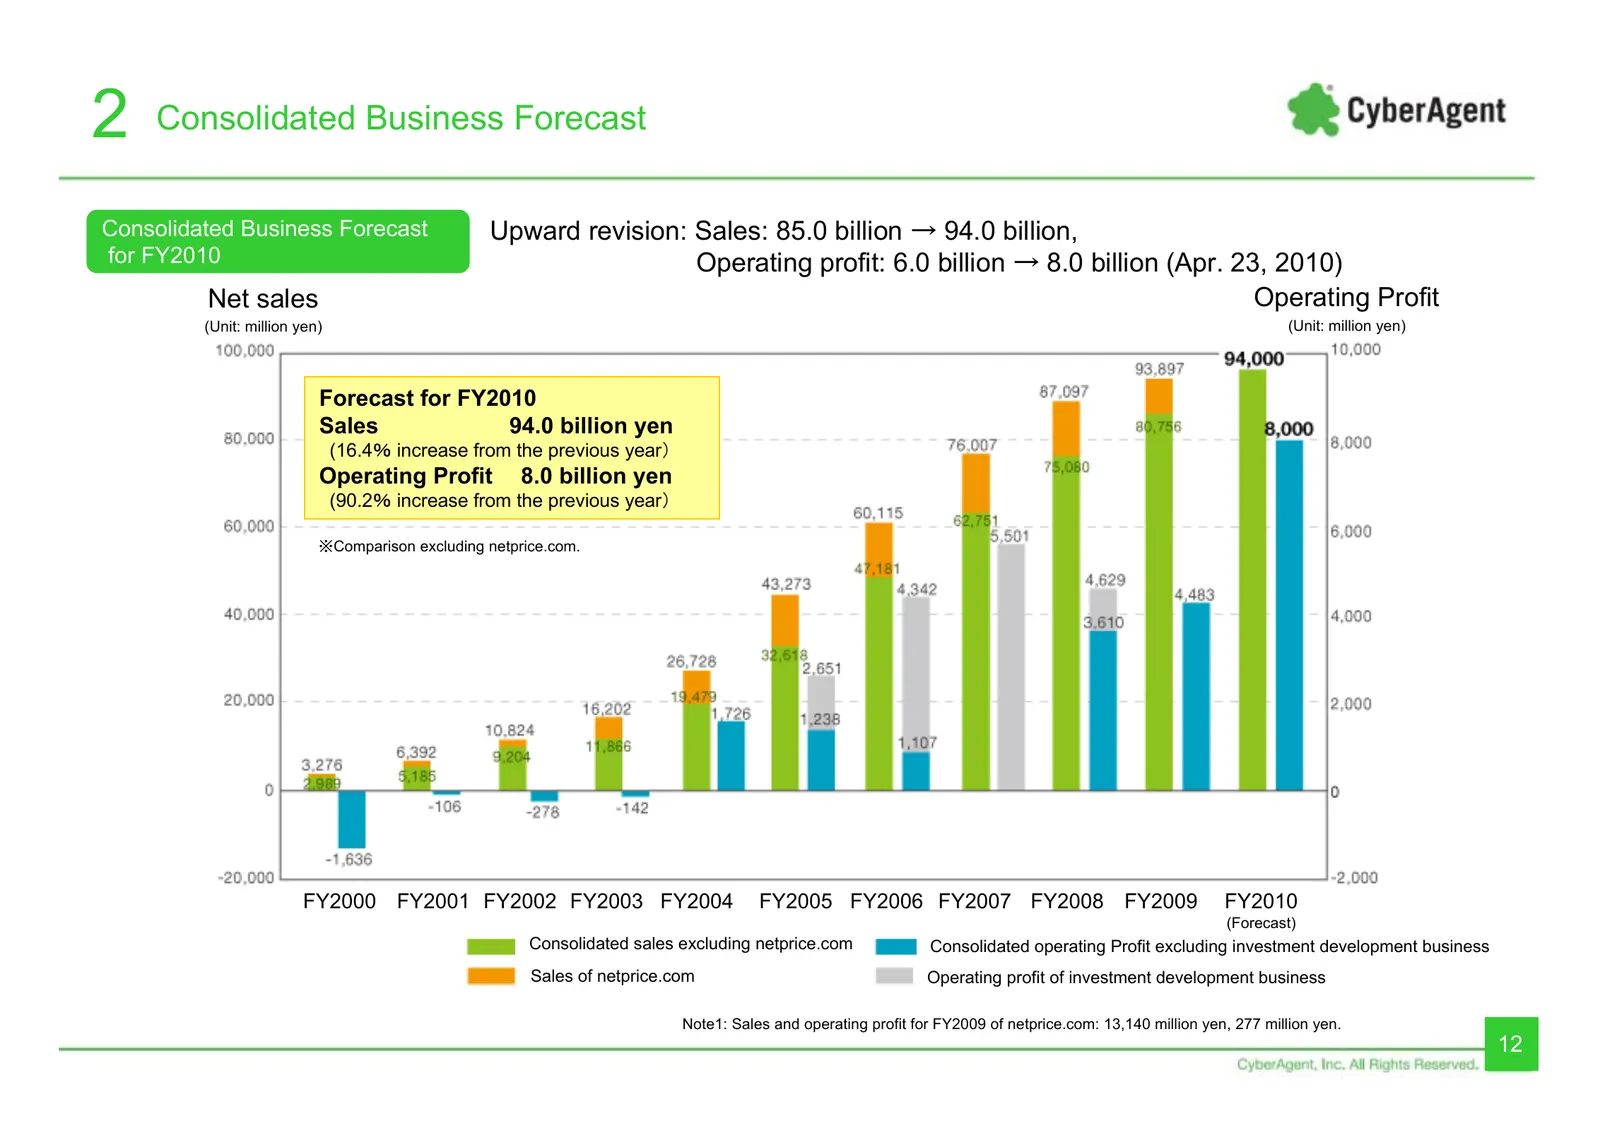
2 Consolidated Business Forecast Consolidated Business Forecast Upward revision: Sales: 85.0 billion → 94.0 billion, for FY2010 Operating profit: 6.0 billion → 8.0 billion (Apr. 23, 2010) Net sales Operating Profit (Unit: million yen) (Unit: million yen) Forecast for FY2010 Sales 94.0 billion yen (1
Slide 13: Business Forecast for FY2010
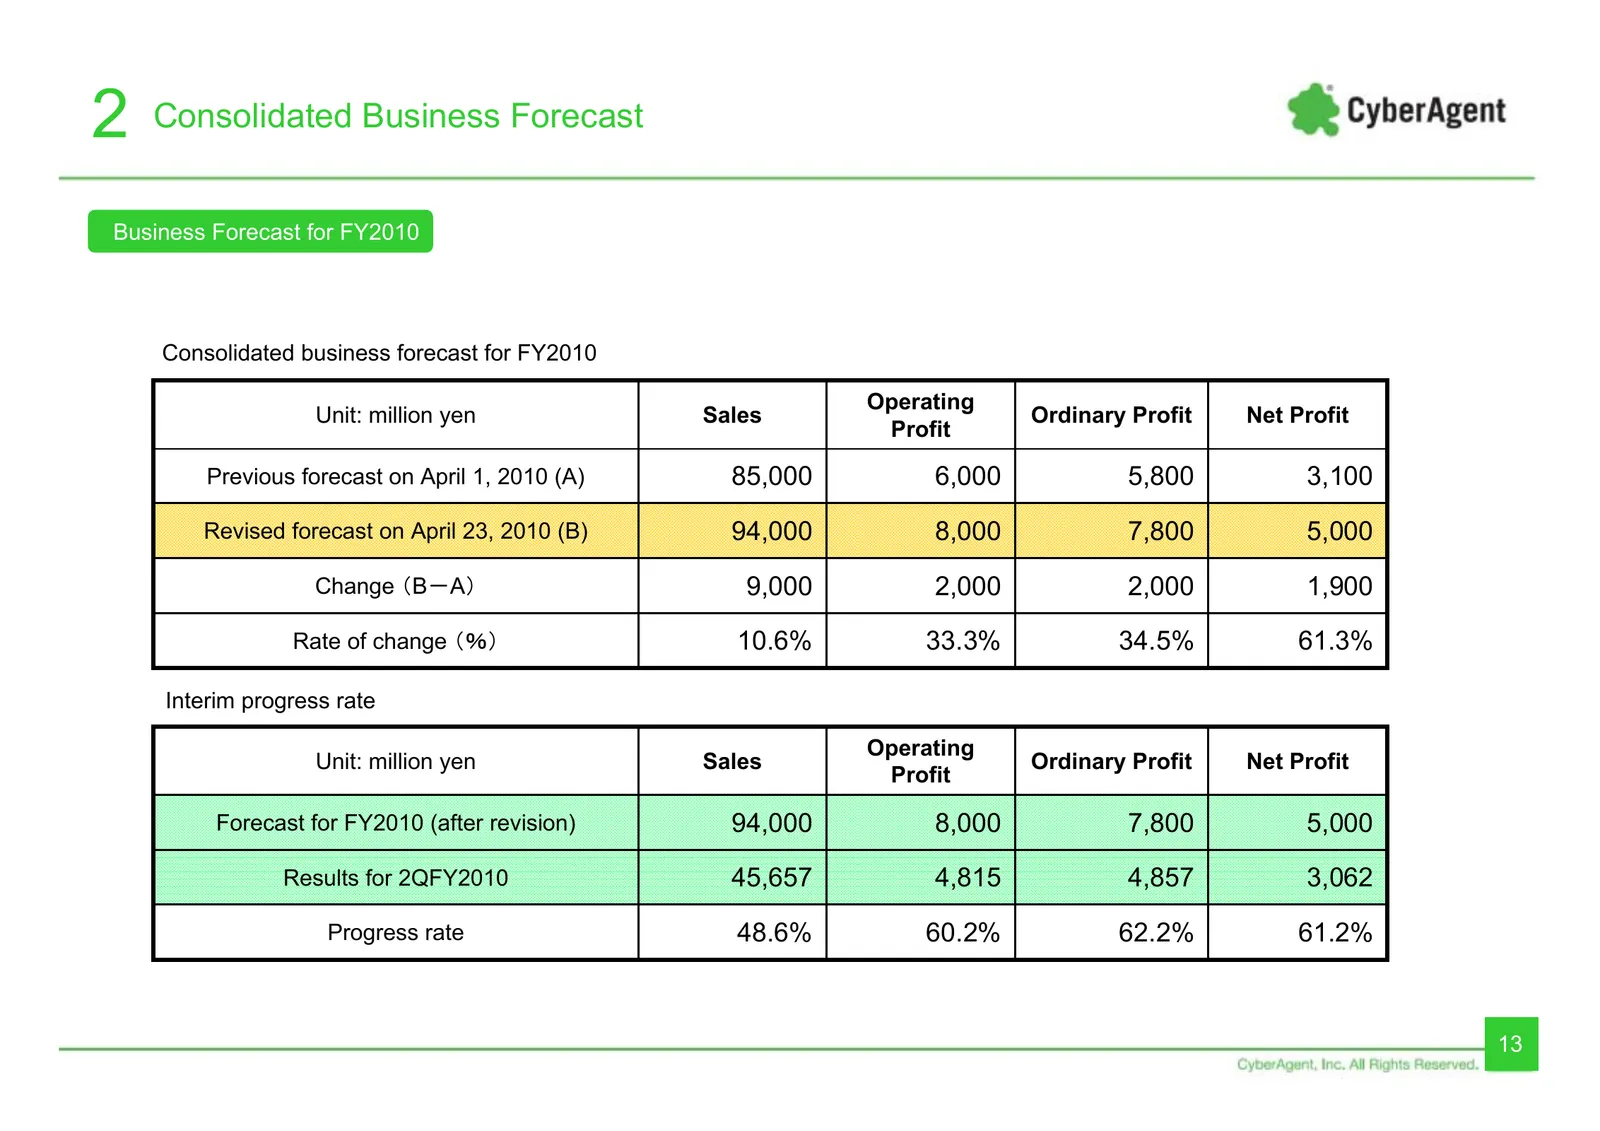
2 Consolidated Business Forecast Business Forecast for FY2010 Consolidated business forecast for FY2010 Operating Unit: million yen Sales Ordinary Profit Net Profit Profit Previous forecast on April 1, 2010 (A) 85,000 6,000 5,800 3,100 Revised forecast on April 23, 2010 (B) 94,000 8,000 7,800 5,000
Slide 14: Measure for returning profit to shareholders
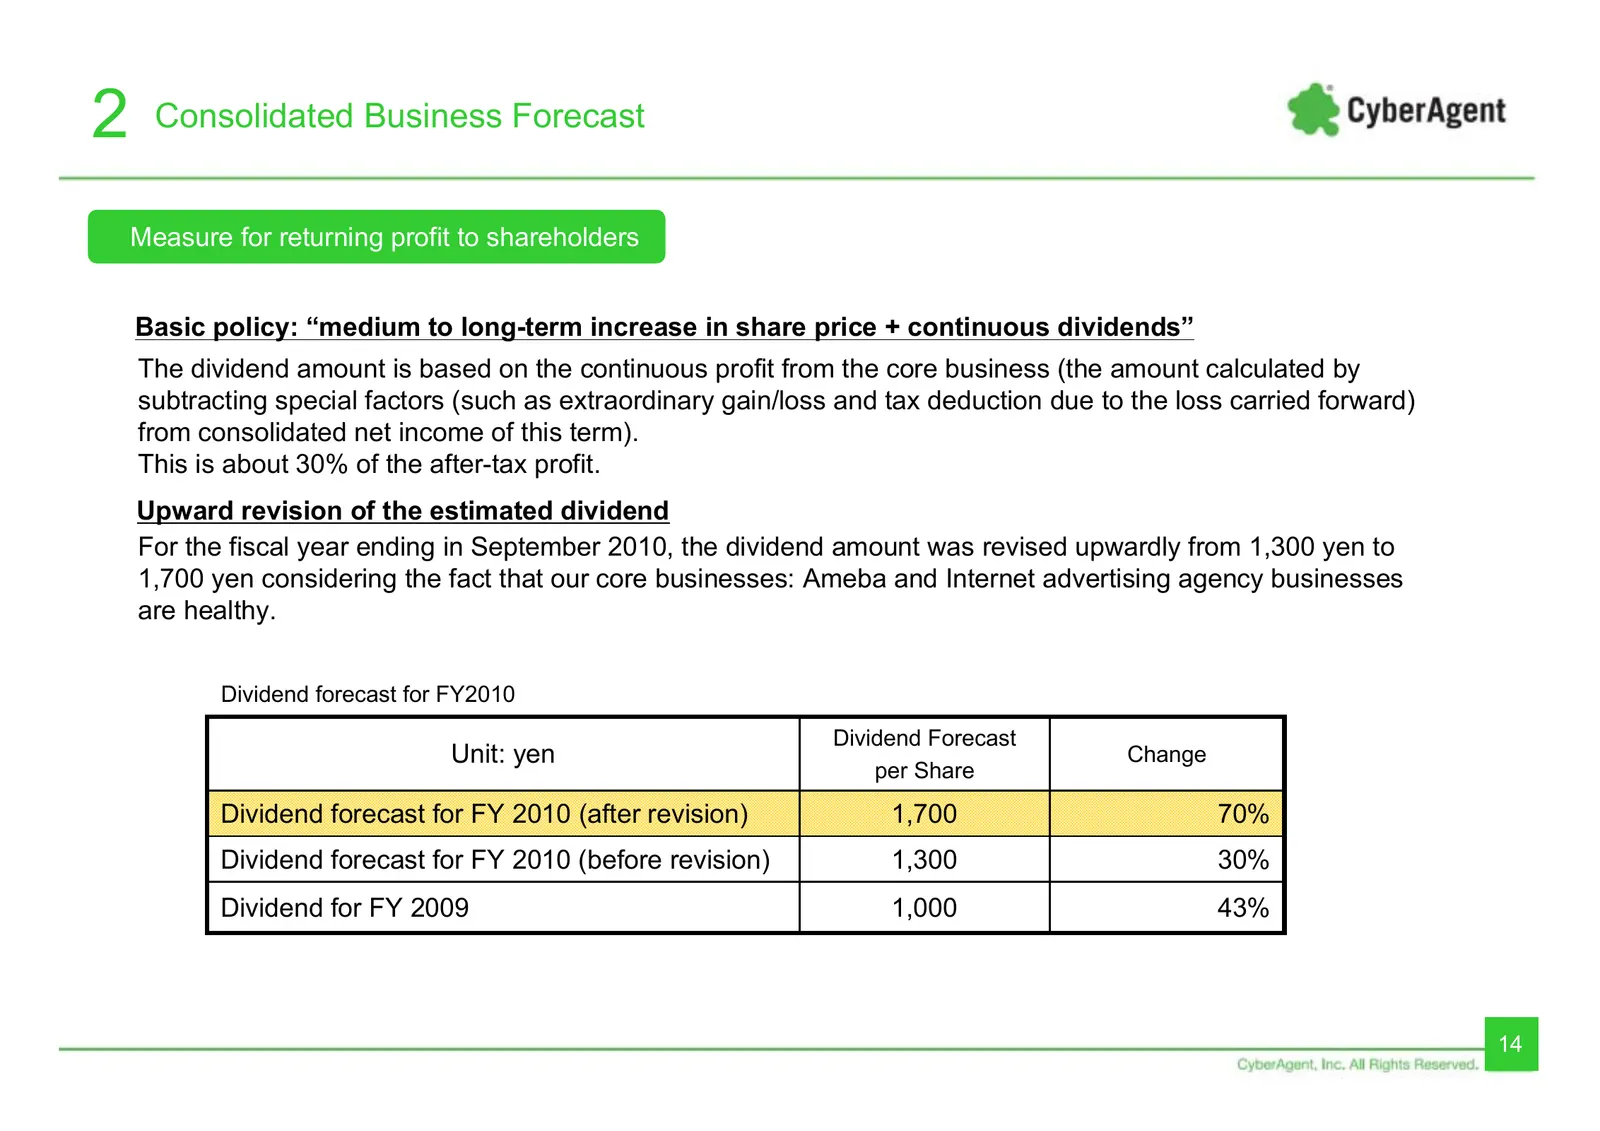
2 Consolidated Business Forecast Measure for returning profit to shareholders Basic policy: “medium to long-term increase in share price + continuous dividends” The dividend amount is based on the continuous profit from the core business (the amount calculated by subtracting special factors (such as
Slide 15: Reference: Interim period (Oct 2009 – Mar 2010) PL
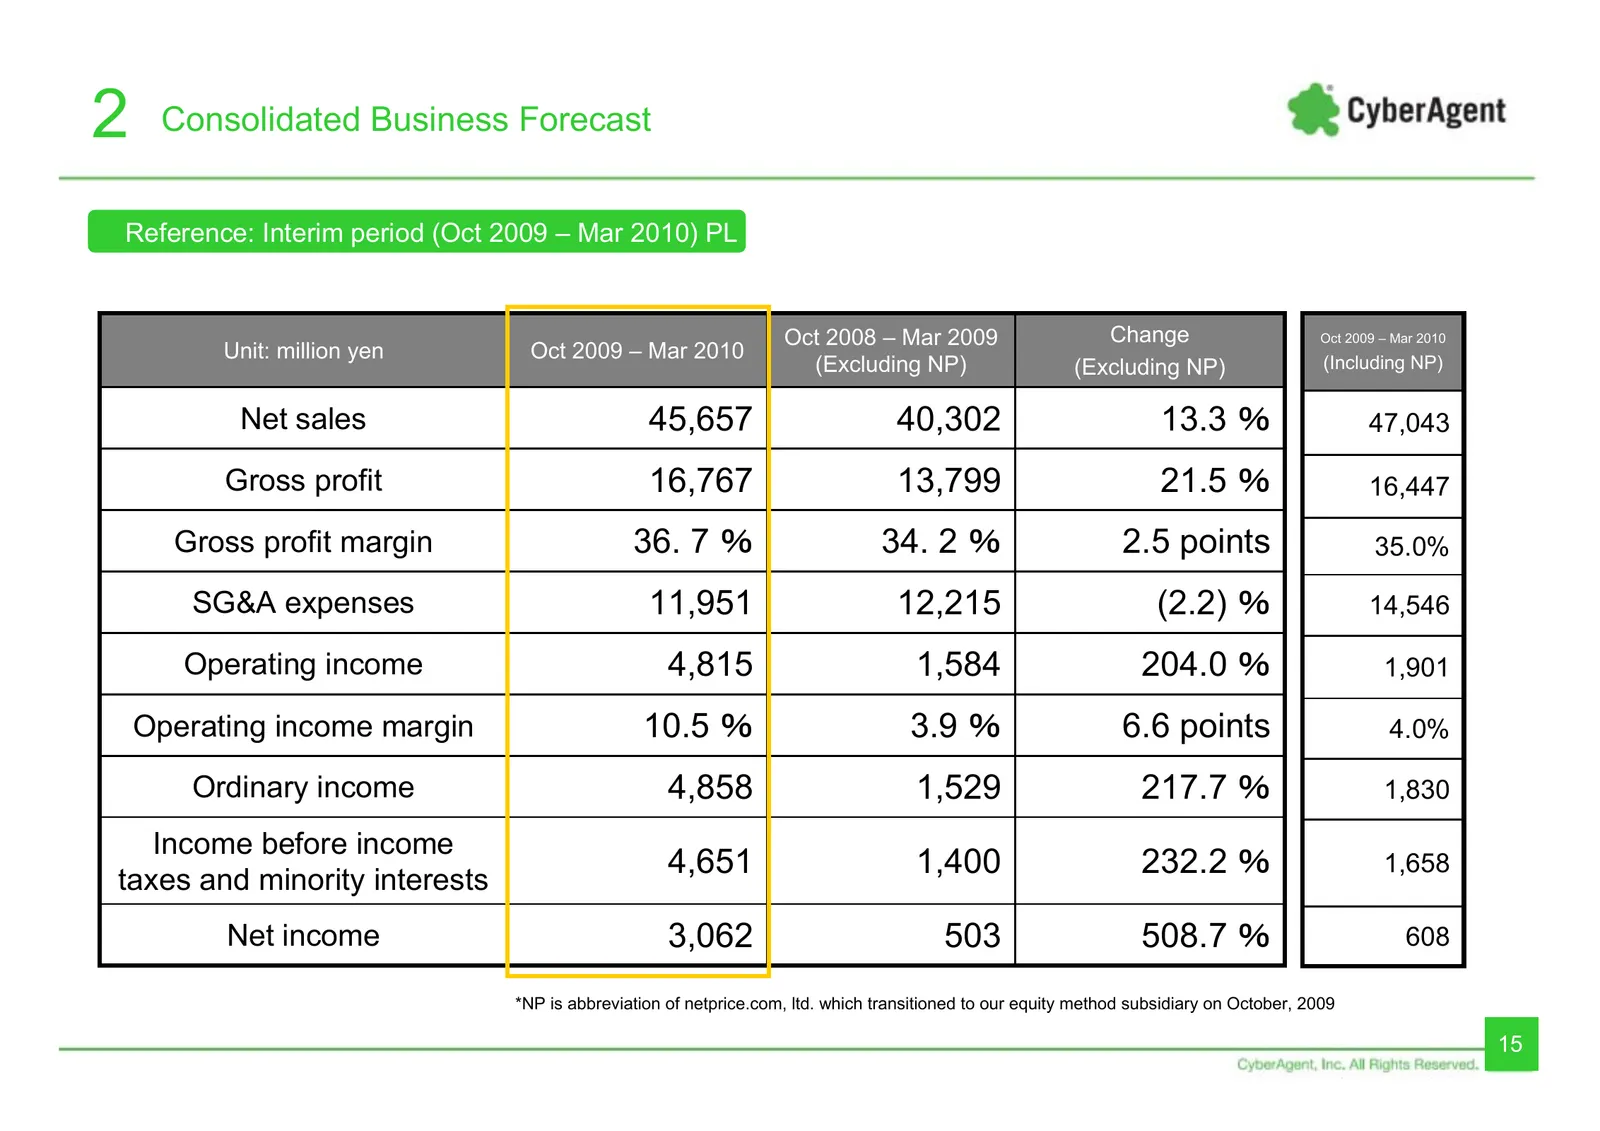
2 Consolidated Business Forecast Reference: Interim period (Oct 2009 – Mar 2010) PL Oct 2008 – Mar 2009 Change Oct 2009 – Mar 2010 Unit: million yen Oct 2009 – Mar 2010 (Excluding NP) (Excluding NP) (Including NP) Net sales 45,657 40,302 13.3 % 47,043 Gross profit 16,767 13,799 21.5 % 16,447 Gross p
Slide 16: Business forecast for FY2010: operating profit breakdown
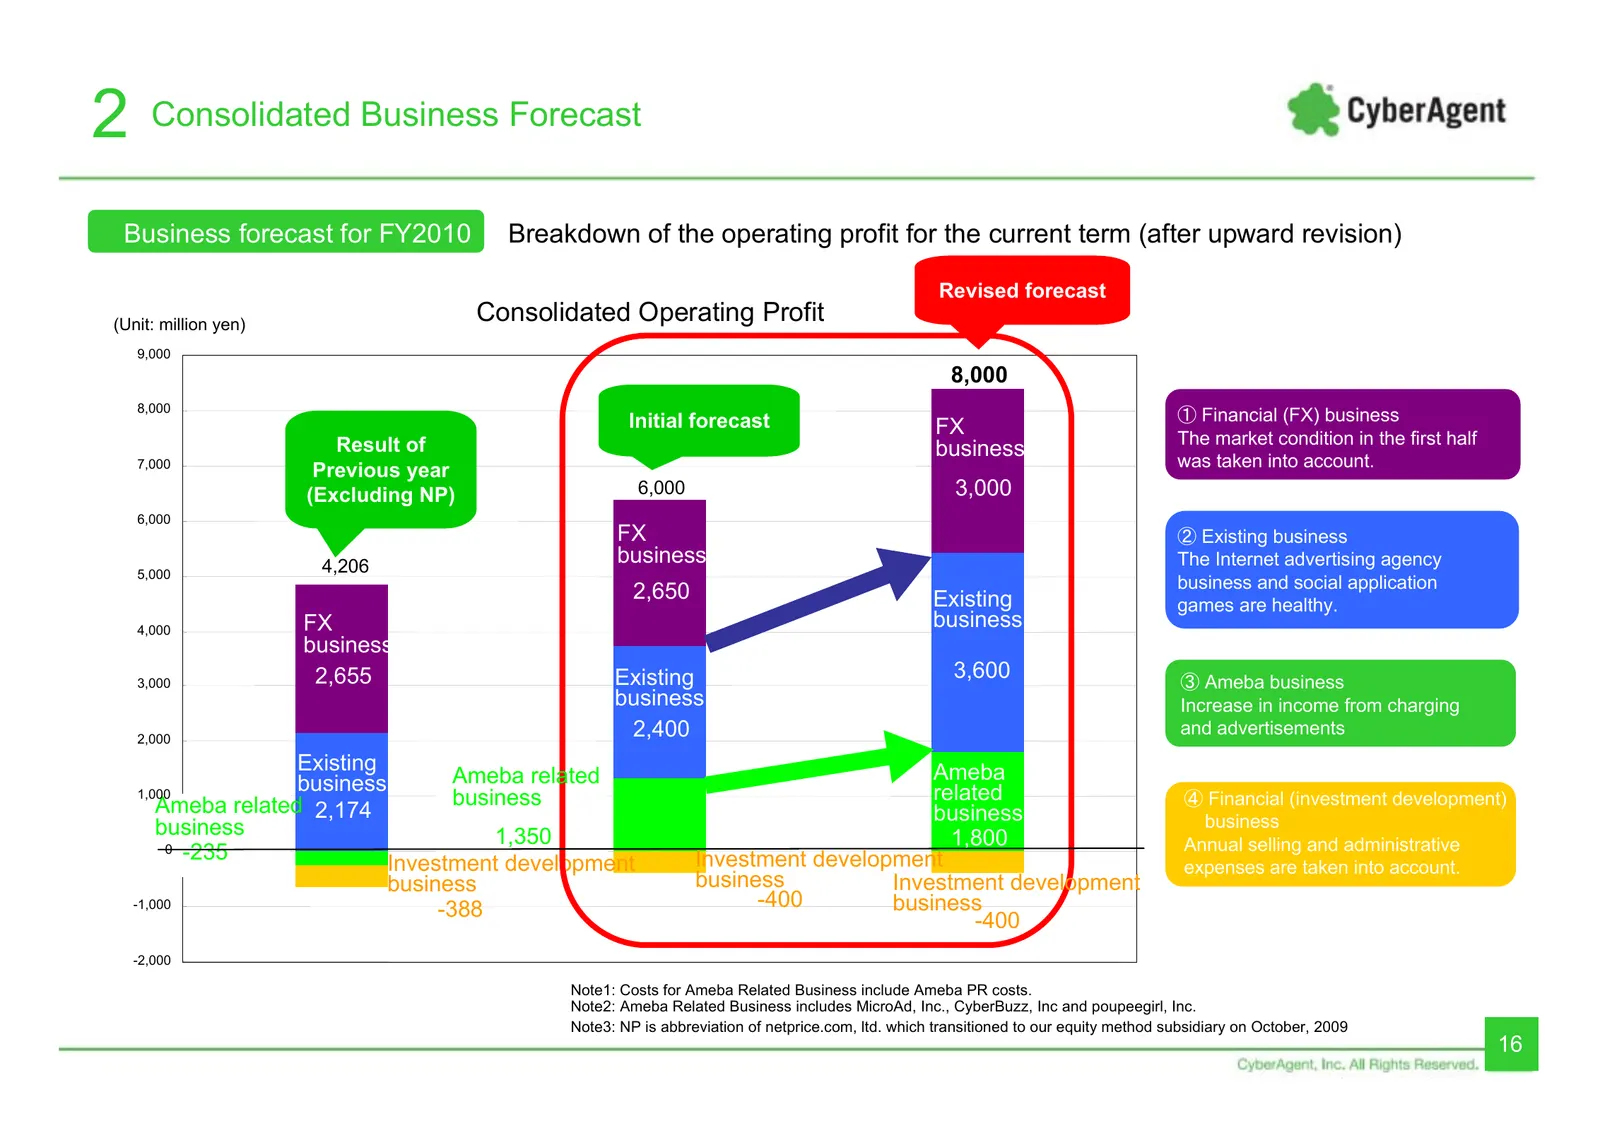
2 Consolidated Business Forecast 2009年9月期業績見通し Business forecast for FY2010 Breakdown of the operating profit for the current term (after upward revision) Revised forecast (Unit: million yen) Consolidated Operating Profit 9,000 8,000 8,000 進捗率 ●% (FX) business Initial forecast ① Financial ①金融関連(FX)事

Slide 17: Major Business
3 Major Business Major Business 17
Slide 18: Major Business (Internet Advertising Agency Business)
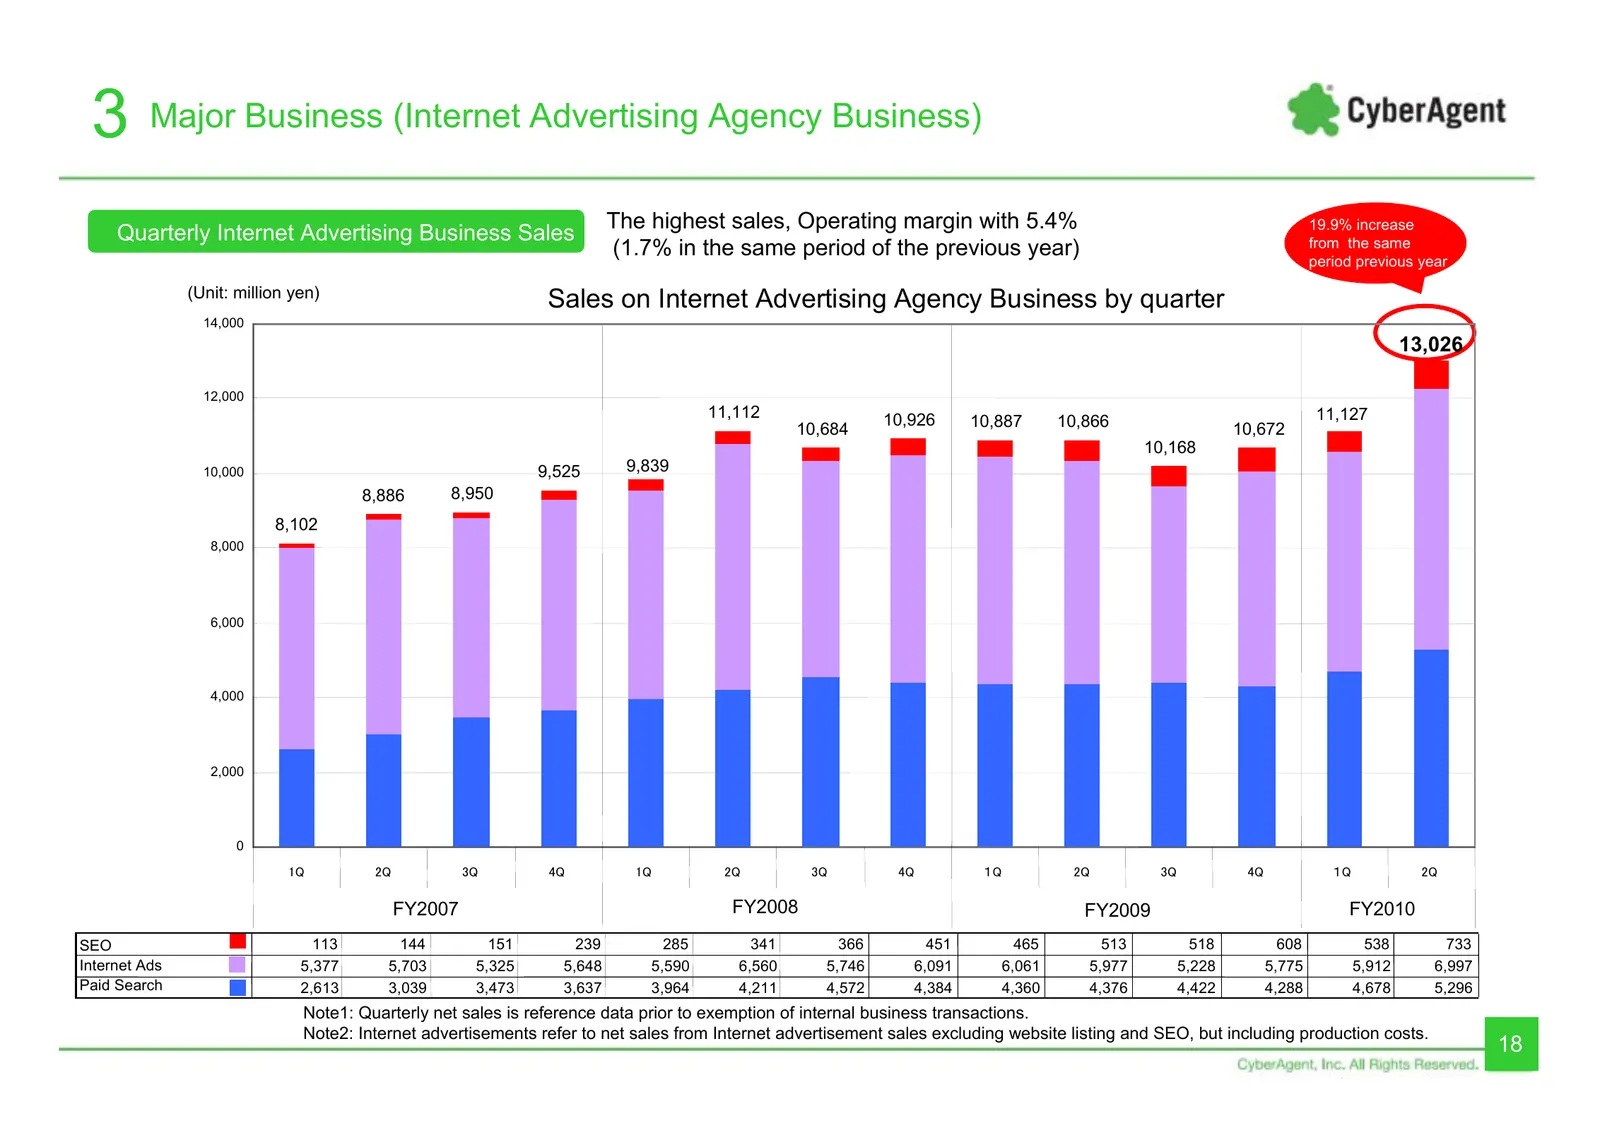
3 Major Business (Internet Advertising Agency Business) The highest sales, Operating margin with 5.4% 19.9% increase Quarterly Internet Advertising Business Sales from the same (1.7% in the same period of the previous year) period previous year (Unit: million yen) Sales on Internet Advertising Agenc
Slide 19: Major Business (Foreign Exchange Business)
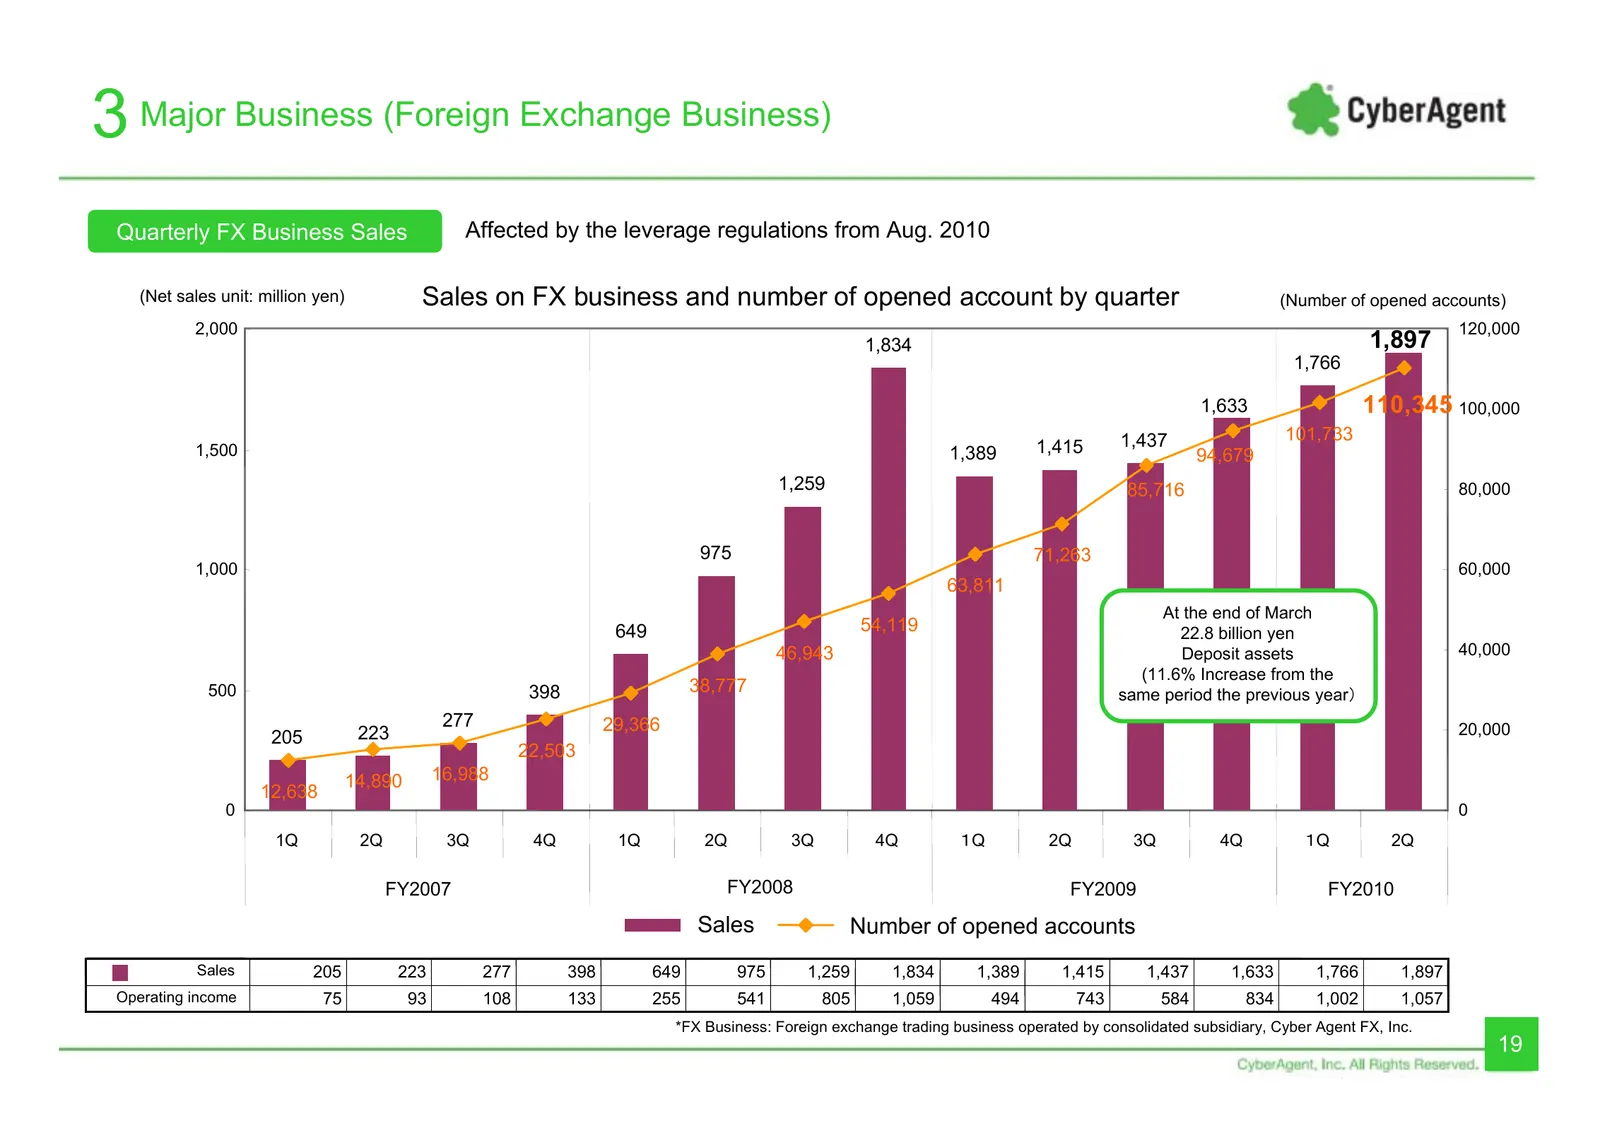
3 Major Business (Foreign Exchange Business) Quarterly FX Business Sales Affected by the leverage regulations from Aug. 2010 (Net sales unit: million yen) Sales on FX business and number of opened account by quarter (Number of opened accounts) 2,000 120,000 1,834 1,897 1,766 1,633 110,345 100,000 1,
Slide 20: Major Business (Internet Media Business)
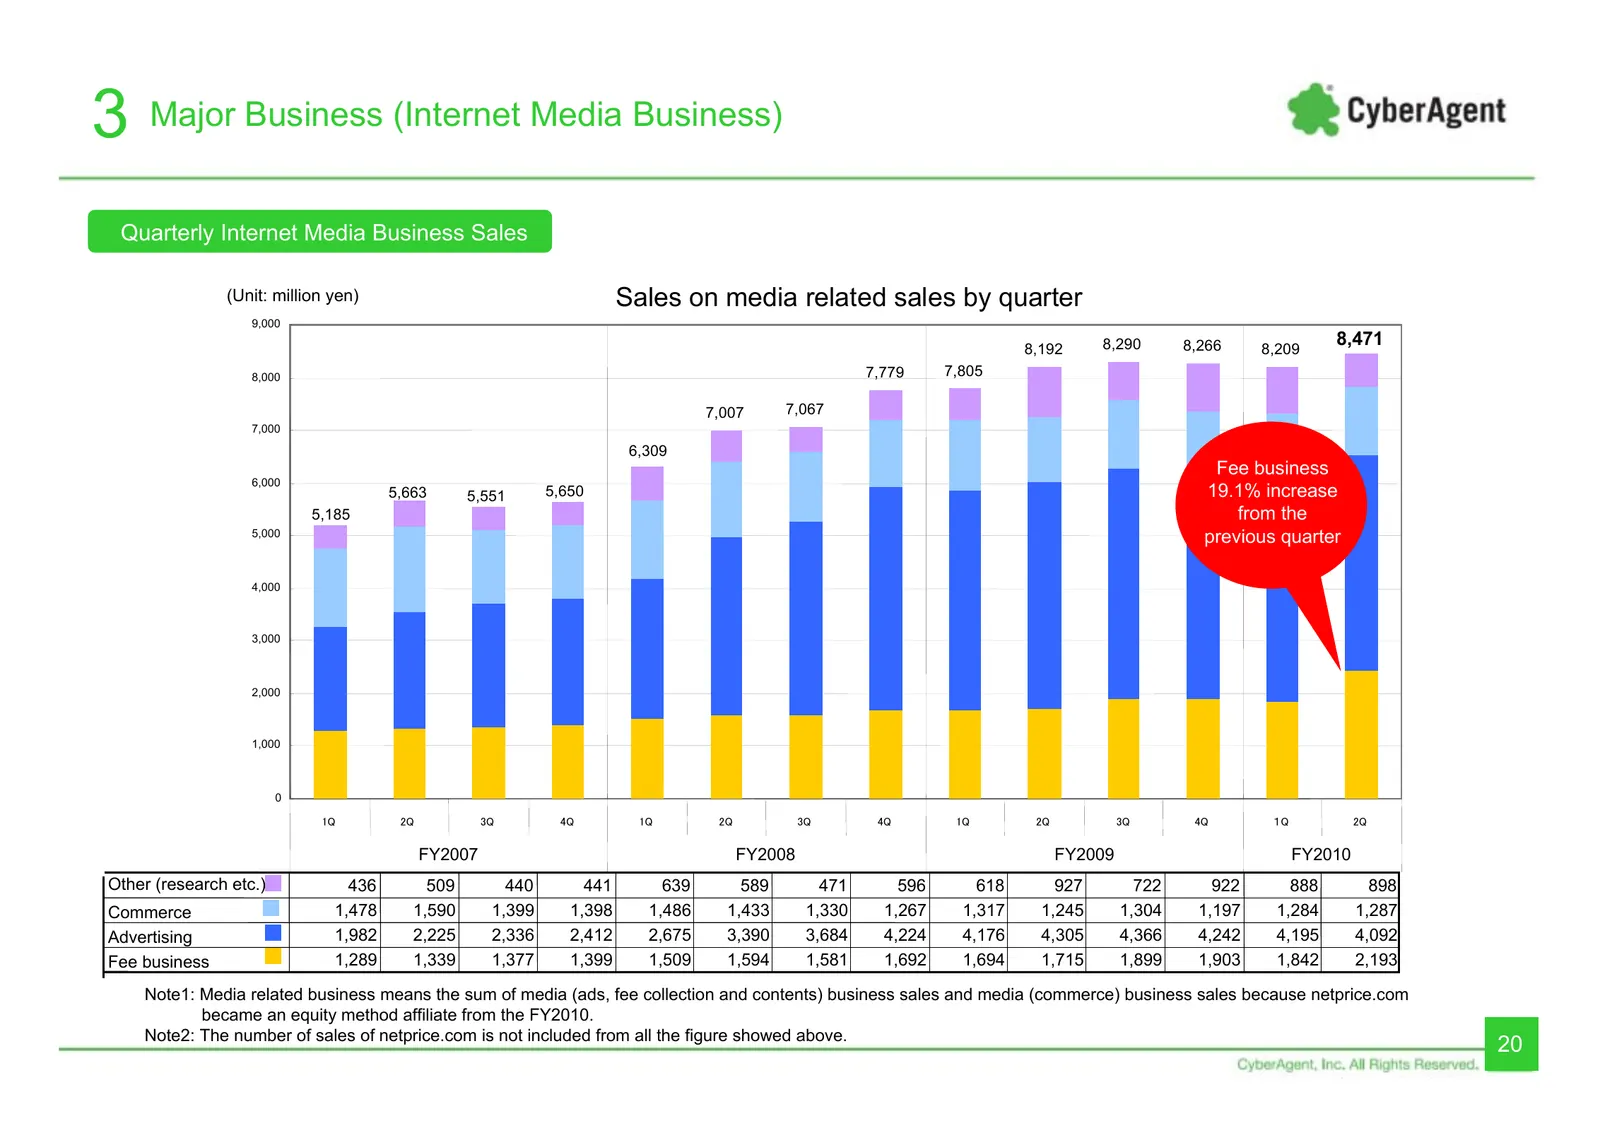
3 Major Business (Internet Media Business) Quarterly Internet Media Business Sales (Unit: million yen) Sales on media related sales by quarter 9,000 8,290 8,266 8,471 8,192 8,209 8,000 7,779 7,805 7,007 7,067 7,000 6,309 Fee business 6,000 5,663 5,551 5,650 19.1% increase 5,185 from the 5,000 previo
Slide 21: Major social applications of subsidiaries (in Japan)
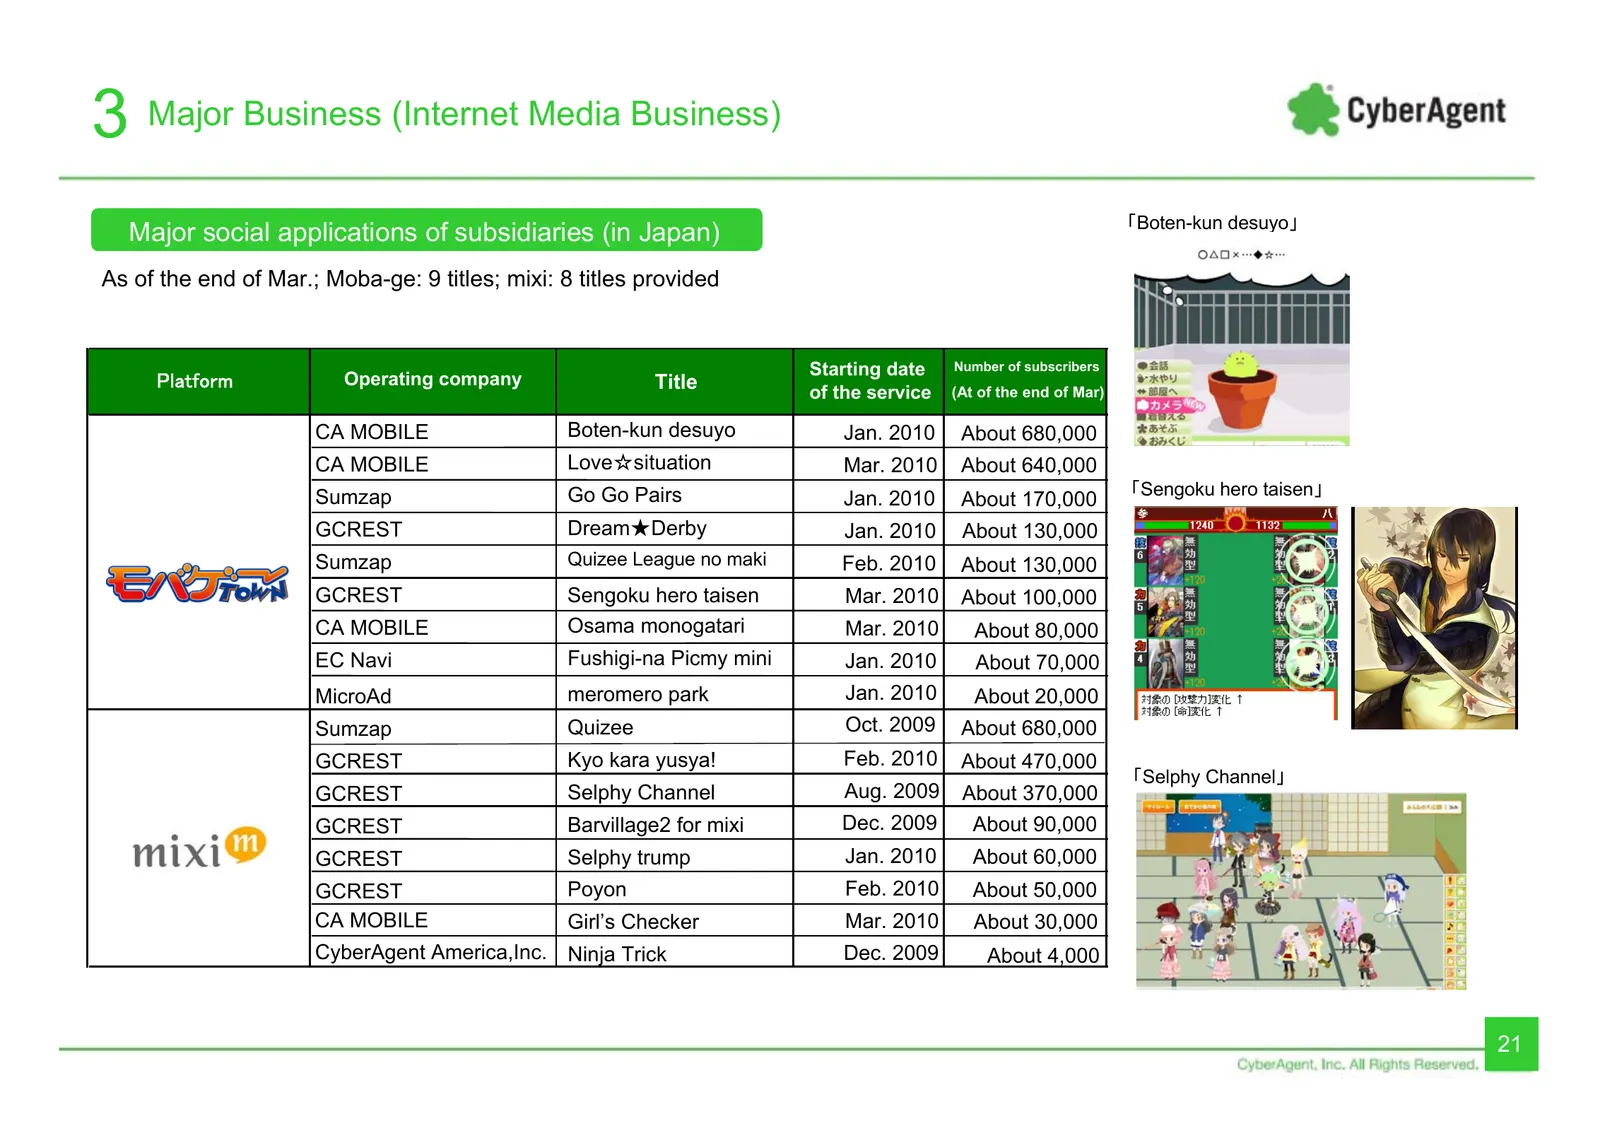
3 Major Business (Internet Media Business) 「Boten-kun desuyo」 Major social applications of subsidiaries (in Japan) As of the end of Mar.; Moba-ge: 9 titles; mixi: 8 titles provided Starting date Number of subscribers Platform Operating company Title of the service (At of the end of Mar) CA MOBILE Bo
Slide 22: Major social applications of subsidiaries (outside Japan)
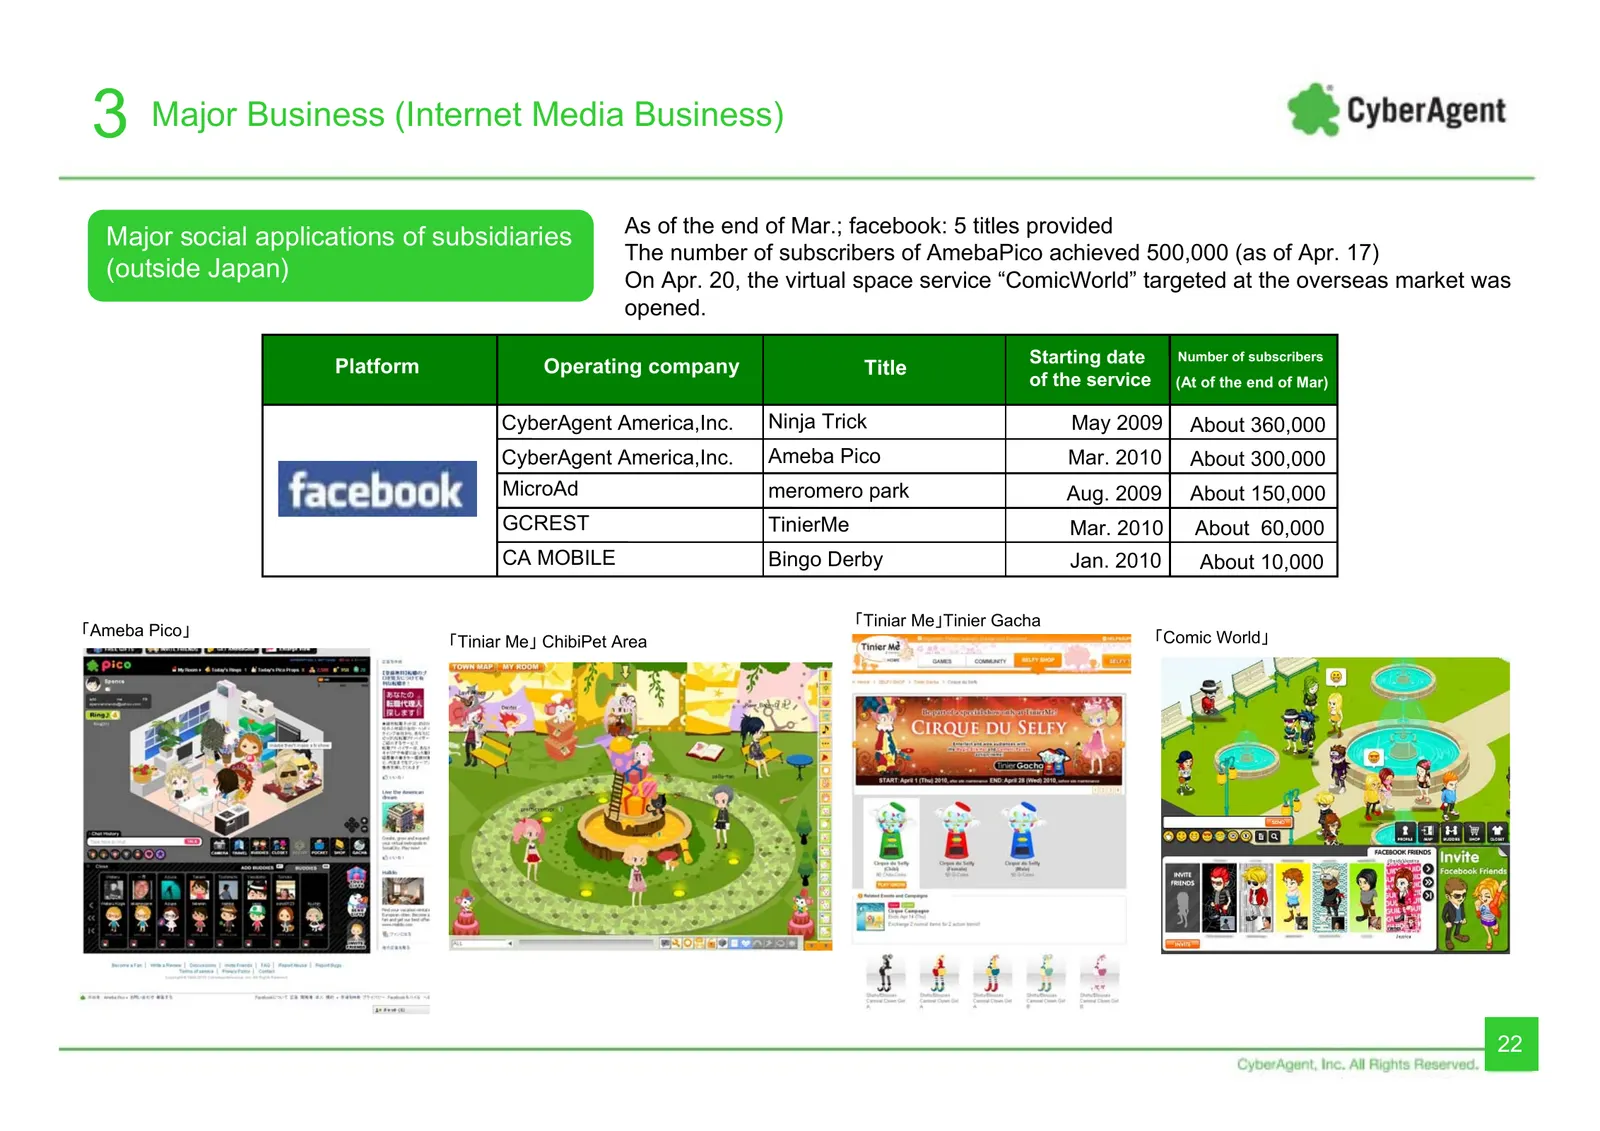
3 Major Business (Internet Media Business) As of the end of Mar.; facebook: 5 titles provided Major social applications of subsidiaries The number of subscribers of AmebaPico achieved 500,000 (as of Apr. 17) (outside Japan) On Apr. 20, the virtual space service “ComicWorld” targeted at the overseas
Slide 23: Ameba Business
4 Ameba Business Ameba business 23
Slide 24: Monthly Page Views of Ameba
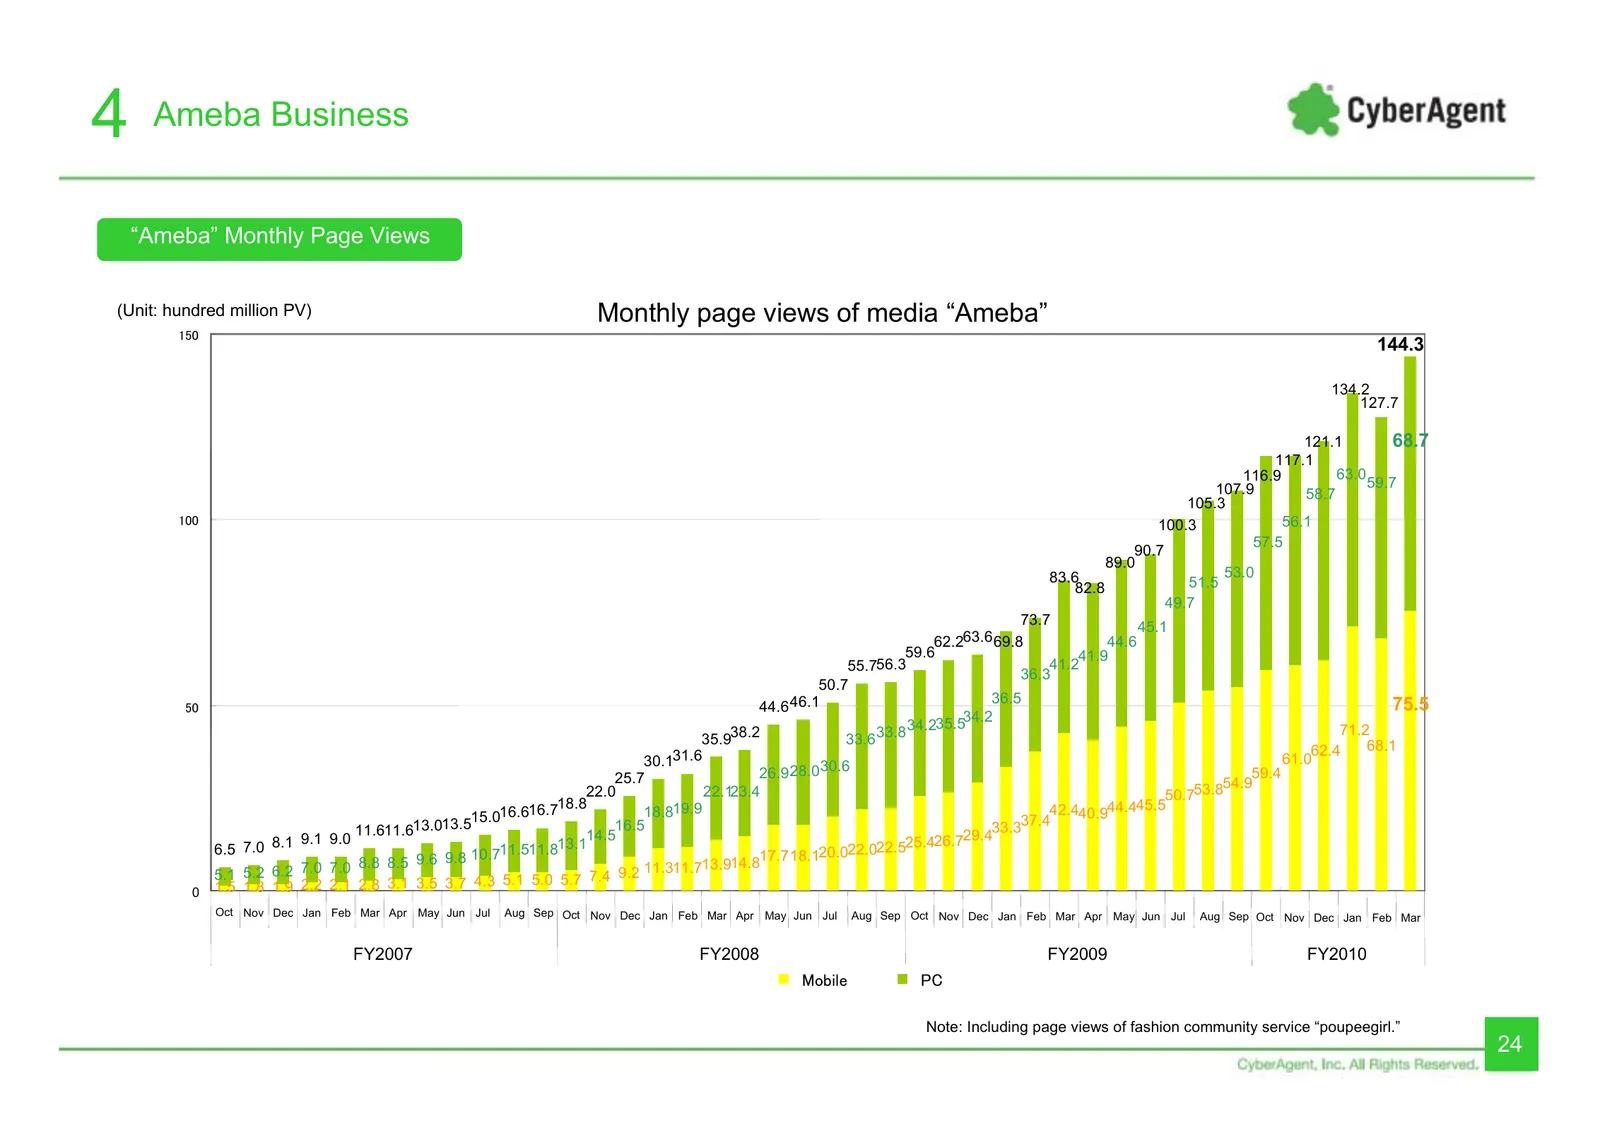
4 Ameba Business “Ameba” Monthly Page Views (Unit: hundred million PV) Monthly page views of media “Ameba” 150 144.3 134.2 127.7 121.1 68.7 117.1 116.9 63.0 107.9 59.7 58.7 105.3 100 100.3 56.1 57.5 90.7 89.0 83.6 53.0 82.8 51.5 49.7 73.7 45.1 62.263.6 69.8 44.6 59.6 41.9 55.756.3 41.2 36.3 50.7 36.
Slide 25: Monthly Number of Ameba Subscribers
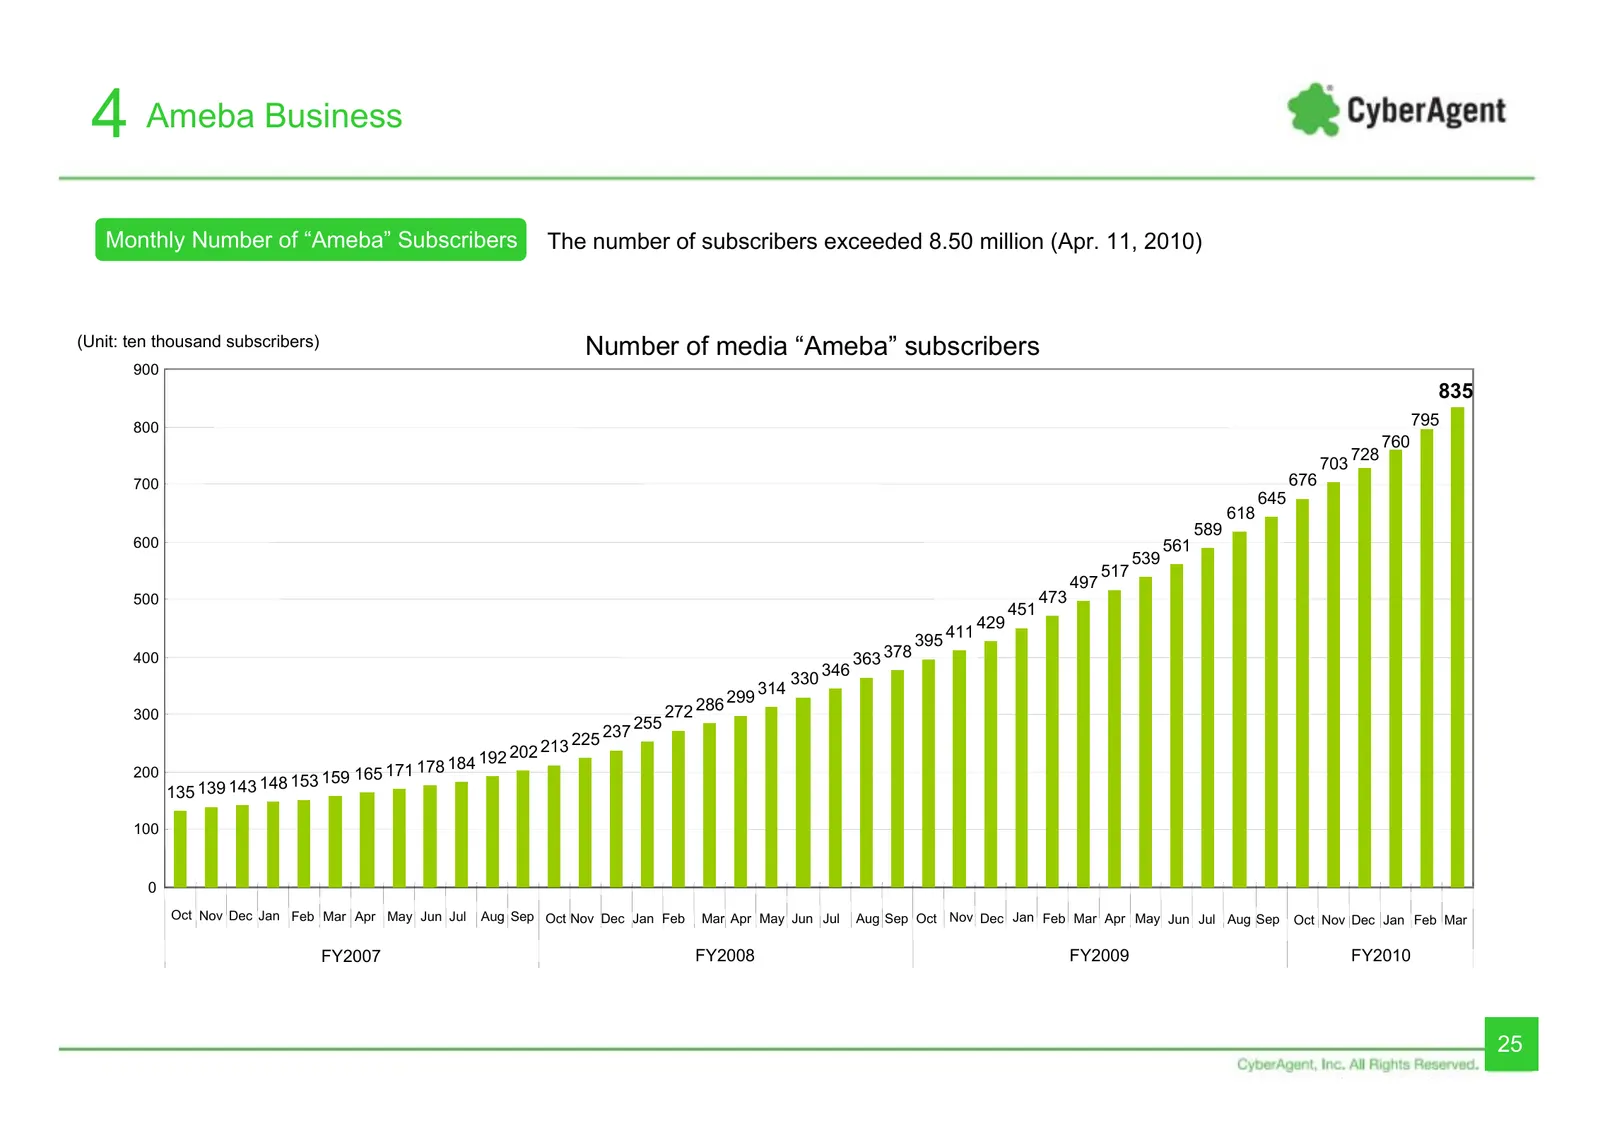
4 Ameba Business Monthly Number of “Ameba” Subscribers The number of subscribers exceeded 8.50 million (Apr. 11, 2010) (Unit: ten thousand subscribers) Number of media “Ameba” subscribers 900 835 800 795 760 728 703 700 676 645 618 589 600 561 539 517 497 500 473 451 429 411 395 400 363 378 346 330
Slide 26: Quarterly Sales of Ameba Business
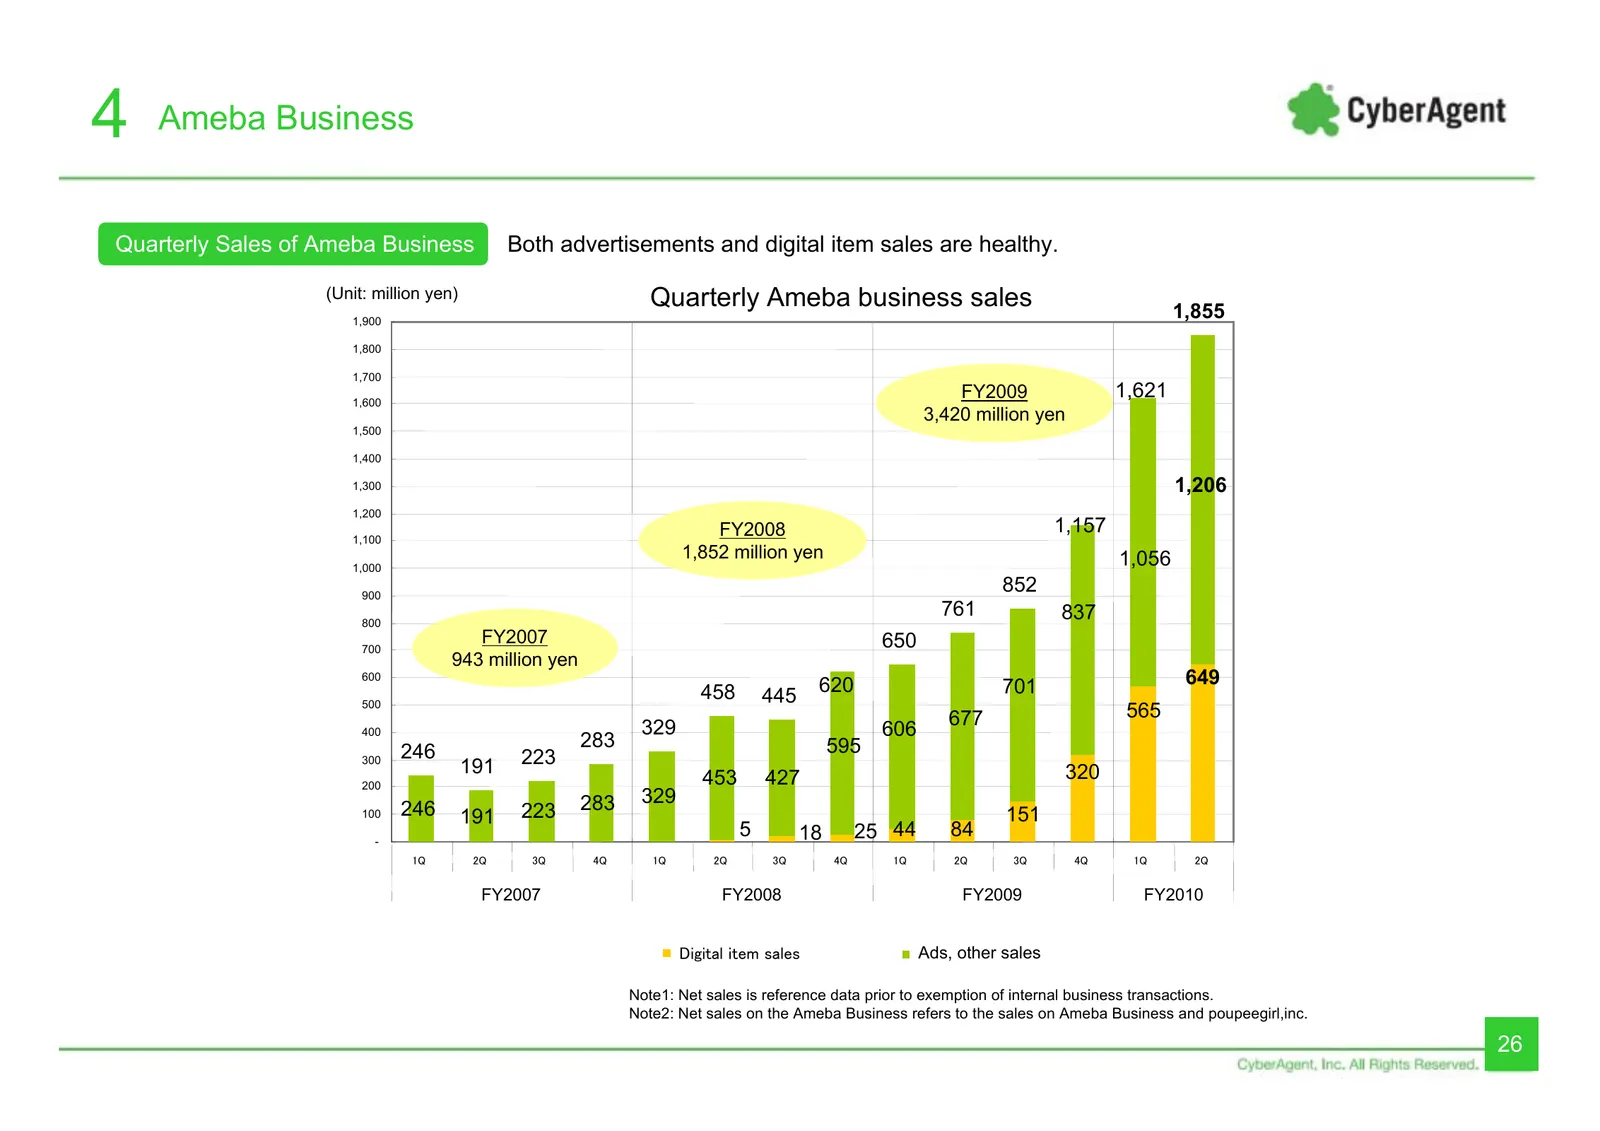
4 Ameba Business Quarterly Sales of Ameba Business Both advertisements and digital item sales are healthy. (Unit: million yen) Quarterly Ameba business sales 1,855 1,900 1,800 1,700 1,600 FY2009 1,621 3,420 million yen 1,500 1,400 1,300 1,206 1,200 FY2008 1,157 1,100 1,852 million yen 1,056 1,000 90
Slide 27: Quarterly Ameba Business Ads Sales
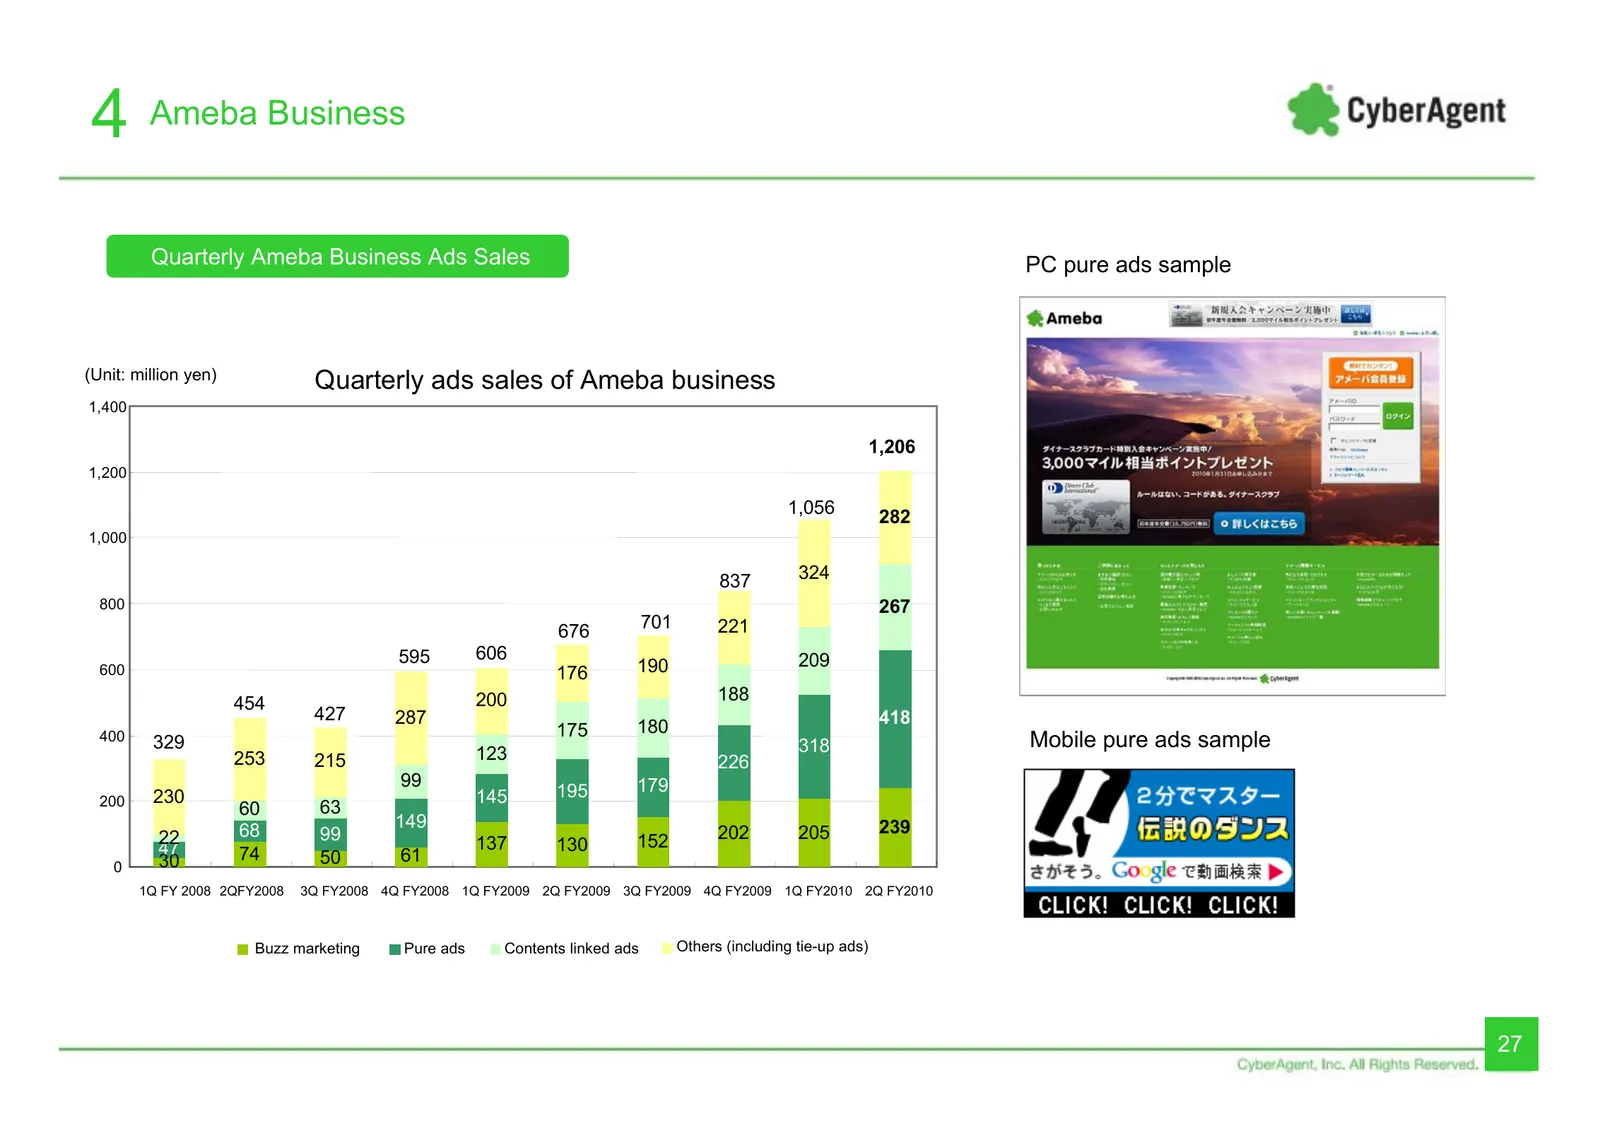
4 Ameba Business Quarterly Ameba Business Ads Sales PC pure ads sample (Unit: million yen) Quarterly ads sales of Ameba business 1,400 1,206 1,200 1,056 282 1,000 837 324 800 267 676 701 221 595 606 209 600 176 190 454 200 188 427 287 418 175 180 400 329 318 Mobile pure ads sample 253 215 123 226 99
Slide 28: Quarterly Digital Item Sales of Ameba Business
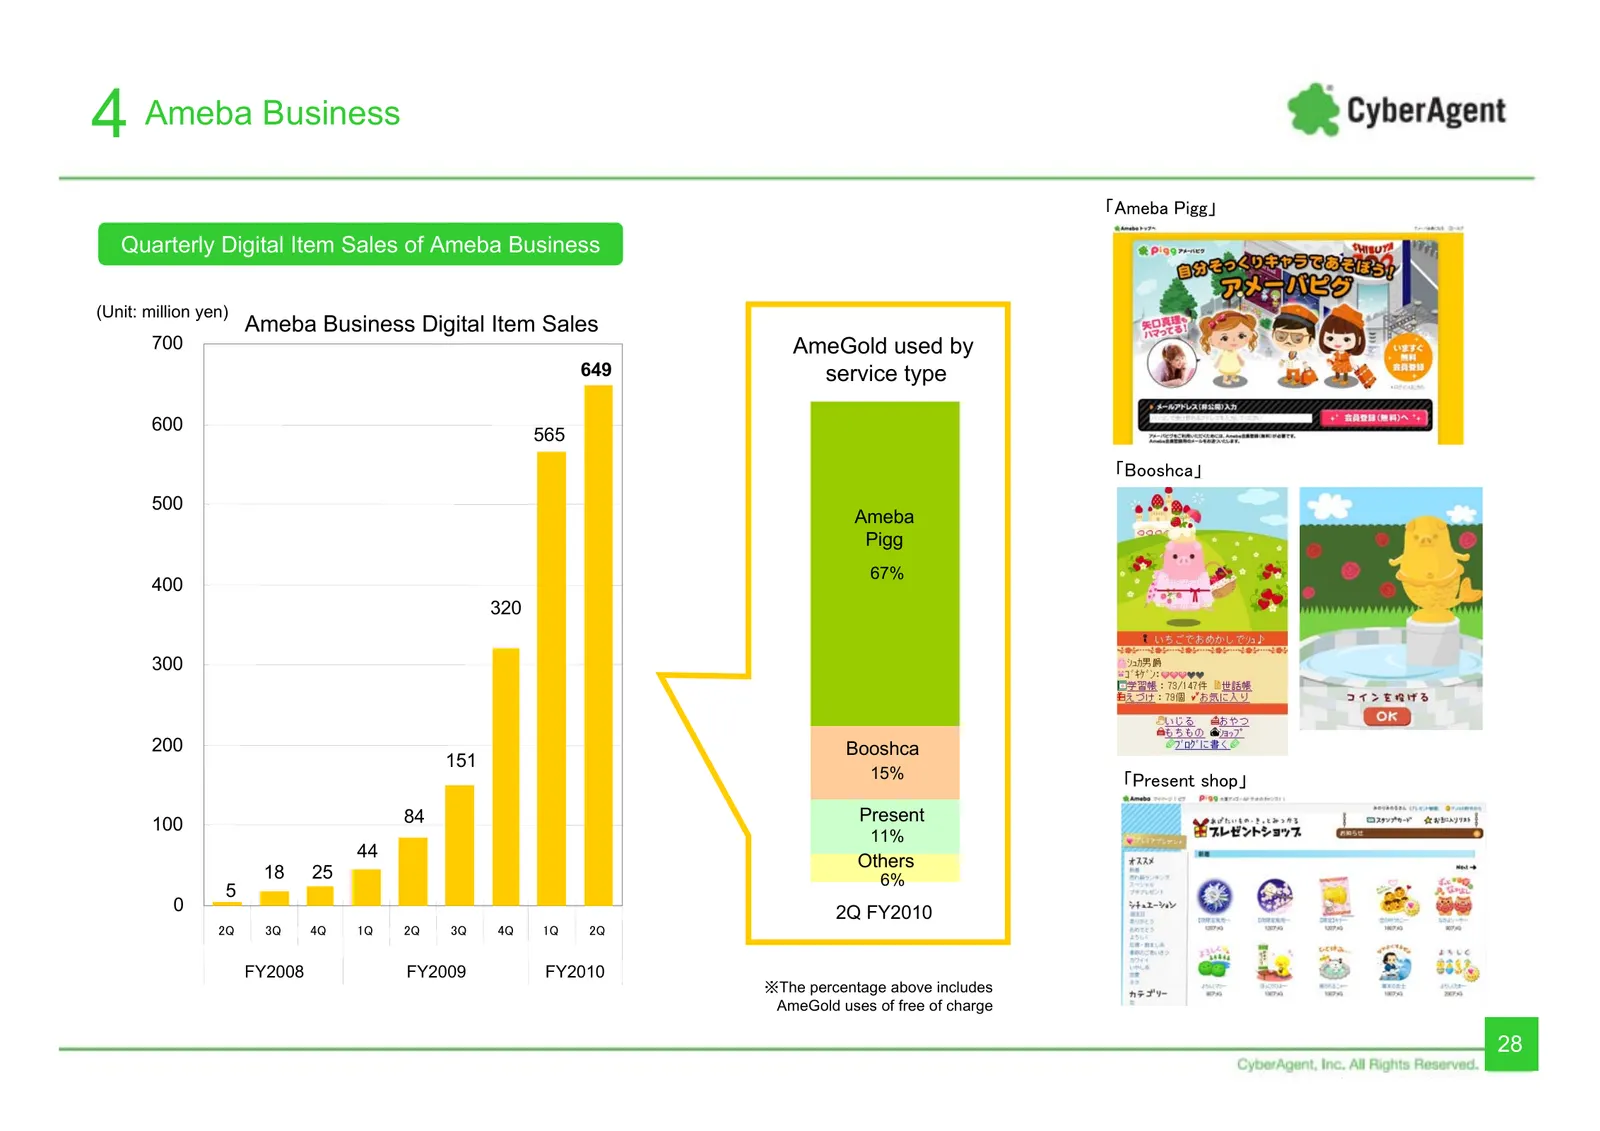
4 Ameba Business 「Ameba Pigg」 Quarterly Digital Item Sales of Ameba Business (Unit: million yen) Ameba Business Digital Item Sales 700 AmeGold used by 649 service type 600 565 「Booshca」 500 Ameba Pigg 67% 400 320 300 200 Booshca 151 15% 「Present shop」 100 84 Present 11% 44 Others 18 25 6% 5 0 2Q FY2
Slide 29: Ameba Pigg Subscribers and ARPU
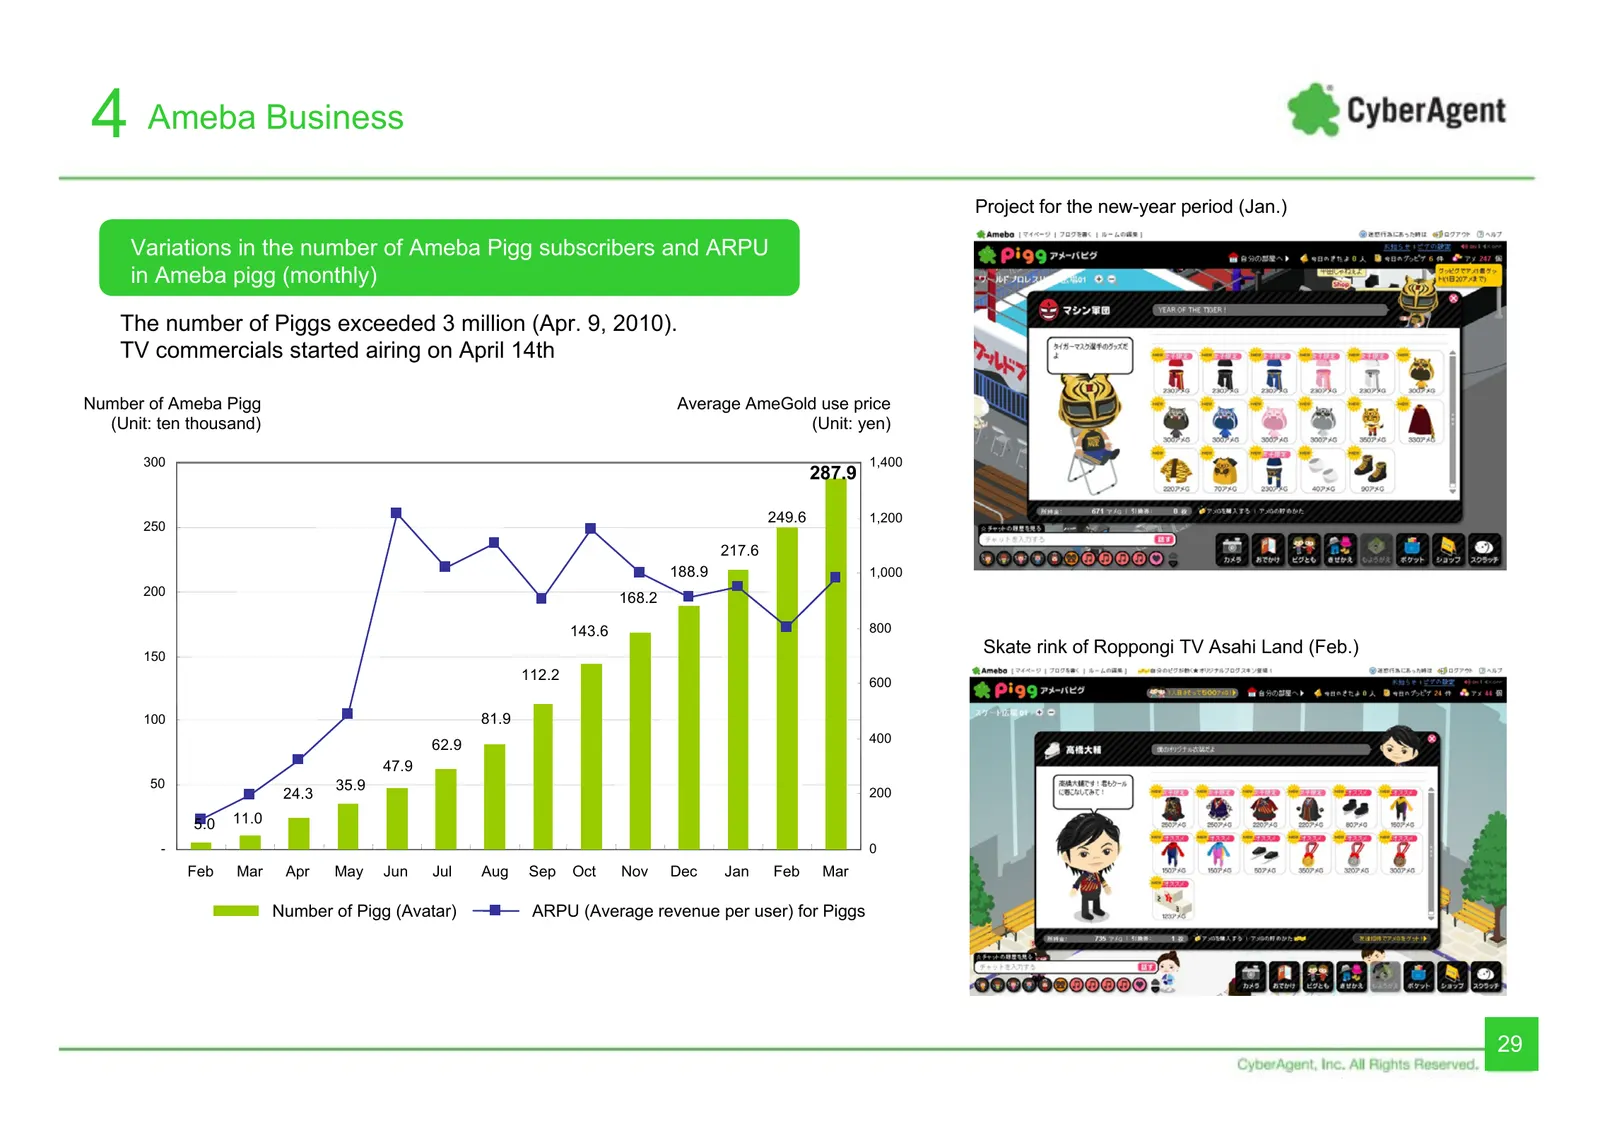
4 Ameba Business Project for the new-year period (Jan.) Variations in the number of Ameba Pigg subscribers and ARPU in Ameba pigg (monthly) The number of Piggs exceeded 3 million (Apr. 9, 2010). TV commercials started airing on April 14th Number of Ameba Pigg Average AmeGold use price (Unit: ten tho
Slide 30: Ameba Service Report for Jan-Mar
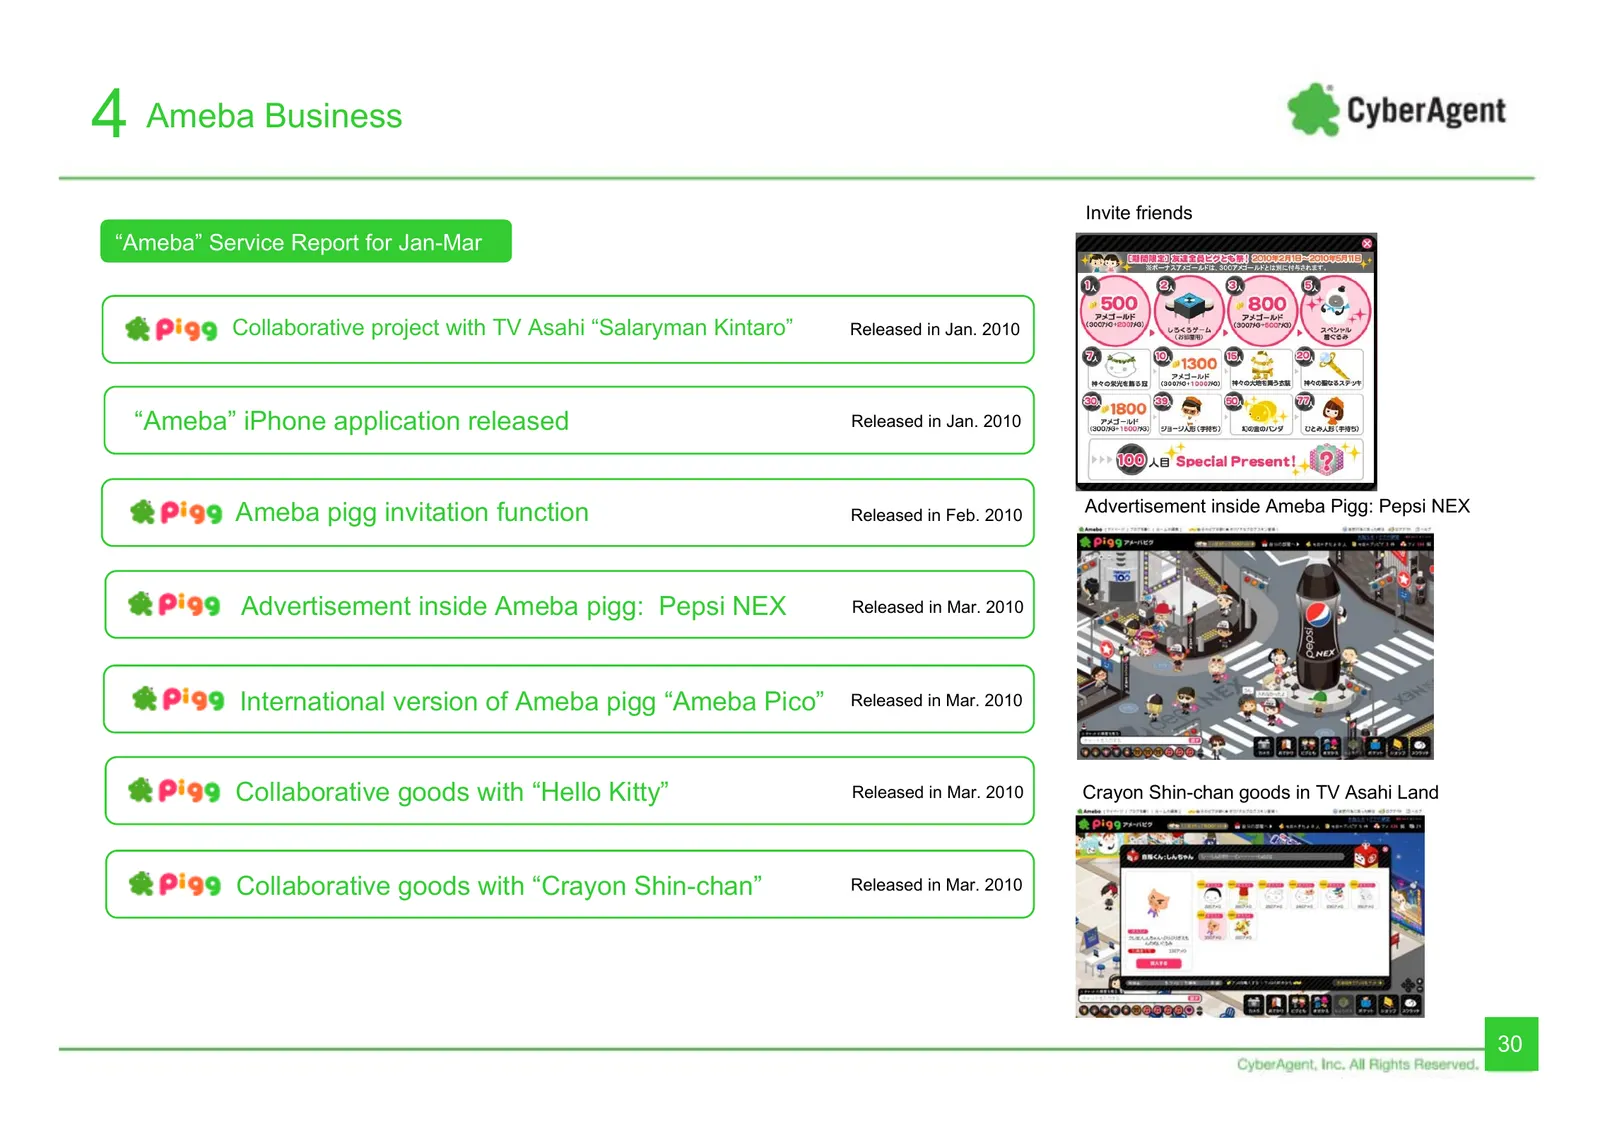
4 Ameba Business Invite friends “Ameba” Service Report for Jan-Mar Collaborative project with TV Asahi “Salaryman Kintaro” Released in Jan. 2010 “Ameba” iPhone application released Released in Jan. 2010 Ameba pigg invitation function Released in Feb. 2010 Advertisement inside Ameba Pigg: Pepsi NEX A
Slide 31: Ameba projects from Apr.
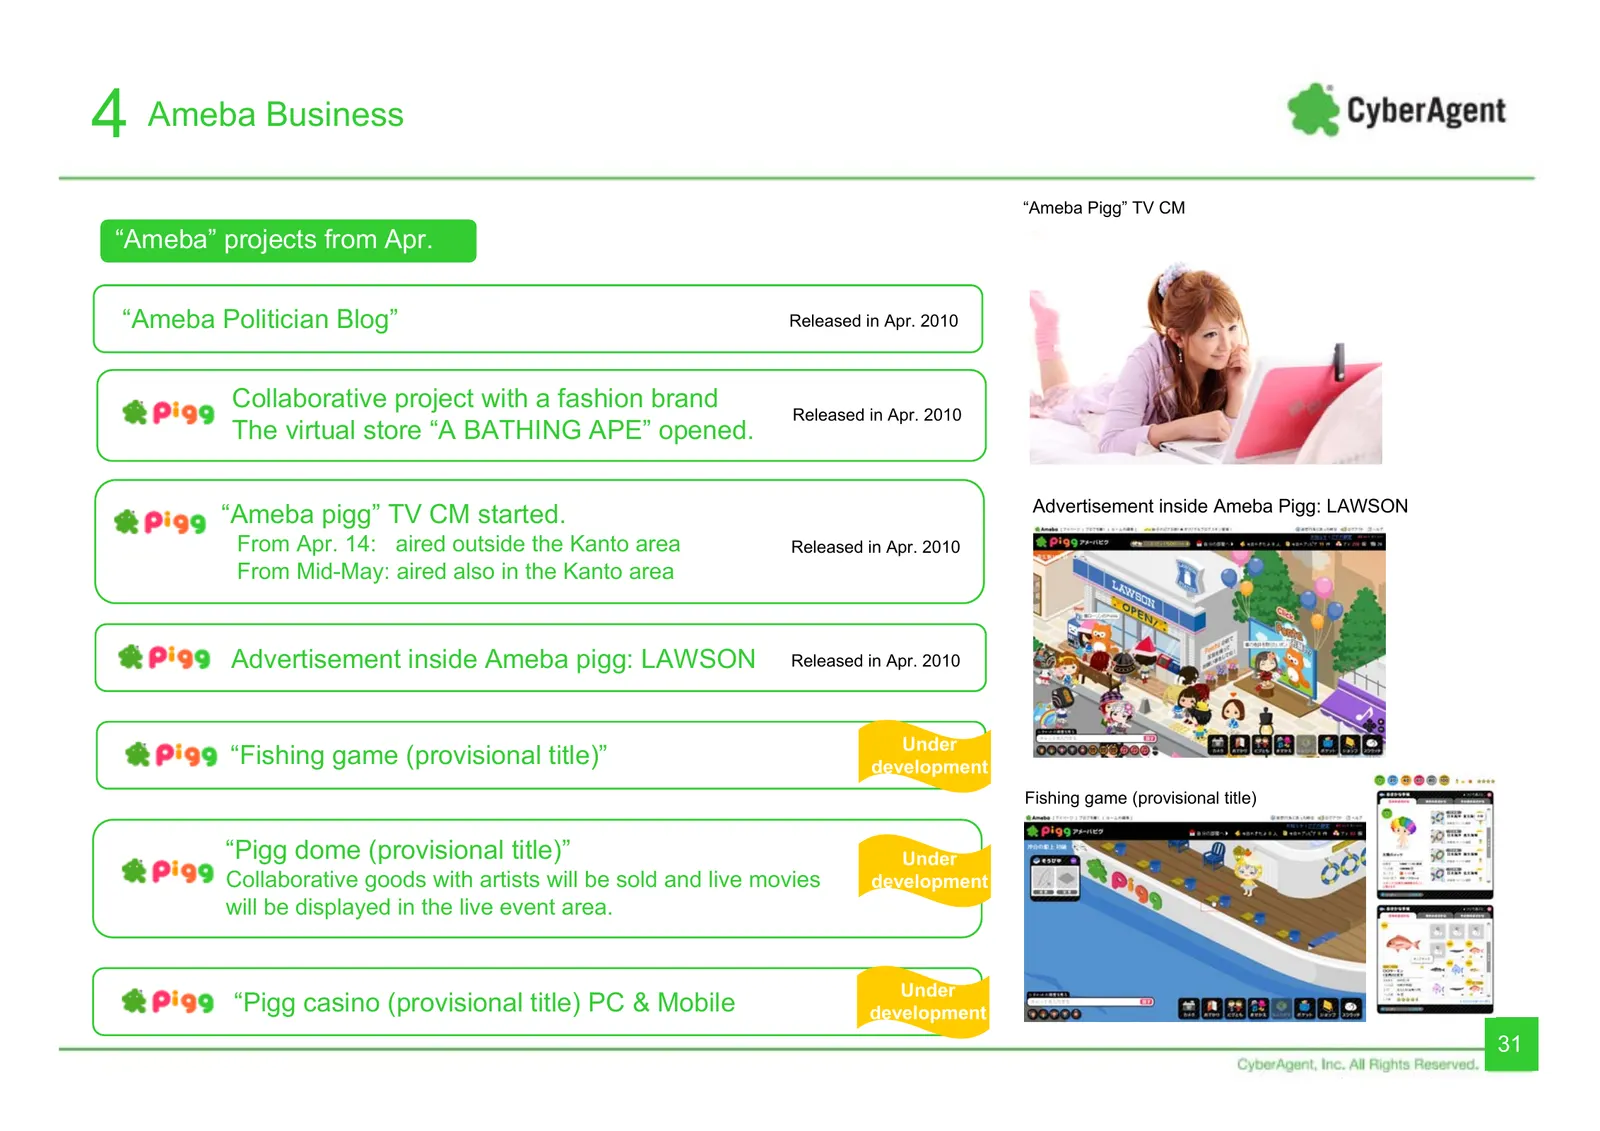
4 Ameba Business “Ameba Pigg” TV CM “Ameba” projects from Apr. “Ameba Politician Blog” Released in Apr. 2010 Collaborative project with a fashion brand Released in Apr. 2010 The virtual store “A BATHING APE” opened. Advertisement inside Ameba Pigg: LAWSON “Ameba pigg” TV CM started. From Apr. 14: ai
Slide 32: Summary
5 summary g CyberAgent Summary 32 CyberAgent, Inc. All Rights Reserved. 32 |
Slide 33: Summary: First half and second half targets
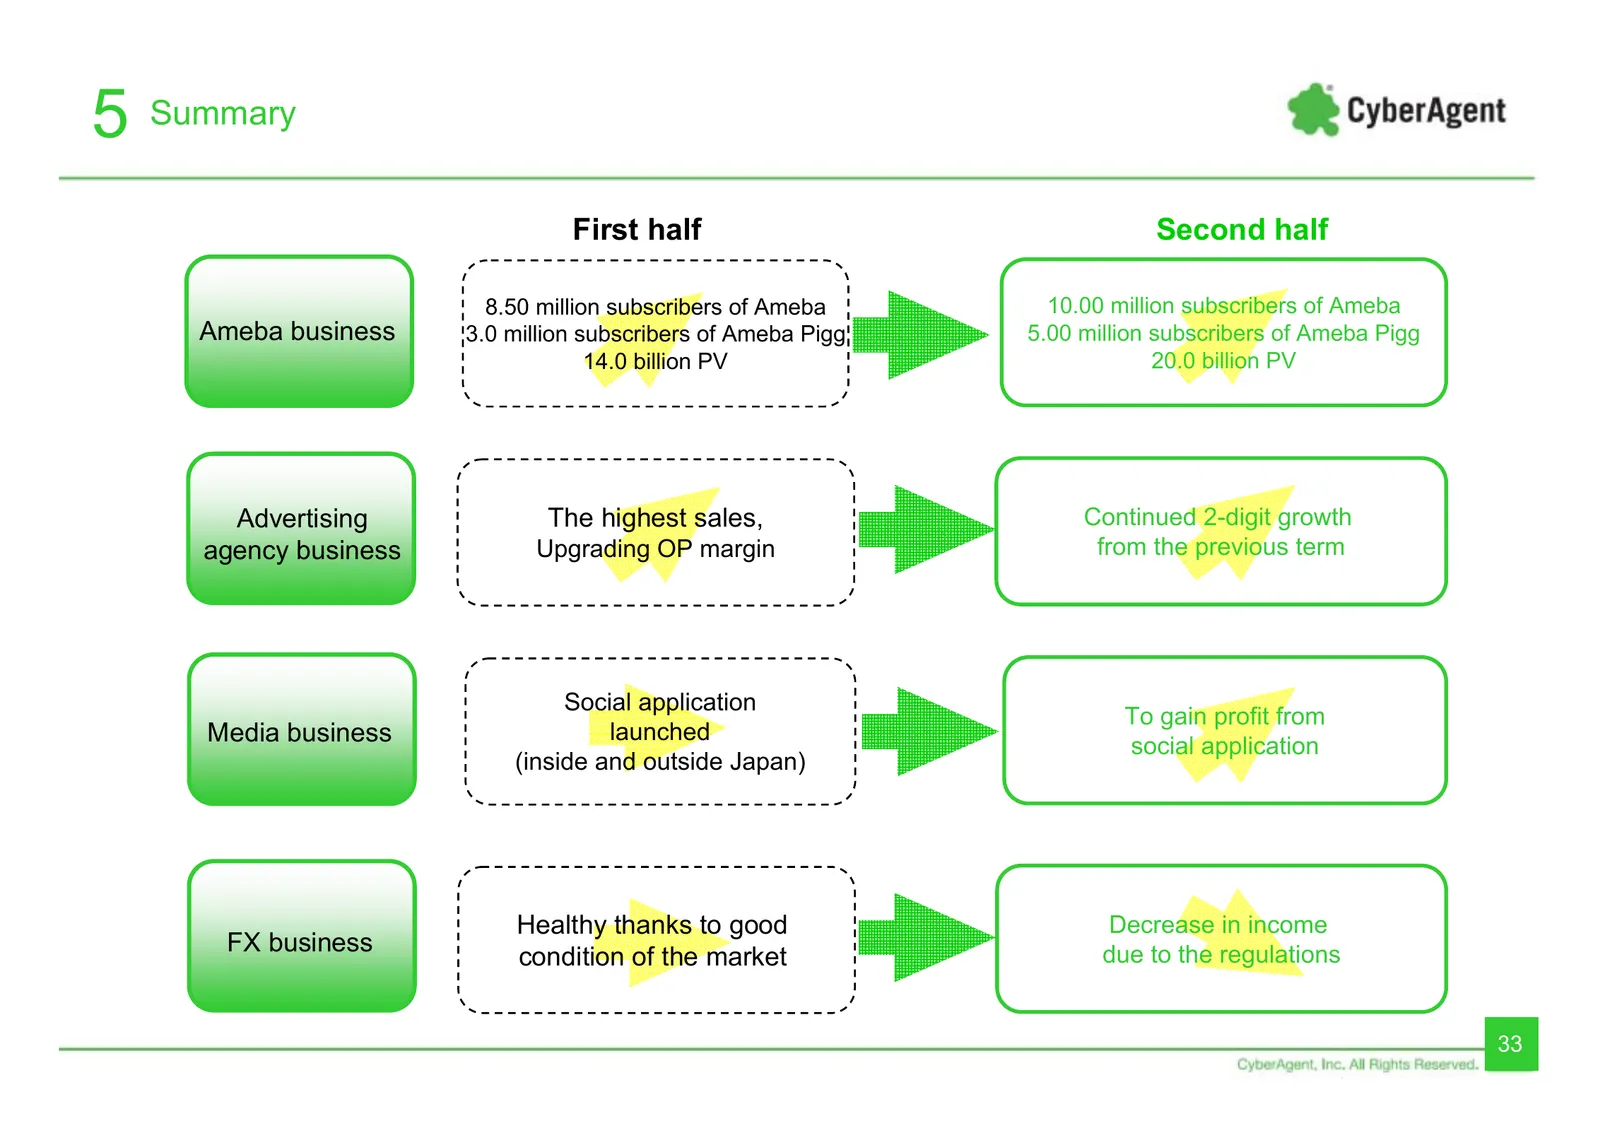
5 Summary First half Second half 8.50 million subscribers of Ameba 10.00 million subscribers of Ameba Ameba business 3.0 million subscribers of Ameba Pigg 5.00 million subscribers of Ameba Pigg 14.0 billion PV 20.0 billion PV Advertising The highest sales, Continued 2-digit growth agency business Up
Slide 34: Transforming to highly profitable media company focusing on Ameba
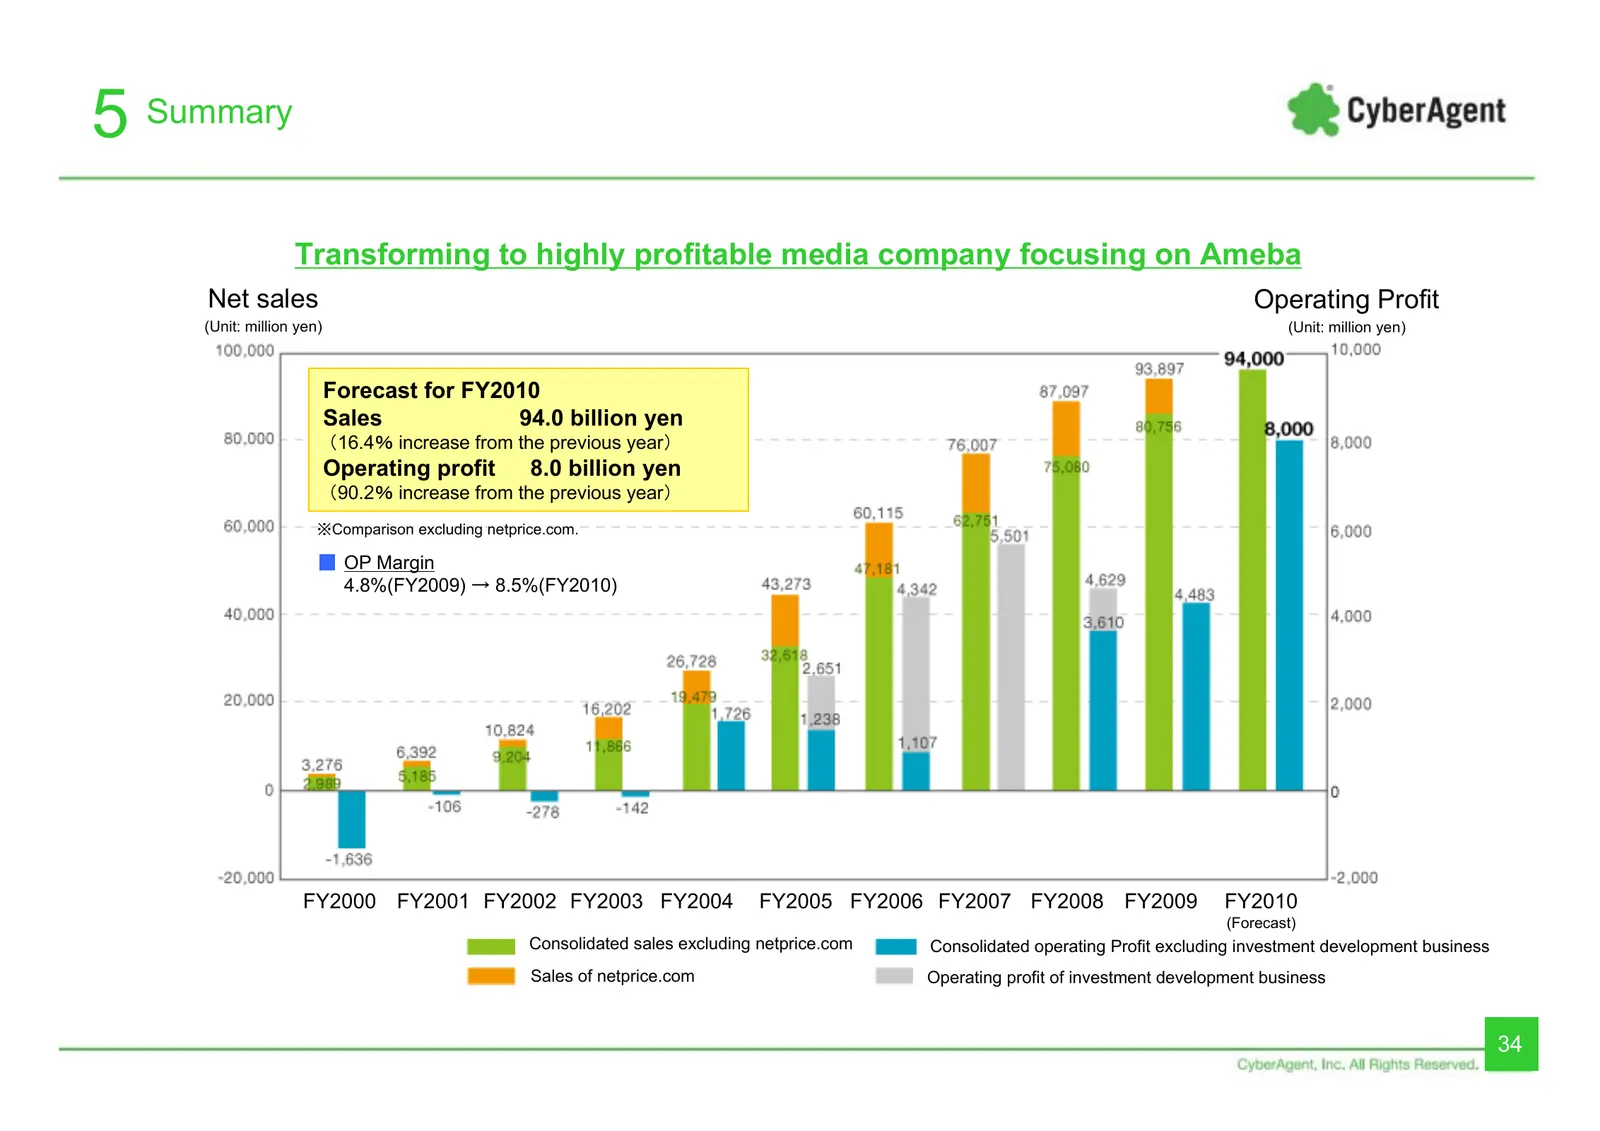
5 Summary Transforming to highly profitable media company focusing on Ameba Net sales Operating Profit (Unit: million yen) (Unit: million yen) Forecast for FY2010 Sales 94.0 billion yen (16.4% increase from the previous year) Operating profit 8.0 billion yen (90.2% increase from the previous year) ※

Slide 35: We Create The Company that Symbolizes the 21st Century
5 Summary We Create The Company that Symbolizes the 21st Century. 35
Slide 36: Reference
Reference g CyberAgent Reference 36 CyberAgent, Inc. All Rights Reserved. 36 |
Slide 37: Ameba Digital Item Sales Business AmeGold
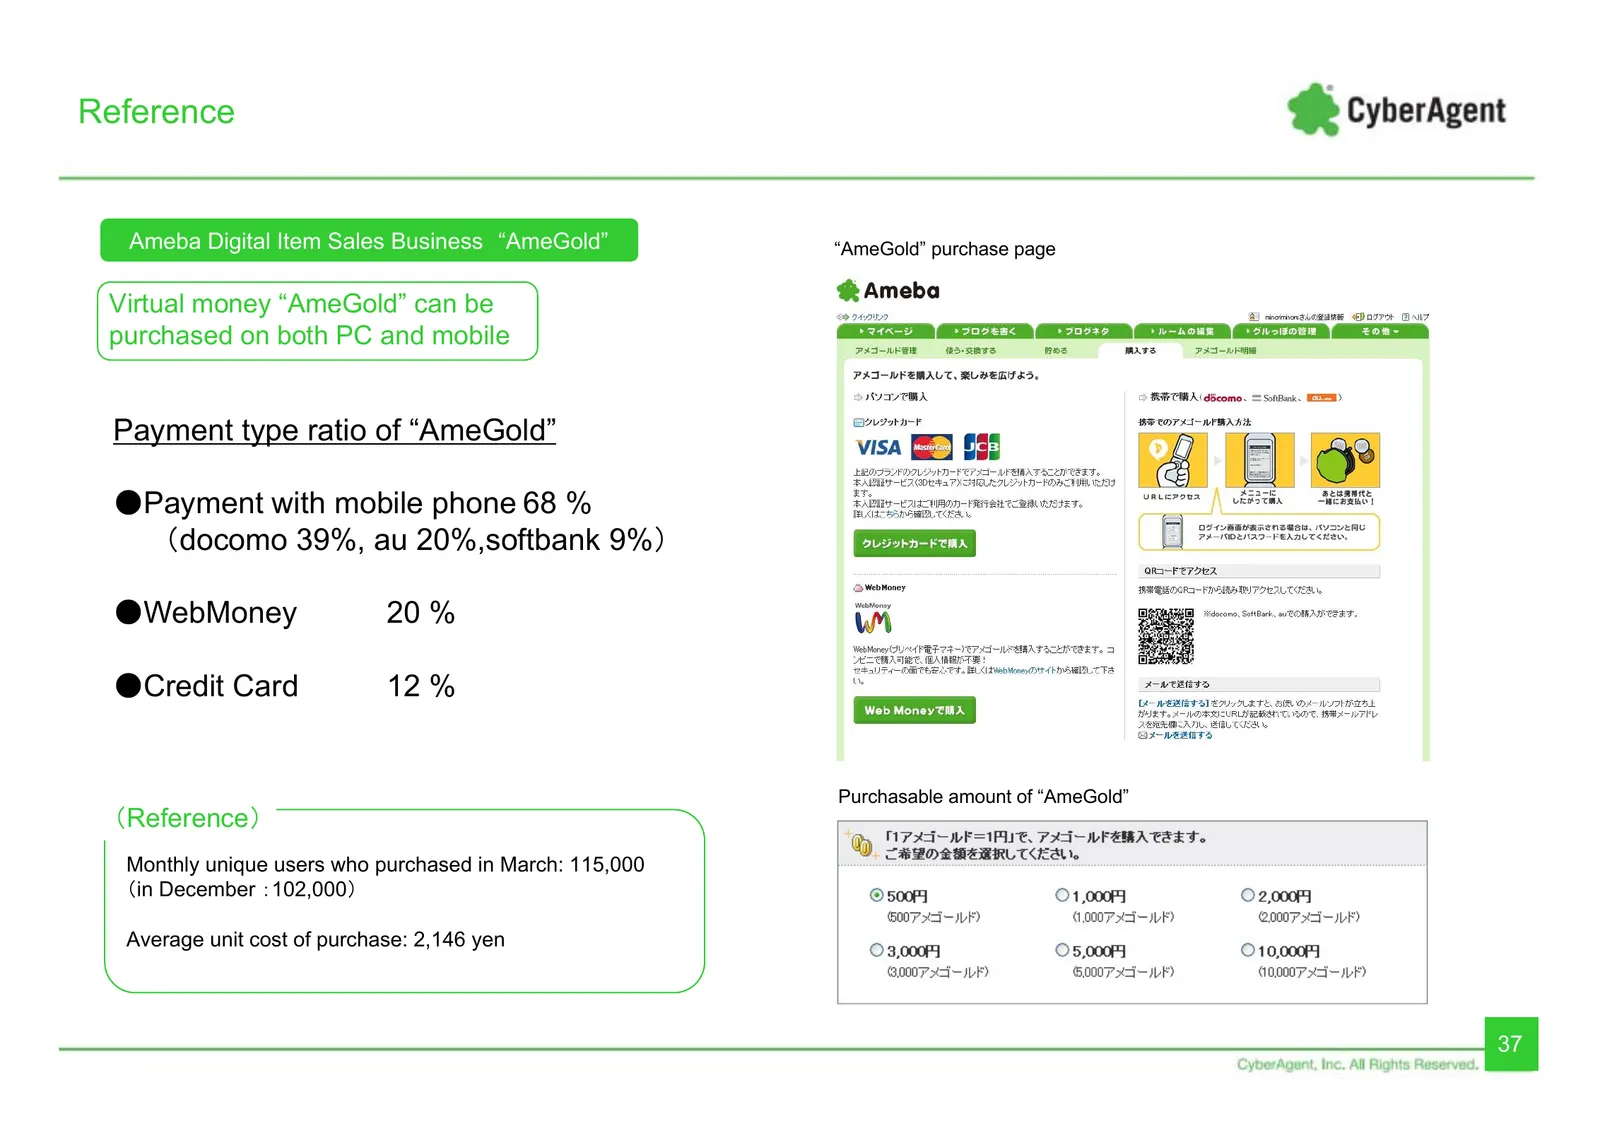
Reference Ameba Digital Item Sales Business “AmeGold” “AmeGold” purchase page Virtual money “AmeGold” can be purchased on both PC and mobile Payment type ratio of “AmeGold” ●Payment with mobile phone 68 % (docomo 39%, au 20%,softbank 9%) ●WebMoney 20 % ●Credit Card 12 % Purchasable amount of “AmeGol
Slide 38: Attribution of AmeGold purchasers
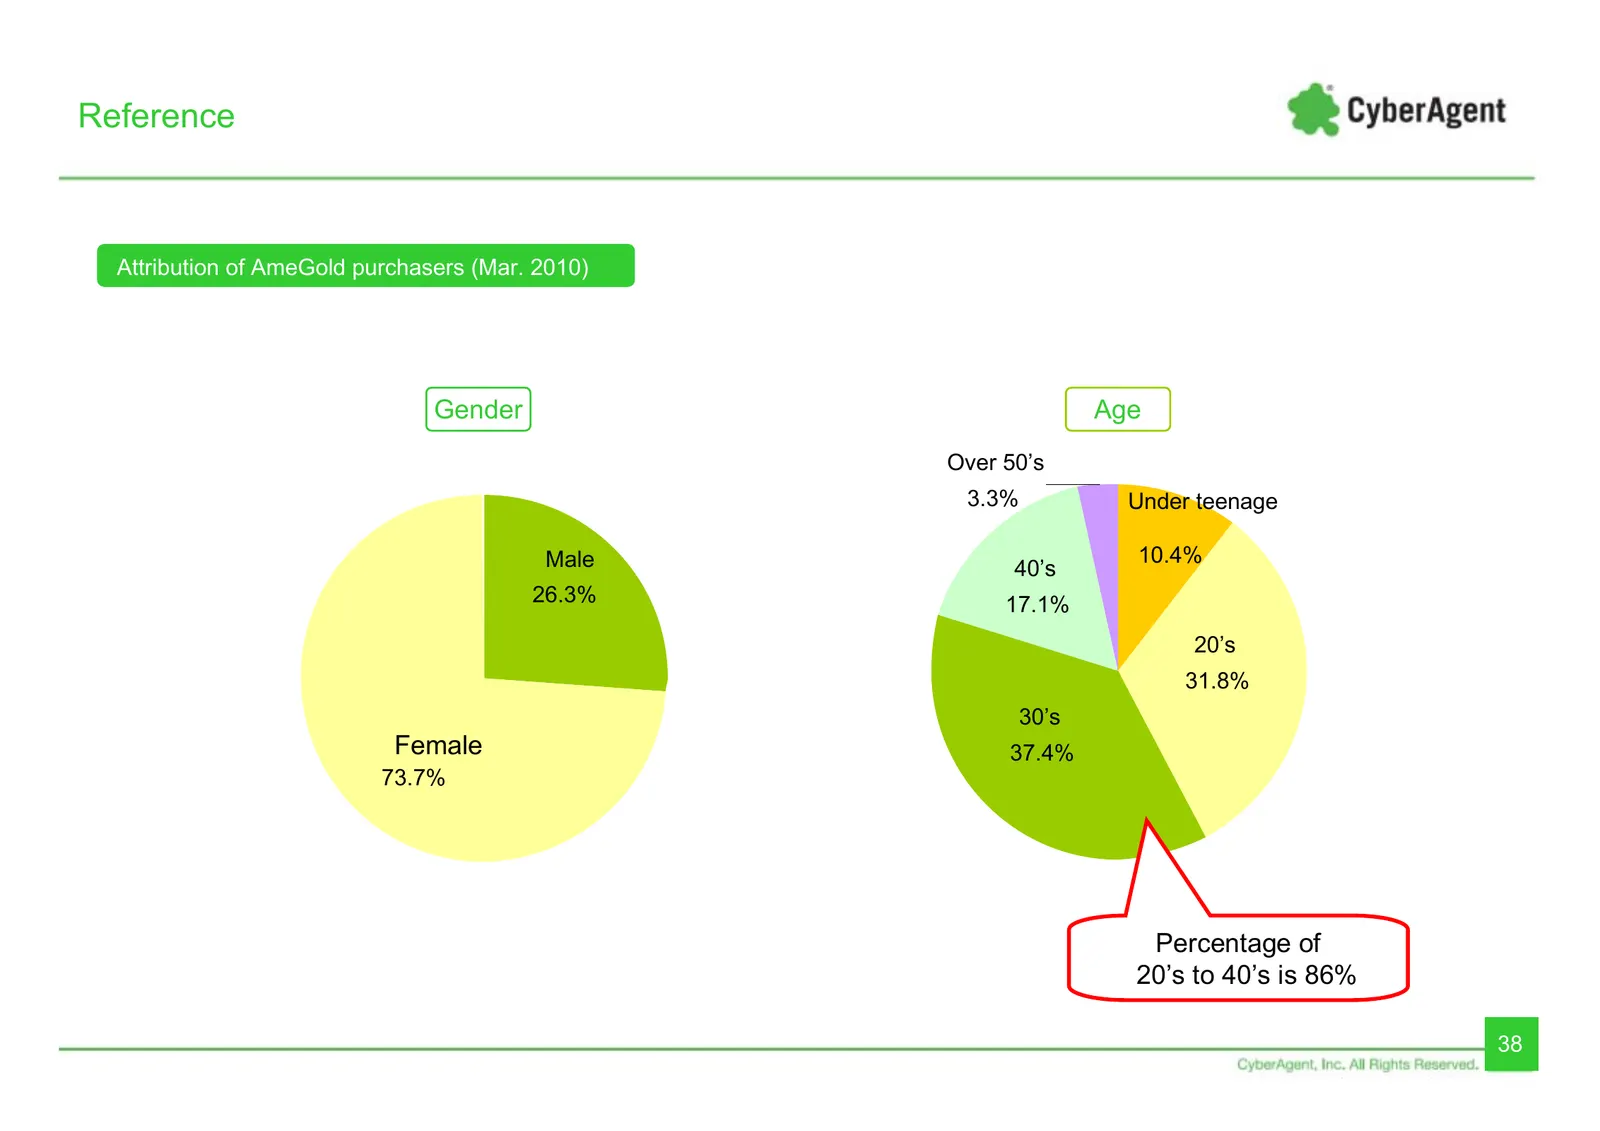
Reference Attribution of AmeGold purchasers (Mar. 2010) Gender Age Over 50’s 3.3% Under teenage Male 10.4% 40’s 26.3% 17.1% 20’s 31.8% 30’s Female 37.4% 73.7% Percentage of 20’s to 40’s is 86% 38
Slide 39: Ameba Pigg
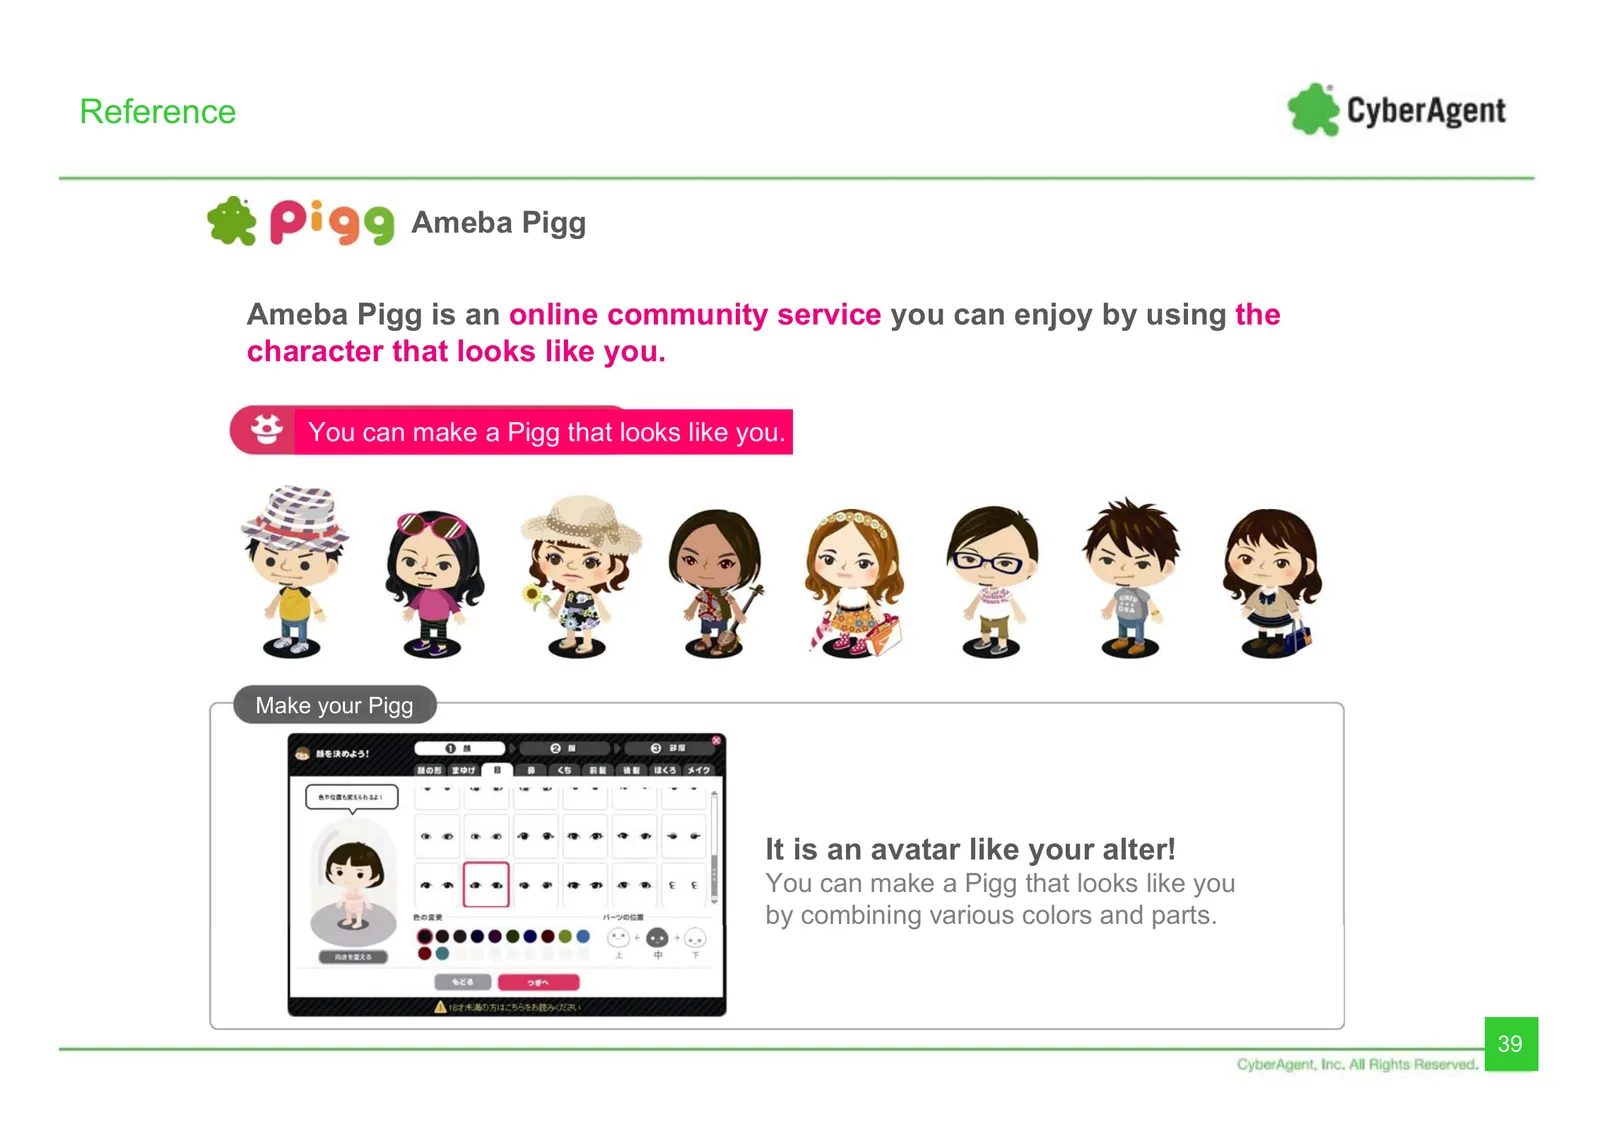
Reference Ameba Pigg Ameba Pigg is an online community service you can enjoy by using the character that looks like you. You can make a Pigg that looks like you. Make your Pigg It is an avatar like your alter! You can make a Pigg that looks like you by combining various colors and parts. 39
Slide 40: Dress-up and Room rearrangement
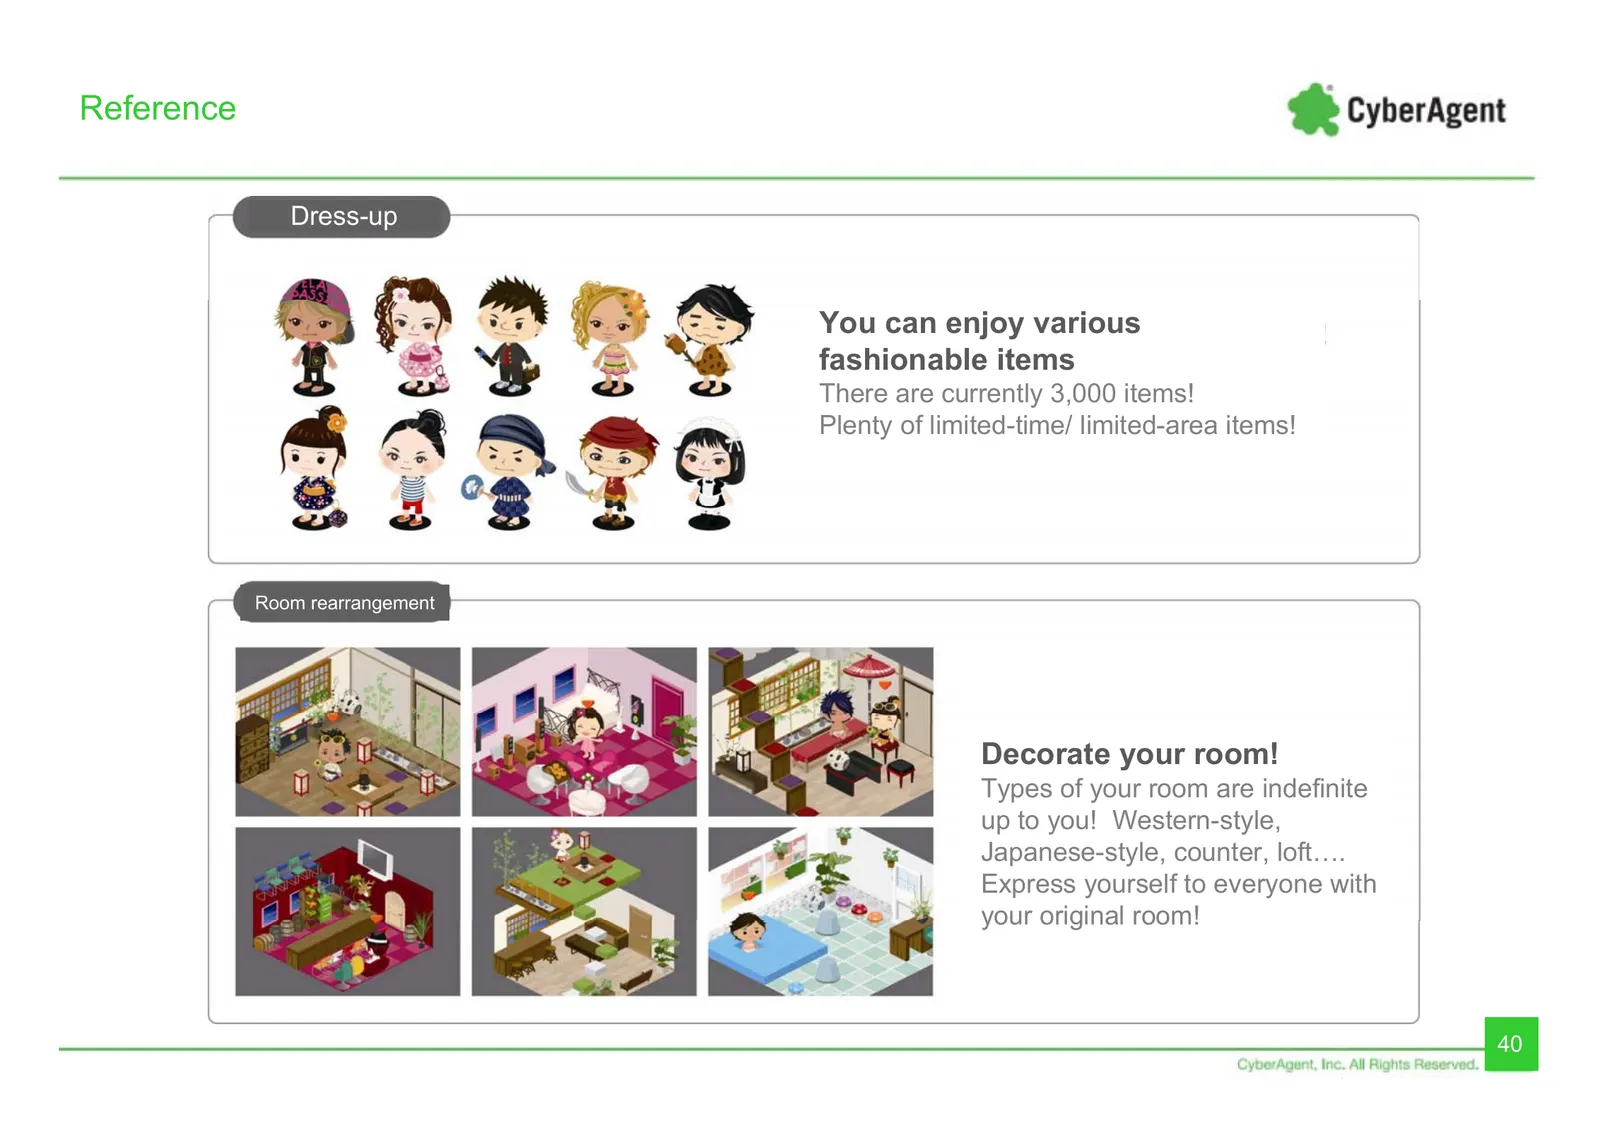
Reference Dress-up You can enjoy various fashionable items There are currently 3,000 items! Plenty of limited-time/ limited-area items! Room rearrangement Decorate your room! Types of your room are indefinite up to you! Western-style, Japanese-style, counter, loft…. Express yourself to everyone with
Slide 41: Going-out
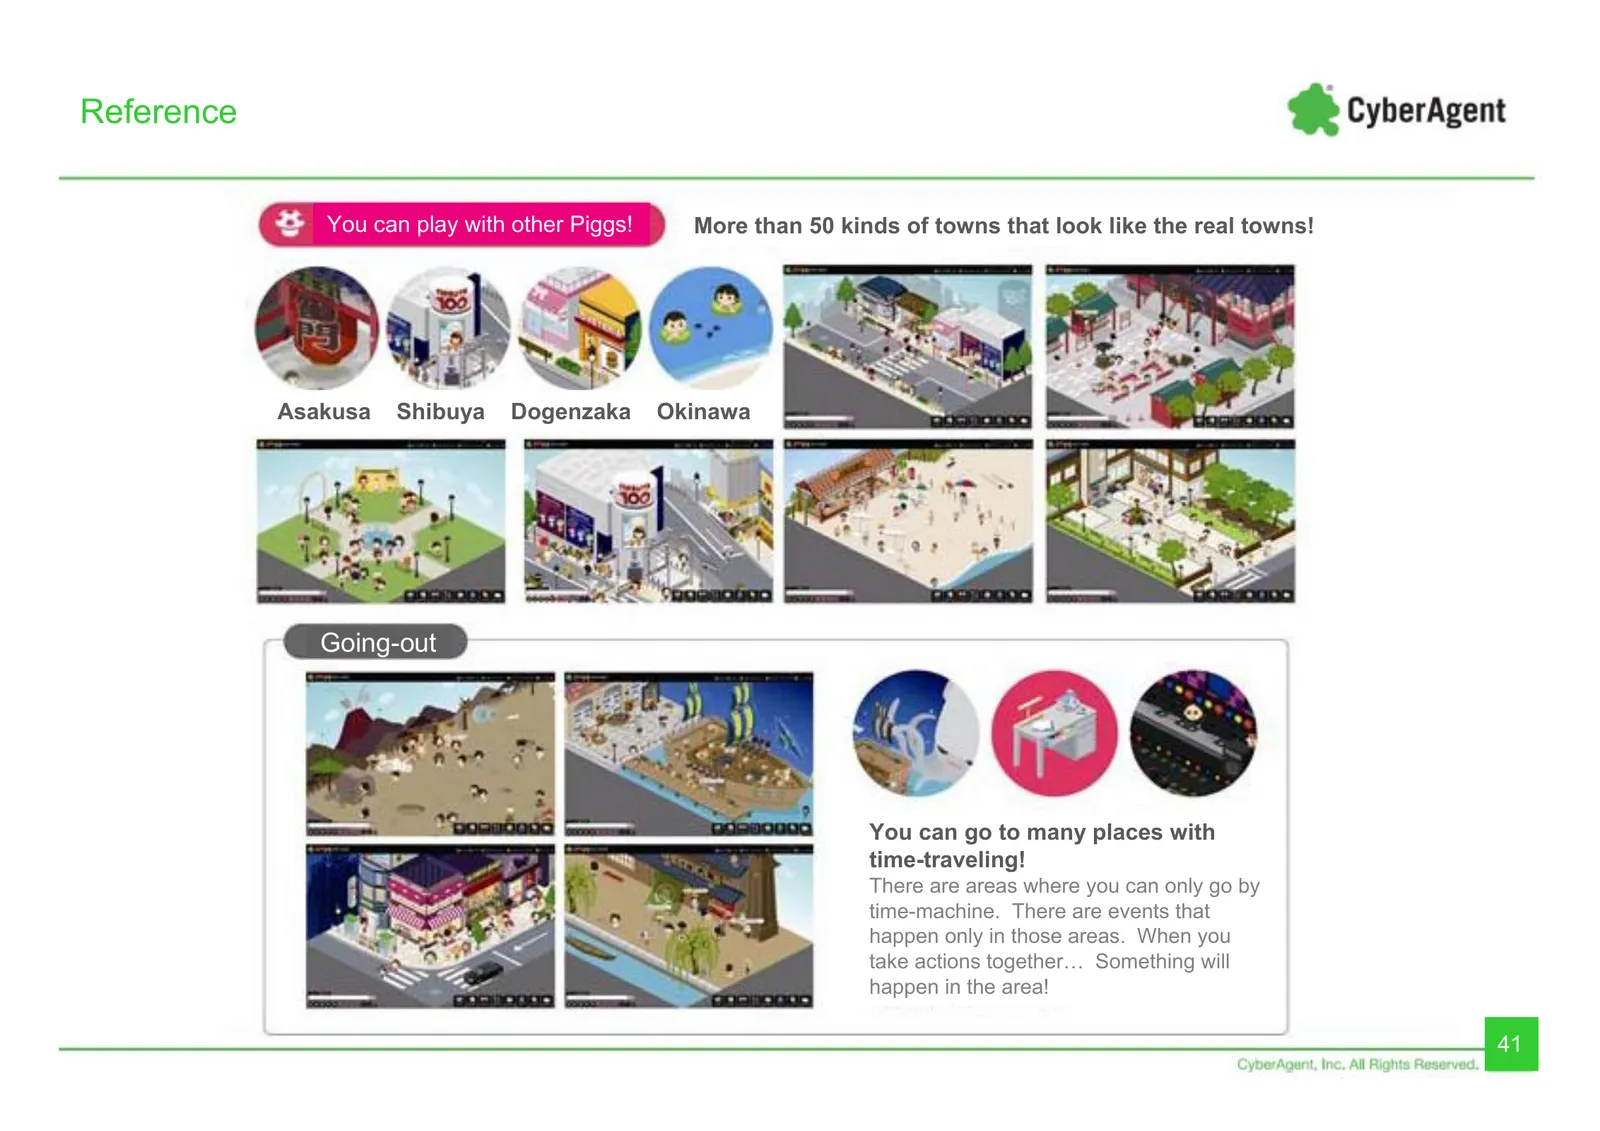
Reference You can play with other Piggs! More than 50 kinds of towns that look like the real towns! Asakusa Shibuya Dogenzaka Okinawa Going-out You can go to many places with time-traveling! There are areas where you can only go by time-machine. There are events that happen only in those areas. When
Slide 42: Pigg-Tomo (friends)
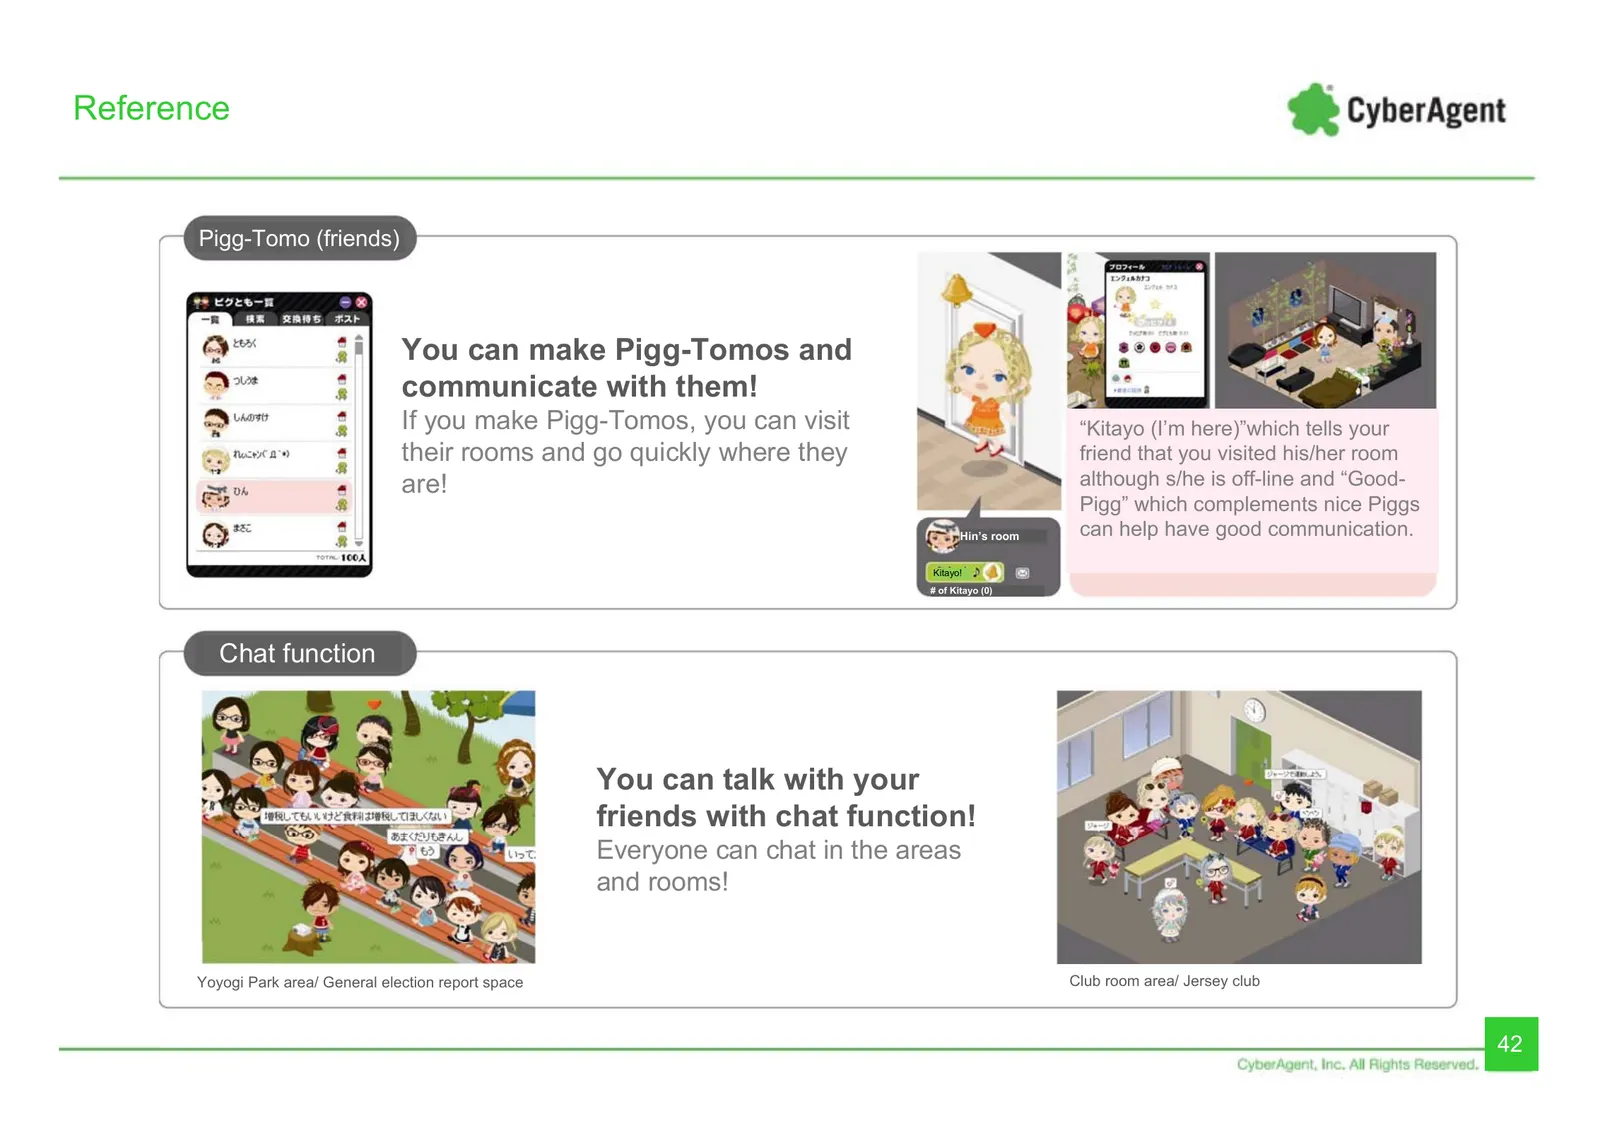
Reference Pigg-Tomo (friends) You can make Pigg-Tomos and communicate with them! If you make Pigg-Tomos, you can visit “Kitayo (I’m here)”which tells your their rooms and go quickly where they friend that you visited his/her room are! although s/he is off-line and “Good- Pigg” which complements nice
Slide 43: Actions and Camera
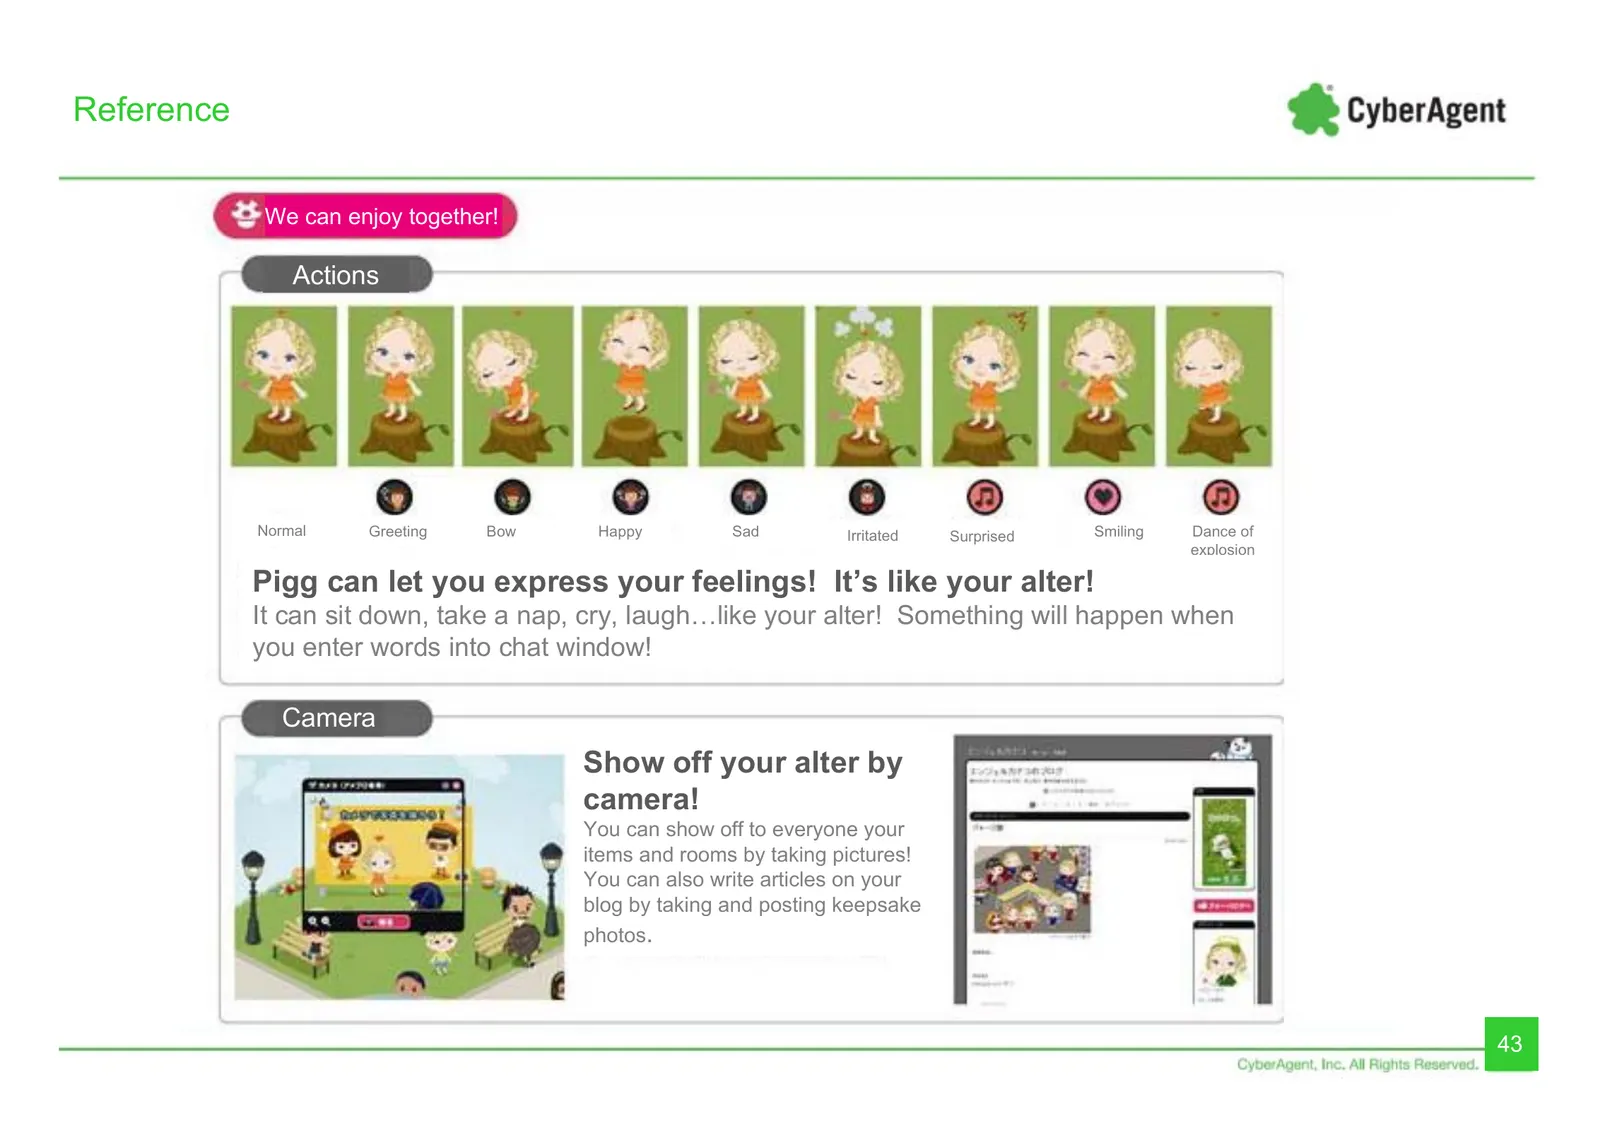
Reference We can enjoy together! Actions Normal Greeting Bow Happy Sad Irritated Surprised Smiling Dance of explosion Pigg can let you express your feelings! It’s like your alter! It can sit down, take a nap, cry, laugh…like your alter! Something will happen when you enter words into chat window! Ca
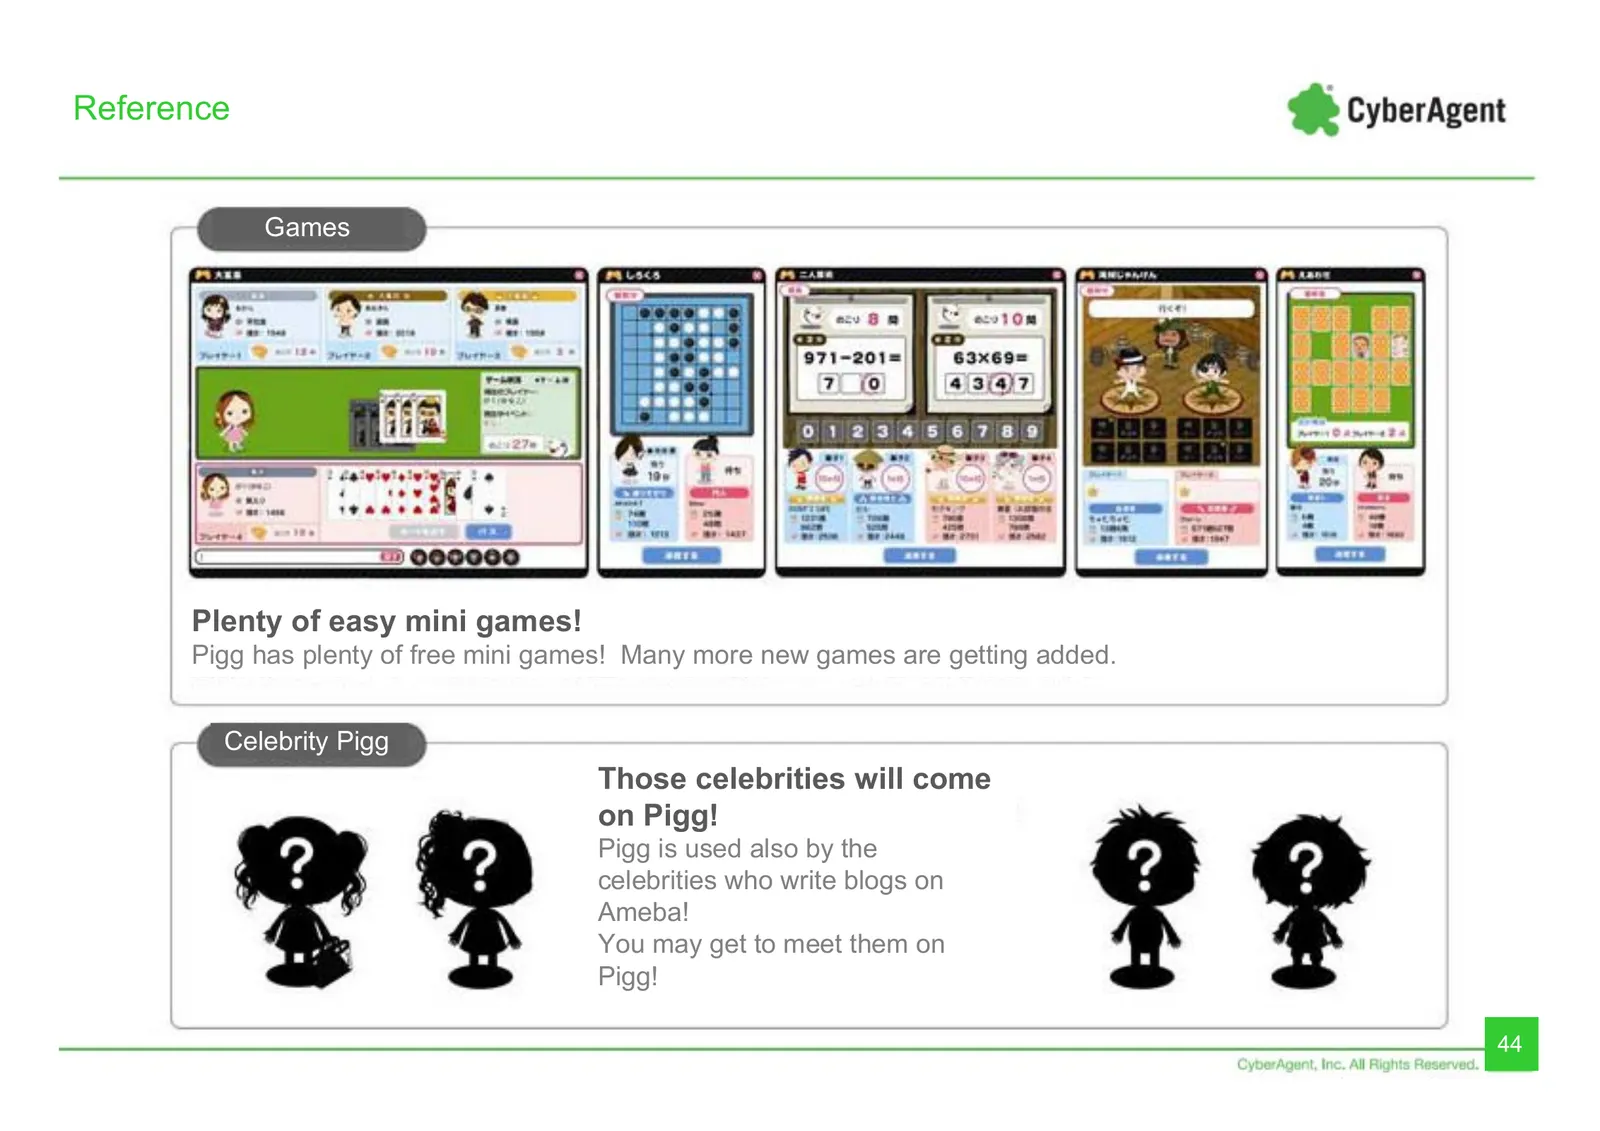
Slide 44: Games and Celebrity Pigg
Reference Games Plenty of easy mini games! Pigg has plenty of free mini games! Many more new games are getting added. Celebrity Pigg Those celebrities will come on Pigg! Pigg is used also by the celebrities who write blogs on Ameba! You may get to meet them on Pigg! 44
Source: Internet Archive copy of ir.cyberagent.co.jp
More decks from CyberAgent Incorporated
 FY2026 Earnings Presentation59 slides · Nov 16, 2026
 FY2026 Earnings Presentation60 slides · Nov 12, 2026
 FY2026 Earnings Presentation58 slides · Nov 11, 2026
 Investor Presentation (August 2026)79 slides · Aug 7, 2026
 Q3 2026 Earnings Presentation40 slides · Aug 7, 2026
 Q2 2026 Earnings Presentation39 slides · May 13, 2026