Railamerica — Q4 2009 Earnings Presentation
26 slides from Railamerica's earnings presentation, Feb 25, 2010
Slide 1: RailAmerica, Inc. Fourth Quarter 2009 Earnings Conference Call
RailAmerica, Inc. Fourth Quarter 2009 Earnings Conference Call February 25, 2010
Slide 2: Forward-Looking Statements
2 Certain items in this presentation and other information we provide from time to time may constitute forward-looking statements within the meaning of the Private Securities Litigation Reform Act of 1995 including, but not necessarily limited to, statements relating to future events and financial p
Slide 3: Executive Summary
3 Executive Summary John Giles, President and Chief Executive Officer
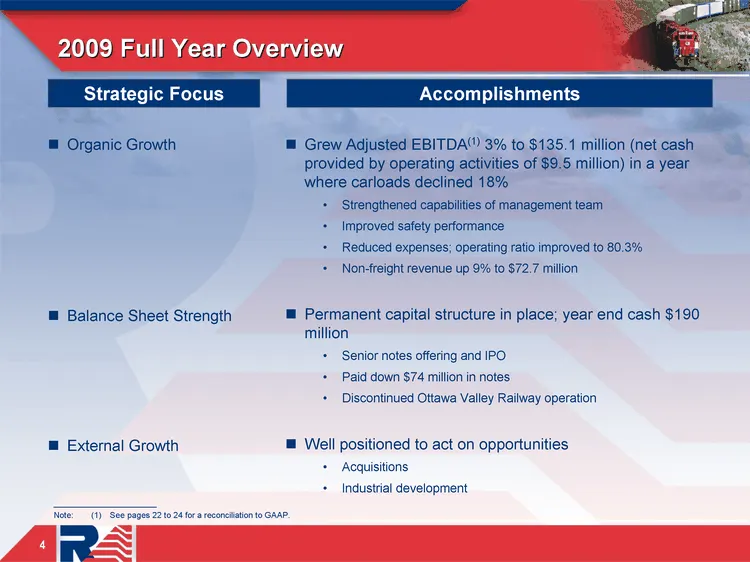
Slide 4: 2009 Full Year Overview
2009 Full Year Overview 4 Strategic Focus Accomplishments Organic Growth Balance Sheet Strength External Growth Grew Adjusted EBITDA(1) 3% to $135.1 million (net cash provided by operating activities of $9.5 million) in a year where carloads declined 18% Strengthened capabilities of management team
Slide 5: Fourth Quarter 2009 Highlights
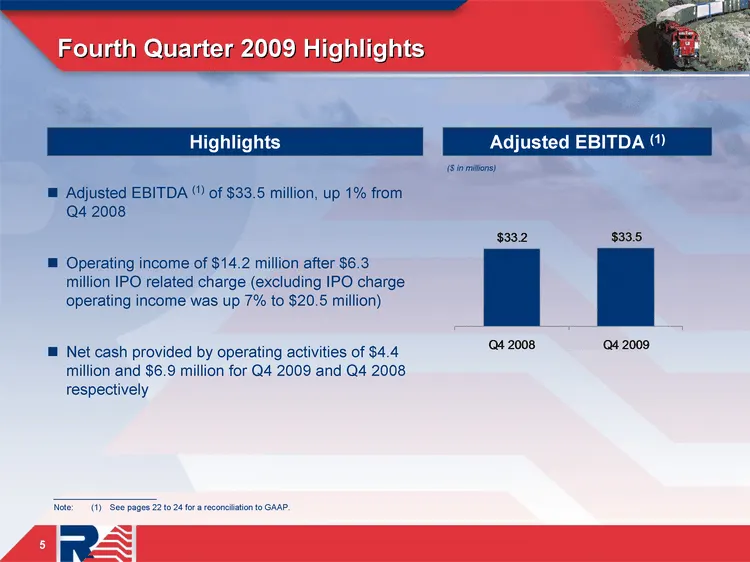
Fourth Quarter 2009 Highlights Adjusted EBITDA (1) of $33.5 million, up 1% from Q4 2008 Operating income of $14.2 million after $6.3 million IPO related charge (excluding IPO charge operating income was up 7% to $20.5 million) Net cash provided by operating activities of $4.4 million and $6.9 millio
Slide 6: Fourth Quarter 2009 Revenue
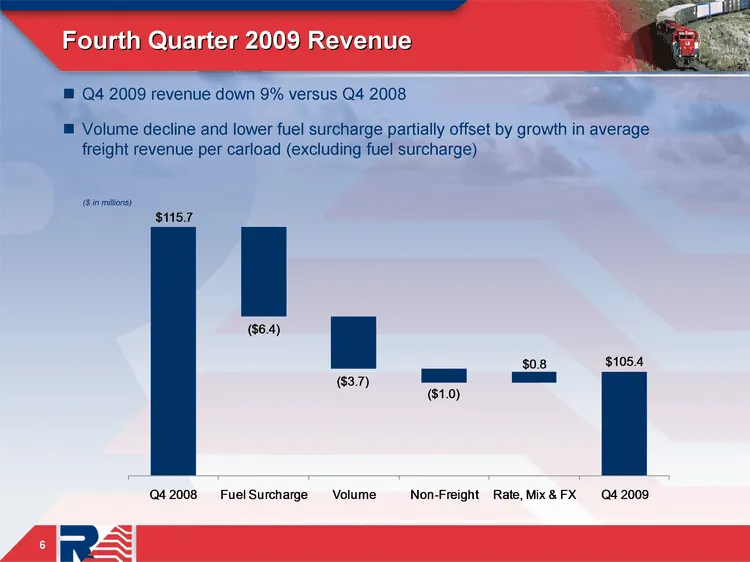
Fourth Quarter 2009 Revenue 6 Q4 2009 revenue down 9% versus Q4 2008 Volume decline and lower fuel surcharge partially offset by growth in average freight revenue per carload (excluding fuel surcharge) ($ in millions)
Slide 7: Fourth Quarter & Full Year 2009 Carloads
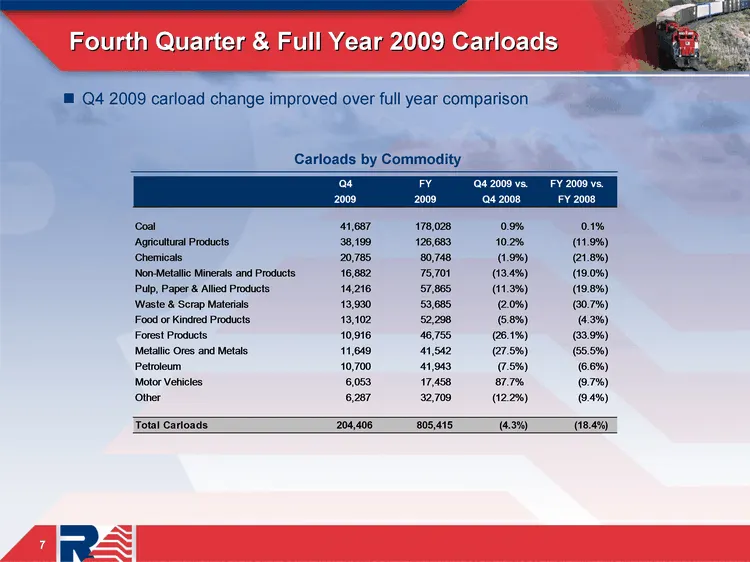
7 Fourth Quarter & Full Year 2009 Carloads 7 Carloads by Commodity Q4 2009 carload change improved over full year comparison
Slide 8: Positive core pricing offset by mix
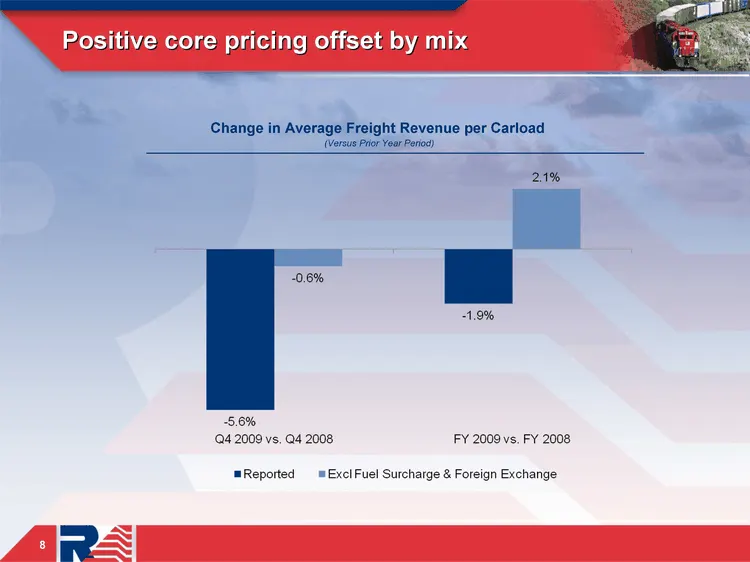
Positive core pricing offset by mix 8 Change in Average Freight Revenue per Carload (Versus Prior Year Period)
Slide 9: Fourth Quarter & Full Year 2009 Non-Freight Revenue
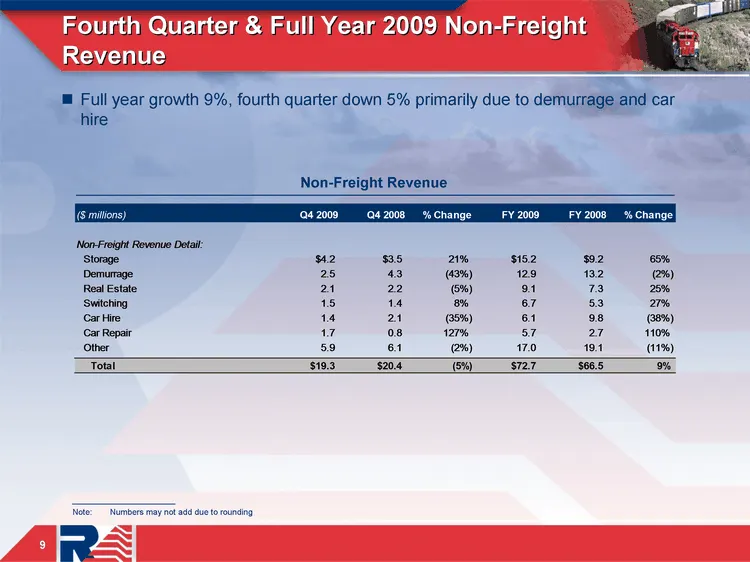
Fourth Quarter & Full Year 2009 Non-Freight Revenue 9 Non-Freight Revenue Full year growth 9%, fourth quarter down 5% primarily due to demurrage and car hire ______________________ Note: Numbers may not add due to rounding
Slide 10: Continued progress on cost reductions
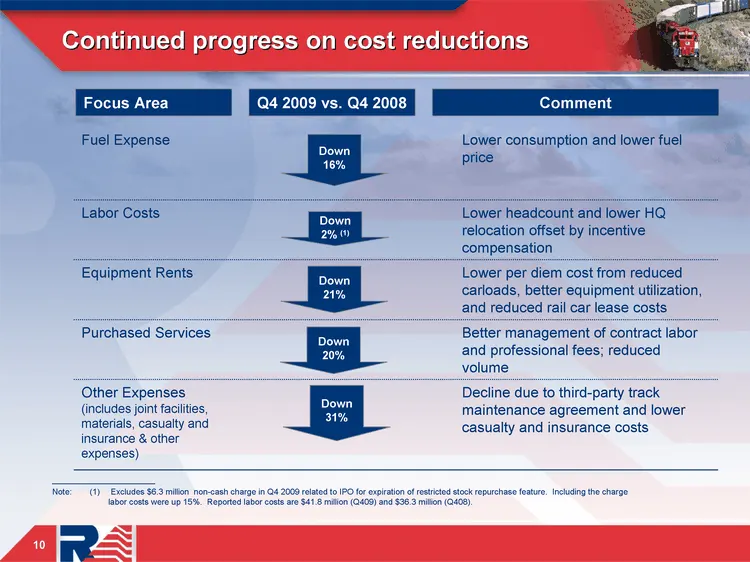
Continued progress on cost reductions 10 Fuel Expense Lower consumption and lower fuel price Labor Costs Lower headcount and lower HQ relocation offset by incentive compensation Equipment Rents Lower per diem cost from reduced carloads, better equipment utilization, and reduced rail car lease costs
Slide 11: Continuously Improving Safety Performance
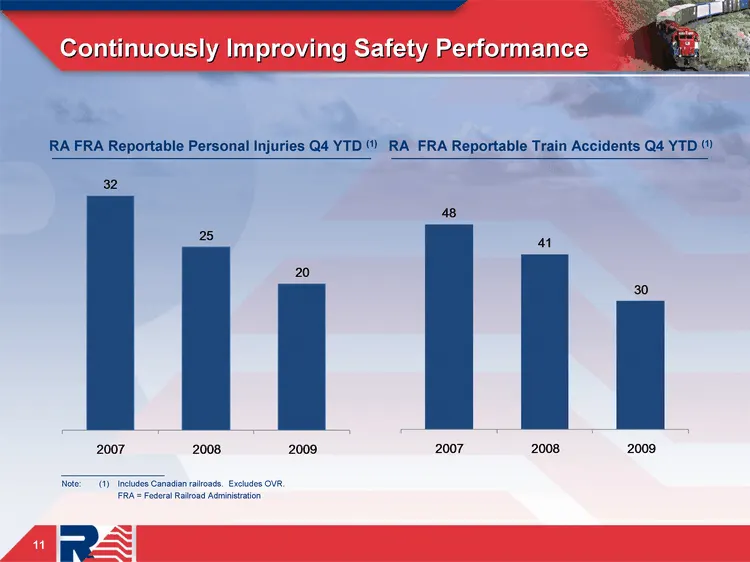
Continuously Improving Safety Performance 11 RA FRA Reportable Personal Injuries Q4 YTD (1) RA FRA Reportable Train Accidents Q4 YTD (1) ______________________ Note: (1) Includes Canadian railroads. Excludes OVR. FRA = Federal Railroad Administration
Slide 12: Fourth Quarter 2009 Financial Review
12 Fourth Quarter 2009 Financial Review Clyde Preslar, Chief Financial Officer
Slide 13: Fourth Quarter 2009 Results Compared to Prior Year
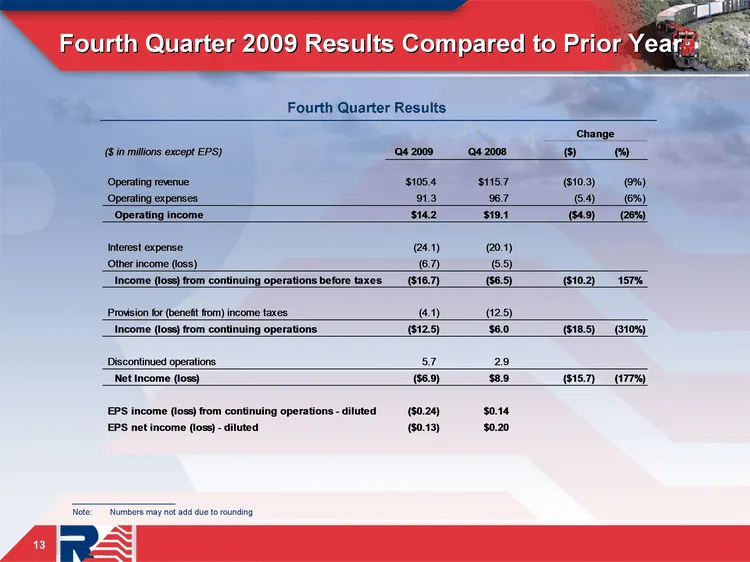
13 Fourth Quarter 2009 Results Compared to Prior Year 13 Fourth Quarter Results ______________________ Note: Numbers may not add due to rounding
Slide 14: Fourth Quarter 2009 Selected Items
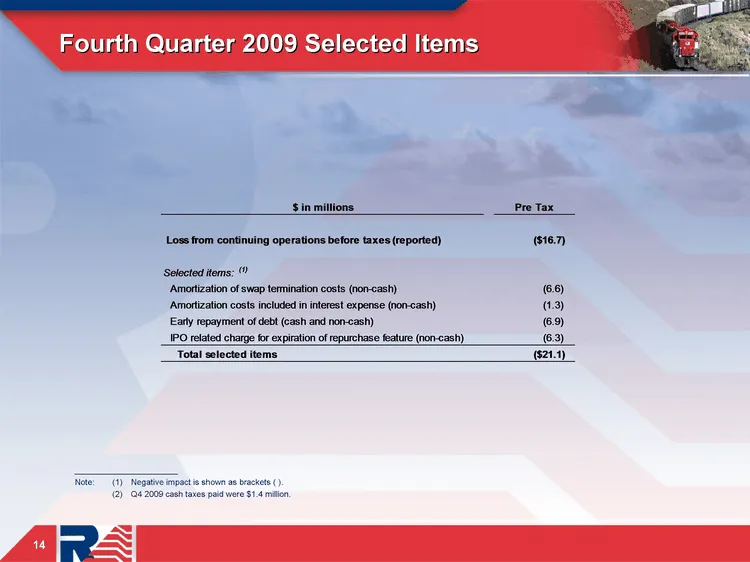
14 Fourth Quarter 2009 Selected Items 14 ______________________ Note: (1) Negative impact is shown as brackets ( ). (2) Q4 2009 cash taxes paid were $1.4 million.
Slide 15: Fourth Quarter 2009 Detailed Results Compared to Prior Year
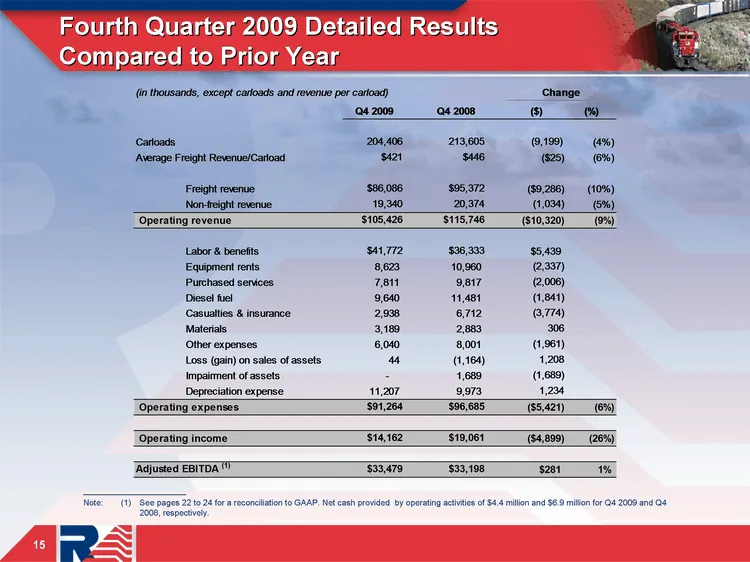
15 15 Fourth Quarter 2009 Detailed Results Compared to Prior Year ______________________ Note: (1) See pages 22 to 24 for a reconciliation to GAAP. Net cash provided by operating activities of $4.4 million and $6.9 million for Q4 2009 and Q4 2008, respectively.
Slide 16: Capital Expenditures
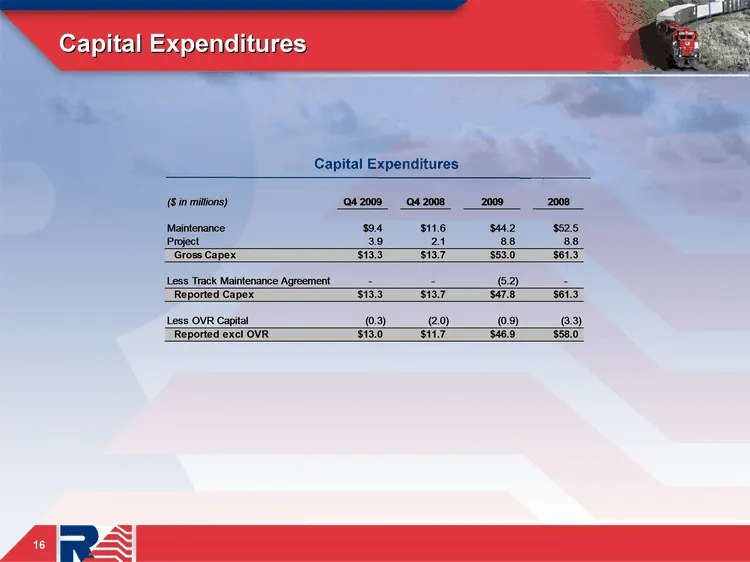
16 Capital Expenditures 16 Capital Expenditures
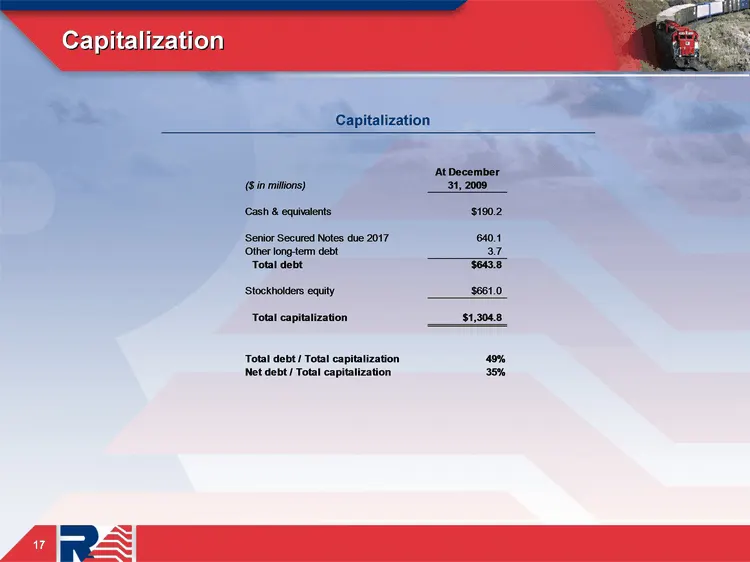
Slide 17: Capitalization
Capitalization 17 Capitalization
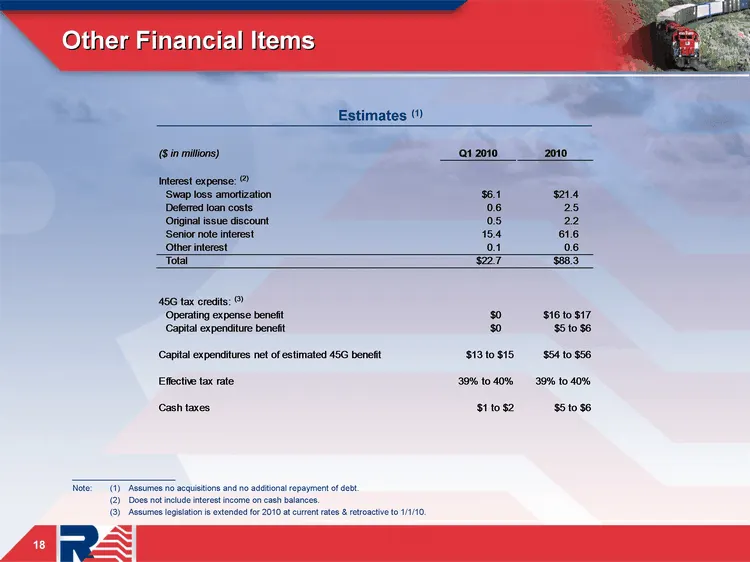
Slide 18: Other Financial Items Estimates
Other Financial Items 18 Estimates (1) ______________________ Note: (1) Assumes no acquisitions and no additional repayment of debt. (2) Does not include interest income on cash balances. (3) Assumes legislation is extended for 2010 at current rates & retroactive to 1/1/10.
Slide 19: In Conclusion
19 In Conclusion John Giles, President and Chief Executive Officer
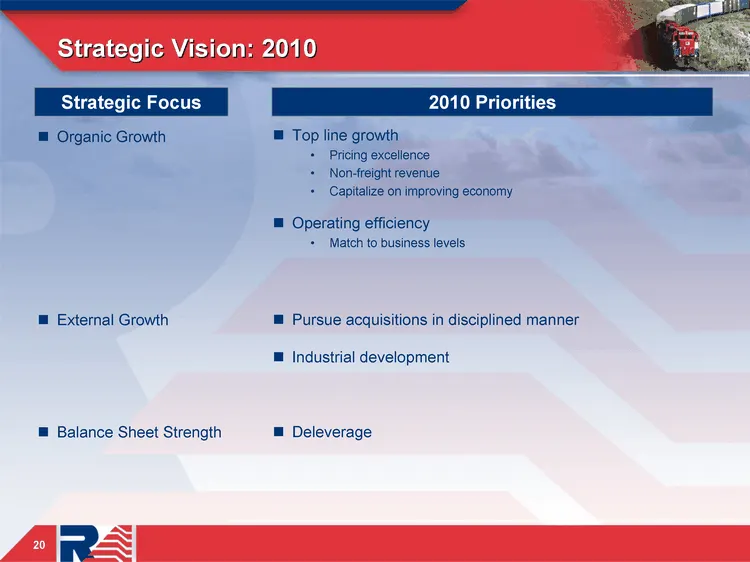
Slide 20: Strategic Vision: 2010
Strategic Vision: 2010 20 Strategic Focus 2010 Priorities Organic Growth External Growth Balance Sheet Strength Top line growth Pricing excellence Non-freight revenue Capitalize on improving economy Operating efficiency Match to business levels Pursue acquisitions in disciplined manner Industrial de
Slide 21: Appendix
21 Appendix
Slide 22: Adjusted EBITDA Reconciliation to GAAP
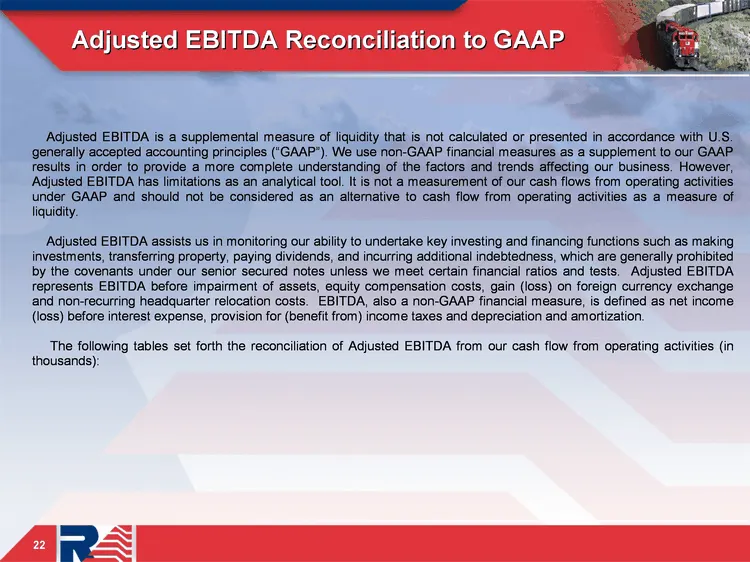
22 Adjusted EBITDA Reconciliation to GAAP 22
Slide 23: Adjusted EBITDA Reconciliation to GAAP (Continued)
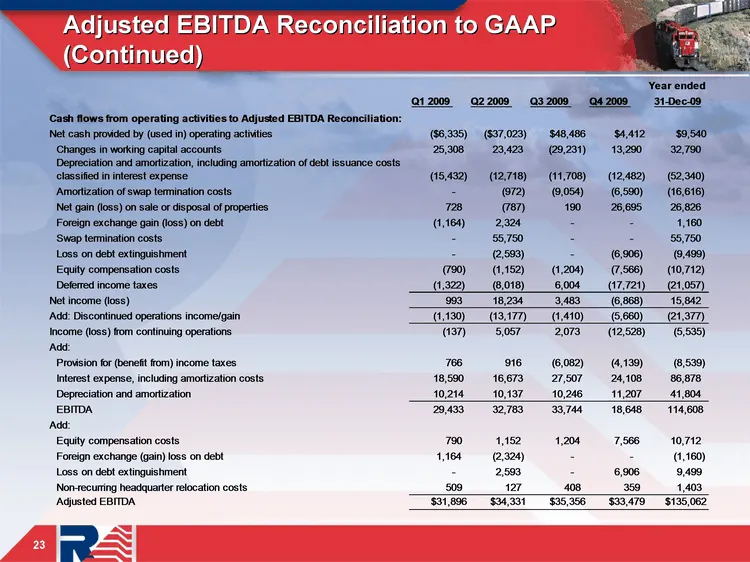
23 Adjusted EBITDA Reconciliation to GAAP (Continued) 23
Slide 24: Adjusted EBITDA Reconciliation to GAAP (Continued)
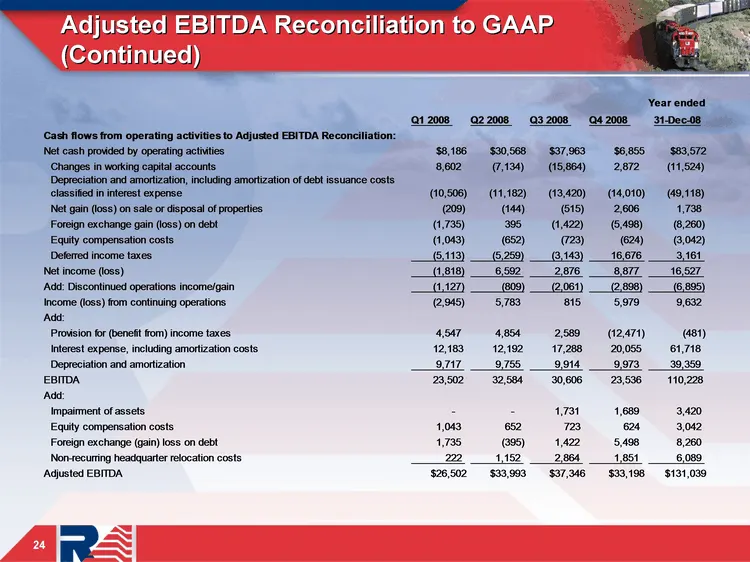
24 Adjusted EBITDA Reconciliation to GAAP (Continued) 24
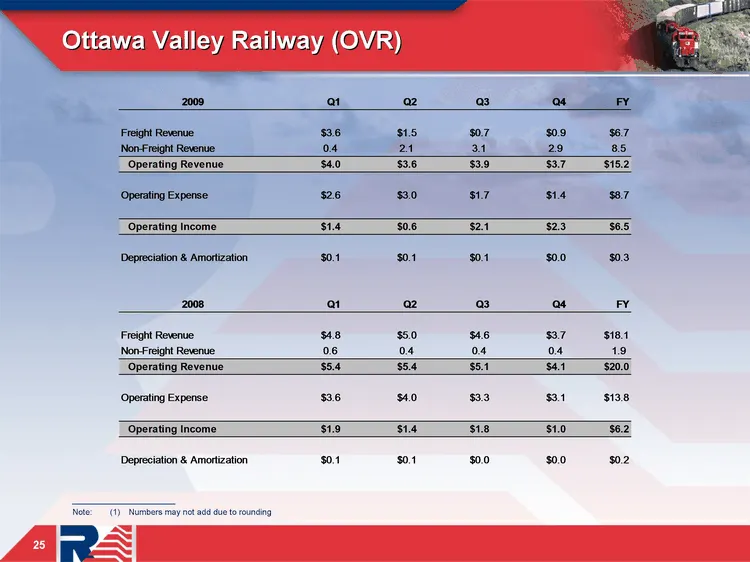
Slide 25: Ottawa Valley Railway (OVR)
Ottawa Valley Railway (OVR) 25 ______________________ Note: (1) Numbers may not add due to rounding
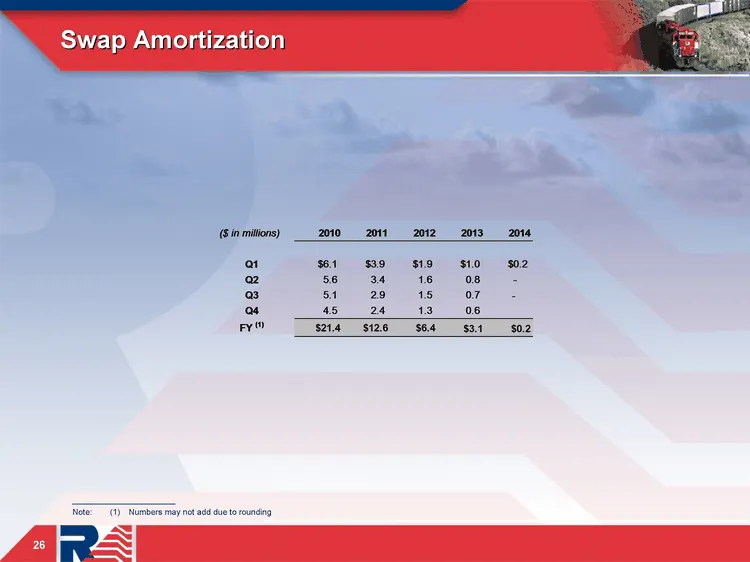
Slide 26: Swap Amortization
Swap Amortization ______________________ Note: (1) Numbers may not add due to rounding 26
Source: SEC EDGAR · 8-K filed Feb 25, 2010
More decks from Railamerica Inc
 Q2 2012 Earnings Presentation25 slides · Jul 25, 2012
 Q1 2012 Earnings Presentation29 slides · Apr 26, 2012
 Q4 2011 Earnings Presentation33 slides · Feb 9, 2012
 Q3 2011 Earnings Presentation28 slides · Oct 26, 2011
 Q2 2011 Earnings Presentation27 slides · Jul 28, 2011
 Q1 2011 Earnings Presentation28 slides · Apr 28, 2011