Somerset Hills Bancorp — Shareholder Meeting (April 2009)
30 slides from Somerset Hills Bancorp's shareholder meeting presentation, Apr 21, 2009

Slide 1: Annual Meeting April 22, 2009 Welcome
Annual Meeting April 22, 2009 Welcome To
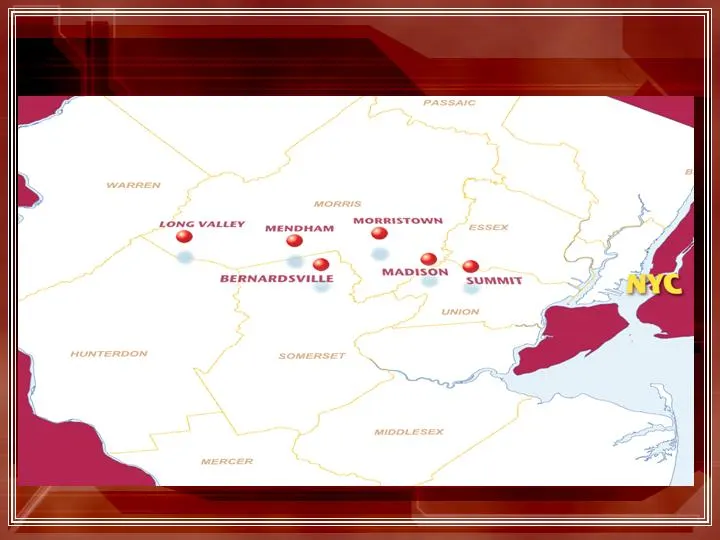
Slide 2: . e pal macioee
. e pal 2 macioee eepiamoavias Rael
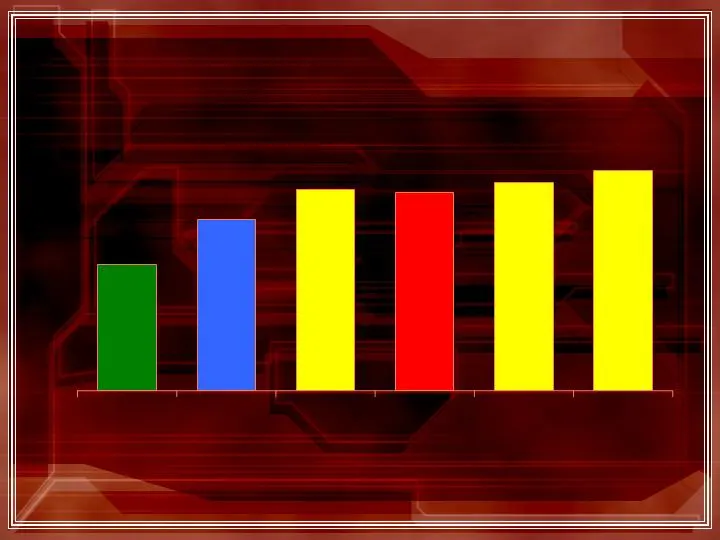
Slide 3: Total Assets
Total Assets $181,876 $245,926 $289,428 $285,470 $299,663 $316,418 Dec 31 2004 Dec 31 2005 Dec 31 2006 Dec 31 2007 Dec 31 2008 Mar 31 2009 35% Increase 7% Increase 1% Decrease ( in thousands) 3 18% Increase 6% Increase 5% Increase

Slide 4: Net Income
Net Income Year Net Income Change From Prior Year 2004 $1,359 + 16% 2005 $2,115 * + 56% 2006 $2,198 + 4% 2007 $382 ** - 83% 2008 $ 1,566 + 310 % *Includes the benefit of a one time $449,000 reversal of the valuation allowance for taxes ** Includes a one time $1,200,000 write off of goodwill and a $8

Slide 5: Quarterly Net Income
Quarterly Net Income 2005 2006 2007 2008 2009 1 st Qtr. $ 262 $ 475 $520 $444 $ 619 *** 2 nd Qtr. 345 485 536 367 3 rd Qtr. 457 573 504 425 4 th Qtr. 1,051* 665 (1,178)** 330 * Includes a benefit of a one time $449,000 reversal of the valuation allowance for taxes ** Includes a one time $1,200,000 w
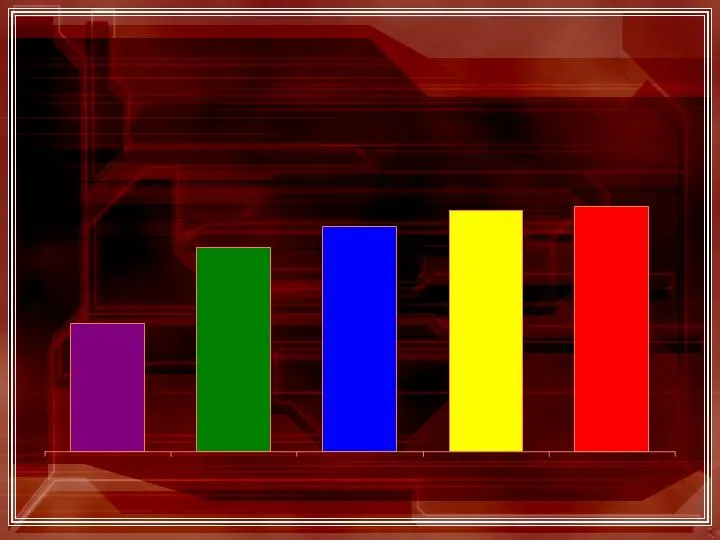
Slide 6: Loan Growth
Loan Growth $108,355 $172,487 $190,479 $204,402 $207,344 Mar 31 2004 Mar 31 2006 Mar 31 2007 Mar 31 2008 Mar 31 2009 20% Increase 31% Increase 10% Increase 1% Increase ( in thousands) 6 7% Increase

Slide 7: Loan Mix
Loan Mix Consumer 24% Mortgage 5% Commercial 71% March 31, 2009 7

Slide 8: Non performing loans
Non performing loans 0% 0 12/31/2004 0% 0 12/31/2005 .15% 282 12/31/2006 1.46% 3,036 12/31/2007 .65% 1,365 12/31/2008 .06% % total loans $000’s Date 127 03/31/2009 8

Slide 9: Net Interest Margin
Net Interest Margin 3.69% 1Q 2009 4.31% 2005 4.15% 2006 4.02% 2007 4.12% 2008 9
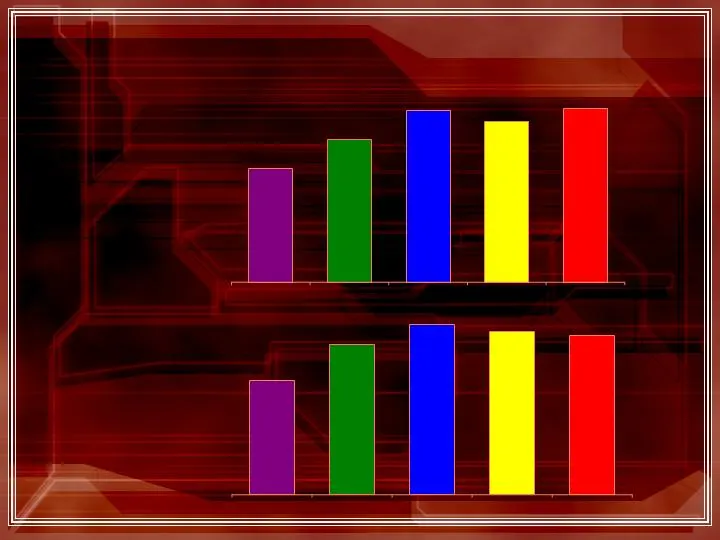
Slide 10: Deposits
$255,142 $239,203 $258,181 $211,939 $168,265 $143,862 $188,574 $214,572 $205,801 $200,322 Mar 2005 Mar 2006 Mar 2007 Mar 2008 Mar 2009 Deposits Total Deposits Core Deposits 14% Increase 20% Increase 15% Increase 8% Increase 22% Increase 3% Decrease ( in thousands) 10 26% Increase 31% Increase 4% Dec

Slide 11: Deposit Mix
Deposit Mix 90% $20,731 $141,846 $45,667 12/31/2005 86% $35,616 $163,590 $51,015 12/31/2006 87% $31,428 $159,462 $53,783 12/31/2007 77% $57,858 $140,945 $50,957 12/31/2008 78% $57,859 $147,303 $53,019 3/31/2009 Core Deposits as a % of Total Deposits Time Deposits NOW/Money Market/Savings Demand ( in
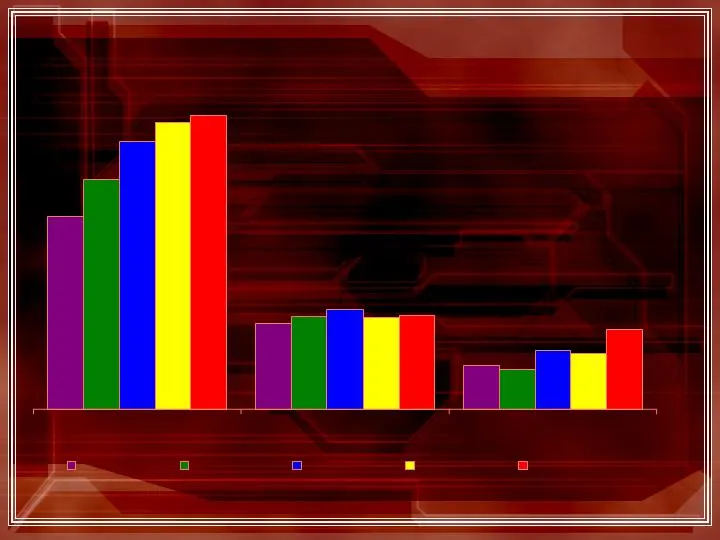
Slide 12: Number of Accounts
Number of Accounts 2,063 5,965 2,218 6,388 2,045 1,898 961 4,278 878 5,119 1,314 1,253 1,769 2,097 6,532 Transaction Accounts Savings and MMA Time Deposit Mar 31, 2005 Mar 31, 2006 Mar 31, 2007 Mar 31, 2008 Mar 31, 2009 24% Inc 20% Inc 17% Inc 2% Inc 13% Inc 9% Inc 8% Inc 3% Inc 7% Dec 9% Inc 50% In
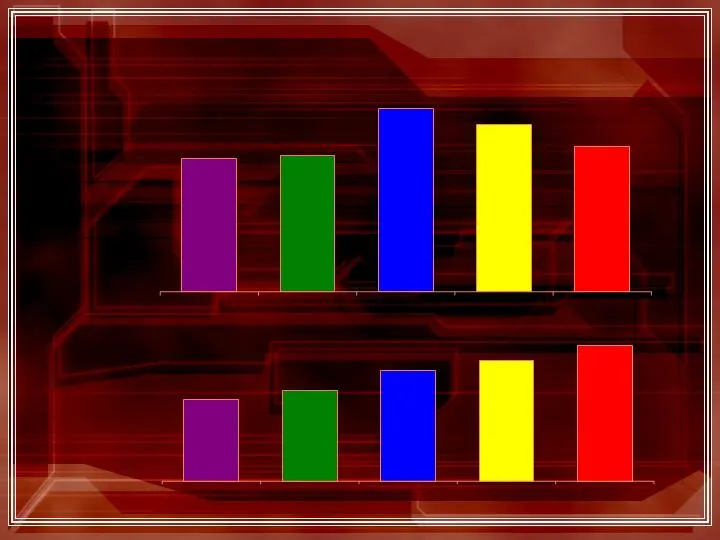
Slide 13: Paramount Checking
Paramount Checking $104,515 $95,499 $82,593 $77,737 $75,723 1,174 1,305 1,592 1,736 1,952 Mar 2005 Mar 2006 Mar 2007 Mar 2008 Mar 2009 Total Balances Number of Accounts 16% Increase 19% Increase 34% Increase 11% Increase 14% Decrease 12% Increase ( in thousands) 13 3% Increase 15% Increase 9% Decrea
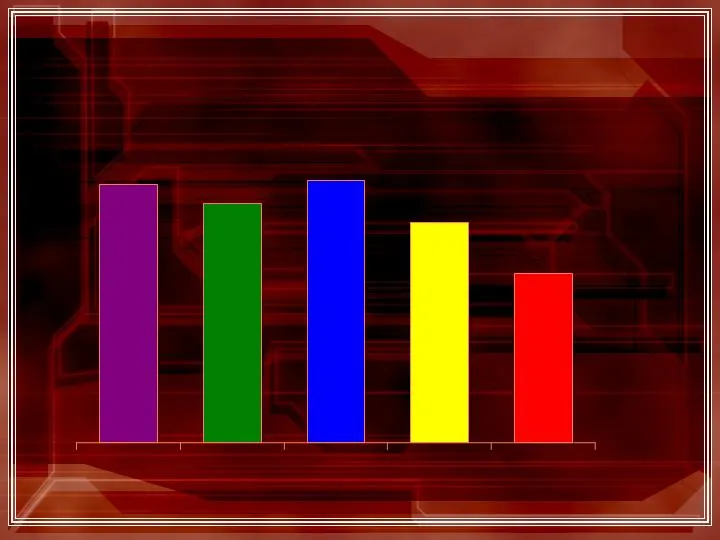
Slide 14: Paramount Checking - continued
Paramount Checking - continued Average Balance Per Account $65,650 $55,011 $42,312 $64,500 $59,569 Mar 2005 Mar 2006 Mar 2007 Mar 2008 Mar 2009 4% Increase 8% Decrease 10% Increase 23% Decrease 14 16% Decrease
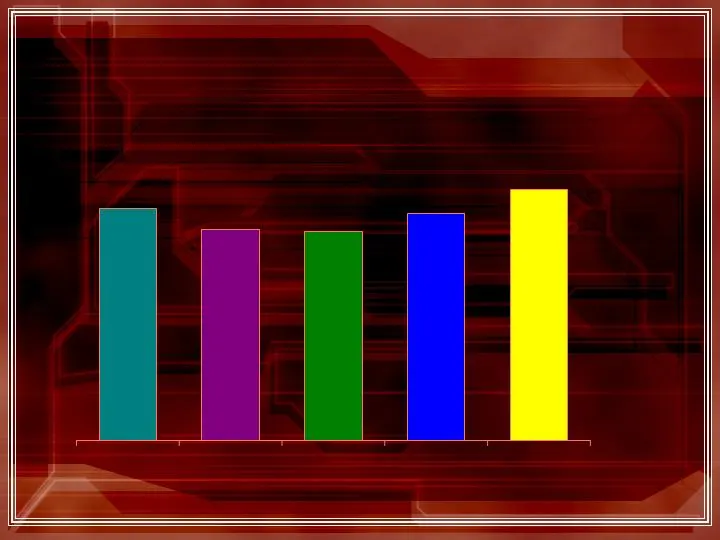
Slide 15: Escrow Ease
Escrow Ease $39,276 $35,625 $32,757 $33,132 $36,360 Dec 2005 Dec 2006 Dec 2007 Dec 2008 Mar 2009 Total Balances ( in thousands) 316% Increase 9% Decrease 1% Decrease 9% Increase 15 10% Increase
Slide 16: Escrow Ease - continued
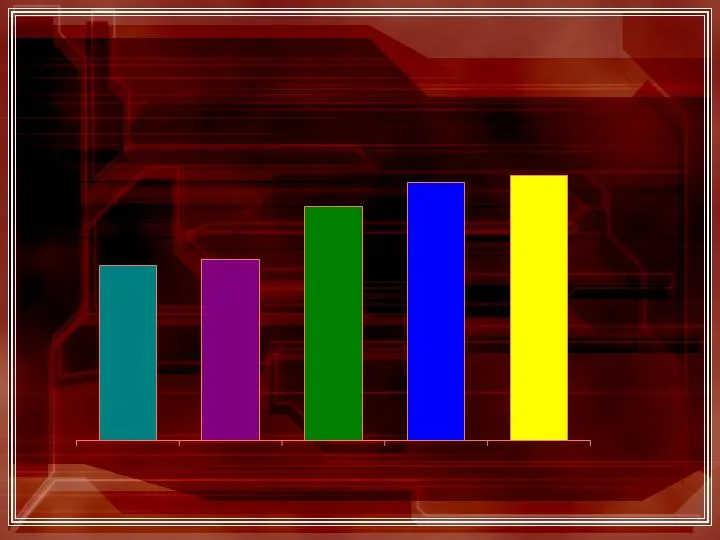
Escrow Ease - continued 1,663 1,100 1,133 1,472 1,623 Dec 2005 Dec 2006 Dec 2007 Dec 2008 Mar 2009 Number of Client Accounts 30% Increase 72% Increase 3% Increase 10% Increase 16 2% Increase

Slide 17: Transaction Activity
21,341 19,646 18,530 19,140 20,092 12,272 16,262 19,949 20,699 22,469 Mar 2005 Mar 2006 Mar 2007 Mar 2008 Mar 2009 Transaction Activity Teller Transactions Per Month ACH Transactions Per Month 8% Increase 5% Increase 34% Increase 33% Increase 6% Increase 23% Increase 6% Decrease 9% Increase 17 8% De

Slide 18: Capital Ratios – Holding Company
Capital Ratios – Holding Company December 31, 200 8 Amount Ratio Amount Ratio Total Capital (to risk-weighted assets) $ 39 , 579 15 . 83 % $ 25 , 001 > 10. 00% Tier I Capital (to risk-weighted assets) 36 , 760 14 . 70 15 , 001 > 6 .00 Tier I Capital (to average assets) 36 , 760 12 . 57 14 , 623 > 5

Slide 19: Capital Issued under TARP
Capital Issued under TARP On January 16, 2009 SOMH Issued “TARP Preferred” $7.4 million in capital proceeds to Holding Company 163,065 warrants to purchase common stock at $6.82 Reasons for Issuing Perception that only the strongest community banks would be approved Provided Bank with additional cap

Slide 20: Sullivan Financial Services, Inc.
Sullivan Financial Services, Inc. a subsidiary of Somerset Hills Bank Headquarters 100 Executive Drive, Suite 140 West Orange, NJ 07052 Phone: 973-325-5000 Fax: 973-736-7947 20

Slide 21: Sullivan Financial Services Products and Services
Sullivan Financial Services, Inc. Products and Services Conventional Mortgage Loans Fixed and Adjustable Rate Loans FHA/VA Loans Jumbo Mortgages 1st Time Buyer Programs Reverse Mortgages No Cost Refinances 21

Slide 22: Sullivan Financial Services Loan Volume
Sullivan Financial Services, Inc. Loan Volume 2005 2006 2007 2008 Q1 2009 Closings $311,273,000 $293,329,000 $232,705,000 $168,625,000 $44,028,000 Closings 1,091 1,132 781 428 116 22

Slide 23: Somerset Hills Wealth Management: For the Individual
Somerset Hills Wealth Management, LLC For the Individual: Financial Planning Investment Management Estate Review Life, Health & Long Term Care Insurance 23

Slide 24: Somerset Hills Wealth Management: For the Business Owner
Somerset Hills Wealth Management, LLC For the Business Owner: Business Succession Planning Buy-Sell & Key Person Agreements Retirement Plans & Group Insurance 24
Slide 25: Somerset Hills Wealth Management Pre-Tax Income
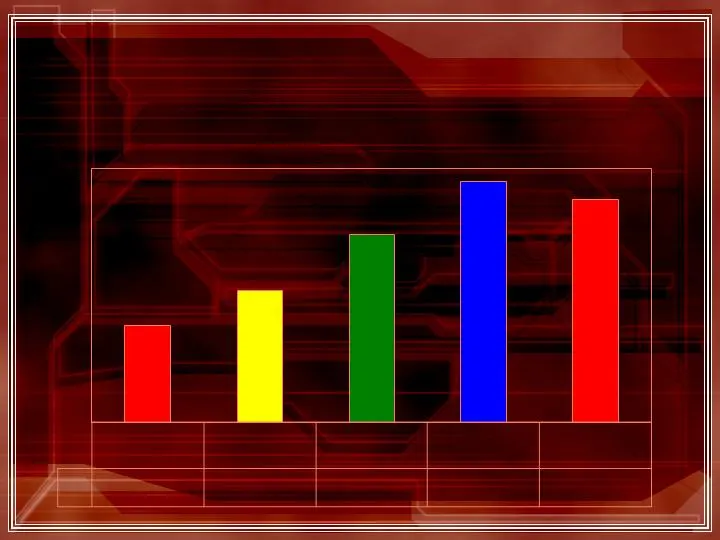
Somerset Hills Wealth Management, LLC Pre-Tax Income $38 $52 $74 $95 $88 2004 2005 2006 2007 2008 ( in thousands) 42% Increase 28% Increase 7% Decrease 25 37% Increase

Slide 26: Somerset Hills Title Company, LLC
Somerset Hills Title Company, LLC PROVIDING TITLE SERVICE IN CONNECTION WITH THE CLOSING OF REAL ESTATE TRANSACTIONS 2005 2006 2007 2008 Total Transactions 62 36 58 42 Amount of Closed Transactions $57 Million $55 Million $34 Million $22 Million Pre - Tax Income $64,000 $101,000 $45,000 $18,000 26

Slide 27: Looking at 2009
Looking at 2009 Realize on existing franchise Focus on credit quality and liquidity Cross Sell Opportunities Expense Management Re-price and retain CD customers from ’08 Continue to grow core deposits/number of customers 27
Slide 28: Updated in 2009
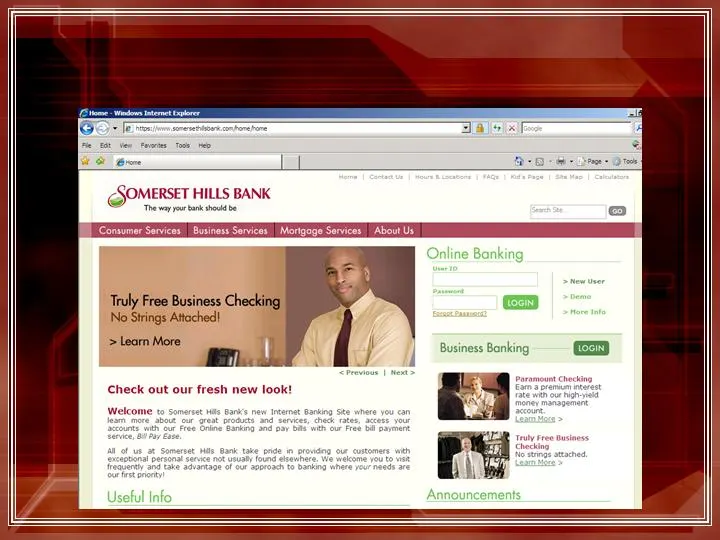
Updated in 2009 https://www.somersethillsbank.com 28
Slide 29: Continued Rollout in 2009
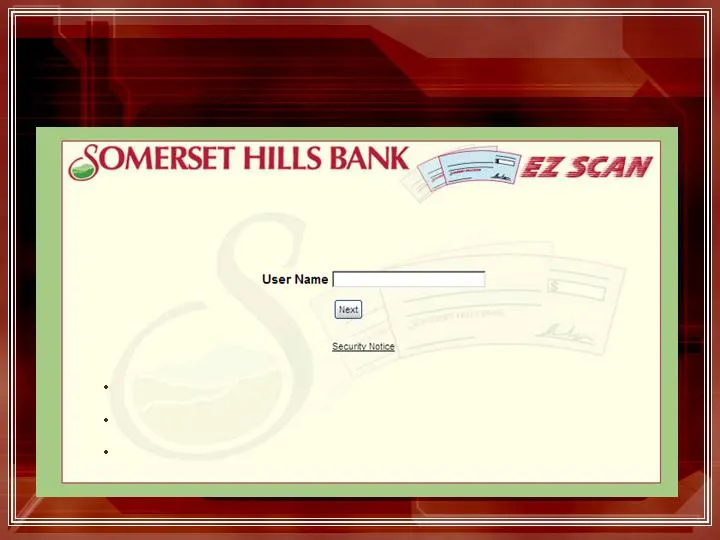
Continued Rollout in 2009 Remote Deposit Capture Product 29 Competitively necessary Opens new markets at minimal costs Immediate cost savings

Slide 30: $0.05 per quarter Cash Dividend
$0.05 per quarter Cash Dividend 30
Source: SEC EDGAR · 8-K filed Apr 21, 2009
More decks from Somerset Hills Bancorp
 Shareholder Meeting (May 2013)10 slides · May 8, 2013
 Merger or Acquisition (February 2013)32 slides · Feb 7, 2013
 Merger or Acquisition (January 2013)13 slides · Jan 29, 2013
 Shareholder Meeting (April 2012)25 slides · Apr 19, 2012
 Investor Presentation (November 2011)26 slides · Nov 1, 2011
 Shareholder Meeting (April 2011)29 slides · Apr 26, 2011