


BALTIMORE, Aug. 07, 2025 (GLOBE NEWSWIRE) -- MarketWise, Inc. (NASDAQ: MKTW) (“MarketWise” or the “Company”), a leading multi-brand digital subscription services platform that provides premium financial research, software, education, and tools for self-directed investors, today reported financial results for second quarter 2025.(1)
Second Quarter 2025 Highlights(1)(2)
Total net revenue was $80.0 million in the second quarter 2025(2)
Total Billings were $58.2 million in second quarter 2025, a year-over-year increase of 10% on an adjusted basis
Net income was $15.3 million in second quarter 2025
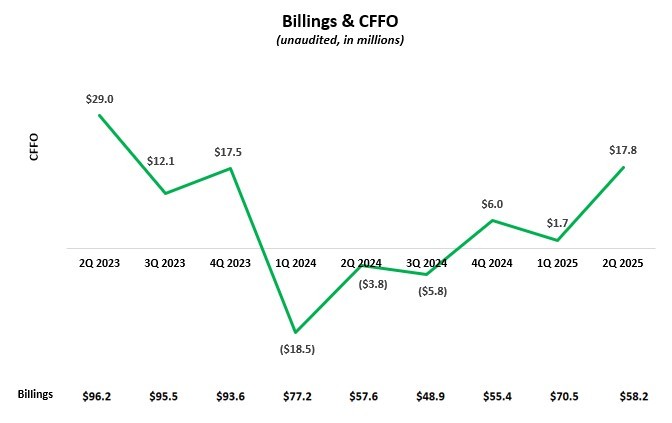
Cash from Operating Activities was $17.8 million in second quarter 2025, an improvement of $21.6 million compared to second quarter 2024
Cash and cash equivalents were $69.1 million as of June 30, 2025, and no debt outstanding
Announced on August 1, 2025 quarterly and special dividend totaling $0.40 per Class A share
(1) | The second quarter 2025 and 2024 quarterly results reported herein are unaudited. |
(2) | Net Revenue (a GAAP measure) represents Billings that are recognized over the term of the subscription, which can be multiple years. Billings are amounts invoiced to customers in the period and is thus indicative of the current operating environment and demand for our products. |
MarketWise CEO Dr. David Eifrig commented, “I am delighted by the results for the quarter as our teams continue to deliver against our strategic priorities of growth, efficiency, and new business. I see meaningful contributions from everywhere in the Company and could not be prouder of the dedication of our 400+ employees as we provide world-class financial research and tools to our millions of engaged subscribers.”
Eifrig continued, “The strength of our business model was displayed during the second quarter as the company generated Cash from Operating Activities of over $17 million and Adjusted CFFO Margins of over 30%. When we are executing well, our business is a cash generating machine, with virtually no CAPEX needed. And while our Billings were down a bit sequentially from the positive Q1 results, our Q2 Billings were up over 10% year over year, when adjusted to exclude the second quarter 2024 Billings of Legacy Research. Furthermore, Q3 is off to a good start with July Billings meaningfully exceeding the average monthly Billings for Q2.
“At a more detailed level, our average revenue per user, or ARPU, continues to be strong which evidences the value our customers see in our products and our ability to monetize our installed base. In addition to driving ARPU higher, we are also focused on increasing the number of paid subscribers. We are developing exciting initiatives to increase customer acquisition and improve engagement and retention.”
Eifrig concluded, “From a FY 2025 Guidance perspective, I am pleased to report that we are on track to achieve the FY 2025 Targets we communicated earlier this year. Lastly, our balance sheet remains strong with $69 million of cash, and no debt, enabling us to deliver on our capital allocation plans: rewarding our shareholders with an attractive yield, opportunistically buying back shares, and investing sensibly in our business.”
Our summary results and selected financial data are as follows:
(Unaudited, in millions, except per share data or otherwise noted) | 2Q 2024 | 3Q 2024 | 4Q 2024 | 1Q 2025 | 2Q 2025 | TTM 2Q 2025 | ||||||||||||||
Paid Subscribers (in thousands) | 645 | 592 | 506 | 473 | 394 | N/M | ||||||||||||||
Total net revenue | $ | 105.0 | $ | 97.2 | $ | 97.5 | $ | 83.5 | $ | 80.0 | $ | 358.1 | ||||||||
New "Marketing" Billings(1) | $ | 38.7 | $ | 32.3 | $ | 37.0 | $ | 51.3 | $ | 41.6 | $ | 162.3 | ||||||||
Net "Renewal" Billings(2) | $ | 17.1 | $ | 15.7 | $ | 16.0 | $ | 18.3 | $ | 15.4 | $ | 65.5 | ||||||||
Other Billings(3) | $ | 1.8 | $ | 0.9 | $ | 2.4 | $ | 0.8 | $ | 1.2 | $ | 5.2 | ||||||||
Total Billings | $ | 57.6 | $ | 48.9 | $ | 55.4 | $ | 70.5 | $ | 58.2 | $ | 232.9 | ||||||||
ARPU (in dollars) | $ | 456 | $ | 417 | $ | 394 | $ | 419 | $ | 474 | $ | 394 | ||||||||
Net income | $ | 21.2 | $ | 22.7 | $ | 26.4 | $ | 16.8 | $ | 15.3 | $ | 81.3 | ||||||||
CFFO | $ | (3.8 | ) | $ | (5.8 | ) | $ | 6.0 | $ | 1.7 | $ | 17.8 | $ | 19.7 | ||||||
Adjusted CFFO | $ | (3.8 | ) | $ | (5.8 | ) | $ | 6.0 | $ | 1.7 | $ | 17.8 | $ | 19.7 | ||||||
Free Cash Flow | $ | (4.3 | ) | $ | (5.9 | ) | $ | 6.1 | $ | 1.5 | $ | 17.5 | $ | 19.2 | ||||||
EBITDA | $ | 21.3 | $ | 23.2 | $ | 26.8 | $ | 17.5 | $ | 15.7 | $ | 83.1 | ||||||||
Earnings per share - basic | $ | 0.81 | $ | 0.88 | $ | 1.09 | $ | 0.43 | $ | 0.55 | $ | 2.95 | ||||||||
Earnings per share - diluted | $ | 0.80 | $ | 0.81 | $ | 1.08 | $ | 0.41 | $ | 0.53 | $ | 2.84 | ||||||||
Regular dividends per Class A share(4) | $ | 0.20 | $ | 0.20 | $ | 0.20 | $ | 0.20 | $ | 0.20 | $ | 0.80 | ||||||||
Special dividends per Class A share(4) | $ | — | $ | — | $ | — | $ | 0.60 | $ | 0.10 | $ | 0.70 | ||||||||
Total dividends per Class A share(4) | $ | 0.20 | $ | 0.20 | $ | 0.20 | $ | 0.80 | $ | 0.30 | $ | 1.50 | ||||||||
Class A Shares(5) | 1.9 | 2.0 | 2.0 | 2.3 | 2.4 | 2.2 | ||||||||||||||
Class B Shares(5) | 14.0 | 14.0 | 14.0 | 13.7 | 13.6 | 13.8 | ||||||||||||||
Total Shares(5) | 15.9 | 16.0 | 16.0 | 16.1 | 16.0 | 16.0 | ||||||||||||||
(1)Includes billings from all new subscription sales to new and existing subscribers. | ||||||||||||||||||||
(2)Includes billings attributable to renewal and maintenance fee payments. Excludes Membership sales. | ||||||||||||||||||||
(3)Includes primarily billings from Revenue Share, Advertising, and Conferences. | ||||||||||||||||||||
(4)Dividends prior to April 2, 2025 have been retroactively adjusted to give effect to the 1-for-20 reverse stock split. Does not include the regular or special dividends of $0.40 declared on July 31, 2025. See dividend guidance in the “Full Year 2025 Targets” section below. | ||||||||||||||||||||
(5)Excludes Management and Sponsor Earnout Shares. Amount in the TTM 2Q 2025 column is the average of the last four quarters | ||||||||||||||||||||
N/M - Not Meaningful | ||||||||||||||||||||
The chart below further illustrates CFFO and Billings trends over the last several quarters:
Balance Sheet and Capital Structure
As of June 30, 2025 the consolidated Cash balance was $69.1 million as compared with $97.9 million at December 31, 2024. The decline in cash balances is primarily due to the dividends and planned tax distribution payments which occurred during the first half of the year, partially offset by Cash from Operating Activities of $17.8 million. For the second half of 2025, we expect tax distribution payments to decline significantly compared to the $32.8 million of tax distribution payments in the first half. As such, we expect cash balances at the end of the year to be materially consistent with the cash balances at June 30, 2025, assuming current trends.
For the six months ended June 30, 2025, interest income earned totaled $1.7 million.
As previously announced, the Board of Directors authorized a stock repurchase program of our Class A common stock. Since April, the Company has repurchased 117,673 shares for $1.9 million.
MarketWise Inc.’s Class A common stock trades on the Nasdaq Global Market under the symbol "MKTW." On April 2, 2025, the Company effected a 1-for-20 reverse stock split. As of June 30, 2025, the Company had 2,357,128 Class A common shares and 13,612,641 Class B common shares issued and outstanding, totaling 15,969,769 Class A and Class B common shares on a post-split basis.
Net Income attributable to noncontrolling interests on the Income Statement is primarily associated with these B shares and is a result of our corporate structure.
As previously announced, on July 31, 2025, the Board of Directors declared a quarterly cash dividend to holders of Class A common stock of $0.20 per share. A comparable distribution of $0.20 per unit was also approved to holders of MarketWise, LLC units.
The Company also previously announced a special dividend to shareholders of Class A common stock of $0.20 per share. The regular dividend, distribution, and the special dividend will be paid on September 25, 2025. The Record Date is August 15, 2025.
Full Year 2025 Targets
Historically, the Company has not provided forward-looking information partially due to the inherent variability in our business. However, notwithstanding the variability in our business, we believe it is useful to provide investors with a line of sight into what we believe is the general direction of the business. These forward-looking Targets are based on trends and market conditions as they exist currently, and actual results may differ materially. Based on current projections and trends, we expect to meet or exceed the Targets previously disclosed.
Selected FY 2025 Targets, as originally disclosed, are as follows:
Billings are estimated to increase by 20% compared to the annualized 2H 2024 Billings, or approximately $250 million.
Cash from Operating Activities and Free Cash Flow are estimated to be approximately $30 million, or over a $50 million improvement compared to FY 2024.
Dividends to Class A shareholders are estimated to be approximately $1.60 to $1.80 per share. This total includes both the recurring quarterly dividends (currently $0.20 per quarter) as well as additional dividends related to excess tax distributions.
About MarketWise
Founded with a mission to level the playing field for self-directed investors, today MarketWise is a leading multi-brand subscription services platform providing premium financial research, software, education, and tools for investors.
With more than 25 years of operating history, MarketWise serves a community of millions of free and paid subscribers. MarketWise’s products are a trusted source for high-value financial research, education, actionable investment ideas, and investment software. MarketWise is a 100% digital, direct-to-customer company offering its research across a variety of platforms including mobile, desktops, and tablets. MarketWise has a proven, agile, and scalable platform and our vision is to become the leading financial solutions platform for self-directed investors.
Key Business Metrics and Non-GAAP Financial Measures
In this release we discuss certain key business metrics, which we believe provide useful information about the Company’s business and the operational factors underlying the Company’s financial performance. We are not aware of any uniform standards for calculating these key metrics, which may hinder comparability with other companies who may calculate similarly titled metrics in a different way.
Billings are defined as amounts invoiced to customers.
Paid Subscribers are defined as the total number of unique subscribers with at least one paid subscription at the end of the period.
Average revenue per user or ARPU is defined as the trailing four quarters of net Billings divided by the average number of quarterly total Paid Subscribers over that period.
In addition to our results determined in accordance with GAAP, we believe that the below non-GAAP financial measures are useful in evaluating operating performance. We use the below non-GAAP financial measures, collectively, to evaluate our ongoing operations and for internal planning and forecasting purposes. We believe that non-GAAP financial information, when taken collectively, may be helpful to investors because it provides consistency and comparability with past financial performance. This non-GAAP financial information is presented for supplemental informational purposes only and should not be considered a substitute for financial information presented in accordance with GAAP, and may be different from similarly titled non-GAAP measures used by other companies. A reconciliation is provided below for each non-GAAP financial measure to the most directly comparable financial measure stated in accordance with GAAP. Investors are encouraged to review the related GAAP financial measures and the reconciliations of these non-GAAP financial measures to their most directly comparable GAAP financial measures.
Management uses these non-GAAP measures internally to evaluate performance and make operating decisions, and we believe they provide a meaningful perspective to investors when used in conjunction with our GAAP results.
These non-GAAP measures have limitations as analytical tools, and should not be considered in isolation or as substitutes for analysis of other GAAP financial measures, such as cash flow from operations, operating cash flow margin, and net income. Some of the limitations of using these non-GAAP measures are that these metrics may be calculated differently by other companies in our industry.
Adjusted CFFO is defined as cash flow from operations (“CFFO”) plus or minus any non-recurring items.
Adjusted CFFO Margin is defined as Adjusted CFFO as a percentage of Billings.
We believe that Adjusted CFFO and Adjusted CFFO Margin are useful indicators that provide information to management and investors about our ability to generate cash, and for internal planning and forecasting purposes.
We expect Adjusted CFFO and Adjusted CFFO Margin to fluctuate in future periods as we invest in our business to execute our growth strategy. These activities, along with any non-recurring items as described above, may result in fluctuations in Adjusted CFFO and Adjusted CFFO Margin in future periods.
Free Cash Flow is defined as net cash provided by (used in) operating activities less capital expenditures. We define capital expenditures as purchases of property and equipment plus capitalized software development costs. Acquisitions are not included in capital expenditures.
We believe Free Cash Flow is a useful indicator that provides information to management and investors about the cash generated by the business that is available for discretionary purposes, such as dividends and strategic investments.
EBITDA is defined as net income before interest income (expense), income taxes, depreciation, and amortization. We believe EBITDA provides a useful supplemental measure of operating performance and is helpful to investors in evaluating our GAAP results.
Non-GAAP Measures
The following table provides a reconciliation of net cash provided by (used in) operating activities to Adjusted CFFO, and net cash provided by operating activities margin as a percentage of total net revenue to Adjusted CFFO Margin, net cash provided by (used in) operating activities to Free Cash Flow, and net income to EBITDA, in each case, the most directly comparable financial measure calculated in accordance with generally accepted accounting principles in the United States (“GAAP”):
(In thousands) | Second Quarter | Six Months Ended June 30, | ||||||||||||||||||||
2025(1) | 2024 | % Change | 2025(1) | 2024 | % Change | |||||||||||||||||
Net cash provided by (used in) operating activities | $ | 17,842 | $ | (3,795 | ) | (570.1 | )% | $ | 19,575 | $ | (22,306 | ) | (187.8 | )% | ||||||||
Total net revenue | 79,950 | 105,046 | (23.9 | )% | 163,457 | 214,037 | (23.6 | )% | ||||||||||||||
Net cash provided by (used in) operating activities margin | 22.3 | % | (3.6 | )% | 12.0 | % | (10.4 | )% | ||||||||||||||
Adjusted CFFO | $ | 17,842 | $ | (3,795 | ) | (570.1 | )% | $ | 19,575 | $ | (22,306 | ) | (187.8 | )% | ||||||||
Billings | 58,192 | 57,577 | 1.1 | % | 128,648 | 134,799 | (4.6 | )% | ||||||||||||||
Adjusted CFFO margin | 30.7 | % | (6.6 | %) | 15.2 | % | (16.5 | %) | ||||||||||||||
Net cash provided by (used in) operating activities | $ | 17,842 | $ | (3,795 | ) | (570.1 | )% | $ | 19,575 | $ | (22,306 | ) | (187.8 | )% | ||||||||
Capital expenditures | (339 | ) | (496 | ) | (31.7 | )% | (561 | ) | (748 | ) | (25.0 | )% | ||||||||||
Free Cash Flow | $ | 17,503 | $ | (4,291 | ) | (507.9 | )% | $ | 19,014 | $ | (23,054 | ) | (182.5 | )% | ||||||||
Net income | $ | 15,310 | $ | 21,240 | (27.9 | )% | 32,151 | 43,952 | (26.8 | )% | ||||||||||||
Interest income, net | (769 | ) | (1,341 | ) | (42.7 | )% | (1,710 | ) | (2,999 | ) | (43.0 | )% | ||||||||||
Income tax expense | 613 | 779 | (21.3 | )% | 1,651 | 1,514 | 9.0 | % | ||||||||||||||
Depreciation and amortization | 500 | 669 | (25.3 | )% | 1,031 | 1,362 | (24.3 | )% | ||||||||||||||
EBITDA | $ | 15,654 | $ | 21,347 | (26.7 | )% | $ | 33,123 | $ | 43,829 | (24.4 | )% | ||||||||||
NM: Not meaningful | ||||||||||||||||||||||
Cautionary Statement Regarding Forward-Looking Statements
This press release contains forward-looking statements within the meaning of the Private Securities Litigation Reform Act of 1995, including statements regarding the financial position, business strategy, and the plans and objectives of management for future operations of MarketWise. These forward-looking statements generally are identified by the words “believe,” “project,” “expect,” “anticipate,” “estimate,” “intend,” “strategy,” “future,” “opportunity,” “plan,” “may,” “should,” “will,” “would,” “will be,” “will continue,” “will likely result,” “target,” and similar expressions, but the absence of these words does not mean that a statement is not forward-looking. Forward-looking statements are predictions, projections, and other statements about future events that are based on current expectations and assumptions and, as a result, are subject to risks and uncertainties. Many factors could cause actual future events to differ materially from the forward-looking statements in this press release, including, but not limited to: our ability to attract new subscribers and to persuade existing subscribers to renew their subscription agreements with us and to purchase additional products and services from us; our ability to adequately market our products and services, and to develop additional products and product offerings; our ability to manage our growth effectively, including through acquisitions; failure to maintain and protect our reputation for trustworthiness and independence; our ability to attract, develop, and retain capable management, editors, and other key personnel; our ability to grow market share in our existing markets or any new markets we may enter; adverse or weakened conditions in the financial sector, global financial markets, and global economy; current macroeconomic events, including heightened inflation, rise in interest rates and the potential for an economic recession; failure to comply with laws and regulations or other regulatory action or investigations, including the Investment Advisers Act of 1940, as amended; our ability to respond to and adapt to changes in technology and consumer behavior; failure to successfully identify and integrate acquisitions, or dispose of assets and businesses; our public securities’ potential liquidity and trading; the impact of the regulatory environment and complexities with compliance related to such environment; our future capital needs; our ability to maintain an effective system of internal control over financial reporting, and to address and remediate existing material weaknesses in our internal control over financial reporting; and other factors beyond our control.
The foregoing list of factors is not exhaustive. You should carefully consider the foregoing factors and the other risks and uncertainties described in the “Risk Factors” section of our filings with the U.S. Securities and Exchange Commission (the “SEC”). These filings identify and address other important risks and uncertainties that could cause actual events and results to differ materially from those contained in the forward-looking statements. New risks emerge from time to time. It is not possible for our management to predict all risks, nor can we assess the impact of all factors on our business or the extent to which any factor, or combination of factors, may cause actual results to differ materially from those contained in any forward-looking statements we may make. In light of these risks, uncertainties and assumptions, the forward-looking events and circumstances discussed in this press release may not occur and actual results could differ materially and adversely from those anticipated.
Forward-looking statements speak only as of the date they are made. Readers are cautioned not to put undue reliance on forward-looking statements, and we assume no obligation and do not intend to update or revise these forward-looking statements, whether as a result of new information, future events or otherwise. We do not give any assurance that we will achieve our expectations.
Table 1. Income Statement
(Unaudited, in thousands, except per share data) | Second Quarter | Year to Date June 30, | ||||||||||||
2025 | 2024 | 2025 | 2024 | |||||||||||
Net revenue | $ | 79,309 | $ | 104,174 | $ | 162,323 | $ | 212,786 | ||||||
Related party revenue | 641 | 872 | 1,134 | 1,251 | ||||||||||
Total net revenue | 79,950 | 105,046 | 163,457 | 214,037 | ||||||||||
Operating expenses: | ||||||||||||||
Cost of revenue(1) | 10,950 | 13,379 | 22,885 | 26,747 | ||||||||||
Sales and marketing(1) | 31,626 | 42,722 | 65,704 | 90,019 | ||||||||||
General and administrative(1) | 19,744 | 24,514 | 37,072 | 48,316 | ||||||||||
Research and development(1) | 2,141 | 2,171 | 4,487 | 4,320 | ||||||||||
Depreciation and amortization | 500 | 669 | 1,031 | 1,362 | ||||||||||
Impairment of intangible assets | — | — | 380 | — | ||||||||||
Related party expense | 178 | 257 | 307 | 384 | ||||||||||
Total operating expenses | 65,139 | 83,712 | 131,866 | 171,148 | ||||||||||
Income from operations | 14,811 | 21,334 | 31,591 | 42,889 | ||||||||||
Other income (expense), net | 343 | (656 | ) | 501 | (422 | ) | ||||||||
Interest income, net | 769 | 1,341 | 1,710 | 2,999 | ||||||||||
Income before income taxes | 15,923 | 22,019 | 33,802 | 45,466 | ||||||||||
Income tax expense | 613 | 779 | 1,651 | 1,514 | ||||||||||
Net income | 15,310 | 21,240 | 32,151 | 43,952 | ||||||||||
Net income attributable to noncontrolling interests | 14,013 | 19,696 | 29,964 | 40,751 | ||||||||||
Net income attributable to MarketWise, Inc. | $ | 1,297 | $ | 1,544 | $ | 2,187 | $ | 3,201 | ||||||
Earnings per share – basic | $ | 0.55 | $ | 0.81 | $ | 0.99 | $ | 1.71 | ||||||
Earnings per share – diluted | $ | 0.53 | $ | 0.80 | $ | 0.95 | $ | 1.64 | ||||||
Weighted average shares outstanding – basic | $ | 2,357 | $ | 1,910 | $ | 2,205 | $ | 1,873 | ||||||
Weighted average shares outstanding – diluted | $ | 2,445 | $ | 1,940 | $ | 2,302 | $ | 1,947 | ||||||
(1) Cost of revenue, sales and marketing, general and administrative, and research and development expenses are exclusive of depreciation and amortization shown as a separate line item | ||||||||||||||
Table 2. Balance Sheet
(in thousands, except share and per share data) | June 30, 2025 | December 31, 2024 | |||||
Assets | |||||||
Current assets: | |||||||
Cash and cash equivalents | $ | 69,112 | $ | 97,876 | |||
Accounts receivable | 4,068 | 1,876 | |||||
Prepaid expenses | 7,287 | 10,051 | |||||
Related party receivables | 781 | 547 | |||||
Deferred contract acquisition costs | 47,946 | 57,214 | |||||
Other current assets | 850 | 1,269 | |||||
Total current assets | 130,044 | 168,833 | |||||
Property and equipment, net | 293 | 592 | |||||
Operating lease right-of-use assets | 2,363 | 3,182 | |||||
Intangible assets, net | 4,122 | 4,673 | |||||
Goodwill | 30,043 | 30,043 | |||||
Deferred contract acquisition costs, noncurrent | 34,597 | 42,121 | |||||
Deferred tax assets | 10,291 | 10,071 | |||||
Total assets | $ | 211,753 | $ | 259,515 | |||
Liabilities and stockholders’ deficit | |||||||
Current liabilities: | |||||||
Trade and other payables | $ | 2,637 | $ | 4,011 | |||
Related party payables | 439 | 338 | |||||
Accrued expenses | 23,088 | 23,272 | |||||
Deferred revenue and other contract liabilities | 201,141 | 217,973 | |||||
Operating lease liabilities | 946 | 1,629 | |||||
Other current liabilities | 11,268 | 12,985 | |||||
Total current liabilities | 239,519 | 260,208 | |||||
Deferred revenue and other contract liabilities, noncurrent | 192,329 | 209,013 | |||||
Related party TRA liability, noncurrent (Note 9) | 4,260 | 2,669 | |||||
Other liabilities, noncurrent | 2,099 | 2,811 | |||||
Operating lease liabilities, noncurrent | 564 | 2,738 | |||||
Total liabilities | 438,771 | 477,439 | |||||
Commitments and Contingencies | — | — | |||||
Stockholders’ deficit: | |||||||
Common stock - Class A, par value of $0.0001 per share, 47,500,000 shares authorized; 2,357,128 and 1,978,013 shares issued and outstanding at June 30, 2025 and December 31, 2024, respectively | — | — | |||||
Common stock - Class B, par value of $0.0001 per share, 15,000,000 shares authorized; 13,612,641 and 13,994,498 shares issued and outstanding at June 30, 2025 and December 31, 2024, respectively | 1 | 1 | |||||
Preferred stock - par value of $0.0001 per share, 100,000,000 shares authorized; 0 shares issued and outstanding at June 30, 2025 and December 31, 2024, respectively | — | — | |||||
Additional paid-in capital | 101,281 | 106,691 | |||||
Accumulated other comprehensive income | 56 | 56 | |||||
Accumulated deficit | (117,097 | ) | (119,284 | ) | |||
Total stockholders’ deficit attributable to MarketWise, Inc. | (15,759 | ) | (12,536 | ) | |||
Noncontrolling interest | (211,259 | ) | (205,388 | ) | |||
Total stockholders’ deficit | (227,018 | ) | (217,924 | ) | |||
Total liabilities and stockholders’ deficit | $ | 211,753 | $ | 259,515 | |||
Table 3. Cash Flows
(Unaudited, in thousands) | Year to Date June 30, | |||||||
2025 | 2024 | |||||||
Cash flows from operating activities: | ||||||||
Net income | $ | 32,151 | $ | 43,952 | ||||
Adjustments to reconcile net income to net cash provided by (used in) operating activities: | ||||||||
Depreciation and amortization | 1,031 | 1,362 | ||||||
Impairment of property and equipment, net | 380 | — | ||||||
Stock-based compensation | 5,698 | 5,464 | ||||||
Change in fair value of contingent consideration | (1,441 | ) | 764 | |||||
Deferred taxes | 1,651 | 1,254 | ||||||
Unrealized gains on foreign currency | — | (64 | ) | |||||
Other gains | (1,908 | ) | — | |||||
Noncash lease expense | 2,545 | 1,015 | ||||||
Changes in operating assets and liabilities: | ||||||||
Accounts receivable | (2,192 | ) | 53 | |||||
Related party receivables and payables | 1,308 | 2,200 | ||||||
Prepaid expenses | 2,764 | 1,041 | ||||||
Other current assets and other assets | 419 | 525 | ||||||
Deferred contract acquisition costs | 16,645 | 32,919 | ||||||
Trade and other payables | (1,374 | ) | 3,167 | |||||
Accrued expenses | (184 | ) | (29,317 | ) | ||||
Deferred revenue | (33,107 | ) | (86,852 | ) | ||||
Operating lease liabilities | (2,937 | ) | (710 | ) | ||||
Other current and long-term liabilities | (1,874 | ) | 921 | |||||
Net cash provided by (used in) operating activities | 19,575 | (22,306 | ) | |||||
Cash flows from investing activities: | ||||||||
Purchases of property and equipment | (163 | ) | (29 | ) | ||||
Capitalized software development costs | (398 | ) | (719 | ) | ||||
Net cash used in investing activities | (561 | ) | (748 | ) | ||||
Cash flows from financing activities: | ||||||||
Proceeds from issuance of common stock | 283 | 213 | ||||||
Repurchases of stock | (1,851 | ) | (10,803 | ) | ||||
Restricted stock units withheld to pay taxes | (583 | ) | (1,172 | ) | ||||
Dividends paid to Class A shareholders | (2,758 | ) | (724 | ) | ||||
Distributions to noncontrolling interests | (42,869 | ) | (10,237 | ) | ||||
Net cash used in financing activities | (47,778 | ) | (22,723 | ) | ||||
Effect of exchange rate changes on cash | — | (55 | ) | |||||
Net decrease in cash, cash equivalents and restricted cash | (28,764 | ) | (45,832 | ) | ||||
Cash, cash equivalents and restricted cash — beginning of period | 97,876 | 155,174 | ||||||
Cash, cash equivalents and restricted cash — end of period | $ | 69,112 | $ | 109,342 | ||||
MarketWise Investor Relations Contact
Erik Mickels – Chief Operating and Financial Officer
Email: ir@marketwise.com
MarketWise Media Contact
Email: media@marketwise.com
A chart accompanying this announcement is available at https://www.globenewswire.com/NewsRoom/AttachmentNg/e93781a2-0d77-403b-b311-49dca64faa14