Longest Intercepts of Copper Mineralisation to Date at Lone Star
· Issued by Belmont Resources Inc. via TheNewswire
(TheNewswire)
oo
Significant
zones of mineralisation intersected include:
oo
149.4m @ 0.84
%CuEq (0.7 % Cu, 0.2 g/t Au 1.3 g/t Ag) from 12.8m (LS21-016)
including:
4.6m @ 4.04 %CuEq (3.1 % Cu,
1.4 g/t Au 11.7 g/t Ag) from 108.8m
4.3m @ 1.29 %CuEq (1.1 % Cu,
0.2 g/t Au 7.4 g/t Ag) from 45.1m
9.2m @
1.17 %CuEq
(1.0% Cu, 0.2 g/t Au 4.7 g/t Ag) from
127.1m
oo
33.2m @ 1.26
%CuEq
0.9 % Cu, 0.5 g/t Au
4.5 g/t Ag) from 16.5m (LS21-015)
oo
54.9m @ 0.86
%CuEq (0.7 % Cu, 0.2 g/t Au 3.4 g/t Ag) from 6.1m (LS21-021) (note:
only 50% of assays received thus far) including:
7.3m @ 2.70 %CuEq (2.1 % Cu,
0.7 g/t Au 19.1 g/t Ag) from 6.1m
oo
25.3m @ 0.84
%CuEq (0.7 % Cu, 0.2 g/t Au 1.4 g/t Ag) from 50.3m
(LS21-024)
oo
3.1m @ 3.32
%CuEq (2.6% Cu, 0.9 g/t Au 8.6 g/t Ag) from 108.8m
and 8.2m @ 1.99 %CuEq (1.3 % Cu, 1.0 g/t Au 4.8 g/t Ag) from 119.5m
(LS21-011)
oo
Results from
a further 6 completed drill holes still outstanding with drilling
continuing 24/7.
Vancouver, B.C. Canada –
TheNewswire -
April 1, 2022; Belmont
Resources Inc. (“Belmont”), (or the “Company”), (TSX.V: BEA;
FSE: L3L2) is pleased to announce results from the latest batch of
assays at the Belmont-Marquee Resources. (ASX: MQR) (“Marquee”)
Lone Star Joint Venture (JV) in North Eastern Washington State.
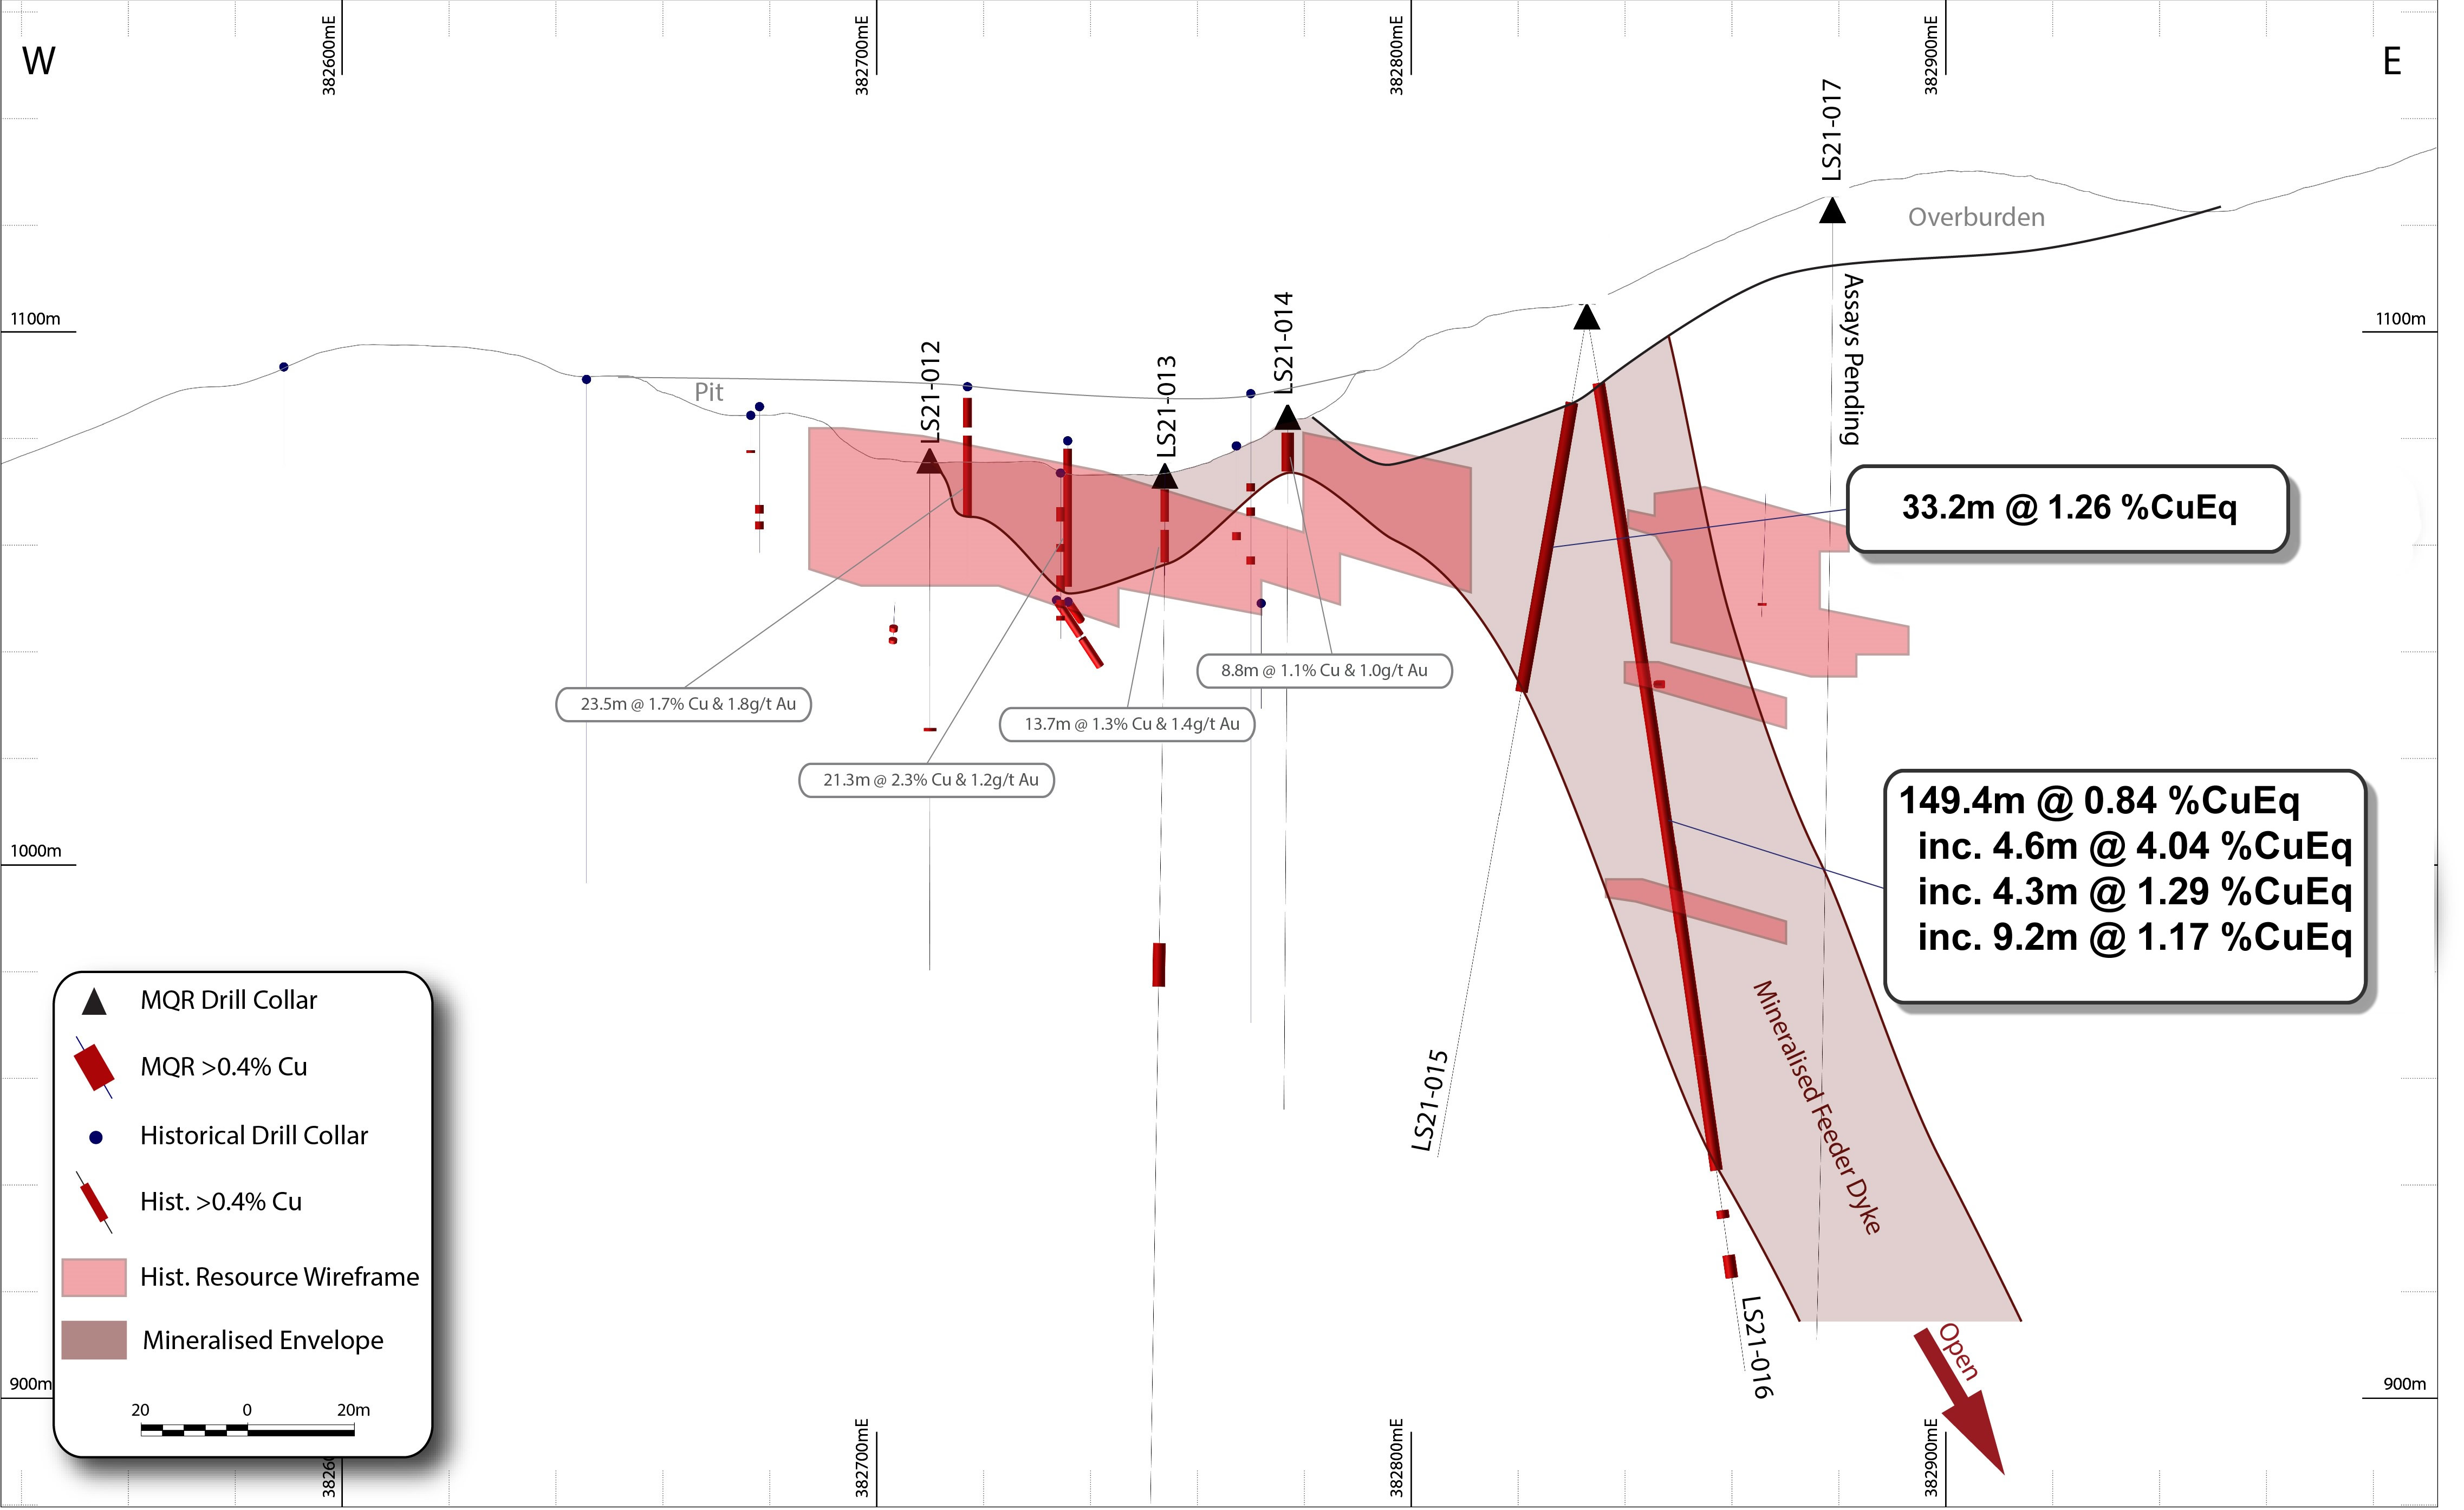
Results from this batch of assays have intersected up
to 150m of significant copper mineralisation that extends well beyond
the extents of historical drill hole results. The long intercepts of
copper mineralisation are interpreted to be related to sub-vertical
feeder dyke that has been the conduit for upwelling magmas during
rhyolite dome emplacement and mineralisation (Figure 1).
President & CEO, Mr. George
Sookochoff, commented:
“It’s great to see
the drilling further unlock our knowledge of the Lone Star deposit and
extend the envelope of mineralisation well beyond the previously
defined limits. These results validate the geological model developed
by the Project Geologist on-site and opens up the potential to
identify further sub-vertical, well-mineralized rhyolite
dykes.”
“Drilling continues 24/7 and we have a further
6-holes at the lab awaiting assays, so it’s going to be an exciting
few months as we work towards completing our maiden drill campaign
at the Project. We know the mineralisation at Lone Star plunges to the
south-east, so we expect to see the excellent results continue as we
systematically work through the drilling program from north to south.
Resource modelling studies continue in the background and we are
highly encouraged by what the drilling has produced thus
far.”
Click Image To View Full Size
Figure 1:
Cross-section 5428236N highlighting the mineralised feeder dyke
intersected in drill holes LS21-015 & LS21-016.
Significant results from the latest batch of assays
include:
oo
149.4m @ 0.84
%CuEq (0.7 % Cu, 0.2 g/t Au 1.3 g/t Ag) from 12.8m (LS21-016)
including:
4.6m @ 4.04 %CuEq (3.1 % Cu,
1.4 g/t Au 11.7 g/t Ag) from 108.8m
4.3m @ 1.29 %CuEq (1.1 % Cu,
0.2 g/t Au 7.4 g/t Ag) from 45.1m
9.2m @
1.17 %CuEq
(1.0% Cu, 0.2 g/t Au 4.7 g/t Ag) from
127.1m
oo
33.2m @ 1.26
%CuEq
0.9 % Cu, 0.5 g/t Au
4.5 g/t Ag) from 16.5m (LS21-015)
oo
54.9m @ 0.86
%CuEq (0.7 % Cu, 0.2 g/t Au 3.4 g/t Ag) from 6.1m (LS21-021) (note:
only 50% of assays received thus far) including:
7.3m @ 2.70 %CuEq (2.1 % Cu,
0.7 g/t Au 19.1 g/t Ag) from 6.1m
oo
25.3m @ 0.84
%CuEq (0.7 % Cu, 0.2 g/t Au 1.4 g/t Ag) from 50.3m
(LS21-024)
oo
3.1m @ 3.32
%CuEq (2.6% Cu, 0.9 g/t Au 8.6 g/t Ag) from 108.8m
and 8.2m @ 1.99 %CuEq (1.3 % Cu, 1.0 g/t Au 4.8 g/t Ag) from 119.5m
(LS21-011)
1.True widths of the reported mineralized intervals
have not been determined.
2. Assumptions used in USD for the copper equivalent
calculation were metal prices of $4.00/lb. Copper, $1,800/oz Gold,
$20/oz Silver, and recovery is assumed to be 100% given the level of
metallurgical test data available. The following equation was used to
calculate copper equivalence: CuEq = Copper (%) + (Gold (g/t) x 0.656)
+ (Silver (g/t) x 0.00729).
The geological model that has been developed for the
Lone Star deposit is that at least three separate rhyolite layers,
with associated volcanogenic massive sulphide (VMS) copper-silver
mineralisation, are fed by sub-vertical feeder dykes. The mineralised
sub-vertical dykes are estimated to be approx. 20-40m wide, extend
laterally for tens to hundreds of metres, and are vertically
extensive. Identification of the mineralised dykes opens up the
possibility of defining significant additional mineralisation outside
the flat-lying, VMS mineralisation that has been historically
identified.
High-grade gold mineralisation is discordant with
high-grade copper-silver mineralisation and it is interpreted that
early volcanogenic massive sulphide (VMS) style copper-silver
mineralisation has been overprinted by later shearing, brecciation and
hydrothermal gold deposition. As such, the results indicate the
potential to define further high-grade, structurally controlled gold
mineralisation that was not a focus of historical exploration
programs.
Lone Star Diamond Drilling Program
Update
To date, 25 diamond drill holes for 4,664m have been
completed at Lone Star (Table 1) with full assay results from the
first 18 drill holes received.
Batches of core are being delivered to the laboratory
every two weeks with regular results expected over the coming months.
Drilling continues 24 hours a day as part of the forty-three hole,
~7,000m diamond drilling program. Drilling is expected to be completed
at the Lone Star Copper-Gold Project in Q1-2022 with the phase 1 drill
program designed to satisfy three key objectives:
--
Validate the historical drill
hole database and resource model;
--
Deliver a JORC/43-101 compliant
mineral resource estimate; and
--
Test for extensions to the
historical resource.
Additionally, Mining Plus Pty Ltd have begun resource
modelling studies as the Company pushes towards delivering a
202
2 JORC/43-101
compliant resource in 1H-2022.
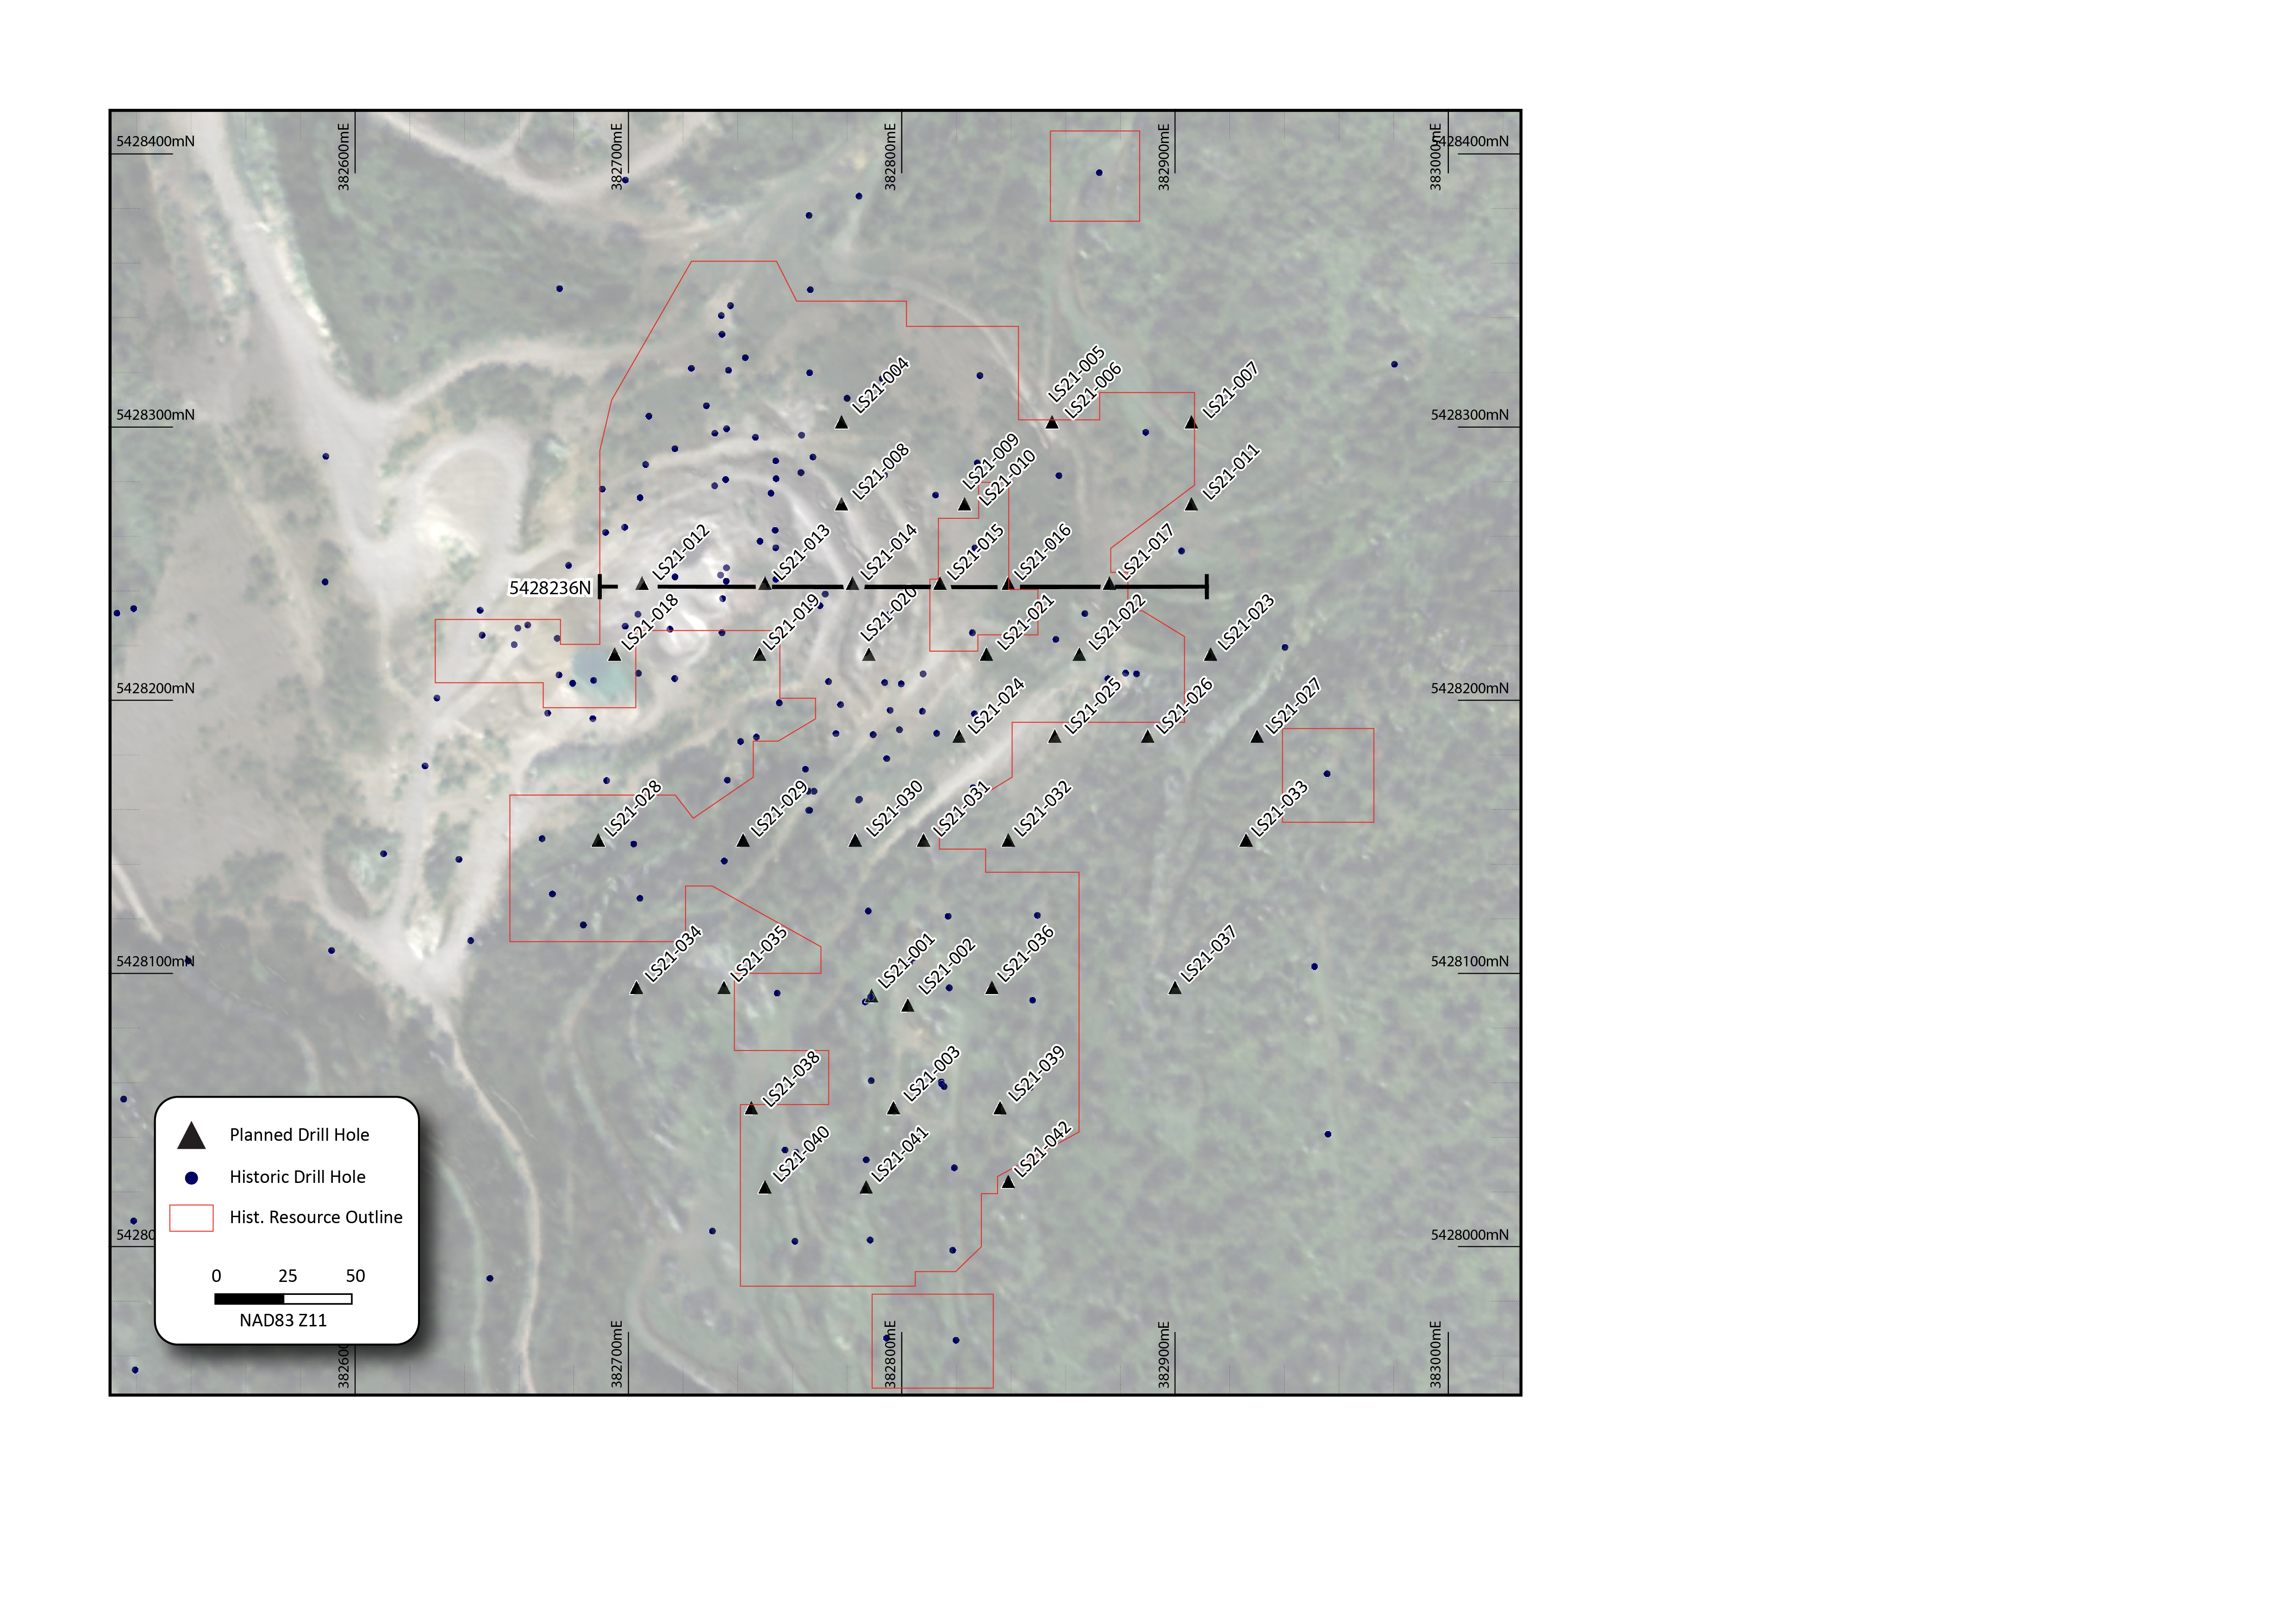
Click Image To View Full Size
Figure 2: Lone Star drill plan
map
Table 2: Significant Intercepts from
the Lone Star drilling Program
Hole_ID
From
To
Interval
CuEq
Cu %
Au g/t
Ag g/t
(m)
(m)
(m)
LS21-001
41.5
50.3
9.1
0.75
0.6
0.2
3.2
LS21-001
54.9
61.2
6.9
1.82
1.2
0.8
12.9
LS21-001
65.8
110
44.2
1.46
1.3
0.2
4.6
inc.
65.8
88.7
19.8
2.78
2.4
0.5
6.7
LS21-001
115.8
138.7
19.1
0.40
0.4
LS21-001
140.4
162.5
22.1
1.41
1.2
0.3
2.2
inc.
140.4
162.5
8.5
2.64
2.1
0.8
2.4
LS21-001
198.7
200.9
4.7
1.00
0.8
0.3
1
LS21-002
46.9
60.8
15.5
5.05
3.7
1.8
23
inc.
56.7
59.3
2.6
26.10
18.5
10.4
106
LS21-002
95.1
101.1
6
0.42
0.4
2.5
LS21-002
120.7
176.1
53.6
1.08
0.8
0.4
2
inc.
167.6
176.1
7.6
3.06
2.1
1.4
6.2
LS21-002
193.8
194.7
0.9
4.62
3.8
1.2
4
LS21-002
199.3
200.5
1.2
4.28
3
1.9
4
LS21-002
202
203.6
1.6
1.57
0.9
1
2
LS21-003
72.4
77.4
5
4.35
3.5
1.1
17.5
LS21-003
125.6
147.9
22.3
1.06
0.8
0.4
inc.
133.8
143.3
9.5
1.47
1.1
0.5
5.6
LS21-003
155.2
211
55.8
0.60
0.6
inc.
165.9
175.1
9.2
1.20
1
0.3
LS21-004
7
14.6
7.6
1.40
1.2
0.3
LS21-006
99.7
111.6
11.9
2.34
1
2
3.3
inc.
108.5
110.1
1.6
9.83
2.1
11.7
7
LS21-007
107.9
125.6
17.7
3.48
1.6
2.8
5.9
inc.
112.2
116.3
4.1
6.41
5.3
1.5
16.8
inc.
117.4
122.3
4.9
5.70
0.5
7.9
2.6
LS21-008
5.5
23.2
17.7
0.80
0.6
0.3
LS21-009
6.4
46
39.6
0.40
0.4
LS21-009
63.4
70.7
7.3
0.76
0.5
0.4
LS21-010
7.8
43.9
37.9
1.30
1
0.4
4.5
inc.
21
33.2
12.2
2.79
2
1.1
8.8
LS21-010
59.2
80.5
21.3
0.62
0.6
3.3
LS21-010
127.1
138.4
11.3
0.42
0.4
3.2
LS21-011
108.8
111.9
3.1
3.32
2.6
1
8.6
LS21-011
119.5
127.7
8.2
1.99
1.3
1
4.7
LS21-012
50.3
50.9
0.6
3.38
2.4
1.4
8
LS21-013
87.8
96
8.2
0.53
0.4
0.2
0.5
LS21-014
3.1
10.4
7.3
0.55
0.4
0.2
2.5
LS21-015
16.5
71.6
33.2
1.26
0.9
0.5
4.5
LS21-016
12.8
162.2
149.4
0.84
0.7
0.2
1.3
inc.
45.1
49.4
4.3
1.29
1.1
0.2
7.4
inc.
108.8
113.4
4.6
4.04
3.1
1.3
11.7
inc.
127.1
136.3
9.2
1.17
1
0.2
4.7
LS21-016
169.8
171.3
1.5
1.30
1.1
0.3
LS21-016
178.3
182.6
4.3
1.03
0.7
0.5
LS21-018
NSR
0.00
LS21-019
NSR
0.00
LS21-021
6.1
89.3
54.9
0.86
0.7
0.2
3.4
inc.
6.1
13.4
7.3
2.70
2.1
0.7
19.1
LS21-024
50.3
75.6
25.3
0.84
0.7
0.2
1.4
LS21-024
110
178
64.3
0.49
0.4
0.1
2.8
True widths of the reported mineralized intervals have
not been determined.
Assumptions used in USD for the copper equivalent
calculation were metal prices of $4.00/lb. Copper, $1,800/oz Gold,
$20/oz Silver, and recovery is assumed to be 100% given the level of
metallurgical test data available. The following equation was used to
calculate copper equivalence: CuEq = Copper (%) + (Gold (g/t) x 0.656)
+ (Silver (g/t) x
0.00729
).
About the Lone Star
The Lone Star is a past producing open pit and
underground mine situated on the north end of the prolific Republic
Graben of Washington State. The project has 252 historic drill holes.
In 2006 former owner Merit Mining drilled an additional six holes
and completed a 2007 resource as reported in a “Technical Report and
Resource Estimate on the Lone Star Deposit, Ferry County Washington
(September 23, 2007)” for Merit Mining Corp. and authored by P&E
Mining Consultants Inc.
The company went into receivership shortly after the
publishing of the resource estimate due to the 2008 economic crisis.
Belmont acquired the Lone Star property in July 2021 and is the first
company to continue where Merit Mining left off, in advancing the Lone
Star to production.
Click Image To View Full Size
Lone Star 2007
Historical Resource
Calculated
utilizing a gold price of US$593/oz and copper price of
US$2.84/lb.
(1) Mineral resources which are
not mineral reserves do not have demonstrated economic viability.
(2
)
Gold equivalent (AuEq) grade was
calculated utilizing a gold price of US$593/oz and copper price of
US$2.84/lb
.,
based on the 24 month
(at July 31, 2007) trailing average of gold and copper prices, to
obtain a conversion factor of % copper x 3.284 + gold g/t = Au Eq g/t.
Metallurgical recoveries and smelting/refining costs were not factored
into the gold equivalent calculation.
(3) The Cu equivalent (CuEq) cut-off
value of 1.5% was calculated and rounded utilizing the following: Cu
price US$2.84/lb, $US exchange rate $0.88, process recovery $95%,
smelter payable 95%, smelting and refining charges C$7/tonne mined,
mining cost C$62/tonne mined, process cost $C28/tonne processed,
G&A cost $7.50/tonne processed.
(4) A qualified person has not done
sufficient work to classify the historic estimate as current mineral
resources or mineral reserves. As such the issuer, Belmont
Resources, is not treating this historical estimate as current mineral
resources or mineral reserves.
Belmont-Marquee Joint Venture
Marquee Resources (ASX:MQR) is earning the right to
acquire an 80% interest in the Lone Star property (NR Nov. 4, 2021 –
Belmont Signs Option/JV Agreements With Marquee Resources On Lone Star
Property) by committing to the following:
• $504,000 cash payments
• $2,550,000 Work Program
• 3,000,000 MQR Shares
• Produce a NI 43-101 & JORC Resource
and Preliminary Economic Assessment on the project
• Within a 24 month term.
About Belmont Resources
Belmont Resources is engaged in the business of
acquiring and re-developing past producing copper-gold-silver mines in
southern British Columbia and Northern Washington State. This region
is considered to have the highest concentration of mineralization and
past producing mines in western North America.
By utilizing new exploration technology, geological
modelling and specialized 3D data analysis, the company is
successfully identifying new areas of mineralization beneath and/or in
the near vicinity of the past producing mines.
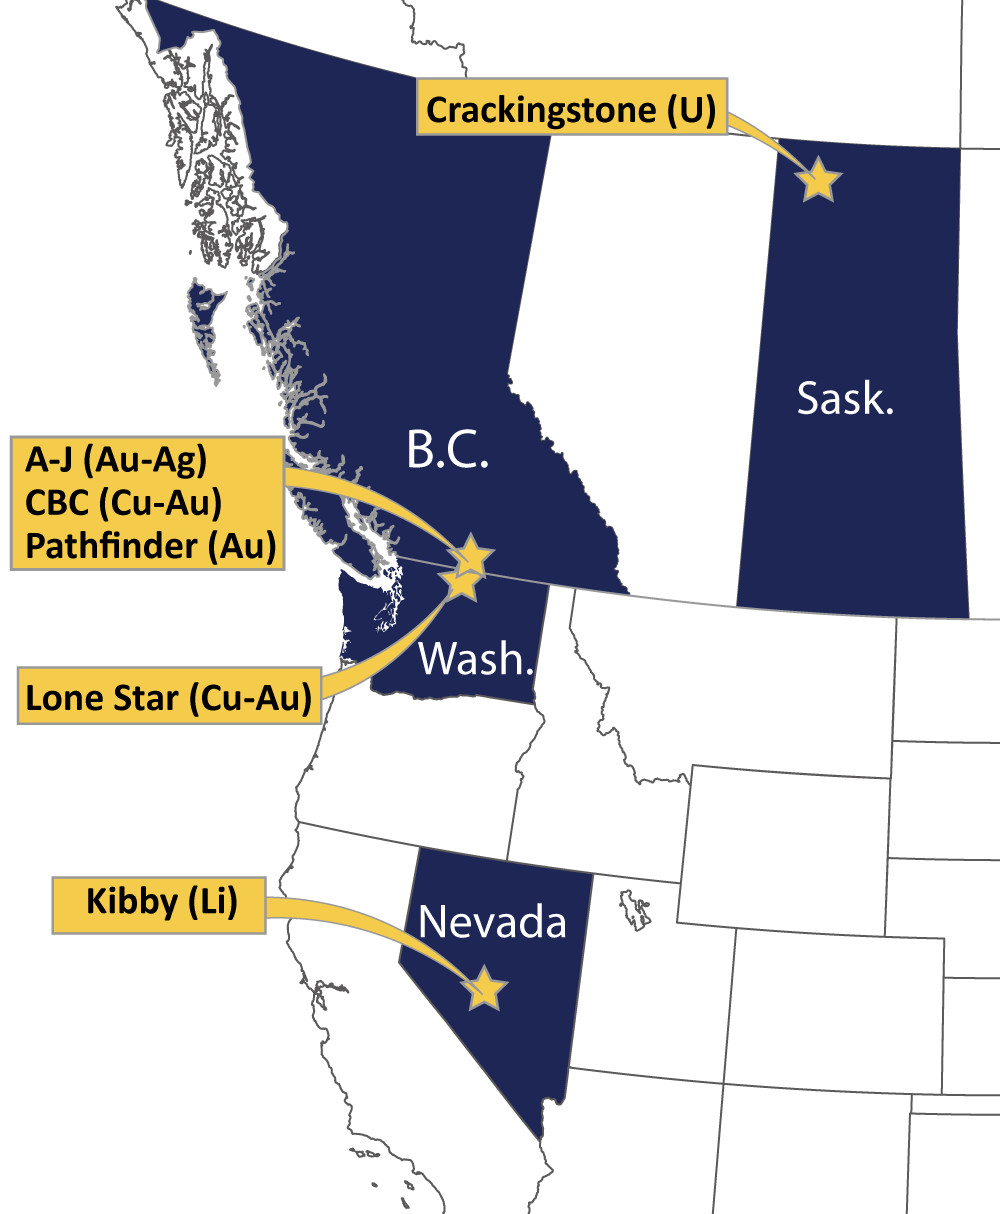
Click Image To View Full Size
The Belmont project portfolio:
Athelstan-Jackpot, B.C. – * Gold-Silver
mines
Come By Chance, B.C. – * Copper-Gold mine
Lone Star, Washington – * Copper-Gold mine
Pathfinder, B.C. – * Gold–Silver mines
Black Bear, B.C. – Gold
Pride of the West, B.C.- Gold
Kibby Basin, Nevada – Lithium
Click Image To View Full Size
Crackingstone, Sask. – Uranium
* past producing mine
NI 43-101 Disclosure:
Technical disclosure in this news release has been
approved by James Ebisch P.Geo, a Qualified Person as defined by
National Instrument NI 43-101.
We seek safe harbor. Neither TSX Venture Exchange nor
its Regulation Services Provider (as that term is defined in the
policies of the TSX Venture Exchange) accepts responsibility for the
adequacy or accuracy of this release. The TSX Venture Exchange has not
approved nor disapproved of the information contained herein.
Copyright (c) 2022 TheNewswire - All rights reserved.