

- Fourth quarter sales increased 6.8% to $208.5 million; sales for 2024 were up 15.4% to $795.4 million
- Fourth quarter net loss was $2.8 million; adjusted EBITDA1 was $31.5 million, or 15.1% of sales
- Aerospace segment fourth quarter sales increased 12% to a record $188.5 million
- Cash flow from operations was $26.4 million in the quarter and $30.6 million for the year
- Bookings in the quarter were $195.9 million; 2024 bookings totaled $808.1 million
- 2025 revenue guidance maintained at $820 million to $860 million
EAST AURORA, N.Y.--(BUSINESS WIRE)-- Astronics Corporation (Nasdaq: ATRO) (“Astronics” or the “Company”), a leading supplier of advanced technologies and products to the global aerospace, defense, and other mission critical industries, today reported financial results for the three and twelve months ended December 31, 2024.
This press release features multimedia. View the full release here: https://www.businesswire.com/news/home/20250304643339/en/
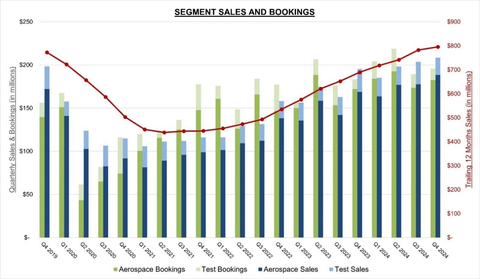
Astronics Segment Sales and Bookings (Graphic: Business Wire)
Peter J. Gundermann, Chairman, President and Chief Executive Officer, commented, “2024 was another year of solid progress ending with a strong fourth quarter. For the quarter, we achieved near record sales despite Boeing’s 737 production pause. The higher volume and improved operating efficiencies resulted in higher margins, with an adjusted EBITDA margin1 of 15.1%. We generated strong cash flow from operations of $26.4 million in the quarter. The quarter closed a year of 15% sales growth, our third year in a row of substantial double-digit growth. Our margins improved steadily through the year and demand remained robust, resulting in an ending backlog of $599 million. Our strong backlog, improving operating efficiencies, stabilizing supply chain, and our improved liquidity position from our recent financing activities position us well for the opportunities we see in 2025.”
Fourth Quarter Results
Three Months Ended |
Year Ended |
||||||||||||||||
($ in thousands) |
December 31, 2024 |
December 31, 2023 |
% Change |
December 31, 2024 |
December 31, 2023 |
% Change |
|||||||||||
Sales |
$ |
208,540 |
$ |
195,292 |
6.8 |
% |
$ |
795,426 |
$ |
689,206 |
15.4 |
% |
|||||
Gross profit |
$ |
50,054 |
$ |
39,973 |
25.2 |
% |
$ |
168,342 |
$ |
120,796 |
39.4 |
% |
|||||
Gross margin |
24.0 |
% |
20.5 |
% |
21.2 |
% |
17.5 |
% |
|||||||||
Income (loss) from operations |
$ |
8,876 |
$ |
7,782 |
14.1 |
% |
$ |
26,466 |
$ |
(6,671 |
) |
496.7 |
% |
||||
Operating margin % |
4.3 |
% |
4.0 |
% |
3.3 |
% |
(1.0 |
)% |
|||||||||
Net gain on sale of businesses |
$ |
— |
$ |
— |
$ |
— |
$ |
3,427 |
|||||||||
Loss on extinguishment of debt |
$ |
3,161 |
$ |
— |
$ |
10,148 |
$ |
— |
|||||||||
Net (loss) income |
$ |
(2,832 |
) |
$ |
6,976 |
(140.6 |
)% |
$ |
(16,215 |
) |
$ |
(26,421 |
) |
38.6 |
% |
||
Net (loss) income % |
(1.4 |
)% |
3.6 |
% |
(2.0 |
)% |
(3.8 |
)% |
|||||||||
Adjusted net income2 |
$ |
16,849 |
$ |
6,511 |
158.8 |
% |
$ |
38,136 |
$ |
2,619 |
1,356.1 |
% |
|||||
Adjusted EBITDA2 |
$ |
31,539 |
$ |
24,830 |
27.0 |
% |
$ |
96,466 |
$ |
55,579 |
73.6 |
% |
|||||
Adjusted EBITDA margin %2 |
15.1 |
% |
12.7 |
% |
12.1 |
% |
8.1 |
% |
|||||||||
Fourth Quarter 2024 Results (compared with the prior-year period, unless noted otherwise)
Growth in sales were driven by the Aerospace segment due to continued strength in demand primarily from the Commercial Transport market. Aerospace sales were up $19.8 million, or 11.7%, which more than offset the $6.6 million decline in Test Systems sales on lower defense revenue.
Higher volume and improving productivity drove gross profit up $10.1 million to $50.1 million, or 24.0% of sales. Adjusted gross profit2 of $52.5 million, or 25.2% of sales, increased $12.6 million, or 31.4%. Somewhat offsetting the improvements in volume, mix and productivity, were a $1.7 million true-up to the warranty reserve related to a new product launch that requires a field modification and an additional $0.8 million charge related to the Aerospace customer bankruptcy, both of which were initially reported in the third quarter.
In the fourth quarter of 2024, the $9.0 million increase in selling, general and administrative expenses (“SG&A”) included a $4.8 million reserve for the previously announced damage award that was related to a patent infringement dispute in the UK. Also accounting for the increase was a $2.2 million increase in litigation-related legal expenses and $1.4 million in restructuring-related severance charges incurred in our Test Systems segment.
On February 21, 2025, the UK High Court of Justice rendered a decision in the Company’s long-running patent infringement dispute in that jurisdiction. The ruling requires payment of approximately $11.9 million and, as a result, SG&A expense in the quarter reflects the true-up of the legal reserves for that matter. Any additional amounts required to be paid by the Company related to certain other factors peripheral to the damages award will be determined at follow-up hearings expected to occur in the first half of 2025. The Company expects that payment of the final liability will be required in the second quarter of 2025, and that an appeal, if any, would likely be heard in early 2026.
Despite the reserve increase resulting from the infringement ruling, consolidated operating income increased $1.1 million as leverage from higher volume helped to offset the unusual expenses. On an adjusted basis, operating income2 for the 2024 fourth quarter doubled to $23.8 million, and adjusted operating margin2 expanded 550 basis points to 11.4%.
Impacting net income was $3.2 million for the loss on extinguishment of debt which included the call premium of $1.3 million on our previous term loan and the write-off of $1.9 million of associated deferred financing costs.
Tax expense of $3.4 million was primarily due to a valuation allowance applied against the deferred tax asset associated with research and development costs that are required to be capitalized for tax purposes, compared with a tax benefit of $5.4 million in the prior year period.
As a result, consolidated net loss was $2.8 million, or $(0.08) per diluted share, compared with net income of $7.0 million, or $0.20 per diluted share, in the prior-year period. Adjusted net income2 increased $10.3 million to $16.8 million. Per diluted share, adjusted net income2 more than doubled to $0.48.
Adjusted EBITDA2 increased 27% to $31.5 million, and was 15.1% of consolidated sales, primarily as a result of increased profitability from higher sales.
Bookings were $195.9 million in the quarter. For the year, bookings totaled $808.1 million, resulting in a book-to-bill ratio of 1.02:1. Backlog at the end of the quarter was $599.2 million, the highest recorded for any year-end in the Company’s history.
Aerospace Segment Review (refer to sales by market and segment data in accompanying tables)
Aerospace Fourth Quarter 2024 Results (compared with the prior-year period, unless noted otherwise)
Record Aerospace segment sales of $188.5 million were up $19.8 million, or 11.7%. The improvement was driven by a 13.5% increase, or $16.7 million, in Commercial Transport sales. Growth was primarily related to increased demand by airlines for cabin power and inflight entertainment & connectivity (“IFEC”) products which are in the Electrical Power & Motion and Avionics product groups. This was somewhat offset by lower sales of commercial lighting and safety products resulting from the Boeing strike.
Military Aircraft sales increased $7.2 million, or 41.6%, to $24.5 million driven by increased demand for Lighting & Safety products as well as progress on the FLRAA program. General Aviation sales decreased $2.5 million, or 12.3%, to $17.7 million.
Aerospace segment operating profit of $16.8 million, or 8.9% of sales, improved over the prior-year period despite a $4.8 million true-up in legal reserves related to the previously discussed UK judgment, an increase of $3.0 million in litigation-related legal expenses, $1.7 million in warranty expense related to the previously-mentioned field modification, and a non-cash reserve associated with a customer bankruptcy of $1.0 million. Adjusted Aerospace operating profit2 was $30.2 million, or 16.0% of sales, reflecting the leverage gained on higher volume and improving production efficiencies.
Aerospace bookings were $182.5 million for a book-to-bill ratio of 0.97:1. Backlog for the Aerospace segment was $537.6 million at the end of 2024.
Mr. Gundermann commented, “Our Aerospace business continues to accelerate nicely, with consistent double-digit growth in revenue. Operating margin expansion validates the strong operating leverage of the business while 16.0% adjusted operating profit margin2 demonstrates solid progress towards our mid-teens target level. Demand remains strong with total bookings for the year of $733 million for a book-to-bill of 1.04, supporting our expectation of continued growth in 2025.”
Test Systems Segment Review (refer to sales by market and segment data in accompanying tables)
Test Systems Fourth Quarter 2024 Results (compared with the prior-year period, unless noted otherwise)
Test Systems segment sales were $20.0 million, down $6.6 million from a strong comparator quarter in 2023.
Test Systems segment operating loss was slightly below break-even, consistent with the fourth quarter of 2023. Additional restructuring initiatives were implemented in the 2024 fourth quarter, which are expected to provide annualized savings of approximately $4 million to $5 million, beginning in the first quarter of 2025. During the quarter, the closure of a third Test facility in the last two years was substantially completed. Operating loss for the fourth quarter includes $1.4 million in severance expense and the impact of contribution margin lost on lower sales volume. Adjusted operating profit margin2 was 7.3%, an improvement over the 2.5% of the comparator quarter, demonstrating the benefit from the restructuring initiatives implemented during 2024.
Bookings for the Test Systems segment in the quarter were $13.4 million, for a book-to-bill ratio of 0.67:1 for the quarter. Backlog was $61.7 million at the end of 2024.
Mr. Gundermann commented, “Our Test business initiated further restructuring during the fourth quarter to focus on the most critical initiatives going forward, including the radio test program for the U.S. Army, which is expected to enter volume production in the second half of 2025.”
Liquidity and Financing
Cash provided by operations in the fourth quarter of 2024 was $26.4 million, primarily the result of improved working capital management and higher non-cash adjustments impacting net income, including loss on debt extinguishment and legal expense and reserve increases. Cash on hand at the end of the quarter was $18.4 million. Capital expenditures in the quarter were $3.2 million and $8.4 million for the full year. Net debt was $156.6 million, down from $161.2 million at December 31, 2023.
On November 25, 2024, the Company amended the ABL Revolving Credit Facility, increasing the revolving credit line to $220 million with an interest rate of SOFR plus 2.75% to 3.25% (an increase of 0.25% to each such applicable margin). The Company had $10 million drawn on the facility at the end of 2024.
On December 3, 2024, the Company issued $165 million aggregate principal amount of 5.500% Convertible Senior Notes. The Notes will mature on March 15, 2030, unless earlier converted, redeemed or repurchased. The Company has the flexibility to settle the Notes in stock, cash or a combination of both. The Company’s intention is to minimize dilution by net share settling the Notes whenever possible.
The Company repaid in full all outstanding indebtedness on its Term Loan Facility, which consisted of a repayment of principal of approximately $54.9 million, plus accrued but unpaid interest, fees and expenses, including a call premium of $1.3 million, which satisfied all of the Company’s indebtedness obligations thereunder.
2025 Outlook
The Company expects 2025 revenue to be approximately $820 million to $860 million. The midpoint of this range would be a 6% increase over 2024 sales. Sales in the first quarter are projected to be approximately $190 million to $205 million, with subsequent quarters stepping up from there.
Backlog at December 31, 2024 was $599.2 million, a record year-end level.
Planned capital expenditures for 2025 are expected to be in the range of $35 million to $40 million. The higher level of expenditure is driven by a planned facility consolidation, additional capacity to handle anticipated growth and to compensate for constrained investment in recent years.
Mr. Gundermann concluded, “2024 was another year of strong double-digit growth for Astronics. We have averaged approximately 22% per year for the last three years. We expect growth to moderate in 2025, but margin improvement to continue. We begin the year with a strengthened balance sheet, an improving margin profile, and a record backlog. The signs are strong that 2025 will be a very good year for the Company.”
Fourth Quarter 2024 Webcast and Conference Call
The Company will host a teleconference today at 4:45 p.m. ET. During the teleconference, management will review the financial and operating results for the period and discuss Astronics’ corporate strategy and outlook. A question-and-answer session will follow.
The Astronics conference call can be accessed by calling (201) 493-6784. The listen-only audio webcast can be monitored at investors.astronics.com. To listen to the archived call, dial (412) 317-6671 and enter replay pin number 13751261. The telephonic replay will be available from 8:45 p.m. on the day of the call through Tuesday, March 18, 2025. The webcast replay can be accessed via the investor relations section of the Company’s website where a transcript will also be posted once available.
About Astronics Corporation
Astronics Corporation (Nasdaq: ATRO) serves the world’s aerospace, defense, and other mission-critical industries with proven innovative technology solutions. Astronics works side-by-side with customers, integrating its array of power, connectivity, lighting, structures, interiors, and test technologies to solve complex challenges. For over 50 years, Astronics has delivered creative, customer-focused solutions with exceptional responsiveness. Today, global airframe manufacturers, airlines, military branches, completion centers, and Fortune 500 companies rely on the collaborative spirit and innovation of Astronics. The Company’s strategy is to increase its value by developing technologies and capabilities that provide innovative solutions to its targeted markets.
Safe Harbor Statement
This news release contains forward-looking statements as defined by the Securities Exchange Act of 1934. One can identify these forward-looking statements by the use of the words “expect,” “anticipate,” “plan,” “may,” “will,” “estimate,” “feeling” or other similar expressions and include all statements with regard to the Company’s 2025 outlook, sales in the first quarter of 2025, the amount of capital expenditures for 2025, statements regarding the strategy of the Company and its outlook, the timing for the occurrence of the pending consequential hearing, the timing for the payment by Astronics of the final liability with respect to the infringement dispute with Lufthansa Technik AG, and the timing as to when any further appeal, if any, will occur. Forward-looking statements also include all statements related to achieving any revenue or profitability expectations, expectations of continued growth, the level of liquidity, the level of cash generation, the level of demand by customers and markets and the amount of expected capital expenditures. Because such statements apply to future events, they are subject to risks and uncertainties that could cause actual results to differ materially from those contemplated by the statements. Important factors that could cause actual results to differ materially from what may be stated here include the trend in growth with passenger power and connectivity on airplanes, the state of the aerospace and defense industries, the market acceptance of newly developed products, internal production capabilities, the timing of orders received, the status of customer certification processes and delivery schedules, the demand for and market acceptance of new or existing aircraft which contain the Company’s products, the impact of regulatory activity and public scrutiny on production rates of a major U.S. aircraft manufacturer, the need for new and advanced test and simulation equipment, customer preferences and relationships, the effectiveness of the Company’s supply chain, and other factors which are described in filings by Astronics with the Securities and Exchange Commission. Except as required by applicable law, the Company assumes no obligation to update forward-looking information in this news release whether to reflect changed assumptions, the occurrence of unanticipated events or changes in future operating results, financial conditions or prospects, or otherwise.
Use of Non-GAAP Financial Metrics and Additional Financial Information
In addition to reporting financial results in accordance with generally accepted accounting principles, or GAAP, Astronics provides Adjusted Non-GAAP information as additional information for its operating results. References to Adjusted Non-GAAP information are to non-GAAP financial measures. These measures are not required by, in accordance with, or an alternative for, GAAP and may be different from non-GAAP financial measures used by other companies. Astronics management uses these measures for reviewing the financial results of Astronics for budget planning purposes and for making operational and financial decisions. Management believes that providing these non-GAAP financial measures to investors, as a supplement to GAAP financial measures, help investors evaluate Astronics core operating and financial performance and business trends consistent with how management evaluates such performance and trends.
FINANCIAL TABLES FOLLOW
ASTRONICS CORPORATION |
|||||||||||||
CONSOLIDATED STATEMENT OF OPERATIONS DATA |
|||||||||||||
(Unaudited, $ in thousands except per share data) |
|||||||||||||
Three Months Ended |
Year Ended |
||||||||||||
12/31/2024 |
12/31/2023 |
12/31/2024 |
12/31/2023 |
||||||||||
Sales |
$ |
208,540 |
$ |
195,292 |
$ |
795,426 |
$ |
689,206 |
|||||
Cost of products sold |
158,486 |
155,319 |
627,084 |
568,410 |
|||||||||
Gross profit |
50,054 |
39,973 |
168,342 |
120,796 |
|||||||||
Gross margin |
24.0 |
% |
20.5 |
% |
21.2 |
% |
17.5 |
% |
|||||
Selling, general and administrative |
41,178 |
32,191 |
141,876 |
127,467 |
|||||||||
SG&A % of sales |
19.7 |
% |
16.5 |
% |
17.8 |
% |
18.5 |
% |
|||||
Income (loss) from operations |
8,876 |
7,782 |
26,466 |
(6,671 |
) |
||||||||
Operating margin |
4.3 |
% |
4.0 |
% |
3.3 |
% |
(1.0 |
)% |
|||||
Net gain on sale of business |
— |
— |
— |
3,427 |
|||||||||
Loss on extinguishment of debt |
3,161 |
— |
10,148 |
— |
|||||||||
Other expense (income) |
973 |
301 |
2,187 |
(261 |
) |
||||||||
Interest expense, net |
4,166 |
5,947 |
21,998 |
23,328 |
|||||||||
Income (loss) before tax |
576 |
1,534 |
(7,867 |
) |
(26,311 |
) |
|||||||
Income tax expense (benefit) |
3,408 |
(5,442 |
) |
8,348 |
110 |
||||||||
Net (loss) income |
$ |
(2,832 |
) |
$ |
6,976 |
$ |
(16,215 |
) |
$ |
(26,421 |
) |
||
Net (loss) income % |
(1.4 |
)% |
3.6 |
% |
(2.0 |
)% |
(3.8 |
)% |
|||||
Basic (loss) earnings per share: |
$ |
(0.08 |
) |
$ |
0.20 |
$ |
(0.46 |
) |
$ |
(0.80 |
) |
||
Diluted (loss) earnings per share: |
$ |
(0.08 |
) |
$ |
0.20 |
$ |
(0.46 |
) |
$ |
(0.80 |
) |
||
Weighted average diluted shares outstanding (in thousands) |
35,255 |
34,512 |
35,037 |
33,104 |
|||||||||
ASTRONICS CORPORATION |
|||||||||||||||
RECONCILIATION OF NET (LOSS) INCOME TO ADJUSTED EBITDA |
|||||||||||||||
(Unaudited, $ in thousands) |
|||||||||||||||
Consolidated |
|||||||||||||||
Three Months Ended |
Year Ended |
||||||||||||||
12/31/2024 |
12/31/2023 |
12/31/2024 |
12/31/2023 |
||||||||||||
Net (loss) income |
$ |
(2,832 |
) |
$ |
6,976 |
$ |
(16,215 |
) |
$ |
(26,421 |
) |
||||
Add back (deduct): |
|||||||||||||||
Interest expense |
4,166 |
5,947 |
21,998 |
23,328 |
|||||||||||
Income tax expense (benefit) |
3,408 |
(5,442 |
) |
8,348 |
110 |
||||||||||
Depreciation and amortization expense |
5,894 |
6,346 |
24,466 |
26,104 |
|||||||||||
Equity-based compensation expense |
2,157 |
1,595 |
8,571 |
7,198 |
|||||||||||
Early retirement penalty waiver |
624 |
— |
624 |
— |
|||||||||||
Non-cash annual stock bonus accrual3 |
— |
2,806 |
— |
2,806 |
|||||||||||
Non-cash 401K contribution and quarterly bonus accrual |
— |
2,776 |
3,454 |
6,549 |
|||||||||||
Restructuring-related charges including severance |
1,411 |
— |
2,444 |
564 |
|||||||||||
Legal reserve, settlements and recoveries |
4,762 |
— |
4,430 |
(2,532 |
) |
||||||||||
Litigation-related legal expenses |
6,066 |
3,826 |
19,746 |
17,850 |
|||||||||||
Equity investment accrued payable write-off |
— |
— |
— |
(1,800 |
) |
||||||||||
Net gain on sale of business |
— |
— |
— |
(3,427 |
) |
||||||||||
Loss on extinguishment of debt |
3,161 |
— |
10,148 |
— |
|||||||||||
Non-cash reserves for customer bankruptcy |
1,032 |
— |
3,235 |
11,074 |
|||||||||||
Warranty reserve |
1,690 |
— |
5,217 |
— |
|||||||||||
Deferred liability recovery |
— |
— |
— |
(5,824 |
) |
||||||||||
Adjusted EBITDA |
$ |
31,539 |
$ |
24,830 |
$ |
96,466 |
$ |
55,579 |
|||||||
Sales |
$ |
208,540 |
$ |
195,292 |
$ |
795,426 |
$ |
689,206 |
|||||||
Adjusted EBITDA margin % |
15.1 |
% |
12.7 |
% |
12.1 |
% |
8.1 |
% |
|||||||
Adjusted EBITDA is defined as net income before interest expense, income taxes, depreciation, amortization, and other adjustments. Adjusted EBITDA Margin is defined as Adjusted EBITDA divided by sales. Adjusted EBITDA and Adjusted EBITDA Margin are not measures determined in accordance with GAAP and may not be comparable with Adjusted EBITDA and Adjusted EBITDA Margin as used by other companies. Nevertheless, the Company believes that providing non-GAAP financial measures, such as Adjusted EBITDA and Adjusted EBITDA Margin, are important for investors and other readers of the Company’s financial statements.
ASTRONICS CORPORATION |
|||||||||||||||
RECONCILIATION OF GROSS PROFIT TO ADJUSTED GROSS PROFIT |
|||||||||||||||
(Unaudited, $ in thousands) |
|||||||||||||||
Consolidated |
|||||||||||||||
Three Months Ended |
Year Ended |
||||||||||||||
12/31/2024 |
12/31/2023 |
12/31/2024 |
12/31/2023 |
||||||||||||
Gross profit |
$ |
50,054 |
$ |
39,973 |
$ |
168,342 |
$ |
120,796 |
|||||||
Add back (deduct): |
|||||||||||||||
Warranty reserve |
1,690 |
— |
5,217 |
— |
|||||||||||
Non-cash reserves for customer bankruptcy |
794 |
— |
1,703 |
3,601 |
|||||||||||
Deferred liability recovery |
— |
— |
— |
(5,824 |
) |
||||||||||
Adjusted gross profit |
$ |
52,538 |
$ |
39,973 |
$ |
175,262 |
$ |
118,573 |
|||||||
Sales |
$ |
208,540 |
$ |
195,292 |
$ |
795,426 |
$ |
689,206 |
|||||||
Gross margin |
24.0 |
% |
20.5 |
% |
21.2 |
% |
17.5 |
% |
|||||||
Adjusted gross margin |
25.2 |
% |
20.5 |
% |
22.0 |
% |
17.2 |
% |
|||||||
Adjusted Gross Profit is defined as gross profit as reported, adjusted for certain items. Adjusted Gross Profit Margin is defined as Adjusted Gross Profit divided by sales. Adjusted Gross Profit and Adjusted Gross Margin are not measures determined in accordance with GAAP and may not be comparable with Adjusted Gross Profit and Adjusted Gross Profit Margin as used by other companies. Nevertheless, the Company believes that providing non-GAAP financial measures, such as Adjusted Gross Profit and Adjusted Gross Profit Margin, are important for investors and other readers of the Company’s financial statements and assists in understanding the comparison of the current quarter’s and current year’s gross profit and gross profit margin to the historical periods’ gross profit, as well as facilitates a more meaningful comparison of the Company’s gross profit and gross profit margin to that of other companies.
NOTE: Reconciliation of gross profit to adjusted gross profit for prior quarters can be found in the Supplemental Prior Period Tables at https://investors.astronics.com/.
ASTRONICS CORPORATION |
|||||||||||||||
RECONCILIATION OF OPERATING INCOME TO ADJUSTED OPERATING INCOME |
|||||||||||||||
(Unaudited, $ in thousands) |
|||||||||||||||
Consolidated |
|||||||||||||||
Three Months Ended |
Year Ended |
||||||||||||||
12/31/2024 |
12/31/2023 |
12/31/2024 |
12/31/2023 |
||||||||||||
Income (loss) from operations |
$ |
8,876 |
$ |
7,782 |
$ |
26,466 |
$ |
(6,671 |
) |
||||||
Add back (deduct): |
|||||||||||||||
Restructuring-related charges including severance |
1,411 |
— |
2,444 |
564 |
|||||||||||
Legal reserve, settlements and recoveries |
4,762 |
— |
4,430 |
(2,532 |
) |
||||||||||
Litigation-related legal expenses |
6,066 |
3,826 |
19,746 |
17,850 |
|||||||||||
Non-cash reserves for customer bankruptcy |
1,032 |
— |
3,235 |
11,074 |
|||||||||||
Warranty reserve |
1,690 |
— |
5,217 |
— |
|||||||||||
Deferred liability recovery |
— |
— |
— |
(5,824 |
) |
||||||||||
Adjusted operating income |
$ |
23,837 |
$ |
11,608 |
$ |
61,538 |
$ |
14,461 |
|||||||
Sales |
$ |
208,540 |
$ |
195,292 |
$ |
795,426 |
$ |
689,206 |
|||||||
Operating margin |
4.3 |
% |
4.0 |
% |
3.3 |
% |
(1.0 |
)% |
|||||||
Adjusted operating margin |
11.4 |
% |
5.9 |
% |
7.7 |
% |
2.1 |
% |
|||||||
Adjusted Operating Income is defined as income from operations as reported, adjusted for certain items. Adjusted Operating Margin is defined as Adjusted Operating Income divided by sales. Adjusted Operating Income and Adjusted Operating Margin are not measures determined in accordance with GAAP and may not be comparable with Adjusted Operating Income and Adjusted Operating Margin as used by other companies. Nevertheless, the Company believes that providing non-GAAP financial measures, such as Adjusted Operating Income and Adjusted Operating Margin, are important for investors and other readers of the Company’s financial statements and assists in understanding the comparison of the current quarter’s and current year’s income from operations to the historical periods’ income from operations and operating margin, as well as facilitates a more meaningful comparison of the Company’s income from operations and operating margin to that of other companies.
NOTE: Reconciliation of operating income to adjusted operating income for prior quarters can be found in the Supplemental Prior Period Tables at https://investors.astronics.com/.
ASTRONICS CORPORATION |
|||||||||||||||
RECONCILIATION OF NET INCOME AND DILUTED EARNINGS PER SHARE |
|||||||||||||||
TO ADJUSTED NET INCOME AND ADJUSTED DILUTED EARNINGS PER SHARE |
|||||||||||||||
(Unaudited, $ in thousands, except per share amounts) |
|||||||||||||||
Consolidated |
|||||||||||||||
Three Months Ended |
Year Ended |
||||||||||||||
12/31/2024 |
12/31/2023 |
12/31/2024 |
12/31/2023 |
||||||||||||
Net (loss) income |
$ |
(2,832 |
) |
$ |
6,976 |
$ |
(16,215 |
) |
$ |
(26,421 |
) |
||||
Add back (deduct): |
|||||||||||||||
Amortization of intangibles |
3,143 |
3,321 |
12,871 |
13,898 |
|||||||||||
Restructuring-related charges including severance |
1,411 |
— |
2,444 |
564 |
|||||||||||
Early retirement penalty waiver |
624 |
— |
624 |
— |
|||||||||||
Legal reserve, settlements and recoveries |
4,762 |
— |
4,430 |
(2,532 |
) |
||||||||||
Litigation-related legal expenses |
6,066 |
3,826 |
19,746 |
17,850 |
|||||||||||
Equity investment accrued payable write-off |
— |
— |
— |
(1,800 |
) |
||||||||||
Net gain on sale of business |
— |
— |
— |
(3,427 |
) |
||||||||||
Loss on extinguishment of debt |
3,161 |
— |
10,148 |
— |
|||||||||||
Non-cash reserves for customer bankruptcy |
1,032 |
— |
3,235 |
11,074 |
|||||||||||
Warranty reserve |
1,690 |
— |
5,217 |
— |
|||||||||||
Deferred liability recovery |
— |
— |
— |
(5,824 |
) |
||||||||||
Normalize tax rate4 |
(2,208 |
) |
(7,612 |
) |
(4,364 |
) |
(763 |
) |
|||||||
Adjusted net income |
$ |
16,849 |
$ |
6,511 |
$ |
38,136 |
$ |
2,619 |
|||||||
Weighted average diluted shares outstanding (in thousands) |
35,255 |
34,512 |
35,037 |
33,104 |
|||||||||||
Diluted earnings (loss) per share |
$ |
(0.08 |
) |
$ |
0.20 |
$ |
(0.46 |
) |
$ |
(0.80 |
) |
||||
Adjusted diluted earnings per share |
$ |
0.48 |
$ |
0.19 |
$ |
1.09 |
$ |
0.08 |
|||||||
Adjusted Net Income and Adjusted Diluted EPS are defined as net income and diluted EPS as reported, adjusted for certain items, including amortization of intangibles, and also adjusted for a normalized tax rate. Adjusted Net Income and Adjusted Diluted EPS are not measures determined in accordance with GAAP and may not be comparable with the measures used by other companies. Nevertheless, the Company believes that providing non-GAAP financial measures, such as Adjusted Net Income and Adjusted Diluted EPS, are important for investors and other readers of the Company’s financial statements and assists in understanding the comparison of the current quarter’s and current year’s net income and diluted EPS to the historical periods’ net income and diluted EPS, as well as facilitates a more meaningful comparison of the Company’s net income and diluted EPS to that of other companies. The Company believes that presenting Adjusted Diluted EPS provides a better understanding of its earnings power inclusive of adjusting for the non-cash amortization of intangible assets, reflecting the Company’s strategy to grow through acquisitions as well as organically.
NOTE: Reconciliation of net income to adjusted net income for prior quarters can be found in the Supplemental Prior Period Tables at https://investors.astronics.com/.
ASTRONICS CORPORATION |
|||||||||||||
SEGMENT SALES AND PROFIT |
|||||||||||||
(Unaudited, $ in thousands) |
|||||||||||||
Three Months Ended |
Year Ended |
||||||||||||
12/31/2024 |
12/31/2023 |
12/31/2024 |
12/31/2023 |
||||||||||
Sales |
|||||||||||||
Aerospace |
$ |
188,559 |
$ |
168,784 |
$ |
706,746 |
$ |
605,001 |
|||||
Less inter-segment |
(10 |
) |
(37 |
) |
(62 |
) |
(171 |
) |
|||||
Total Aerospace |
188,549 |
168,747 |
706,684 |
604,830 |
|||||||||
Test Systems |
20,084 |
26,545 |
88,874 |
84,376 |
|||||||||
Less inter-segment |
(93 |
) |
— |
(132 |
) |
— |
|||||||
Total Test Systems |
19,991 |
26,545 |
88,742 |
84,376 |
|||||||||
Total consolidated sales |
208,540 |
195,292 |
795,426 |
689,206 |
|||||||||
Segment gross profit and margins |
|||||||||||||
Aerospace |
45,040 |
35,202 |
157,667 |
104,882 |
|||||||||
23.9 |
% |
20.9 |
% |
22.3 |
% |
17.3 |
% |
||||||
Test Systems |
5,014 |
4,771 |
10,675 |
15,914 |
|||||||||
25.1 |
% |
18.0 |
% |
12.0 |
% |
18.9 |
% |
||||||
Total gross profit |
50,054 |
39,973 |
168,342 |
120,796 |
|||||||||
Segment operating profit and margins |
|||||||||||||
Aerospace |
16,778 |
14,287 |
62,406 |
24,629 |
|||||||||
8.9 |
% |
8.5 |
% |
8.8 |
% |
4.1 |
% |
||||||
Test Systems |
(49 |
) |
(224 |
) |
(8,477 |
) |
(8,745 |
) |
|||||
(0.2 |
)% |
(0.8 |
)% |
(9.6 |
)% |
(10.4 |
)% |
||||||
Total segment operating profit |
16,729 |
14,063 |
53,929 |
15,884 |
|||||||||
Net gain on sale of business |
— |
— |
— |
3,427 |
|||||||||
Loss on extinguishment of debt |
3,161 |
— |
10,148 |
— |
|||||||||
Interest expense |
4,166 |
5,947 |
21,998 |
23,328 |
|||||||||
Corporate expenses and other |
8,826 |
6,582 |
29,650 |
22,294 |
|||||||||
Income (loss) before taxes |
$ |
576 |
$ |
1,534 |
$ |
(7,867 |
) |
$ |
(26,311 |
) |
|||
NOTE: Segment gross profit for prior quarters can be found in the Supplemental Prior Period Tables at https://investors.astronics.com/.
ASTRONICS CORPORATION |
|||||||||||||||
RECONCILIATION OF SEGMENT OPERATING PROFIT TO ADJUSTED SEGMENT OPERATING PROFIT |
|||||||||||||||
(Unaudited, $ in thousands) |
|||||||||||||||
Three Months Ended |
Year Ended |
||||||||||||||
12/31/2024 |
12/31/2023 |
12/31/2024 |
12/31/2023 |
||||||||||||
Aerospace operating profit |
$ |
16,778 |
$ |
14,287 |
$ |
62,406 |
$ |
24,629 |
|||||||
Restructuring-related charges including severance |
— |
— |
237 |
— |
|||||||||||
Legal reserve, settlements and recoveries |
4,762 |
— |
4,430 |
(2,532 |
) |
||||||||||
Litigation-related legal expenses |
5,966 |
2,948 |
19,127 |
9,727 |
|||||||||||
Non-cash reserves for customer bankruptcy |
1,032 |
— |
3,235 |
11,074 |
|||||||||||
Warranty reserve |
1,690 |
— |
5,217 |
— |
|||||||||||
Adjusted Aerospace operating profit |
$ |
30,228 |
$ |
17,235 |
$ |
94,652 |
$ |
42,898 |
|||||||
Aerospace sales |
$ |
188,549 |
$ |
168,747 |
$ |
706,684 |
$ |
604,830 |
|||||||
Aerospace margin |
8.9 |
% |
8.5 |
% |
8.8 |
% |
4.1 |
% |
|||||||
Adjusted Aerospace margin |
16.0 |
% |
10.2 |
% |
13.4 |
% |
7.1 |
% |
|||||||
Test Systems operating loss |
$ |
(49 |
) |
$ |
(224 |
) |
$ |
(8,477 |
) |
$ |
(8,745 |
) |
|||
Restructuring-related charges including severance |
1,411 |
— |
2,207 |
564 |
|||||||||||
Litigation-related legal expenses |
100 |
878 |
619 |
8,123 |
|||||||||||
Deferred liability recovery |
— |
— |
— |
(5,824 |
) |
||||||||||
Adjusted Test Systems operating profit (loss) |
$ |
1,462 |
$ |
654 |
$ |
(5,651 |
) |
$ |
(5,882 |
) |
|||||
Test Systems sales |
$ |
19,991 |
$ |
26,545 |
$ |
88,742 |
$ |
84,376 |
|||||||
Test Systems margin |
(0.2 |
)% |
(0.8 |
)% |
(9.6 |
)% |
(10.4 |
)% |
|||||||
Adjusted Test Systems margin |
7.3 |
% |
2.5 |
% |
(6.4 |
)% |
(7.0 |
)% |
|||||||
Adjusted Segment Operating Profit is defined as segment operating profit as reported, adjusted for certain items. Adjusted Segment Margin is defined as Adjusted Segment Operating Profit divided by segment sales. Adjusted Segment Operating Profit and Adjusted Segment Margin are not measures determined in accordance with GAAP and may not be comparable with Adjusted Segment Operating Profit and Adjusted Segment Margin as used by other companies. Nevertheless, the Company believes that providing non-GAAP financial measures, such as Adjusted Segment Operating Profit and Adjusted Segment Margin, are important for investors and other readers of the Company’s financial statements and assists in understanding the comparison of the current quarter’s and current year’s segment operating profit to the historical periods’ segment operating profit and segment margin, as well as facilitates a more meaningful comparison of the Company’s segment operating profit and segment margin to that of other companies.
NOTE: Reconciliation of segment operating profit to adjusted segment operating profit for prior quarters can be found in the Supplemental Prior Period Tables at https://investors.astronics.com/.
ASTRONICS CORPORATION |
|||||||
CONSOLIDATED BALANCE SHEETS |
|||||||
($ in thousands) |
|||||||
(unaudited) |
|||||||
12/31/2024 |
12/31/2023 |
||||||
ASSETS |
|||||||
Current assets: |
|||||||
Cash and cash equivalents |
$ |
9,285 |
$ |
4,756 |
|||
Restricted cash |
9,143 |
6,557 |
|||||
Accounts receivable, net of allowance of estimated credit losses |
191,446 |
172,108 |
|||||
Inventories |
199,741 |
191,801 |
|||||
Prepaid and other current assets |
16,557 |
14,560 |
|||||
Total current assets |
426,172 |
389,782 |
|||||
Property, plant and equipment, net of accumulated depreciation |
80,687 |
85,436 |
|||||
Operating right-of-use assets |
23,609 |
27,909 |
|||||
Other assets |
7,763 |
7,035 |
|||||
Intangible assets, net of accumulated amortization |
52,477 |
65,420 |
|||||
Goodwill |
58,056 |
58,210 |
|||||
Total assets |
$ |
648,764 |
$ |
633,792 |
|||
LIABILITIES AND SHAREHOLDERS’ EQUITY |
|||||||
Current liabilities: |
|||||||
Current maturities of long-term debt |
$ |
— |
$ |
8,996 |
|||
Accounts payable |
42,960 |
61,134 |
|||||
Accrued payroll and employee benefits |
33,409 |
22,038 |
|||||
Accrued income taxes |
6,678 |
3,045 |
|||||
Current operating lease liabilities |
4,697 |
5,069 |
|||||
Other accrued expenses |
40,917 |
21,023 |
|||||
Customer advances and deferred revenue |
27,491 |
22,029 |
|||||
Total current liabilities |
156,152 |
143,334 |
|||||
Long-term debt |
168,669 |
159,237 |
|||||
Supplemental retirement plan and other liabilities for pension benefits |
24,088 |
29,290 |
|||||
Long-term operating lease liabilities |
20,508 |
24,376 |
|||||
Other liabilities |
21,816 |
26,730 |
|||||
Deferred income taxes |
1,434 |
1,307 |
|||||
Total liabilities |
392,667 |
384,274 |
|||||
Shareholders’ equity: |
|||||||
Common stock |
329 |
314 |
|||||
Convertible Class B stock |
51 |
59 |
|||||
Additional paid-in capital |
144,149 |
129,544 |
|||||
Accumulated other comprehensive loss |
(3,863 |
) |
(9,426 |
) |
|||
Retained earnings |
192,208 |
209,753 |
|||||
Treasury stock |
(76,777 |
) |
(80,726 |
) |
|||
Total shareholders’ equity |
256,097 |
249,518 |
|||||
Total liabilities and shareholders’ equity |
$ |
648,764 |
$ |
633,792 |
|||
ASTRONICS CORPORATION |
|||||||
CONSOLIDATED CASH FLOWS DATA |
|||||||
Year Ended |
|||||||
(Unaudited, $ in thousands) |
December 31, 2024 |
December 31, 2023 |
|||||
Cash flows from operating activities: |
|||||||
Net loss |
$ |
(16,215 |
) |
$ |
(26,421 |
) |
|
Adjustments to reconcile net loss to cash from operating activities: |
|||||||
Non-cash items: |
|||||||
Depreciation and amortization |
24,466 |
26,104 |
|||||
Amortization of deferred financing fees |
3,194 |
3,023 |
|||||
Provisions for non-cash losses on inventory and receivables |
13,782 |
16,003 |
|||||
Equity-based compensation expense |
8,571 |
7,198 |
|||||
Loss on extinguishment of debt |
10,148 |
— |
|||||
Deferred tax (benefit) expense |
(20 |
) |
146 |
||||
Operating lease non-cash expense |
5,175 |
5,088 |
|||||
Non-cash 401K contribution and quarterly bonus accrual |
3,454 |
6,549 |
|||||
Non-cash annual stock bonus accrual |
— |
2,806 |
|||||
Net gain on sale of business, before taxes |
— |
(3,427 |
) |
||||
Non-cash litigation provision adjustment |
4,468 |
(1,305 |
) |
||||
Non-cash deferred liability recovery |
— |
(5,824 |
) |
||||
Other |
5,807 |
1,913 |
|||||
Cash flows from changes in operating assets and liabilities: |
|||||||
Accounts receivable |
(21,983 |
) |
(31,872 |
) |
|||
Inventories |
(21,551 |
) |
(13,283 |
) |
|||
Accounts payable |
(17,693 |
) |
(4,495 |
) |
|||
Accrued expenses |
21,987 |
4,634 |
|||||
Income taxes |
4,498 |
(1,949 |
) |
||||
Customer advanced payments and deferred revenue |
5,693 |
(4,835 |
) |
||||
Operating lease liabilities |
(5,125 |
) |
(4,880 |
) |
|||
Supplemental retirement plan liabilities |
(410 |
) |
(408 |
) |
|||
Other assets and liabilities |
2,320 |
1,285 |
|||||
Net cash provided (used) by operating activities |
30,566 |
(23,950 |
) |
||||
Cash flows from investing activities: |
|||||||
Proceeds on sale of businesses and assets |
— |
3,537 |
|||||
Capital expenditures |
(8,428 |
) |
(7,643 |
) |
|||
Net cash used by investing activities |
(8,428 |
) |
(4,106 |
) |
|||
Cash flows from financing activities: |
|||||||
Proceeds from long-term debt |
377,392 |
139,732 |
|||||
Principal payments on long-term debt |
(374,890 |
) |
(131,233 |
) |
|||
Stock award and employee stock purchase plan activity |
(241 |
) |
2,476 |
||||
Proceeds from at-the-market stock sales |
— |
21,269 |
|||||
Financing-related costs |
(12,150 |
) |
(6,762 |
) |
|||
Financing extinguishment costs |
(4,496 |
) |
— |
||||
Other |
(145 |
) |
(47 |
) |
|||
Net cash (used) provided by financing activities |
(14,530 |
) |
25,435 |
||||
Effect of exchange rates on cash |
(493 |
) |
156 |
||||
Increase (decrease) in cash and cash equivalents and restricted cash |
7,115 |
(2,465 |
) |
||||
Cash and cash equivalents and restricted cash at beginning of year |
11,313 |
13,778 |
|||||
Cash and cash equivalents and restricted cash at end of year |
$ |
18,428 |
$ |
11,313 |
|||
Supplemental disclosure of cash flow information |
|||||||
Interest paid |
$ |
19,238 |
$ |
17,689 |
|||
Income taxes paid, net of refunds |
$ |
3,537 |
$ |
1,964 |
|||
ASTRONICS CORPORATION |
|||||||||||||||
SALES BY MARKET |
|||||||||||||||
(Unaudited, $ in thousands) |
|||||||||||||||
Three Months Ended |
Year Ended |
2024 YTD |
|||||||||||||
12/31/2024 |
12/31/2023 |
% change |
12/31/2024 |
12/31/2023 |
% change |
% of Sales |
|||||||||
Aerospace Segment |
|||||||||||||||
Commercial Transport |
$ |
140,893 |
$ |
124,183 |
13.5 |
% |
$ |
524,572 |
$ |
432,199 |
21.4 |
% |
65.9 |
% |
|
Military Aircraft |
24,474 |
17,282 |
41.6 |
% |
88,019 |
61,617 |
42.8 |
% |
11.1 |
% |
|||||
General Aviation |
17,701 |
20,186 |
(12.3 |
)% |
74,344 |
80,842 |
(8.0 |
)% |
9.3 |
% |
|||||
Other |
5,481 |
7,096 |
(22.8 |
)% |
19,749 |
30,172 |
(34.5 |
)% |
2.5 |
% |
|||||
Aerospace Total |
188,549 |
168,747 |
11.7 |
% |
706,684 |
604,830 |
16.8 |
% |
88.8 |
% |
|||||
Test Systems Segment5 |
|||||||||||||||
Government & Defense |
19,991 |
26,545 |
(24.7 |
)% |
88,742 |
84,376 |
5.2 |
% |
11.2 |
% |
|||||
Total Sales |
$ |
208,540 |
$ |
195,292 |
6.8 |
% |
$ |
795,426 |
$ |
689,206 |
15.4 |
% |
|||
SALES BY PRODUCT LINE |
|||||||||||||||
(Unaudited, $ in thousands) |
|||||||||||||||
Three Months Ended |
Year Ended |
2024 YTD |
|||||||||||||
12/31/2024 |
12/31/2023 |
% change |
12/31/2024 |
12/31/2023 |
% change |
% of Sales |
|||||||||
Aerospace Segment |
|||||||||||||||
Electrical Power & Motion |
$ |
95,124 |
$ |
82,337 |
15.5 |
% |
$ |
359,043 |
$ |
268,049 |
33.9 |
% |
45.1 |
% |
|
Lighting & Safety |
44,241 |
40,467 |
9.3 |
% |
179,403 |
157,434 |
14.0 |
% |
22.6 |
% |
|||||
Avionics |
36,467 |
30,106 |
21.1 |
% |
120,183 |
113,117 |
6.2 |
% |
15.1 |
% |
|||||
Systems Certification |
4,731 |
6,423 |
(26.3 |
)% |
17,003 |
26,255 |
(35.2 |
)% |
2.1 |
% |
|||||
Structures |
2,505 |
2,318 |
8.1 |
% |
11,303 |
9,803 |
15.3 |
% |
1.4 |
% |
|||||
Other |
5,481 |
7,096 |
(22.8 |
)% |
19,749 |
30,172 |
(34.5 |
)% |
2.5 |
% |
|||||
Aerospace Total |
188,549 |
168,747 |
11.7 |
% |
706,684 |
604,830 |
16.8 |
% |
88.8 |
% |
|||||
Test Systems Segment5 |
19,991 |
26,545 |
(24.7 |
)% |
88,742 |
84,376 |
5.2 |
% |
11.2 |
% |
|||||
Total Sales |
$ |
208,540 |
$ |
195,292 |
6.8 |
% |
$ |
795,426 |
$ |
689,206 |
15.4 |
% |
|||
ASTRONICS CORPORATION |
||||||||||
ORDER AND BACKLOG TREND |
||||||||||
(Unaudited, $ in thousands) |
||||||||||
|
Q1 2024 |
Q2 2024 |
Q3 2024 |
Q4 2024 |
Trailing Twelve Months |
||||||
3/30/2024 |
6/29/2024 |
9/28/2024 |
12/31/2024 |
12/31/2024 |
||||||
Sales |
||||||||||
Aerospace |
$ |
163,638 |
$ |
176,943 |
$ |
177,554 |
$ |
188,549 |
$ |
706,684 |
Test Systems |
21,436 |
21,171 |
26,144 |
19,991 |
88,742 |
|||||
Total Sales |
$ |
185,074 |
$ |
198,114 |
$ |
203,698 |
$ |
208,540 |
$ |
795,426 |
Bookings |
||||||||||
Aerospace |
$ |
184,149 |
$ |
192,515 |
$ |
173,569 |
$ |
182,474 |
$ |
732,707 |
Test Systems |
19,986 |
26,359 |
15,597 |
13,430 |
75,372 |
|||||
Total Bookings |
$ |
204,135 |
$ |
218,874 |
$ |
189,166 |
$ |
195,904 |
$ |
808,079 |
Backlog |
||||||||||
Aerospace6 |
$ |
532,051 |
$ |
547,623 |
$ |
543,638 |
$ |
537,563 |
||
Test Systems |
73,586 |
78,774 |
68,227 |
61,666 |
||||||
Total Backlog |
$ |
605,637 |
$ |
626,397 |
$ |
611,865 |
$ |
599,229 |
N/A |
|
Book:Bill Ratio |
||||||||||
Aerospace |
1.13 |
1.09 |
0.98 |
0.97 |
1.04 |
|||||
Test Systems |
0.93 |
1.25 |
0.60 |
0.67 |
0.85 |
|||||
Total Book:Bill |
1.10 |
1.10 |
0.93 |
0.94 |
1.02 |
|||||
_______________________ 1 Adjusted EBITDA and adjusted EBITDA margin are Non-GAAP financial measures. Please see the reconciliation of GAAP to non-GAAP financial measures in the tables that accompany this release. 2 Adjusted gross profit, adjusted gross margin, adjusted operating income, adjusted operating margin, adjusted segment operating profit, adjusted segment operating margin, adjusted EBITDA, adjusted EBITDA margin, adjusted net income and adjusted diluted earnings per share (“EPS”) are Non-GAAP financial measures. Please see the reconciliation of GAAP to non-GAAP financial measures in the tables that accompany this release. 3 The sum of the four discrete quarters for the year ended December 31, 2024 does not sum to the zero balance shown for the full year. In the first quarter of 2024, it was assumed that annual incentive compensation would be paid in stock, and thus such amount ($1.4 million) was presented as an addback for Adjusted EBITDA purposes. In the fourth quarter of 2024, it was concluded that all annual incentive compensation amounts would be paid in cash, and thus the addback for the full year has been eliminated. A reconciling adjustment has not been made to the quarter ended December 31, 2024 as it is deemed unnecessarily distortive to the Adjusted EBITDA measure for the quarter. 4 Applies a normalized tax rate of 25% to GAAP pre-tax income and non-GAAP adjustments above, which are each pre-tax. 5 Test Systems sales in the year ended December 31, 2023 included a $5.8 million reversal of a deferred revenue liability recorded with a previous acquisition. 6 In October of 2024, a customer reported within the Aerospace segment declared bankruptcy. Aerospace and Total Backlog included $9.3 million related to that customer. In the table and bar chart presented above, Aerospace and Total Bookings was reduced by $9.3 million, in the periods in which the original bookings occurred. While the customer has not cancelled those orders and seeks to reorganize and continue operations, we have removed all outstanding backlog until additional information is available to confirm whether those orders are expected to be satisfied. For a customer bankruptcy that occurred during 2023, Aerospace and Total Bookings of $2.6 million and $17.2 million was removed in second and third quarters of 2021, respectively.
View source version on businesswire.com: https://www.businesswire.com/news/home/20250304643339/en/
For more information, contact: Company: Nancy L. Hedges, Chief Financial Officer Phone: (716) 805-1599, ext. 159 Email: nancy.hedges@astronics.com
Investor Relations: Deborah K. Pawlowski, Alliance Advisors LLC Phone: (716) 843-3908 Email: dpawlowski@allianceadvisors.com
Source: Astronics Corporation