

30 May 2025
Invinity Energy Systems plc
("Invinity" or the "Company")
2024 Financial Results
Invinity Energy Systems plc (AIM: IES) (OTCQX: IESVF), a leading global manufacturer of utility-grade energy storage, announces its Full Year Results for the year ended 31 December 2024.
The Company confirms that its trading results are in line with expectations and largely reflect a shift in Invinity's product line from the VS3 to the ENDURIUM battery. As stated in the recent trading update, Invinity continues to deliver against its key corporate objectives including important progress made in respect of the ENDURIUM product development roadmap. As a result, the Company remains on track to achieve its cost reduction targets while continuing to iteratively develop the ENDURIUM product to further enhance performance and expand its capabilities in order to reach new markets and customers.
Highlights
Financial
· First revenues recognised against ENDURIUM product deliveries;
· 20% improvement in adjusted EBITDA loss to £18.0m (2023: £22.4m);
· Total Income: £5.0m (2023: £22.0m);
· Total Cash: £32.4m (2023: £5m);
· The Group remains debt free.
Commercial and Operational
· >5.4 GWh of energy dispatched to date from Invinity batteries (since Q1 2022);
· Successful launch of next-generation ENDURIUM product in December 2024;
· First ENDURIUM battery system operating in line with expectations at Gamesa Electric's V-iOn project at La Plana;
· 24% cost reduction achieved on ENDURIUM product in 2025 YTD vs first order;
· +315% increase in average deal size in 2025 YTD vs 2024 FY, with further growth expected to be driven by the Company's battery technology being considered for numerous projects relating to global Long Duration Energy Storage ("LDES") procurement programmes including, but not limited to, the UK's LDES Cap and Floor Scheme.
The Company will hold a virtual meeting for analysts at 9.30 a.m. today. Analysts wishing to attend are kindly requested to email ir@invinity.com to receive dial-in details.
Invinity's management team will also host a results presentation and Q&A for all shareholders on Monday 9 June 2025 at 4.30 p.m. Those wishing to join the session can sign up to Investor Meet Company for free via this link.
The Company's 2024 Annual Report will be available to download from the Company's website shortly.
Notice of Cancellation of Trading on the AQSE Growth Market ('Aquis')
Additionally, further to the announcement made in the trading update on 31 March, the Company today gives notice of cancellation of trading on AQSE. As the Company will retain its AIM listing on the London Stock Exchange, the Company is not required to send a circular and seek shareholder approval of a resolution to cancel in accordance with Rule 5.3 of the AQSE Growth Market Access Rulebook. In accordance with the procedures of the AQSE Growth Market, the Board anticipates the cancellation will be completed on or around 4.30 p.m. on 30 June 2025.
Jonathan Marren, Chief Executive Officer at Invinity said:
"These results speak to a very important year for the Company which saw us execute an important transition to our new ENDURIUM battery product, a successful funding round and a change in management team. In just the past few weeks, we have met with high-level government officials, featured in national news coverage and further advanced commercial discussions with prospective customers. These recent developments firmly underline the significant shift we are currently observing across global battery markets towards the next generation of energy storage technologies and I firmly believe we are in a strong position to take our place at the forefront of this shift.
"As detailed in my report, we still have challenges to overcome and although we have made strong progress against the corporate targets I set out when I took over as CEO, there is more work to be done if we are to compete at the scale we envision and convert the demand we are seeing for our products into revenue. However, I remain confident in our team's ability to deliver and believe there is much to be excited about in Invinity's short-, medium- and long-term future."
Stay up to date with news from Invinity. Join the distribution list for the Company's monthly investor newsletter here.
Enquiries:
|
Invinity Energy Systems plc |
+44 (0)20 4551 0361 |
|
Jonathan Marren, Chief Executive Officer Joe Worthington, Senior Director, Corporate Affairs |
|
|
Canaccord Genuity (Nominated Adviser and Joint Broker) |
+44 (0)20 7523 8000 |
|
Henry Fitzgerald-O'Connor / Harry Pardoe / Charlie Hammond |
|
|
VSA Capital (Financial Adviser and Joint Broker) |
+44 (0)20 3005 5000 |
|
Andrew Monk / Andrew Raca |
Notes to Editors
Invinity Energy Systems plc (AIM: IES) (OTCQX: IESVF) manufactures vanadium flow batteries for large-scale, high-throughput energy storage requirements of business, industry and electrical networks.
Invinity's factory-built flow batteries run continually with no degradation for over 25 years, making them suitable for the most demanding applications in renewable energy production. Energy storage systems based on Invinity's batteries are safe, reliable, and economical, and range in size from less than 250 kilowatt-hours to tens of megawatt-hours.
Invinity was created in April 2020 through the merger of two flow battery industry leaders: redT energy plc and Avalon Battery Corporation. With more than 190 MWh of systems deployed, contracted for delivery or awarded for projects across more than 90 sites in 17 countries, Invinity is active in all major global energy storage markets and has operations in the UK, Canada, USA and China. Invinity Energy Systems plc is quoted in the UK on AIM and trades in the USA on OTCQX.
To find out more, visit invinity.com, sign up to our monthly Investor Newsletter here or contact Investor Relations on via +44 (0)20 4551 0361 or ir@invinity.com.
Audited Financial Results for the Year Ended 31 December 2024
Introducing ENDURIUM - Charging the Future
Matt Harper, President & Chief Commercial Officer
Delivering Abundance
Launching ENDURIUM, our next-generation vanadium flow battery, at the end of 2024 was a massive step forward for Invinity.
Around the world, governments and regulators are focused on securing domestic energy supply. As renewable generation is becoming widely accepted as the way to achieve that goal at the lowest economic and environmental cost, longer duration energy storage ("LDES") that can stabilise intermittent renewables is increasingly acknowledged as a critical component of the future grid.
We and our development partner Gamesa Electric conceived ENDURIUM to deliver the durable, flexible, safe and low-cost energy storage capabilities that will fill this need. Capable of serving both megawatt-scale industrial sites and datacentres as well as gigawatt-scale projects for the electric grid, it is proving to be up to the challenge of resolving the most difficult supply-and-demand imbalances within our rapidly evolving energy landscape.
Gamesa's support since 2021 has been vital to delivering a product driven by market fundamentals and customer needs. With our first ENDURIUM delivery operating as expected at their wind, solar and battery test site in La Plana, Spain, we are convinced more than ever that ENDURIUM has what it takes to be the path to our "north star" - a battery that delivers energy on demand at lower cost than any conventional fuel-based generation.
Benefits of ENDURIUM - Bigger, Better, Faster, Stronger
To deliver on its promise, ENDURIUM must first and foremost be reliable and robust, and so it was important that the product be based on our proven vanadium flow battery technology. From there, we went back to the drawing board to design a scalable and adaptable hardware and software platform that would far exceed our customers' expectations while serving their most challenging storage needs.
Like all of Invinity's flow batteries, ENDURIUM's capacity does not degrade with use, making it ideal for high-throughput projects whether they be standalone systems or collocated with intermittent wind or solar generation. High safety and low noise characteristics also help to streamline planning permission.
Specifically, just like its predecessors, ENDURIUM features:
· No battery fire risk;
· 100% depth of discharge cycles over 100% of its lifetime;
· Limitless cycling anywhere within its state of charge range;
· Industry-standard interfaces to a wide variety of off-the-shelf power converters;
· Eliminated reliance on noisy, power-hungry air conditioners for cooling; and
· An asset life of 25 years or more.
· Enhanced battery round-trip efficiency of 75%
· Significantly reduced up-front capital cost,
· A projected 75% reduction in maintenance and service costs,
· Greater operational flexibility with discharge cycles from 3 to 18 hours;
· Significantly reduced installation complexity, and
· Next-generation, AI-enhanced monitoring and optimisation software.
These critical characteristics, confirmed by global assurance and risk leader DNV, give operators an inherently safe and long-term asset which costs nothing to cycle. This means they can dispatch renewable power at near-zero marginal cost, making reliable wind and solar power for our homes and businesses an achievable goal.
Finally, ENDURIUM's compact design enables our customers to deploy significantly more energy storage capacity on their sites compared to our previous products. This enhanced site energy density is particularly relevant as battery storage and general LDES projects are becoming larger and larger, meaning that our customers now have an increasingly proven LDES product that is suitable for more of their sites at a lower total cost.
Market Opportunities - Primed to Charge
As the year-on-year growth of renewable generation continues, policymakers, utilities and large utility buyers are looking to LDES to maintain the ability to deliver firm, dispatchable power while continuing to adopt more low-cost, low-carbon energy. Policies and programmes that seek to stabilise the grid while reducing reliance on costly imports or hydrocarbon-fuelled peaking capacity are at the forefront of decision-makers' minds. LDES solutions delivering six to ten hours of firm daily capacity are now widely viewed as the best solution, a capability right in ENDURIUM's sweet spot.
Policymakers and developers are also considering the environmental and human impact of large-scale storage. Lithium battery fires, notably the one in January 2025 that destroyed a significant portion of one of the largest batteries in the world at Moss Landing in California, have highlighted the need for safer solutions. Recent geopolitical shifts are already disrupting supply chains for the critical minerals needed for many conventional battery solutions, increasing costs for those devices. And replacing conventional generation with offshore-manufactured, renewable equipment means the loss of good, durable jobs.
For these reasons, LDES programs and policies are increasingly favouring non-lithium-ion technologies. The UK's LDES Cap & Floor scheme, Ontario's Long Lead Time Resources solicitation and comparable programmes in California, New York, Australia and elsewhere are increasingly minimising or discouraging lithium eligibility. Independently, each of these aims to deploy gigawatt-hours of LDES capacity on their respective grids by 2030; together, they represent a massive opportunity for ENDURIUM.
Importantly, these specialised schemes and market-based incentives move beyond the earlier grant-funded demonstration scale projects and are giving a beneficial boost to drive highly scalable, economically viable future LDES deployment at scale.
Domestic Solutions for Domestic Problems
At the same time, recent macro events underscore the need for energy security. In early February 2025, several Baltic countries disconnected from the Russian electric grid. Several U.S. jurisdictions, including California and across the Midwest, regularly see renewable energy supply exceed demand, necessitating wasteful curtailment of gigawatts of power. In late 2024 an interconnector fault between the UK and Norway put severe strain on the UK's grid, narrowly avoiding blackouts. Spain was less lucky, with interconnectors to France tripping ahead of a massive power outage on 28 April 2025. While grid reliability is critical, cost is a close second. UK consumers continue to pay for wind curtailment in times of low demand, while relying heavily on expensive gas generation to deliver capacity at peak times. These costs weigh on both economic competitiveness and family budgets. A better solution is needed.
ENDURIUM is a natural fit to deliver made-at-home solutions to improving grid reliability and decreasing the cost of power. Made in Britain and in Canada, it has the flexibility to deliver sub-second regulation to multi-hour energy shifting. Unlike pumped hydro, which requires specific geography, or lithium-ion, whose safety risks and noise mean they struggle to be installed close to homes or businesses, Invinity's batteries can be installed practically anywhere, solving wind or solar intermittency or alleviating critical grid constraints wherever the need arises.
Valuing Abundance
Today's LDES policy initiatives are the starting gun in the race to deliver abundant, low-cost, clean energy on demand. Grids will require ever more flexibility to accommodate an increasing amount of low-cost but intermittent renewable generation. Choosing the right storage solutions, meaning ones that deliver flexibility from milliseconds to hours, are safe and quiet enough to be installed alongside homes and businesses, and whose manufacture contributes to our domestic economy is critical. ENDURIUM is up to the task.
Low cost, reliable and clean power is the answer to reducing dependency on expensive, carbon-emitting generation. The momentum generated by supportive LDES policy has given important clarity to investors and developers alike to drive market-based solutions for this toughest of energy challenges. With ENDURIUM now commercially proven, developers and grid operators have the right tool for large scale energy storage wherever it is needed.
Chairman's Report: Powering Through
2024 felt like the year that the shift to long duration energy storage ("LDES") began to happen in a meaningful way. Supportive government policies appeared in many of the major energy storage markets to enable the increased supply of renewable generation. In Europe, renewables now make up nearly 50% of total electricity supply, compared to less than 20% just six years ago. Similar trends can be seen in the UK, the United States, Australia and other parts of the world. How grid operators balance their network is now a key question and LDES is increasingly seen as an essential part of the answer. We are entering the next phase of the global energy transition, and Invinity's vanadium flow batteries are well-placed to take advantage of this opportunity.
These major policy developments came with a degree of market uncertainty which temporarily slowed commercial activity and pushed out project timelines. Whilst this uncertainty still persists in some markets such as the United States, the ever-evolving policy landscape has presented significant opportunities for Invinity in other markets. For instance, the UK's LDES Cap and Floor scheme is designed to support gigawatt hours of projects for which our vanadium flow batteries are well-suited - underlined by the announcement in February 2025 that leading developer Frontier Power will target the deployment of up to 2 GWh of Invinity batteries in the UK through this scheme.
Falling competitor costs remain a key commercial consideration, but I am so far delighted with the team's response to this ongoing challenge. Key milestones have been met in terms of product launch and our first ENDURIUM batteries have already been delivered to our long-term partner, Gamesa Electric, and are operating in line with expectations. The team has also made significant progress towards hitting our cost targets for ENDURIUM, and whilst the team will always continue to work on reducing costs and improving performance, their achievements to date should be recognised.
I feel Invinity now finds itself with the right product in the right markets at the right time - a view shared by those new and existing investors who participated in a successful £57.4 million fundraise the team completed in May 2024. Notably, this funding round brought in the support of the UK Government via the National Wealth Fund, which in the process has become our largest shareholder. Their support, along with that of our other institutional and strategic investors, has been instrumental in enhancing our credibility. The funds raised have been put to work, including expanding Invinity's manufacturing capability and more recently deploying ringfenced capital into our own projects, most notably the LoDES project which we expect to become an important commercial asset for the Company at a time of major demand for LDES battery technology in the UK and globally.
In July, I was delighted to welcome so many of you to our capital markets day, held at our facilities in Scotland. The event presented an important opportunity for us to meet face to face with our shareholders and use that opportunity to showcase our new factory in Motherwell as well as hearing from our talented team who put on a number of demonstrations highlighting the safety and durability of our products.
Finally, Invinity completed work to redomicile the Company to the UK from Jersey in early 2025. This move has already streamlined various corporate processes and will result in an associated reduction in ongoing costs. Our new executive team has continued to perform effectively and I am pleased to note the progress the Company is making in respect of its corporate priorities, which are covered in more detail in the Chief Executive's report.
In closing, I would like to thank my Board colleagues for their continued support. We are grateful for the dedication, hard work and vision provided by Larry Zulch during his tenure as Chief Executive and we wish him all the best in his retirement. Under Jonathan Marren's leadership, supported by Matt Harper in the role of President and CCO, I have every faith the Company can continue to grow to reach its potential and he has my full support, along with that of the entire Invinity board. I am delighted to welcome our new CFO, Adam Howard, who joined Invinity from the National Wealth Fund and whose experience in energy and finance is already bringing significant benefits. Lastly, I am particularly grateful to Michael Farrow for his guidance over his many years of service to the Company which has been greatly appreciated and has provided Invinity with strong governance structures to stand it in good stead. With the redomiciliation complete, Michael has given notice to the Board of his intention to retire at the next Annual General Meeting. We wish him all the best.
Invinity has taken the critical steps in 2024 to build our capabilities ahead of the transition to volume production of the ENDURIUM product. Jonathan, Matt and Adam are the right team and, combined with the right product, are powering the Company on.
Neil O'Brien
Non-Executive Chair
29 May 2025
Chief Executive's Report: From Megawatts to Gigawatts
The rhetoric on batteries was notably transformed throughout 2024 and continues apace into 2025. Interest in Long Duration Energy Storage ("LDES") and the role it will play in making our electricity supply not only more secure, but cheaper and greener too, is at an all-time high and politicians and policymakers in our core markets (and further afield) appear to have finally pinned their colours to the energy storage mast, further helped by recent well-publicised grid outage events in the UK and Europe. The opportunity ahead of us is enormous and our achievements in 2024 position us well to capture significant value.
The year saw the Company grow and enhance our own capabilities and global partnership network to position us to capture value whilst carefully managing our own resources. Perhaps most notably, 2024 saw Invinity close a significant funding round in the context of persistently challenging equity markets, raising £57.4 million in May. This fundraise brought in the UK Government via the National Wealth Fund as our new largest shareholder, enabling the Company to invest in our manufacturing capabilities, our team and our projects. 2024 was also the year of the long-awaited launch of ENDURIUM, our highly advanced, vanadium flow battery product. This was a critical milestone and enabled us to enter 2025 with a product that can meet the market's LDES requirements at a competitive price. I am more excited than ever about the opportunity developing in front of us and believe we are in a strong position to deliver on our corporate plan.
Delivering Against our 12-month Corporate Plan
When I took over as CEO in September 2024, I set out five corporate goals to be achieved within the next 12 months. These goals, covering revenue, products, cost reduction and commercial traction, have formed the backbone of the agenda at every senior management meeting held since. Our fantastic team are focused on the task at hand and I am delighted with the progress they have made since. Notwithstanding this, there is still much more we can achieve and we continue to challenge ourselves to make further progress.
Goal 1: Recognise Revenue in Line with 2024 Year-End Revised Analyst Forecasts
Shipping product quickly to customers underlines our dedication to good customer service and operating effectively for the future of the business. Our team were successful in shipping a number of orders prior to year end, including the 4 MWh sale to Powerflex, part of EDF Renewables North America, for a project in California and the 1.2 MWh ENDURIUM system to Gamesa Electric. Thanks to our team's efforts, this ensured we met our revised revenue forecasts for FY24.
Goal 2: Launch the ENDURIUM Product for General Sale Before 2024 Year-End
The formal release of ENDURIUM was a critical milestone for Invinity. Our team successfully executed a well-received global launch of our new product before year end to achieve this corporate goal. They then went further and successfully manufactured, tested and shipped before year end our first ENDURIUM batteries for our partner Gamesa Electric and commissioned them in early 2025. As I write this report now, these batteries are operating in line with expectations at the La Plana site in Spain, with further orders for other customers currently in the project fulfilment phase.
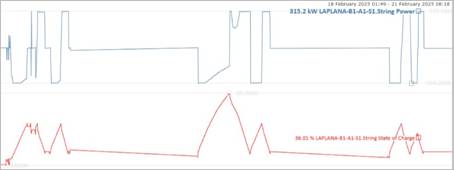
Operating data showing Power and State of Charge of the 1.2 MWh system at La Plana - February 2025
Goal 3: Close Deals from our Commercial Pipeline to Support Volume Ramp-up in line with Forecasts
In a year that saw lithium-ion battery costs fall ~20% (the sharpest drop since 2017) and continue to fall into 2025, the Company also navigated significant policy changes related to long duration energy storage deployment globally. Whilst the vast majority of these changes are designed to promote the adoption of LDES and this is clearly a positive long-term outcome for our business, this move did have the effect of slowing down discussions on a number of projects in our commercial pipeline as our partners considered the implications. In the final quarter of the year, we expanded our commercial team to help close out nearer term projects and prepare for the new LDES opportunities embodied by the introduction of new initiatives. The launch of ENDURIUM has assisted this process and, with the team's renewed focus, I am encouraged by the progress achieved in the year to date, including a strategic partnership with Frontier Power targeting the deployment of 2 GWh of our batteries into the UK via the LDES Cap and Floor Scheme, repeat business with our partner in Hungary with whom we have secured a supply agreement for a 10.8 MWh project and securing the approval, subject to a planning amendment, to proceed in respect of the 20.7 MWh LoDES project that Invinity will develop and which, once built, is expected to be the largest of its kind anywhere in Europe.
This recent deal flow is demonstrating to our customers that we can support larger-scale projects and this is imperative if we are to make the transition to delivering at gigawatt-scale. Converting commercial interest is also essential, and the commercial team remain focused on closing out opportunities from our wider commercial pipeline to support near-term revenue targets while developing in parallel the extremely large deal opportunities that will be instrumental in supporting Invinity's journey to mass manufacturing.
Goal 4: Further Advance the Cost Reduction Programme for ENDURIUM and Incrementally Improve Product Margins.
Our progress over the last four years on the VS3 cost curve has resulted in the Company being able to secure larger projects at incrementally improving margins and the launch of ENDURIUM facilitates the next step on this journey. When I took over as CEO in September 2024, I made it clear that advancing our cost reduction programme on ENDURIUM was an area I had prioritised for immediate action.
I am happy to report that the team has so far achieved a 24% cost reduction on ENDURIUM since launch. This has been realised through a combination of product optimisation, value engineering, supply chain development and process enhancements which have enabled us to incrementally improve performance and reduce the delivered cost of our products. This is remarkable progress within a relatively short timeframe, but this work is far from complete and I continue to challenge our team to reduce costs yet further, targeting further material reductions to be realised by the end of 2025 as a next step on this journey.
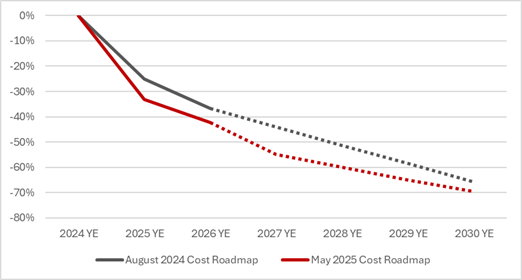
The team has already identified a viable route to exceeding our targets as part of our product development roadmap. The projected outcomes of our cost down programme are detailed in the following graphic and I'm pleased to note that we are currently ahead of our own expectations in terms of progress along our cost curve and on track to meet our incremental projected targets out to 2030.
ENDURIUM Cost Roadmap August 2024 vs May 2025
Economies of scale will also play an important part in our cost roadmap and I was pleased that the team were able to swiftly secure and harness the capabilities of our new Motherwell facility in Q3 to enable the faster, more efficient delivery of projects from the Company's commercial pipeline. This quadrupling of capacity, alongside the soon to be installed semi-automated production line in our Bathgate facility, which is expected to nearly double stack production at this site, will contribute to a further incremental reduction in unit production costs.
Finally, the operating data coming from the 1.2 MWh ENDURIUM system at La Plana is encouraging, as well as providing important guidance for future cost reduction. Having this system operating so soon after launch is greatly assisting the team and by using AI-driven statistical analysis, we are making the best use of this high-value data to inform our product development and value engineering workstreams. This work has already led to material improvements in the stack design and electrolyte performance in addition to separate initiatives which see us adopting a higher-volume, lower-cost manufacturing process and outsourcing appropriate activities to best-cost regions, for example through our licence and royalty model with partners such as Everdura Technology Company in Taiwan.
Goal 5: Review Capital Allocation Across the Business and Drive Operational Efficiencies.
Ensuring our limited resources are allocated effectively is vital to achieving sustainable corporate growth and I have ensured that this goal remains front of mind across the entire organisation, with our new CFO, Adam Howard, taking executive responsibility for this crucial initiative.
The team made important progress during the year enhancing our systems and processes to drive operational efficiencies. These include advancing the process of implementing an ERP system, improving our supplier development procedures and simplifying our corporate structure. Combined, these initiatives have improved the speed of our contract delivery as well as helping to reduce overheads in the future. This is an area which benefits from continued optimisation and by better aligning our supply chain, finance and customer-facing functions we will continue to unlock incremental benefits as we grow.
Finally, I am pleased that Invinity's redomiciliation to the UK, a condition of NWF's investment, completed early in 2025. In line with our efforts to drive operational efficiencies, this move reduces our corporate costs, simplifies administrative matters and enhances our corporate positioning within the UK, a key commercial market for the Company.
Placing LDES Front of Mind with Policy and Political Engagement
Thanks to extensive, constructive engagement with the UK Department for Energy Security and Net Zero ("DESNZ") during 2024 and in the year to date, we were delighted to announce in March this year that we had now secured approval to proceed, subject to a planning amendment, with the LoDES project - an up to 20.7 MWh vanadium flow battery project which will be one of the largest of its kind anywhere in the world. Owning this project ourselves will bring significant long-term benefits as we will retain the financial value generated from this DESNZ grant and enhance our commercial activities by leveraging full control and access to a flagship LDES asset.
We will always aim to be at the forefront of LDES policy discussions as they evolve and we made significant progress in this important initiative during 2024 in parallel to the delivery of the corporate goals set out earlier in my report. All over the world, new support schemes for LDES deployments are now being implemented and engaging with policy and political stakeholders at all levels in an effective and collaborative manner remains a vital part of our market development strategy.
Throughout 2024 we continued our ongoing engagements with the UK Government and in particular I was pleased to spend time discussing our technology and expansion plans with Graham Stuart, the UK Minister of State for Energy Security and Net Zero and Gillian Martin MSP, the Scottish Acting Cabinet Secretary for Net Zero. In Canada, where our ongoing political engagement is led by Matt Harper, we were delighted to have the opportunity to engage extensively with key British Columbia government ministers including Premier David Eby, following the visit by Canadian Energy Minister Wilkinson to our facility in 2023. More recently, we were also delighted to welcome a host of elected officials from both British Columbia and the City of Vancouver as part of New Economy Canada's "Getting Things Built Tour". In late 2024, shortly after the U.S. election, I also joined our U.S.-based team in Washington D.C. where we had a number of productive meetings with U.S. government officials including representatives from the Department of Energy and Department of Defence.
Further afield, our projects also continue to attract the attention of key stakeholders around the world. In March 2024, the Belgian Minister for Energy attended the launch of our vanadium flow battery alongside our customers Engie, Equans and Jan de Nul at a commercial site in Aalst, Belgium. Furthermore, in November 2024, the Western Australian Minister for Energy, Environment and Climate Action formally launched our battery at Horizon Power's Kununurra LDES project.
Global Energy Storage Funding Programmes
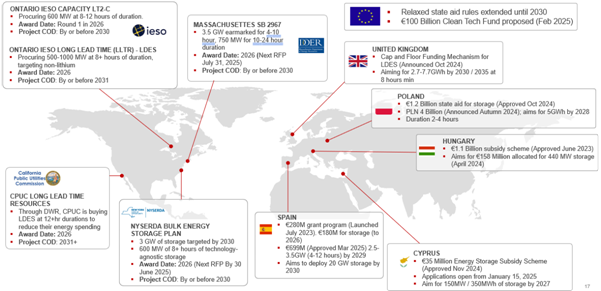
As demonstrated in the graphic "Global Energy Storage Funding Programmes", many, if not all, of these LDES deployment support schemes are targeting projects in or before 2030, just five years from now. These opportunities require storage duration covering 6+ to 10+ hours and more importantly, many highlight preferences for non-lithium-based storage technologies (particularly the UK and Canada). They also favour technologies that offer availability and cycling over 25+ years without degradation of the system, an improved depth of discharge and a reduced capex/kWh over longer durations - KPIs that play to ENDURIUM's strengths.
Invinity, along with the support of our established partners, is carefully targeting these opportunities in our core markets. Our newest partner, Frontier Power, is applying for up to 2 GWh of LDES Cap and Floor projects using our VFBs in the UK. Our partner STS Group is well-placed to apply for projects for the regime in Hungary. Our experience in California, alongside our partner Indian Energy, is enabling us to address new opportunities as part of the State's LDES program and we are using this experience to also target opportunities in New York's LDES program. Beyond these markets, our long-term partner Everdura gives us reach into the Taiwanese and Southeast Asian markets where we are confident that our product has a strong commercial advantage.
Summary and Outlook
In summary, despite the reduction in year-on-year revenue for the period, Invinity is making incremental progress against our corporate plan. This work to improve our margins, scale our operations and optimise our cost base remains a key deliverable and our commitment to achieving this is evidenced by significant progress made so far since I took over the role as Chief Executive Officer against our corporate targets in the year to date which I set out earlier in this report.
There will of course continue to be challenges which we must overcome, and our approach to these is set out in the risk management section of this report, but I believe our team have the mindset and skillset to succeed. As we address the global LDES opportunity across our core markets, I am grateful to be supported by both Matt and Adam as we navigate the next steps along our pathway to profitability, moving from Megawatt to Gigawatt scale in a market where long duration energy storage has now fully come of age.
Jonathan Marren
Chief Executive Officer
29 May 2025
Chief Financial Officer's Report: Material Progress Against Cost-Down and Investment Plan
|
2024 |
2023 |
2022 |
|
|
Year to 31 December |
£m |
£m |
£m |
|
Revenue |
5.0 |
22.0 |
2.9 |
|
Gross (Loss)/Profit |
(3.5) |
(3.3) |
0.7 |
|
Adjusted EBITDA1 |
(18.0) |
(22.4) |
(19.1) |
|
Pre-tax Loss |
(22.8) |
(23.2) |
(18.5) |
|
Property, Plant and Equipment plus Intangible Assets |
26.3 |
25.7 |
25.3 |
|
Total Inventory and Pre-paid Inventory |
8.2 |
4.4 |
14.9 |
|
Net Cash |
32.4 |
5.0 |
5.1 |
|
Net Assets |
65.7 |
33.8 |
34.4 |
|
1 Adjusted EBITDA is a non-statutory measure. The calculation is shown below. |
|||
|
2024 |
2023 |
2022 |
|
|
Year to 31 December |
£m |
£m |
£m |
|
Loss from Operations |
(24.1) |
(22.8) |
(19.0) |
|
Add back |
|||
|
Depreciation and Amortisation |
1.3 |
1.1 |
1.2 |
|
Loss on Disposal of Non-Current Assets |
0 |
0.2 |
0 |
|
Impairment of Inventory and Obsolete Inventory |
0.4 |
0.2 |
0 |
|
Gain on Legal Settlement |
(0.2) |
0 |
0 |
|
Share-based Payment Charge |
0.6 |
0.7 |
0.3 |
|
Redomiciliation and Other One off |
0.6 |
0 |
0 |
|
Warranty and Onerous Contract Provisions |
2.1 |
(1.7) |
(3.2) |
|
Research and Development Costs |
2.4 |
1.9 |
2.2 |
|
Grants and Research and Development Recoveries |
(1.1) |
(2.0) |
(0.6) |
|
Adjusted EBITDA |
(18.0) |
(22.4) |
(19.1) |
2024 Financial Performance
The financial performance of the business during 2024 reflected a transitional period as the Company ran an overlap of product lines; manufacturing and selling VS3 at the same time as preparing for the launch of the next-generation ENDURIUM product. It took longer to get ENDURIUM ready for launch, and a portion of revenue and grant income shifted into 2025 including from the Everdura contract and the recently announced supply agreement with STS, which the Company now expects to receive formal notice to proceed on later this year. In addition, the LoDES project previously anticipated to progress during the year, is now moving forward in 2025.
As a result, total income including sales revenue and project related grant income for the year decreased significantly to £5 million in 2024 (2023: £22 million). In the year, revenue was recognised on three main projects across Europe and the United States, with V-iOn, Rincon and OPALCO delivering over 7 MWh. While this has been a material decrease from the prior year, it is worth noting 2023 reflected the culmination of significant VS3 activity over multiple years prior to 2023. Revenue recognition dictates that project sales are only shown in the financial statements when specific performance obligations related to those projects have been satisfied.
The Company recorded a gross loss of £3.5 million (2023: gross loss of £3.3 million). It is notable that £2.1 million of this relates to provisions for warranties and onerous contracts for parts including the legacy S4 stack and converters, which have since been superceded. The Company continues its strategic objective to enhance margins and this trend remains with 2025 projects having been signed at positive gross margins at the project level.
Administrative expenses at £20.3 million (2023: £19.1 million) increased in line with inflation after allowing for one-off costs, reflecting a continued focus on controlling costs while growing operations. Administrative expenditure was represented by stable staff costs of £12.9 million in 2024 (2023: £12.8 million) and professional fees of £0.8 million in 2024 (2023: £0.7 million) predominantly related to the re-domiciliation exercise. Sales and marketing costs decreased to £0.8 million (2023: £1.0 million). Net research and development recoveries were £1.1 million (2023: £1.9 million) including £0.8 million of recoveries from Gamesa Electric S.A.U. ("Gamesa Electric") under the Joint Development and Commercialisation Agreement for ENDURIUM.
Net Finance income increased to £1.3 million (2023: £0.4 million costs) due to interest payments received on proceeds from the May 2024 fundraising which were placed into term deposits. Total inventory and pre-paid inventory increased to £8.2 million (2023: £4.4 million) preparing for the delivery of several projects including Everdura Technology Company and LoDES.
Overall, the Company recorded a loss for the year of £22.8 million (2023: loss of £23.2 million), an improvement of £0.4 million supported mainly by Finance income. There have been a number of 'one-off' costs experienced in the year including professional fees in relation to the redomiciliation of Invinity's parent company from Jersey to the UK which concluded early in January 2025. The EBITDA loss after adjusting for these one-off items, non-cash expenditures and grant income, reduced from £22.4 million to £18.0 million year-on-year.
The Company has continued to invest in its future capabilities with the opening of a new production facility in Motherwell, Scotland in June 2024 and a contract was signed to supply a new semi-automated production line in Bathgate, Scotland to be delivered in Q2 2025. The outcome of these investments will realise product cost savings and support increased scale ahead of the outcome of the UK LDES Cap and Floor application process.
2024 Cash Performance
Year-on-year cash outflow from operations increased to £25.9 million (2023: £19.7 million) principally because of a net increase in operating assets, primarily inventory, as set out in note 14.
Delivering on increased margins is a key corporate priority and will make an important contribution to the Company being able to fund its administrative costs from operational cash receipts in the future. To this end, the Company successfully delivered and commissioned the 1.2 MWh ENDURIUM system at the La Plana site in early 2025 under its partnership with Gamesa Electric. As noted in the previous year, ENDURIUM is expected to be manufactured at significantly lower cost than the Company's VS3 product and occupies a comparatively smaller physical footprint to support lower operation and maintenance costs, in addition to higher round-trip-efficiency. These characteristics should enable the Company to sell this new product at a materially lower and more competitive price point than currently to support future cash generation and profitability.
Funding and Net Working Capital
In 2024 it was inspiring to note the huge support from our investors in raising over £57 million to support the growth of the Company as it continues to develop a market leading solution in non-lithium, long duration battery energy storage systems.
On 31 December 2024 the Company had cash and cash equivalents of £32.4 million (2023: £5.0 million). The Company's cash balance during 2024 has been materially increased following the successful conclusion of the capital raising of £57.4 million which completed in May 2024.
The Company was debt free as of 31 December 2024 and remains so as at the date of this document.
Going Concern
The Directors have made an assessment of going concern covering the period from the date of approval of the financial statements to 30 June 2026 and in making this assessment, have prepared a cash flow forecast covering this period. The Directors have also considered whether there are any significant events expected to arise beyond the going concern period.
This forecast indicates that the Group expects to remain cash positive during the going concern period, without the requirement for further fundraising. This forecast includes judgements and estimates regarding income from pipeline projects and expected costs of delivering the contracts.
It is important to note that the visibility around the sales pipeline underpinning the Company's projected cashflow is more reliable over a period of 12 months, which is in line with the going concern period noted above. While a cash flow forecast and projections have been carried out for a period greater than 12 months, the risk and uncertainty increase in the time following the going concern assessment period.
Invinity has prepared a downside cash flow forecast for the purposes of going concern evaluation, which excludes all pipeline contracts that are not yet signed. In this scenario, the forecast assumes a reduction or deferral of costs in order to preserve cash. If required, the Directors consider that the Group has the ability to reduce or defer costs without adversely affecting the short-term delivery of contracted income in the downside forecast. The outcome of this scenario is that the Company has sufficient cash throughout the going concern period. The accounts have therefore been prepared on a going concern basis.
Adam Howard
Chief Financial Officer
29 May 2025
Financial Statements
Consolidated Statement of Profit and Loss
For the year ended 31 December 2024
|
2024 |
2023 |
||||
|
Note |
£000 |
£000 |
£000 |
£000 |
|
|
Revenue |
4 |
5,015 |
22,006 |
||
|
Direct costs |
(8,528) |
(25,361) |
|||
|
Grant income against direct costs |
4 |
- |
11 |
||
|
Cost of sales |
5 |
(8,528) |
(25,350) |
||
|
Gross loss |
(3,513) |
(3,344) |
|||
|
Operating costs |
|||||
|
Administrative expenses |
6 |
(20,334) |
(19,085) |
||
|
Other items of operating income and expense |
10 |
(210) |
(349) |
||
|
Loss from operations |
(24,057) |
(22,778) |
|||
|
Finance income |
1,358 |
719 |
|||
|
Finance costs |
(106) |
(1,233) |
|||
|
Gain on foreign currency transactions |
8 |
113 |
|||
|
Net finance income/(costs) |
11 |
1,260 |
(401) |
||
|
Loss before income tax |
(22,797) |
(23,179) |
|||
|
Income tax expense |
12 |
- |
- |
||
|
Loss for the year |
(22,797) |
(23,179) |
|||
|
Loss per ordinary share in pence |
|||||
|
Basic |
13 |
(6.7) |
(13.1) |
||
|
Diluted |
13 |
(6.7) |
(13.1) |
||
The above consolidated statement of profit and loss should be read in conjunction with the accompanying notes.
Consolidated Statement of Comprehensive Income
For the year ended 31 December 2024
|
2024 |
2023 |
||
|
Continuing operations |
£000 |
£000 |
|
|
Loss for the year Other comprehensive expense Items that may be reclassified subsequently to profit or loss: |
(22,797) |
(23,179) |
|
|
Exchange differences on the translation of foreign operations |
(355) |
(60) |
|
|
Total comprehensive loss for the year |
(23,152) |
(23,239) |
The above consolidated statement of comprehensive income should be read in conjunction with the accompanying notes.
Consolidated Statement of Financial Position
As at 31 December 2024
|
2024 |
2023 |
||
|
Note |
£000 |
£000 |
|
|
Non-current assets |
|||
|
Goodwill and other intangible assets |
15 |
23,959 |
24,002 |
|
Property, plant and equipment |
16 |
2,346 |
1,699 |
|
Right-of-use assets |
17 |
1,526 |
1,558 |
|
Contract assets |
21 |
- |
304 |
|
Total non-current assets |
27,831 |
27,563 |
|
|
Current assets |
|||
|
Inventory |
19 |
5,753 |
3,288 |
|
Other current assets |
20 |
7,648 |
2,721 |
|
Contract assets |
21 |
1,149 |
888 |
|
Trade receivables |
22 |
827 |
2,496 |
|
Cash and cash equivalents |
23 |
32,352 |
5,014 |
|
Total current assets |
47,729 |
14,407 |
|
|
Total assets |
75,560 |
41,970 |
|
|
Current liabilities |
|||
|
Trade and other payables |
24 |
(4,525) |
(3,948) |
|
Derivative financial instruments |
25 |
(271) |
(406) |
|
Contract liabilities |
21 |
(1,392) |
(1,312) |
|
Lease liabilities |
26 |
(550) |
(723) |
|
Provisions |
21 |
(381) |
(812) |
|
Total current liabilities |
(7,119) |
(7,201) |
|
|
Net current assets |
40,610 |
7,206 |
|
|
Non-current liabilities |
|||
|
Lease liabilities |
26 |
(1,145) |
(833) |
|
Provisions |
21 |
(1,627) |
(123) |
|
Total non-current liabilities |
(2,772) |
(956) |
|
|
Total liabilities |
(9,891) |
(8,157) |
|
|
Net assets |
65,669 |
33,813 |
|
|
Equity |
|||
|
Called up share capital |
27 |
53,473 |
51,348 |
|
Share premium |
27 |
215,121 |
162,883 |
|
Share-based payment reserve |
27 |
7,328 |
6,683 |
|
Accumulated losses |
27 |
(208,070) |
(185,273) |
|
Currency translation reserve |
27 |
(2,222) |
(1,867) |
|
Other reserves |
27 |
39 |
39 |
|
Total equity |
65,669 |
33,813 |
The above consolidated statement of financial position should be read in conjunction with the accompanying notes.
The financial statements were authorised by the Board of Directors and authorised for issue on 29 May 2025 and were signed on its behalf by:
Adam Howard
Director
Consolidated Statement of Changes in Equity
As at 31 December 2024
|
Called up share capital |
Share premium |
Share-based payment reserve |
Accumul-ated losses |
Currency transla-tion reserve |
Other reserves |
Total |
|
|
£000 |
£000 |
£000 |
£000 |
£000 |
£000 |
£000 |
|
|
At 1 January 2024 |
51,348 |
162,883 |
6,683 |
(185,273) |
(1,867) |
39 |
33,813 |
|
Loss for the year |
- |
- |
- |
(22,797) |
- |
- |
(22,797) |
|
Other comprehensive income |
|||||||
|
Foreign currency translation differences |
- |
- |
- |
- |
(355) |
- |
(355) |
|
Total comprehensive loss for the year |
- |
- |
- |
(22,797) |
(355) |
- |
(23,152) |
|
Transactions with owners in their capacity as owners |
|||||||
|
Investment funding arrangement, net of transaction costs |
2,125 |
52,234 |
- |
- |
- |
- |
54,359 |
|
Exercise of share options |
4 |
- |
- |
- |
- |
4 |
|
|
Share-based payments |
- |
- |
645 |
- |
- |
- |
645 |
|
Total contributions by owners |
2,125 |
52,238 |
645 |
- |
- |
- |
55,008 |
|
At 31 December 2024 |
53,473 |
215,121 |
7,328 |
(208,070) |
(2,222) |
39 |
65,669 |
The above consolidated statement of changes in equity should be read in conjunction with the accompanying notes.
|
Called up share capital |
Share premium |
Share-based payment reserve |
Accumul-ated losses |
Currency transla-tion reserve |
Other reserves |
Total |
|
|
£000 |
£000 |
£000 |
£000 |
£000 |
£000 |
£000 |
|
|
At 1 January 2023 |
50,716 |
141,579 |
5,957 |
(162,094) |
(1,807) |
39 |
34,390 |
|
Loss for the year |
- |
- |
- |
(23,179) |
- |
- |
(23,179) |
|
Other comprehensive income |
|||||||
|
Foreign currency translation differences |
- |
- |
- |
- |
(60) |
- |
(60) |
|
Total comprehensive loss for the year |
- |
- |
- |
(23,179) |
(60) |
- |
(23,239) |
|
Transactions with owners in their capacity as owners |
|||||||
|
Investment funding arrangement, net of transaction costs |
631 |
21,295 |
- |
- |
- |
- |
21,926 |
|
Exercise of share options |
1 |
9 |
- |
- |
- |
- |
10 |
|
Share-based payments |
- |
- |
726 |
- |
- |
- |
726 |
|
Total contributions by owners |
632 |
21,304 |
726 |
- |
- |
- |
22,662 |
|
At 31 December 2023 |
51,348 |
162,883 |
6,683 |
(185,273) |
(1,867) |
39 |
33,813 |
The above consolidated statement of changes in equity should be read in conjunction with the accompanying notes.
Consolidated Statement of Cash Flows
For the year ended 31 December 2024
|
2024 |
2023 |
||
|
Note |
£000 |
£000 |
|
|
Cash flows from operating activities |
|||
|
Cash used in operations |
14 |
(26,103) |
(19,657) |
|
Interest received |
1,222 |
299 |
|
|
Interest paid |
(13) |
(1) |
|
|
Net cash outflow from operating activities |
(24,894) |
(19,359) |
|
|
Cash flows from investing activities |
|||
|
Acquisition of property, plant and equipment |
16 |
(1,294) |
(1,013) |
|
Proceeds from disposal of property, plant and equipment |
16 |
- |
57 |
|
Deposits on right-of-use assets |
(7) |
(28) |
|
|
Net cash outflows from investing activities |
(1,301) |
(984) |
|
|
Cash flows from financing activities |
|||
|
Payment of lease liabilities |
26 |
(676) |
(629) |
|
Interest paid on lease liabilities |
26 |
(92) |
(44) |
|
Proceeds from the issue of share capital |
57,383 |
23,044 |
|
|
Proceeds from the exercise of share options and warrants |
4 |
10 |
|
|
Payment of transaction costs for the issue of share capital |
(3,001) |
(1,117) |
|
|
Proceeds from sale of conversion shares |
- |
742 |
|
|
Financing charges on repayment of derivative financial instruments |
- |
(992) |
|
|
Repayment of investment funding arrangement |
(881) |
||
|
Net cash inflow from financing activities |
53,618 |
20,133 |
|
|
Net increase/(decrease) in cash and cash equivalents |
27,423 |
(210) |
|
|
Cash and cash equivalents at the beginning of the year |
5,014 |
5,137 |
|
|
Effects of exchange rate changes on cash and cash equivalents |
(85) |
87 |
|
|
Cash and cash equivalents at the end of the year |
32,352 |
5,014 |
The above consolidated statement of cash flows should be read in conjunction with the accompanying notes.
Notes
1 General Information
Invinity Energy Systems plc (the 'Company') is a public company limited by shares incorporated and domiciled in Jersey. For the period under review, the registered office address was Third Floor, IFC5, Castle Street, St. Helier, JE2 3BY, Jersey.
The Company is quoted on the AIM Market of the London Stock Exchange with the ticker symbol IES.L and on the OTCQX Best Market in the United States of America with the ticker symbol IESVF.
The principal activities of the Company and its subsidiaries (together the 'Group') relate to the manufacture and sale of vanadium flow battery systems and associated installation, warranty and other services.
2 Accounting Policies
Basis of Preparation
These consolidated financial statements have been prepared in accordance with International UK-adopted International Accounting Standards, the associated interpretations issued by the IFRS Interpretations Committee (together 'IFRS') and in accordance with the Companies (Jersey) Law 1991.
Separate presentation of the parent company financial statements is not required by the Companies (Jersey) Law 1991 and, accordingly, such statements have not been included in this report.
The accounting policies applied in preparing these consolidated financial statements are set out below. These policies have been consistently applied throughout the period and to each subsidiary within the Group.
The financial statements have been prepared under the historical cost convention except where stated.
Going Concern
The Directors are satisfied that the Group has adequate resources to continue to operate as a going concern for the foreseeable future and that no material uncertainties exist which could cause significant doubt with respect to this assessment. In making this assessment, the Directors have considered the Group's balance sheet position and forecast earnings and cash flows for the period from the date of approval of these financial statements to 30 June 2026.
As part of the going concern assessment the Directors have prepared a cash flow forecast which indicates that the Group would expect to remain cash positive during this period and without the requirement for further fundraising. The business continues in a cash outflow position, using funding generated from previous fundraises. However, it plans to move to a cash inflow position upon the launch and delivery of material volume of the next generation product.
This cash flow forecast was stress-tested for a worst-case scenario of limited positive cash receipts from sales and management of costs where necessary. In these tested scenarios, the business would remain cash positive for the 12 months from the date of approval of these financial statements.
Therefore, the Directors believe it is appropriate to prepare the accounts on a going concern basis.
New Standards, Amendments and Interpretations Effective and Adopted by the Group in 2024
Amendments to existing standards previously issued by the IASB with effective dates during the year ended 31 December 2024 are summarised below. There was no effect on the Group's consolidated financial statements for the year ended 31 December 2024 as a result of the adoption of these amendments.
Amendments to 'IAS 1 Presentation of Financial Statements - Classification of Liabilities as Current or Non-Current Liabilities with Covenants'
The Group has adopted the amendments to IAS 1 for the first time in the current year. The amendments clarify that the classification of liabilities as current or noncurrent is based solely on an entity's right to defer settlement for at least 12 months after the reporting date. The right needs to exist at the reporting date and must have substance. Only covenants with which an entity must comply on or before the reporting date affect this right. Covenants to be complied with after the reporting date do not affect the classification of a liability as current or noncurrent at the reporting date. However, disclosure about covenants is now required to help users understand the risk that those liabilities could become repayable within 12 months after the reporting date.
The amendments also clarify that the transfer of an entity's own equity instruments is regarded as settlement of a liability, in certain circumstances. If a liability has any equity conversion options, they generally affect its classification as current or noncurrent (e.g. if the conversion option is bifurcated as an embedded derivative from the host debt), unless these conversion options are recognised as equity under IAS 32, Financial Instruments: Presentation.
Amendments to 'IFRS 16 Leases - Lease Liability in a Sale and Leaseback'
The Group has adopted the amendments to IFRS 16 for the first time in the current year. The amendment requires a seller-lessee to account for variable lease payments that arise in a sale-and-leaseback transaction as follows:
· On initial recognition, include variable lease payments when measuring a lease liability arising from a sale-and-leaseback transaction.
· After initial recognition, apply the general requirements for subsequent accounting of the lease liability such that no gain or loss relating to the retained right of use is recognised.
Seller-lessees are required to reassess and potentially restate sale-and-leaseback transactions entered into since the implementation of IFRS 16 in 2019.
Amendments to 'IAS 7 Statement of Cash Flows and IFRS 7 Financial Instruments: Disclosures - Supplier Finance Arrangements'
The Group has adopted the amendments to IAS 7 and IFRS 7 for the first time in the current year. The amendments require an entity (the buyer) to disclose qualitative and quantitative information about its supplier finance arrangements, such as terms and conditions - including, for example, extended payment terms and security or guarantees provided.
Amongst other characteristics, IAS 7 explains that a supplier finance arrangement provides the entity with extended payment terms, or the entity's suppliers with early payment terms, compared to the related invoice payment due date.
New Standards and Interpretations Not Yet Adopted
Certain new accounting standards and interpretations have been published that are not mandatory for 31 December 2024 reporting periods and have not been early adopted by the Company. These standards are not expected to have a material impact on the entity in the current or future reporting periods or on foreseeable future transactions and are summarised below:
§ IAS 21 The Effects of Changes in Foreign Exchange Rates - Lack of Exchangeability (effective for periods beginning on or after 1 January 2025);
§ IFRS 9 Financial Instruments and IFRS 7 Financial Instruments: Disclosures - Classification and measurement of financial instruments (effective for periods beginning on or after 1 January 2026).
§ Annual Improvements to IFRS Accounting Standards (effective for periods beginning on or after 1 January 2026) - Amendments to:
o IFRS 1 First-time Adoption of International Financial Reporting Standards;
o IFRS 7 Financial Instruments: Disclosures and its accompanying Guidance on implementing IFRS 7;
o IFRS 9 Financial Instruments;
o IFRS 10 Consolidated Financial Statements; and
o IAS 7 Statement of Cash flows
§ IFRS 18 Presentation and Disclosure in Financial Statements (effective for periods beginning on or after 1 January 2027);
§ IFRS 19 Subsidiaries without Public Accountability: Disclosures (effective for periods beginning on or after 1 January 2027)
Foreign Currency
Presentation Currency
The consolidated financial statements are presented in Great British Pounds (GBP) rounded to the nearest thousand (£000), except where otherwise indicated.
Functional Currency
Items included in the financial information of the individual companies that comprise the Group are measured using the currency of the primary economic environment in which each subsidiary operates (its functional currency).
Whilst Jersey uses the Jersey Pound as its currency, Jersey is in a currency union with the United Kingdom and so the functional currency of the parent company of the Group at 31 December 2024 has been determined to be GBP.
Foreign Currency Transactions
Transactions in currencies other than an entity's functional currency (foreign currencies) are translated using the exchange rate on the date of the transaction. Foreign exchange gains and losses resulting from the settlement of transactions denominated in a foreign currency are translated into functional currency using the relevant exchange rate at the date of the transaction.
Foreign exchange gains and losses resulting from the settlement of foreign currency transactions and from the translation at the balance sheet date of monetary assets and liabilities denominated in foreign currencies, are recognised in the consolidated statement of comprehensive loss within gains/(losses) on foreign currency transactions.
Foreign currency gains/(losses) realised on the retranslation of subsidiaries as part of the year-end consolidation are recorded in the translation reserve that forms a part of shareholders' funds in the consolidated financial statements of the Group.
Consolidation of Subsidiaries
Subsidiaries are all entities over which the Company has control. The Company controls an entity when it is exposed to, or has rights over, variable returns from its involvement with the entity and can affect those returns through its ability to exercise control over the entity. Subsidiaries are consolidated in the Group financial statements from the date at which control is transferred to the Company.
Subsidiaries are deconsolidated from the date that control ceases. The ability to control an entity may cease because of the sale of a subsidiary or other change in the Company's shareholding in that subsidiary, voting rights or board representation.
Foreign Currency Operations
Subsidiaries of the Company may have functional currencies that are different from that of the Company. Since the Group financial statements are presented in GBP, the assets and liabilities of foreign currency subsidiaries consolidated into these financial statements are translated into the Group's presentational currency using exchange rates prevailing at the end of the reporting period. Income and expense items are similarly translated using the average rate for each month during the year. The exchange rates on the actual dates of transactions are used where exchange rates fluctuate significantly within a month. Exchange differences arising on consolidation are recognised in other comprehensive income and are accumulated as part of shareholder's equity.
Transaction Between Entities Within the Group
Transactions and balances between companies forming part of the Group together with any unrealised income and expenses arising from intra-group transactions are eliminated in the preparation of the consolidated financial statements of the Group.
Operating Segments
The Group is organised internally to report to the Executive Directors as a whole. The Executive Directors comprise the Chief Executive Officer, the President & Chief Commercial Officer, and the Chief Financial Officer. The Executive Directors, as a group, have been determined, collectively, to prosecute the role of chief operating decision maker of the Group. The chief operating decision maker is ultimately responsible for entity-wide resource allocation decisions, the evaluation of the financial, operating and ESG performance of the Group.
The Group's activities have been determined to represent a single operating segment being the provision of vanadium flow batteries and ancillary services, principally comprising installation and integration services, and the provision of extended warranties for battery units sold.
Revenue
The Group generates revenue from the sale of battery storage systems integration hardware, installation, extended warranty and other services. These multiple elements are separate performance obligations that are derived from contractual arrangements with customers. The sales contracts do not include a general right of return.
For contracts that contain multiple elements or promises, the Group accounts for individual goods and services separately if they are distinct. A product or service is distinct if it is separately identifiable from other items in the agreement and where a customer can benefit from the good or service on its own or together with other resources that are readily available.
The consideration paid for each performance obligation is typically fixed. A significant portion of the aggregate payment due under a contract for sale is normally due before delivery or completion of the service. The total consideration under the contract is allocated between the distinct performance obligations contained in the contract based on their stand-alone selling prices. The stand-alone selling price is estimated using an adjusted market assessment approach that looks to industry benchmarks or pricing surveys for certain standalone products or services.
The Group measures revenue based on the consideration specified in the contracts for sale with customers. Revenue is recognised when a performance obligation is satisfied by transferring control over a good or service to a customer. With respect to the battery system, associated control systems and integration hardware, control is transferred at a point in time and is usually based on the contractual shipping terms. In certain instances, the battery system and integration hardware may be ready for delivery although the customer is not ready to receive the product. The Group will recognise revenue in accordance with IFRS 15 as a Bill-and-Hold arrangement if all of the following conditions are satisfied:
§ The reason for the bill and hold arrangement is substantive;
§ The battery systems and hardware are identified separately as belonging to the customer;
§ The battery systems and hardware are currently ready for physical transfer to the customer; and
§ The Company does not have the ability to use the product or to direct it to another customer.
With respect to the services that includes installation and commissioning, the performance obligation is usually satisfied at a point in time when a when a commissioning certificate or site performance report has been issued to the customer. Revenue excludes any taxes such as sales taxes, value added tax or other levies that are invoiced and collected on behalf of third parties, such as government tax authorities.
In addition, under the terms of its contracts for sale, the Group may be responsible for other services such as storing and delivering battery systems to its customers. When this is the case, the Group will invoice the relevant customer for, and will recognise as revenue, any charges incurred together with any associated handling costs. Revenue is recognised for the storage services over time as the services are delivered and for shipping services at a point in time when the goods are delivered to the agreed upon location. The related costs incurred by the Group for storage, shipping and handling services are recognised as cost of sales concurrent with the recognition of the associated revenue.
Grant Income
Government and other grants received are recognised in the consolidated statement of profit and loss in the period that the related expenditure is incurred. Grant income received in respect of costs incurred is presented net within the associated cost category. Capital grants are similarly netted against the relevant asset acquired or constructed.
Grant income received in advance of the associated expenditure is presented as deferred income within contract liabilities and released to profit and loss as the associated expenditure is incurred. Grant income receivable is presented as accrued income within contract assets until such time as it can be claimed or is received.
Finance Income and Costs
Finance income comprises interest on cash deposits, foreign currency gains and the unwind of discount on any assets that are carried at amortised cost. Interest income is recognised as it accrues using the effective interest rate method.
Finance costs include foreign currency losses and the unwind of the discount on any liabilities held at amortised cost, such as lease liabilities arising from lease contracts.
Employee Benefits
Short-term Benefits
Benefits provided to employees that are short-term in nature are recognised as expenses in the statement of profit and loss as the related service is provided. The principal short-term benefits given to employees are salaries, associated holiday pay and other periodic benefits such as healthcare and pension contributions made by the Group for the benefit of the employee. A liability is recognised for the amount expected to be paid under short-term cash bonus plans if there is either a present legal or constructive obligation to pay the amount and the amount can be reliably estimated.
Share-based Payments
The Group operates equity-settled share-based compensation plans, under which it compensates employees for services rendered through the issue of equity instruments, deferred share awards or options to subscribe for ordinary shares of the Group. The fair value of the employee services received in exchange for the grant of the equity instruments, shares or options is recognised as an expense. The total amount to be expensed is determined by reference to the fair value of the options granted:
§ including any market conditions (for example, the Group's share price);
§ excluding the impact of any service and non-market performance vesting conditions (for example, profitability, sales, growth targets, and the requirement to remain as an employee of the Group over a specified period); and
§ including the impact of any non-vesting conditions.
Non-market performance and service conditions are included in the assumptions regarding the number of options that are expected to vest. The total expense is recognised over the vesting period, which is the period over which all the specified vesting conditions are to be satisfied.
In some circumstances, employees may provide services in advance of the grant date and therefore the grant date fair value is estimated for the purposes of recognising the expense during the period between service commencement and the grant date.
At the end of each reporting period, the Group revises its estimates of the number of options that are expected to vest based on the non-market vesting conditions. It recognises the impact of the revision to original estimates, if any, in the consolidated statement of profit and loss, with a corresponding adjustment to equity.
Any social security contributions payable in connection with the grant of the share options is considered an integral part of the grant itself, and the charge will be treated as a cash-settled transaction.
Taxes
The total tax charge or credit recognised in the statement of profit and loss comprises both current and deferred taxes. Taxation is recognised in the consolidated statement of profit and loss except to the extent that it relates to a business combination or items recognised directly in equity or other comprehensive income.
Current Tax
The current tax charge is based on the taxable profit for the year. Taxable profit or loss is different from the profit or loss reported in the statement of profit and loss as it excludes items of income and/or expense that are taxable or deductible in other years (temporary differences) and it further excludes items that are never taxable nor deductible (permanent differences).
Deferred Tax
Deferred tax is the tax that is expected to be payable or recoverable on differences between the carrying value of assets and liabilities in the financial statements and the corresponding value of those assets and liabilities used to calculate taxable profit or loss.
Deferred tax assets are recognised for all deductible temporary differences, the carry forward of unused tax credits and any unused tax losses. Deferred tax assets are recognised to the extent that it is probable that taxable profit will be available against which the deductible temporary differences, and the carry forward of unused tax credits and unused tax losses can be utilised.
Deferred tax assets and liabilities are recognised using the liability method for all taxable temporary differences, except in respect of taxable temporary differences associated with investments in subsidiaries and associates. Where the timing of the reversal of temporary difference arising from such investment related assets and liabilities can be controlled and it is probable that the temporary difference will not reverse in the foreseeable future then the Group does not recognise deferred tax liabilities on these items.
A deferred tax asset or liability is not recognised if a temporary difference arises on initial recognition of an asset or liability and, at the time of the transaction, affects neither the accounting profit nor taxable profit or loss.
Current and deferred tax is calculated using tax rates and laws that have been enacted or substantively enacted at the balance sheet date. Deferred tax balances are presented on a gross basis. Refer to note 18, deferred tax balances.
Earnings per Share
The Group presents basic and diluted earnings per share ("EPS") data for its ordinary shares. Basic EPS is calculated by dividing the profit or loss attributable to ordinary shareholders of the Company by the weighted average number of ordinary shares outstanding during the year.
Diluted EPS is determined by adjusting the weighted average number of ordinary shares outstanding used in the EPS calculation to include all potentially dilutive ordinary shares, which, in the case of the Company, represents additional shares that could be issued in relation to 'in-the-money' convertible notes, warrants or share options.
The effects of anti-dilutive potential ordinary shares are ignored in calculating diluted EPS. Anti-dilution is when an increase in earnings per share or a reduction in loss per share would result from the exercise of such options, warrants or convertible instruments.
Intangible Assets
Goodwill
The Group allocates the fair value of the purchase consideration on the acquisition of a subsidiary to the assets acquired and liabilities assumed based on an assessment of fair value at the acquisition date. Any excess of purchase consideration is recognised as goodwill. Where goodwill is recognised, it is allocated to the cash generating units (CGUs) in a systematic manner reflective of how the Group expects to recover the value of the goodwill. Because the Group has been determined to consist of a single business unit, the carrying value of goodwill is tested for impairment based on the recoverable value of the Group as a whole.
Goodwill is not amortised but is tested for impairment on an annual basis, and the Group will also test for impairment at other times if there is an indication that an impairment may exist. Determining whether goodwill is impaired requires an estimation of the value-in-use of the CGU. The key estimates are therefore the selection of the suitable discount rates and the estimation of future growth rates which may depend on specific risks and the anticipated economic and market conditions related to the CGU.
As part of determining the value in use of the CGU, sensitivities have been considered on the underlying inputs included within the value-in-use calculations used for impairment reviews and no impact exists on the carrying value of goodwill, given the headroom identified as a result of the impairment test. Goodwill is impaired where circumstances indicate that the recoverable amount of the underlying CGU may no longer support the carrying value of the CGU. An impairment charge is recognised in the statement of profit and loss for the period in which it is determined the goodwill is no longer recoverable. Impairment losses related to goodwill cannot be reversed in future periods.
Internally Generated Intangible Assets - Research and Development Costs
Research
Expenditure on research activities is recognised as an expense in the period in which it is incurred. Research activities are aimed at creating new knowledge or the use of existing knowledge in new or creative ways to generate new concepts. Research activity does not typically have a defined commercial objective at the outset.
Development
Where projects evolve toward commerciality or are related to a specific commercial objective they are assessed to determine whether the activity constitutes development that is associated with a commercial objective or practical application.
The associated costs represent development costs and can be capitalised if, and only if, the following conditions can be demonstrated:
§ the technical feasibility of completing the intangible asset so that it can be made available for use or sale;
§ the intention to complete the intangible asset for use or sale;
§ the availability of adequate technical, financial and other resources to complete the development and to use or sell it;
§ an asset is created that can be separately identified for use or sale;
§ it is probable that the asset created will generate future economic benefits; and
§ the development cost of the asset can be measured reliably.
Development work undertaken by the Group typically relates to the refinement of design, materials selection, construction techniques, firmware and control systems to enhance battery system performance over successive generations. Where development costs are capitalised, they are amortised over the expected period to the introduction of the next generation of battery system.
Amortisation is recorded over that period on a straight-line basis with the corresponding amortisation charge recognised in the statement of profit and loss as a component of administrative expenses.
Four years has historically been the typical cycle time between successive generations of battery system design.
Other Intangible Assets
Intangible assets other than goodwill that are acquired by the Group are stated at their historical cost of acquisition less accumulated amortisation and any impairment losses.
Software and Purchased Domain Names
Third-party software is initially capitalised at its cost of purchase. Amortisation is charged to administrative expenses over the expected useful life of the software which has been assessed as three years from the date of acquisition.
Acquired domain names are initially capitalised at cost of purchase. Amortisation is charged to administrative expenses over the expected useful life of the domain name which has been assessed as ten years from the date of acquisition.
Patents and Certifications
Patent rights and certifications are initially capitalised at the cost of applying for relevant patent rights and other protections, and certifications. Amortisation is charged to administrative expenses over the expected useful life of the patents and certifications which has been assessed as five years from the date of acquisition.
Property, Plant and Equipment
Items of property, plant and equipment are stated at historical cost less accumulated depreciation and any impairment losses. Historical cost includes expenditure that is directly attributable to the acquisition of the items. Subsequent expenditure is only included in the asset's carrying amount or recognised as a separate asset, as appropriate, when it is probable that future economic benefits associated with that item will flow to the Group.
Costs that do not enhance the value of an asset such as repair and maintenance costs are charged to the statement of profit and loss in the period in which they are incurred.
Depreciation is charged to write off the cost of assets over their estimated useful lives on a straight-line basis. Depreciation commences on the date the assets are available for use. Work-in-progress assets are not depreciated until they are available for use and transferred to the appropriate category of property, plant and equipment.
Estimated useful lives for property, plant and equipment and other intangible assets are:
|
Category |
Period (Years) |
Recognition in Statement of Profit and Loss |
|
Computer and office equipment |
3 - 5 |
Administrative expenses |
|
Leasehold improvements |
Shorter of lease term or useful life |
Administrative expenses / Cost of sales |
|
Vehicles |
3 |
Administrative expenses |
|
Manufacturing equipment and tooling |
3 - 20 |
Cost of sales |
|
R&D Equipment |
5 - 10 |
Administrative expenses |
|
Software and purchased domain names |
3 |
Administrative expenses |
|
Patents and certifications |
10 |
Administrative expenses |
Depreciation methods, useful lives and residual values of assets are reviewed, and adjusted prospectively as appropriate, at each reporting date.
Where an asset is disposed of, the corresponding gain or loss on disposal is determined by comparing the sales proceeds received with the carrying amount of that asset at the date of disposal. Gains or losses on disposal of fixed assets are included within other items of operating income and expense in the statement of profit and loss.
Impairment of Tangible and Intangible Assets
The Group reviews the carrying values of its tangible and intangible assets, other than goodwill, at each balance sheet date to determine if any indicators exist that could mean those assets are impaired. Where an indicator of impairment exists the recoverable amount of the relevant asset (or CGU) is estimated to determine the amount of any potential impairment loss.
Recoverable amounts are determined using a discounted cash flow model related to each asset or CGU being assessed. The discount rate applied to the cash flows in the model is a pre-tax discount rate that reflects market assessment of the time value of money and risks specific to the groups of assets being considered.
If the recoverable value estimated in the cash flow model for a specific asset (or CGU) is lower than the carrying value, then the carrying value of the asset is reduced to its estimated recoverable value with a corresponding charge immediately recognised in the statement of profit and loss.
Where the condition that gave rise to an impairment loss reverses in a subsequent period, the impairment loss is similarly reversed and the carrying value of the asset increased to the revised estimate of its recoverable value. The carrying value of an asset immediately following the reversal of an impairment cannot exceed the carrying value that the asset would have had if the original impairment had not been made and the asset was depreciated as normal. A reversal of an impairment loss is recognised immediately in profit or loss.
The value of any impairment (or reversal of impairment) of an asset is recorded in the same financial statement line item where depreciation or amortisation of the asset would normally be shown.
Where it is impractical to meaningfully assess recoverable amount using a discounted cash flow model, for instance where near term cash flows are low or negative, an assessment of the fair value adjusted for the costs that would be incurred in the disposal of an asset or operation is used. This is typically the case for development stage assets, operations or associated intangible assets (including goodwill) where the underlying products or technologies have not yet been commercialised.
Provisions
Provisions are established when the Group has a present legal or constructive obligation because of past events. It is probable that an outflow of resources will be required to settle the obligation and the amount of that outflow can be reliably estimated.
Provisions are measured at the Group's best estimate of the expenditure required to settle the obligation at the financial position date, considering the risks and uncertainties of the obligation, and are discounted to present value of the expenditures that are expected to be incurred in settling the obligation using a pre-tax discount rate that reflects current market assessment of the time value of money and the risks related to the obligation. The initial recognition of a provision results in a corresponding charge to profit or loss. Where discounting is used, the carrying amount of a provision increases in each period to reflect the passage of time. This increase is recognised as borrowing cost.
Leases
Group entities only participate in lease contracts as the lessee. Lease contracts typically relate to facilities.
On inception of a contract, the Group assesses whether it contains a lease. A contract is a lease or contains a lease if it conveys the right to control the use of an identified asset for a period of time in exchange for consideration. The right to control the use of an identified asset is determined based on whether the Group has the right to obtain substantially all the economic benefits from the use of the asset throughout the period of use, and if the Group has the right to direct the use of the asset.
Obligations under a lease are recognised as a liability with a corresponding right-of-use asset, these are recognised at the commencement date of the lease.
The lease liability is initially measured at the present value of the lease payments that have not yet been paid at the inception of the lease, discounted using the interest rate implicit in the lease contract. Where the interest rate implicit in the lease contract cannot be readily determined, the Group's incremental borrowing rate is used.
Variable lease payments that do not depend on an index or rate are not included in the measurement of the lease liability. The lease liability is measured at amortised cost using the effective interest rate method.
The lease liability is subsequently measured at amortised cost using the effective interest method. It is remeasured when:
§ there is a change in future lease payments arising from a change in an index or rate;
§ there is a change in the Group's estimate of the amount expected to be payable under a residual value guarantee; or
§ the Group changes its assessment of whether it will exercise a purchase, extension or termination option.
When a lease liability is remeasured under one of these scenarios, a corresponding adjustment is made to the carrying value of the right-of-use asset or in profit and loss when the carrying amount of the asset has already been reduced to zero.
The corresponding right-of-use asset is initially measured at cost, which comprises the initial amount of the lease liability plus any lease payments made at or before the commencement date, any initial direct costs incurred and an estimate of the costs required to remove or restore the underlying asset, less any lease incentives received. The right-of-use asset is amortised over the shorter of the asset's useful life and the lease term on a straight-line basis.
The Group has elected not to recognise right-of-use assets and corresponding lease liabilities for short-term leases, those existing leases with a lease term of less than 12 months and leases related to low value assets with a value of £5,000 or less when new. The payments for the exempt leases are recognised as an expense on a straight-line basis over the lease term.
The Group has elected not to separate non-lease components from lease components, by class of underlying asset. Each lease component and any associated non-lease components are accounted for as a single lease component.
As an intermediate lessor the Group has accounted for its interest in the head lease and the sub-lease separately. The lease classification of a sub-lease is assessed with reference to the right-of-use asset arising from the head lease, not with reference to the underlying asset. The Group applies the derecognition and impairment requirements in IFRS 9 to the net investment in the lease.
Inventory
Inventory is stated at the lower of cost and net realisable value. Cost comprises direct materials and, where applicable, direct labour costs and those overheads that have been incurred in bringing the inventories to their current location and condition. Cost is calculated using the first-in, first-out method.
Net realisable value is calculated as the estimated selling price for an item of inventory less estimated costs of completion.
Prepaid Inventory
Prepaid inventory is recognised on inventory payments where physical delivery of that inventory has not yet been taken by the Group and is stated at the lower of cost and net realisable value.
Financial Instruments
Financial assets and liabilities are recognised by the Group and recorded in the statement of financial position when the Group is contractually bound to the terms of the financial instrument. Financial assets and liabilities are derecognised when the Group is no longer bound by the terms of the financial instrument through settlement or expiry.
Financial Assets
Financial assets are classified, at initial recognition, as subsequently measured at amortised cost, fair value through other comprehensive income (OCI), and fair value through profit or loss.
The classification of financial assets to which the Group is a party is determined by the nature of the underlying financial instrument and the characteristics of the contractual cash flows expected to be received under the terms of instrument.
Financial assets are not reclassified after their initial recognition unless there is a contractual change in the nature of the cash flows under the instrument or the business purpose of the instrument has changed.
For a financial asset to be classified and measured at amortised cost or fair value through OCI, it needs to give rise to cash flows that are 'solely payments of principal and interest (SPPI)' on the principal amount outstanding. This assessment is referred to as the SPPI test and is performed at an instrument level. Financial assets with cash flows that are not SPPI are classified and measured at fair value through profit or loss, irrespective of the business model.
Financial assets that the Group is party to are classified and measured as follows:
|
Financial Asset |
Measurement Basis |
|
Trade receivables |
Amortised cost |
|
Short-term investments |
Amortised cost |
|
Cash and cash equivalents |
Amortised cost |
Amortised Cost
On initial recognition, the Group measures amortised cost for financial assets based on the fair value of each financial asset together with any transaction costs that are directly attributable to the financial asset.
After initial recognition, amortised cost is measured for each financial asset held using the effective interest rate method less any impairment loss identified. Interest income is recognised for all financial assets, other than those that are classified as short-term, by applying the effective interest rate for the instrument. Interest income on short-term financial assets is not considered to be material. Short-term financial instruments are determined as those that have contractual terms of 12-months or less at inception.
Interest income, foreign exchange gains and losses, impairment, and any gain or loss on derecognition are recognised in profit or loss.
Impairment of Financial Assets
A loss allowance for financial assets is determined based on the lifetime expected credit losses for financial assets. Lifetime expected credit losses are estimated based on factors including the Group's experience of collection, the number and value of delayed payments past the average credit periods across the Group's financial assets. The Group will also consider factors such as changes in national or local economic conditions that correlate with default on receivables and financial difficulties being experienced by the counterparty.
Financial assets are impaired in full and a corresponding charge is recognised in profit or loss where there is no reasonable expectation of recovery.
Financial Liabilities
The classification of financial liabilities is determined at initial recognition. Financial liabilities are classified and measured as follows:
|
Financial Liability |
Measurement Basis |
|
Trade and other payables |
Amortised cost |
|
Derivative financial instrument |
Fair value through profit and loss |
|
Lease liabilities |
Amortised cost |
Amortised Cost
At initial recognition, the Group measures financial liabilities at amortised cost using the fair value of the underlying instrument less transaction costs directly attributable to the acquisition of the financial liability.
Derecognition of Financial Liabilities
The Group derecognises financial liabilities when the Group's obligations under the relevant instrument are discharged, expired or cancelled.
Derivative Financial Instruments
Derivatives are initially recognised at fair value on the date a derivative contract is entered into, and they are subsequently remeasured to their fair value at the end of each reporting period. Changes in the fair value of any derivative instrument are recognised immediately in profit or loss and are included in other gains/(losses).
Cash and Cash Equivalents
Cash and cash equivalents comprise cash in hand and on demand deposits, and other short-term highly liquid investments that are readily convertible to a known
amount of cash and are subject to an insignificant risk of change in value.
Equity Instruments
Instruments are classified as equity instruments if the substance of the relative contract arrangements evidences a residual interest in the assets of the Group after deducting all of its liabilities. Equity instruments issued by the Company are recorded as proceeds received, net of direct issue costs not charged to income.
Offsetting
Financial assets and financial liabilities are offset and the net amount is reported in the consolidated statement of financial position if there is a currently enforceable legal right to offset the recognised amounts and there is an intention to settle on a net basis, to realise the assets and settle the liabilities simultaneously.
3 Critical Accounting Judgments and Key sources of Estimation Uncertainty
The preparation of the financial statements in conformity with generally accepted accounting practice (GAAP) requires management to make estimates and judgments. Those estimates and judgments can affect the reported values for assets and liabilities as well as the disclosure of contingent assets and liabilities at the balance sheet date.
Management is also required to make estimates and judgments related to the reported amounts of revenues and expenses and related to the timing of the recognition of those revenues and expenses.
Judgments made and estimates applied are based on historical experience and other factors including management's expectations of future events that are considered relevant. Actual results may differ from these estimates. The estimates, judgments and underlying assumptions made are reviewed on an ongoing basis and specifically in the preparation of the interim and annual published financial information.
Revisions to accounting estimates are recognised in the period in which the estimate is revised and applied consistently in future periods subject to the ongoing reassessment of estimates.
Critical Judgments for the Year Under Review
Going Concern
The Directors are required to assess whether it is appropriate to prepare the financial statements on a going concern basis. In making this assessment the Directors need to be satisfied that the Group can meet its obligations as they fall due and will remain cash-positive for a period of at least 12 months from the date of approval of the financial statements. Potential additional funding that is not yet committed at the date of approval of the financial statements cannot be anticipated in making the assessment of going concern.
The Directors make their assessment based on a cash flow model prepared by management and based on its expectation of cash flows for the 18-month period from the date of approval of the financial statements. The extended period in the model provides additional comfort that the 12-month solvency requirement can be met when making the assessment of going concern.
In preparing the cash flow model, assumptions have been made regarding the timing of cash collection from customers based on the expected cash receipt under contracts that require milestone payments to be made by customers. The timing of the receipt of milestone payments may not always align with or precede the costs incurred by the Company in performing its obligations under a contract.
Downside sensitivities have been applied to the cash flows primarily related to limited sales being made and costs being reduced where necessary. Refer to 'Basis of preparation' for details of the going concern analysis performed and the Directors' conclusions regarding going concern.
The Directors expect that the business will continue to be viable throughout the model period and, accordingly, the financial statements have been prepared on a going concern basis.
Revenue Recognition
Sales contracts are assessed in accordance with the Group accounting policy for revenue recognition. The policy requires the identification of the performance obligations, or promises, under the contract and a determination of the conditions and implications of each performance obligation. Revenue is recognised only when a distinct and appropriate performance obligation under a contract is satisfied.
Some performance obligations are satisfied separately such as the delivery of the battery systems and integration hardware. Other obligations may be satisfied in conjunction with other contract promises or where a contract calls for equipment sold under the contract to be integrated into a larger project before formal acceptance is notified by the customer.
Where the ability of a customer to benefit from a product or service is dependent on the satisfaction of other performance obligations, more than one promise may need to be bundled together as a combined performance obligation that must be satisfied before the revenue related to each element can be recognised.
Identifying where hardware or services are readily available from other providers is a key determinant as to whether a contract promise represents a separate performance obligation or if it should be bundled with other promises that, together, represent a single performance obligation.
Sources of Estimation Uncertainty for the Year Under Review
Warranty Provision
The Company provides time-limited standard warranties in its contracts for sale of battery systems. In addition, customers may elect to purchase separate, standalone extended warranties. Extended warranties are for periods greater than the standard warranties that are provided with the purchase of all battery systems.
Estimating the costs that may be incurred by the Company in servicing warranty agreements requires management to estimate the number of expected claims in relation to the total number of battery systems sold. In addition, an estimate of costs that the Company could expect to incur to remedy each warranty claim should also be made to determine the amount of the total provision that should be recorded for warranties.
Provisions made in respect of expected warranty obligations are reassessed and remeasured where actual experience indicates the claim rate may be higher or lower than initially expected or where costs to remedy warranty claims differ from the assumptions used in calculating the provision. The release of an over-provision of warranty costs results in other operating income being recognised in the period whereas an additional provision for warranties results in a charge being recognised.
A 20% increase in the number of warranty claims or a 20% increase in the cost to remedy warranty issues would increase the provision by £22,895 (2023: £120,436). A 40% increase in the number of warranty claims or a 40% increase in the cost to remedy warranty issues would increase the provision by £45,791 (2023: £240,872).
Refer to note 21, contract related balances.
Provision for Onerous Contracts
A contract is onerous when the unavoidable costs of meeting the Company's obligations under the contract are expected to be greater than the revenue earned under that contract.
The assessment of unavoidable costs includes direct costs such as parts and labour and indirect costs, such as production overhead or indirect labour, that are expected to be incurred in servicing a warranty claim. Consideration is made with respect to expected costs to complete the contracts looking at historical information actualised for revenue contracts.
For extended warranty contracts, management consider the pool of historical data using fail rates and actualised costs to forecast future expected warranty costs expected to fulfil a contract. Management do not consider reimbursements from third parties in making this assessment.
The assessment of future costs is inherently subjective and requires the use of estimates in determining the appropriate amount of provision that may be required.
A 20% increase in unavoidable costs would increase the provision by £693,122 (2023: £66,493). A 40% increase in unavoidable costs would increase the provision by £1,386,244 (2023: £132,986).
Refer to note 21, contract related balances.
4 Revenue from Contracts with Customers and Income from Government Grants
Segment Information
The Group derives revenue from a single business segment, being the manufacture and sale of vanadium flow battery systems and related hardware together with the provision of services directly related to battery systems sold to customers.
The Group is organised internally to report on its financial and operational performance to its chief operating decision maker, which has been identified as the three Executive Directors as a group.
All revenues in 2024 were derived from continuing operations.
|
2024 |
2023 |
|
|
Revenue from contracts with customers |
£000 |
£000 |
|
Battery systems and associated control systems |
4,008 |
19,425 |
|
Integration hardware |
443 |
1,470 |
|
Installation and commissioning |
23 |
504 |
|
Other services |
541 |
607 |
|
Total revenue in the consolidated statement of profit and loss |
5,015 |
22,006 |
|
Analysed as: |
||
|
Revenue recognised at a point in time |
5,000 |
22,000 |
|
Revenue recognised over time |
15 |
6 |
|
Total revenue in the consolidated statement of profit and loss |
5,015 |
22,006 |
|
Grant income shown against cost of sales |
- |
11 |
|
5,015 |
22,017 |
Geographic Analysis of Revenue
The Group's revenue from contracts with customers was derived from the following geographic regions:
|
2024 |
2023 |
|
|
Geographic analysis of revenue |
£000 |
£000 |
|
Asia |
62 |
737 |
|
Australia |
19 |
6,212 |
|
Europe |
503 |
2,826 |
|
North America |
4,431 |
12,231 |
|
Total revenue in the consolidated statement of profit and loss |
5,015 |
22,006 |
The Group maintains its principal production and assembly facilities in Bathgate and Motherwell, Scotland and Vancouver, Canada. These facilities include office space for design, sales and administrative teams. The Group also has offices, operations and management based in London, England and San Francisco, California.
The Group does not consider that the locations of its operations constitute geographic segments as they are managed centrally by the executive management team. The location of the manufacturing plants and business development activity is a function of time-zone when servicing customers both pre-sale and during product delivery. The geographic location of offices, facilities and management is not related to distinct markets or customer characteristics at the present time.
Significant Customers and Concentration of Revenue
Revenue from contracts with customers was derived from two (2023: three) customers who each accounted for more than 10% of total revenue as follows:
|
2024 |
2023 |
|
|
Significant customers and concentration of revenue |
£000 |
£000 |
|
Customer A |
2,661 |
- |
|
Customer B |
1,387 |
- |
|
Customer C |
- |
6,238 |
|
Customer D |
- |
6,038 |
|
Customer E |
- |
4,299 |
Grant Income Other than Revenue
The Group receives grant income to help fund certain projects that are eligible for support, typically in the form of innovation grants. The total grant income that was received in the year was as follows:
|
2024 |
2023 |
|
|
Grant income received |
£000 |
£000 |
|
Grants for research and development |
106 |
160 |
|
Grants for product deployment |
67 |
378 |
|
Economic and social development |
2 |
1 |
|
Total government grants |
175 |
539 |
|
Disclosed as: Grant income against cost of sales |
- |
11 |
|
Grant income against administrative expenses |
175 |
528 |
5 Cost of Sales
|
2024 |
2023 |
|
|
£000 |
£000 |
|
|
Movement in inventories of finished battery systems |
6,434 |
27,023 |
|
Movement in provisions for warranty and warranty costs |
524 |
(429) |
|
Movement in provisions for sales contracts |
1,570 |
(1,233) |
|
Total cost of sales |
8,528 |
25,361 |
6 Administrative Expenses
|
2024 |
2023 |
|
|
£000 |
£000 |
|
|
Staff costs |
12,866 |
12,750 |
|
Research and development costs |
2,421 |
1,868 |
|
Research and development recoveries, tax credits and grants |
(1,150) |
(1,949) |
|
Professional fees |
755 |
669 |
|
Sales and marketing costs |
847 |
1,048 |
|
Facilities and office costs |
345 |
232 |
|
Depreciation and amortisation |
1,314 |
1,056 |
|
Other administrative costs |
2,936 |
3,411 |
|
Total administrative expenses |
20,334 |
19,085 |
No development costs were capitalised in the period (2023: £nil).
7 Auditors' Remuneration
|
2024 |
2023 |
|
|
£000 |
£000 |
|
|
Fees payable to the Company's auditors for the audit of the consolidated financial statements |
328 |
282 |
|
Audit of financial statements of subsidiaries pursuant to legislation |
18 |
17 |
|
Fees payable to the Company's auditor for other services: |
||
|
· Tax compliance services |
19 |
- |
|
365 |
299 |
The Group has a policy in place related to the commissioning of non-audit service from its auditors where all such work requires pre-approval by the Audit & Risk Committee before the commencement of any non-audit work.
Audit fees are discussed with and approved by the Audit & Risk Committee.
8 Staff Costs and Headcount
|
2024 |
2023 |
|
|
Staff costs |
£000 |
£000 |
|
Wages and salaries |
11,010 |
11,475 |
|
Employer payroll taxes |
905 |
839 |
|
Contributions to defined contribution plans |
143 |
123 |
|
Other benefits |
969 |
977 |
|
Share-based payments |
622 |
726 |
|
Total staff costs |
13,649 |
14,140 |
Administrative staff costs in the year were £12,865,615 (2023: £12,749,556) and staff costs included in cost of sales were £783,333 (2023: £1,390,336).
|
2024 |
2023 |
|
|
Average headcount |
Number |
Number |
|
Canada |
82 |
73 |
|
United Kingdom |
54 |
59 |
|
United States of America |
9 |
8 |
|
Total |
145 |
140 |
Key Management Compensation
The key management of the Group comprises the members of the senior leadership team.
|
2024 |
2023 |
|
|
Key management compensation |
£000 |
£000 |
|
Short-term employee benefits |
2,110 |
2,364 |
|
Post-employment benefits |
22 |
14 |
|
Termination benefits |
82 |
- |
|
Equity settled share-based payment |
386 |
263 |
|
Total key management compensation |
2,600 |
2,641 |
9 Share-based Payments
Since its incorporation, the Company has operated various share-based incentive plans. The purpose of each of the schemes has been to incentivise Directors and employees related to improving Company performance and building shareholder value.
Set out below is a summary of the option awards in issue at 31 December 2024.
|
Standard |
Grant date |
Final Expiry date |
Exercise price |
2024 |
2023 |
|
|
redT 2018 plan |
18 May 2018 |
18 May 2023 |
352.50 |
p |
3,888 |
3,888 |
|
Invinity Energy 2018 ESOP |
01 Apr 2020 |
12 Mar 2030 |
82.50 |
p |
424,571 |
441,428 |
|
Invinity Energy 2018 Consultant SOP |
01 Apr 2020 |
12 Mar 2030 |
82.50 |
p |
378,000 |
378,000 |
|
Invinity Energy 2018 ESOP |
01 Apr 2020 |
21 Nov 2029 |
4.34 |
p |
1,052,134 |
1,052,134 |
|
Invinity Energy 2018 ESOP |
01 Apr 2020 |
08 May 2029 |
6.84 |
p |
628,358 |
628,358 |
|
Invinity Energy 2018 ESOP |
26 Aug 2020 |
26 Aug 2030 |
113.00 |
p |
1,360,000 |
1,540,000 |
|
Invinity Energy 2018 ESOP |
28 Jan 2021 |
28 Jan 2031 |
204.00 |
p |
258,000 |
313,000 |
|
Invinity Energy 2018 ESOP |
04 Mar 2021 |
04 Mar 2031 |
152.00 |
p |
150,000 |
170,000 |
|
Invinity Energy 2018 ESOP |
15 Apr 2021 |
15 Apr 2031 |
151.00 |
p |
84,000 |
84,000 |
|
Invinity Energy 2018 ESOP |
03 Aug 2021 |
03 Aug 2031 |
134.50 |
p |
275,000 |
290,000 |
|
Invinity Energy 2018 ESOP |
29 Oct 2021 |
29 Oct 2031 |
111.50 |
p |
251,000 |
263,000 |
|
Invinity Energy 2018 ESOP |
20 Dec 2021 |
20 Dec 2031 |
91.00 |
p |
135,000 |
135,000 |
|
Invinity Energy 2018 ESOP |
03 Feb 2022 |
03 Feb 2032 |
64.50 |
p |
112,000 |
150,000 |
|
Invinity Energy 2018 ESOP |
02 Mar 2022 |
02 Mar 2032 |
93.50 |
p |
45,000 |
45,000 |
|
Invinity Energy 2018 ESOP |
11 Apr 2022 |
11 Apr 2032 |
90.00 |
p |
60,000 |
60,000 |
|
Invinity Energy 2018 ESOP |
11 Jul 2022 |
11 Jul 2032 |
45.50 |
p |
500,000 |
500,000 |
|
Invinity Energy 2018 ESOP |
08 Dec 2022 |
08 Dec 2032 |
38.00 |
p |
311,000 |
531,000 |
|
Invinity Energy 2018 ESOP |
27 Jan 2023 |
27 Jan 2033 |
42.00 |
p |
2,334,400 |
2,655,100 |
|
Invinity Energy 2018 ESOP |
20 Apr 2023 |
20 Apr 2033 |
43.50 |
p |
62,000 |
97,000 |
|
Invinity Energy 2018 ESOP |
19 Jul 2023 |
19 Jul 2033 |
51.20 |
p |
3,278,000 |
4,177,000 |
|
Invinity Energy 2018 ESOP |
26 Oct 2023 |
26 Oct 2033 |
38.00 |
p |
339,000 |
369,000 |
|
Invinity Energy 2018 ESOP |
07 Dec 2023 |
07 Dec 2033 |
29.50 |
p |
30,000 |
75,000 |
|
Invinity Energy 2018 ESOP |
22 Jan 2024 |
22 Jan 2034 |
24.00 |
p |
102,000 |
- |
|
Invinity Energy 2018 ESOP |
13 Mar 2024 |
14 Mar 2034 |
30.50 |
p |
33,000 |
- |
|
12,206,351 |
13,957,908 |
|||||
|
Weighted average remaining contractual life of options outstanding at the end of the year |
7.12 |
7.96 |
||||
No employee options were exercised during the year (2023: 39,956) with a weighted average exercise price of nil pence per share (2023: 14.64p). On 14 October 2024, the Company extended the expiry date of 1,052,134 options with grant date of 1 April 2020 to 21 November 2029. These options were fully vested and extension has no impact on current period loss.
The grant-date fair value of share options issued is calculated using a Black-Scholes methodology at the date of grant. Key inputs to the model include the share price at the date of grant, the option exercise price, the term of the award, share price volatility, the risk-free interest rate (by reference to government bond yields) and the expected dividend yield rate, which has historically been and continues to be zero, reflective of the development-stage nature of the Group.
The aggregate number of options granted, vested, exercised and forfeited during the year under the plans are summarised and analysed between unvested and vested awards as follows:
|
Unvested |
Vested |
|||
|
At 1 January 2024 |
8,599,174 |
51.64p |
5,358,734 |
74.42p |
|
Granted |
150,000 |
25.43p |
- |
- |
|
Forfeited |
(871,176) |
46.34p |
(1,030,381) |
71.46p |
|
Vested |
(2,484,748) |
61.73p |
2,484,748 |
61.73p |
|
Exercised |
- |
- |
- |
- |
|
At 31 December 2024 |
5,393,250 |
47.12p |
6,813,101 |
70.24p |
|
Unvested |
Vested |
|||
|
At 1 January 2023 |
3,538,691 |
84.86p |
4,249,925 |
72.80p |
|
Granted |
8,184,600 |
46.41p |
- |
- |
|
Forfeited |
(1,279,738) |
52.13p |
(695,614) |
114.21p |
|
Vested |
(1,844,379) |
91.84p |
1,844,379 |
91.84p |
|
Exercised |
- |
- |
(39,956) |
14.64p |
|
At 31 December 2023 |
8,599,174 |
51.64p |
5,358,734 |
74.42p |
Plans with Standard Performance Conditions
The primary share plan that remains outstanding at 31 December 2024 is the 2018 plan. The 2018 plan was adopted by the Board on 14 May 2018 and introduced HMRC scheme rules related to certain non-taxable option grants. The plan contains a provision to issue options as CSOP, EMI or unapproved awards.
Subsequent to the report period, on 8 January 2025, the new 2025 Employee Share Option Plan was adopted without impact to the 2024 period
Refer to note 33, Events Occurring After the Report Period.
Parallel Options Issued
In addition, certain legacy redT options were reissued in 2020 as they were considered by the Board to be sufficiently 'out-of-the-money' such that they no longer provided a performance incentive to the holders of the options. As a mechanism to adjust the terms of the unfavourable options, new parallel options were issued on a one-for-one basis with the same terms as the original awards excepting that they were issued with a lower exercise price.
Both the original and parallel option schemes remain in existence. However, the exercise by an employee of a single option from either pool (original or parallel) allocated to them will cause the equivalent value in the other pool to be forfeited. Accordingly, the number of options disclosed above has been adjusted to remove the number of options that is equivalent to the number of parallel options issued.
Other Options
On 10 May 2021, the Company granted an option for 8,672,273 shares to Gamesa Electric S.A. Unipersonal ("GaE"), a wholly-owned subsidiary of Siemens Gamesa Renewable Energy S.A. The options were granted to GaE in consideration of its entering into a joint development and commercialisation agreement with Invinity Energy Nexus Limited, a wholly-owned subsidiary of the Company.
The exercise price of the options is 175 pence and upon exercise of those options then for as long as GaE holds at least 5% of the issued share capital of the Company it shall be entitled, subject to certain conditions, to nominate one non-executive director to the Board of the Company. On 14 October 2024, the Company extended the expiry date by one year to 10 May 2026.
Warrants Issued in the Period or Outstanding
The Company had 909,090 warrants outstanding at 31 December 2023 in relation to a 2020 investment agreement with Riverfort Global Opportunities ("Riverfort") which expired 2 April 2024I.
VSA Capital was awarded 340,000 warrants with an exercise price of 82.5 pence in April 2020, at the time of the merger. These warrants expired on 2 April 2025.
In December 2021, the Company issued 14,464,571 'placing units' comprised of one share, one short-term warrant and one long-term warrant. The short-term warrants expired in 2023 and the long-term warrants expired 16 December 2024.
In December 2022, the Company issued 1,800,000 warrants as part of the convertible loan facility with Riverfort Global Opportunities and YA II PN Ltd ("Noteholders"). Each warrant gives the holder the right to subscribe for one new ordinary share at a price of 32 pence per ordinary share until 14 December 2026.
10 Other Items of Operating Income and Expense
The following items are included in comprehensive loss:
|
2024 |
2023 |
|
|
£000 |
£000 |
|
|
(Income)/expense |
||
|
Gain on legal settlement |
(169) |
- |
|
(Gain)/loss on curtailment of right-of-use asset |
(2) |
205 |
|
Gain on disposal of property, plant and equipment |
- |
(15) |
|
Sublease income |
(18) |
|
|
Impairment of inventory to net realisable value |
376 |
151 |
|
Obsolete inventory |
70 |
8 |
|
Reversal of impairment of inventory to net realisable value |
(47) |
|
|
Total other operating expenses |
210 |
349 |
11 Net Finance Income and Costs
|
2024 |
2023 |
|
|
£000 |
£000 |
|
|
Finance income |
||
|
Interest on bank deposits and money market funds |
(1,220) |
(299) |
|
Interest on sublease income |
(2) |
- |
|
Amortisation of financial instrument |
(135) |
(135) |
|
Gain on realised foreign currency transactions |
(100) |
(42) |
|
Finance costs |
||
|
Finance charges on convertible loan notes and financial instruments |
- |
903 |
|
Finance charges for lease liabilities |
92 |
44 |
|
Finance charges for liabilities held at amortised cost |
13 |
1 |
|
Loss/(gain) on unrealised foreign currency transactions |
92 |
(71) |
|
Net finance costs/(income) |
1,260 |
401 |
12 Income Tax Expense
|
2024 |
2023 |
|
|
£000 |
£000 |
|
|
Current tax |
||
|
Current tax on profits for the year |
- |
- |
|
Total current tax expense |
- |
- |
Reconciliation of income tax expense calculated using statutory tax rate
|
2024 |
2023 |
|
|
£000 |
£000 |
|
|
Loss before tax |
(22,797) |
(23,179) |
|
Tax at the Jersey rate of nil% |
- |
- |
|
Tax effect of amounts which are not deductible (taxable) in calculating taxable income: |
||
|
Non-taxable gains and expenses not deductible for tax |
2 |
67 |
|
Differences in overseas tax rates |
(5,266) |
(4,761) |
|
Unrelieved tax losses carried forward |
4,852 |
4,615 |
|
Origination and reversal of timing differences not recognised |
412 |
79 |
|
Total income tax expense |
- |
- |
13 Loss per Share
|
2024 |
2023 |
|
|
Basic loss per share |
In pence |
In pence |
|
From continuing operations |
(6.7) |
(13.1) |
|
2024 |
2023 |
|
|
Diluted loss per share |
In pence |
In pence |
|
From continuing operations |
(6.7) |
(13.1) |
|
2024 |
2023 |
|
|
Loss used in calculation of basic and diluted loss per share |
£000 |
£000 |
|
From continuing operations |
(22,797) |
(23,179) |
|
2024 |
2023 |
|
|
Weighted average number of shares used in calculation |
Number |
Number |
|
Basic |
342,812,364 |
176,439,069 |
|
Diluted |
344,057,635 |
177,915,837 |
Additional potential shares used in the calculation of diluted earnings per share primarily relate to potential shares outstanding at 31 December 2024 that may be issued in satisfaction of 'in-the-money' employee share options. Potentially dilutive shares related to 'in-the-money' outstanding warrants to subscribe for ordinary shares in the Company are also included in calculating diluted earnings per share.
Where additional potential shares have an anti-dilutive impact on the calculation of loss per share calculation, such potential shares are excluded from the weighted average number of shares used in the calculation.
|
2024 |
2023 |
|
|
Weighted average number of shares used in loss per share calculation - basic and diluted |
Number |
Number |
|
In issue at 1 January |
191,067,464 |
119,007,846 |
|
Shares issued in the year - weighted average |
151,744,900 |
57,431,223 |
|
Weighted average shares in issue 31 December |
342,812,364 |
176,439,069 |
|
Effect of employee share options and other warrants not exercised |
1,245,271 |
1,476,768 |
|
Weighted average number of diluted shares in issue 31 December |
344,057,635 |
177,915,837 |
Additional potential shares are anti-dilutive where their inclusion in the calculation of loss per share results in a lower loss per share. The weighted average number of shares not included in the diluted loss per share calculation because they had an anti-dilutive effect on the calculation was nil (2023: 26,279,049).
14 Cash Flows from Operating Activities
|
2024 |
2023 |
|
|
£000 |
£000 |
|
|
Loss after income tax |
(22,797) |
(23,179) |
|
Adjustments for: |
||
|
Depreciation and amortisation |
1,383 |
1,399 |
|
Gain on disposal of property, plant and equipment |
- |
(15) |
|
Gain on right-of-use asset curtailment |
(2) |
- |
|
Impairment of inventory |
329 |
151 |
|
Obsolete inventory |
70 |
8 |
|
Share-based payments charge |
622 |
726 |
|
Equity settled interest and transaction costs on Investment funding arrangement |
- |
|
|
Net finance costs |
(43) |
481 |
|
Loss/(gain) on unrealised foreign currency transactions |
19 |
(71) |
|
(20,419) |
(20,500) |
|
|
Change in operating assets & liabilities |
||
|
(Increase)/decrease in inventory |
(2,971) |
6,144 |
|
Decrease/(increase) in contract assets |
28 |
(694) |
|
Decrease/(increase) in trade receivables and other receivables |
1,610 |
(796) |
|
(Increase)/decrease in other current assets and prepaid inventory |
(6,125) |
5,823 |
|
Increase/(decrease) in trade and other payables |
624 |
(956) |
|
Decrease in warranty provision |
(481) |
(647) |
|
Increase/(decrease) in onerous contract provision |
1,567 |
(1,217) |
|
Increase/(decrease) in contract liabilities |
64 |
(6,814) |
|
(5,684) |
843 |
|
|
Cash used in operations |
(26,103) |
(19,657) |
15 Goodwill and Other Intangible Assets
|
Goodwill |
Patents and Certifications |
Software and Domain Names |
Total |
|
|
£000 |
£000 |
£000 |
£000 |
|
|
Cost |
||||
|
At 1 January 2024 |
23,944 |
203 |
34 |
24,181 |
|
Disposals |
- |
- |
- |
- |
|
Foreign currency exchange differences |
- |
- |
(2) |
(2) |
|
At 31 December 2024 |
23,944 |
203 |
32 |
24,179 |
|
Accumulated amortisation |
||||
|
At 1 January 2024 |
- |
(153) |
(26) |
(179) |
|
Amortisation charge |
- |
(40) |
(2) |
(42) |
|
Disposals |
- |
- |
- |
- |
|
Foreign currency exchange differences |
- |
- |
1 |
1 |
|
At 31 December 2024 |
- |
(193) |
(27) |
(220) |
|
Net book value |
||||
|
At 1 January 2024 |
23,944 |
50 |
8 |
24,002 |
|
At 31 December 2024 |
23,944 |
10 |
5 |
23,959 |
|
Goodwill |
Patents and Certifications |
Software and Domain Names |
Total |
|
|
£000 |
£000 |
£000 |
£000 |
|
|
Cost |
||||
|
At 1 January 2023 |
23,944 |
203 |
50 |
24,197 |
|
Disposals |
- |
- |
(15) |
(15) |
|
Foreign currency exchange differences |
- |
- |
(1) |
(1) |
|
At 31 December 2023 |
23,944 |
203 |
34 |
24,181 |
|
Accumulated amortisation |
||||
|
At 1 January 2023 |
- |
(112) |
(35) |
(147) |
|
Amortisation charge |
- |
(41) |
(7) |
(48) |
|
Disposals |
- |
- |
15 |
15 |
|
Foreign currency exchange differences |
- |
- |
1 |
1 |
|
At 31 December 2023 |
- |
(153) |
(26) |
(179) |
|
Net book value |
||||
|
At 1 January 2023 |
23,944 |
91 |
15 |
24,050 |
|
At 31 December 2023 |
23,944 |
50 |
8 |
24,002 |
For impairment testing goodwill acquired through business combinations and patents and certifications with indefinite useful lives are allocated to the single CGU.
Goodwill
All goodwill is tested annually for impairment. At 31 December 2024, goodwill was tested for impairment using the fair value less cost of disposal method. The closing share price on 31 December 2024 was 16 pence giving a market capitalisation of £70.5 million which is more than £4.8 million higher than the Net Assets value of the Company on this date. The share price would need to have dropped below 15 pence for the market value to be below the Net Asset value of the Company at that date. Based on the above, no impairment loss was identified in relation to goodwill.
On 24 May 2024, the Company announced the results of a placing, subscription and open offer. The fundraising raised total proceeds of £57.38 million through placing of 121,739,130 new ordinary shares, subscription of 121,739,130 new ordinary shares and open offer of 6,011,983 new ordinary shares at 23.0 pence per share.
Post Balance Sheet events: Since 31 December 2024 the share price has traded across a high-low range of 20.4 pence to 7.76 pence per share.
Patents and Certifications
There have been no events or circumstances that would indicate that the carrying value of patents and certifications may be impaired at 31 December 2024.
16 Property, Plant and Equipment
|
Computer and Office Equipment |
Leasehold Improvements |
Vehicles and Equipment |
Total |
|
|
£000 |
£000 |
£000 |
£000 |
|
|
Cost |
||||
|
At 1 January 2024 |
554 |
823 |
2,235 |
3,612 |
|
Additions |
118 |
386 |
807 |
1,311 |
|
Transfers |
99 |
(68) |
31 |
|
|
Foreign currency exchange differences |
(17) |
(51) |
(108) |
(176) |
|
At 31 December 2024 |
655 |
1,257 |
2,866 |
4,778 |
|
Accumulated Depreciation |
||||
|
At 1 January 2024 |
(465) |
(424) |
(1,024) |
(1,913) |
|
Depreciation charge |
(52) |
(232) |
(328) |
(612) |
|
Foreign currency exchange differences |
13 |
33 |
47 |
93 |
|
At 31 December 2024 |
(504) |
(623) |
(1,305) |
(2,432) |
|
Net book value |
||||
|
At 1 January 2024 |
89 |
399 |
1,211 |
1,699 |
|
At 31 December 2024 |
151 |
634 |
1,561 |
2,346 |
|
Computer and Office Equipment |
Leasehold Improvements |
Vehicles and Equipment |
Total |
|
|
£000 |
£000 |
£000 |
£000 |
|
|
Cost |
||||
|
At 1 January 2023 |
699 |
1,119 |
1,402 |
3,220 |
|
Additions |
76 |
212 |
799 |
1,087 |
|
Disposals |
(214) |
(328) |
(125) |
(667) |
|
Transfers |
- |
(161) |
191 |
30 |
|
Foreign currency exchange differences |
(7) |
(19) |
(32) |
(58) |
|
At 31 December 2023 |
554 |
823 |
2,235 |
3,612 |
|
Accumulated Depreciation |
||||
|
At 1 January 2023 |
(662) |
(635) |
(715) |
(2,012) |
|
Depreciation charge |
(23) |
(271) |
(230) |
(524) |
|
Disposals |
214 |
328 |
83 |
625 |
|
Transfers |
- |
147 |
(177) |
(30) |
|
Foreign currency exchange differences |
6 |
7 |
15 |
28 |
|
At 31 December 2023 |
(465) |
(424) |
(1,024) |
(1,913) |
|
Net book value |
||||
|
At 1 January 2023 |
37 |
484 |
687 |
1,208 |
|
At 31 December 2023 |
89 |
399 |
1,211 |
1,699 |
The Group has no assets pledged as security. No amounts of interest have been capitalised within property, plant and equipment at 31 December 2024 (2023: £nil).
17 Right-of-use Assets
|
Offices and Facilities |
|
|
£000 |
|
|
Cost |
|
|
At 1 January 2024 |
3,046 |
|
Additions |
893 |
|
Adjustments1 |
(126) |
|
Transfers2 |
(58) |
|
Curtailments and disposals |
(815) |
|
Foreign currency exchange differences |
(136) |
|
At 31 December 2024 |
2,804 |
|
Accumulated Depreciation |
|
|
At 1 January 2024 |
(1,488) |
|
Depreciation charge |
(729) |
|
Adjustments1 |
126 |
|
Transfers2 |
27 |
|
Curtailments and disposals |
710 |
|
Foreign currency exchange differences |
76 |
|
At 31 December 2024 |
(1,278) |
|
Net book value |
|
|
At 1 January 2024 |
1,558 |
|
At 31 December 2024 |
1,526 |
|
Offices and Facilities |
Vehicles and Equipment |
Total |
|
|
£000 |
£000 |
£000 |
|
|
Cost |
|||
|
At 1 January 2023 |
3,330 |
31 |
3,361 |
|
Additions |
929 |
- |
929 |
|
Adjustments |
(392) |
- |
(392) |
|
Transfers |
- |
(30) |
(30) |
|
Curtailments and disposals |
(738) |
- |
(738) |
|
Foreign currency exchange differences |
(83) |
(1) |
(84) |
|
At 31 December 2023 |
3,046 |
- |
3,046 |
|
Accumulated Depreciation |
|||
|
At 1 January 2023 |
(1,489) |
(27) |
(1,516) |
|
Depreciation charge |
(824) |
(4) |
(828) |
|
Adjustments |
200 |
- |
200 |
|
Transfers |
- |
30 |
30 |
|
Curtailments and disposals |
582 |
- |
582 |
|
Foreign currency exchange differences |
43 |
1 |
44 |
|
At 31 December 2023 |
(1,488) |
- |
(1,488) |
|
Net book value |
|||
|
At 1 January 2023 |
1,841 |
4 |
1,845 |
|
At 31 December 2023 |
1,558 |
- |
1,558 |
1. Non-material adjustment to reflect opening balance difference for both cost and accumulated depreciation with no impact to profit & loss in the report period.
2. During the year, right-of-use assets were transferred to property, plant and equipment upon completion of lease terms.
Right-of-use assets relate to buildings, vehicles and equipment held under leases with third-party lessors. A right-of-use asset represents the Company's right to use a leased asset over the term of the lease. The Company's rights to use specific buildings, items of equipment or specific vehicles under lease arrangements represent assets to the Group.
The lease payments are discounted using the interest rate implicit in the lease. If that rate cannot be readily determined, which is generally the case for leases in the Group, the lessee's incremental borrowing rate is used, being the rate that the individual lessee would have to pay to borrow the funds necessary to obtain an asset of similar value to the right-of-use asset in a similar economic environment with similar terms, security and conditions.
To determine the incremental borrowing rate, the Group:
§ where possible, uses recent third-party financing received by the individual lessee as a starting point, adjusted to reflect changes in financing conditions since third party financing was received;
§ uses a build-up approach that starts with a risk-free interest rate adjusted for credit risk for leases held by the Group, which does not have recent third-party financing; and
§ makes adjustments specific to the lease, e.g. term, country, currency and security.
18 Deferred Tax Balances
Net Deferred Tax Assets Not Recognised:
|
2024 |
2023 |
|
|
£000 |
£000 |
|
|
Deferred tax relates to the following: |
||
|
Accelerated capital allowances |
1,707 |
1,424 |
|
Share options |
46 |
79 |
|
Accrued liabilities |
53 |
68 |
|
Reserves and other |
277 |
221 |
|
Tax losses |
29,224 |
24,088 |
|
Total net deferred tax assets |
31,307 |
25,880 |
Gross Deferred Tax Assets Not Recognised:
|
2024 |
2023 |
|
|
£000 |
£000 |
|
|
Deferred tax relates to the following: |
||
|
Accelerated capital allowances |
6,493 |
5,292 |
|
Share options |
169 |
292 |
|
Accrued liabilities |
199 |
266 |
|
Reserves and other |
1,207 |
901 |
|
Tax losses |
130,759 |
110,568 |
|
Total gross deferred tax assets |
138,827 |
117,319 |
Tax Losses Available for Use in Future Periods
The Company's subsidiaries carry on business in other tax regimes where the corporation tax rate is not zero. At 31 December 2024, the Group had the following tax losses carried forward available for use in future periods:
|
2024 |
2023 |
|
|
£000 |
£000 |
|
|
United Kingdom |
58,376 |
51,887 |
|
Canada |
49,290 |
35,928 |
|
United States |
18,628 |
16,539 |
|
Ireland |
4,465 |
6,214 |
|
Total potential tax benefit |
130,759 |
110,568 |
Under current tax legislation tax losses in the United Kingdom and Ireland can be carried forward indefinitely and be offset against future profits arising from the same activities at the tax rate prevailing at that time. There is a portion of the tax losses in the United States that will begin to expire in 2036, whereas the majority can be carried forward indefinitely. The tax losses in Canada can be carried forward 20 years and will begin to expire in 2035.
Due to the uncertainty regarding the timing and extent of future profits within these subsidiaries, no deferred tax assets have been recognised in respect of these tax losses. Deferred tax is also not recognised on the timing differences between accounting and tax treatment in these subsidiaries given the offsetting tax losses on which no deferred tax has been recognised.
The UK Government announced that the Corporation Tax rate increased from 19% to 25% on profits of over £250,000, effective 1 April 2023. Profits below £50,000 continue to be chargeable to Corporation Tax at 19%. In computing the UK deferred tax asset, management has assumed that as neither the deferred tax assets nor the deferred tax liabilities will crystallise in the immediate future, calculations based on 19% are appropriate.
19 Inventory
|
2024 |
2023 |
|
|
£000 |
£000 |
|
|
Raw materials and consumables |
3,377 |
2,961 |
|
Work in progress |
2,285 |
285 |
|
Finished goods |
91 |
42 |
|
Total inventory |
5,753 |
3,288 |
Inventory recognised as an expense within cost of sales during the current year amounted to £6,433,679 (2023: £27,023,108).
At 31 December 2024, inventory impairment to net realisable value totalled £376,000 (2023: £150,988). Net reversal of inventory write-downs during the current year amounted to £46,626 (2023: £nil).
20 Other Current Assets
|
2024 |
2023 |
|
|
£000 |
£000 |
|
|
Short-term investments |
3,000 |
- |
|
Prepaid inventory |
2,469 |
1,073 |
|
Tax credits - recoverable |
856 |
719 |
|
Prepayments and deposits |
736 |
475 |
|
Sublease net investment |
65 |
- |
|
Other receivables |
522 |
454 |
|
Total other current assets |
7,648 |
2,721 |
Prepaid inventory is recognised on inventory payments where physical delivery of that inventory has not yet been taken by the Group.
Short-term investments comprise deposits with original maturity greater than three months but less than twelve months from the date of acquisition and which are not subject to significant risk of change in value.
21 Contract Related Balances
The Group has recognised the following assets and liabilities related to revenue from contracts with customers that are in progress at the respective year-ends:
|
2024 |
2023 |
|
|
£000 |
£000 |
|
|
Amounts due from customer contracts included in trade receivables |
827 |
2,496 |
|
Contract assets (accrued income for work done not yet invoiced) |
1,149 |
888 |
|
Non-current contract assets |
- |
304 |
|
Contract liabilities (deferred revenue related to advances on customer contracts) |
(1,392) |
(1,312) |
|
Net position of sales contracts |
584 |
2,376 |
The amount of revenue recognised in the year that was included in contract liabilities at the end of the prior year was £876,586 (2023: £8,097,770).
The aggregate position on customer contracts included in the statement of financial position will change according to the number and size of contracts in progress at a given year-end as well as the status of payment milestones made by customers toward servicing those contracts. The Group structures payment milestones in its customer contracts to cover upfront expenditure for parts and materials and other working capital requirements associated with the delivery of promises under customer contracts to better manage Group cash flow.
The timing of revenue recognition is based on the satisfaction of individual performance obligations within a contract and is not based on the timing of advances received. Customer advances are recognised as contract liabilities in the statement of financial position and are released to income progressively as individual performance obligations are met. The difference in timing between the receipt of contract advances and the timing of the satisfaction of performance obligations for revenue recognition can cause values to remain in deferred income. The amount of such deferrals is related to both the overall size of the underlying contract and the planned pace of delivery in the related work schedule. This is expected to occur where satisfaction of performance obligations is evidenced by customer acceptance of the good or service that is the subject of the performance obligation.
Provisions related to contracts with customers
|
Warranty Provision |
Provision |
Total |
|
|
£000 |
£000 |
£000 |
|
|
At 1 January 2024 |
602 |
333 |
935 |
|
Charges to profit or loss: |
|||
|
· Provided in the year |
81 |
2,198 |
2,279 |
|
· Unused amounts reversed |
(103) |
- |
(103) |
|
Amounts used in the year |
(460) |
(631) |
(1,091) |
|
Foreign exchange |
(6) |
(6) |
(12) |
|
At 31 December 2024 |
114 |
1,894 |
2,008 |
|
Current |
85 |
296 |
381 |
|
Non-current |
29 |
1,598 |
1,627 |
|
Warranty Provision |
Legacy Products Provision |
Provision |
Total |
|
|
£000 |
£000 |
£000 |
£000 |
|
|
At 1 January 2023 |
284 |
1,016 |
1,607 |
2,907 |
|
Charges to profit or loss: |
||||
|
· Provided in the year |
552 |
15 |
332 |
899 |
|
· Unused amounts reversed |
(38) |
(968) |
(235) |
(1,241) |
|
Amounts used in the year |
(195) |
(13) |
(1,315) |
(1,523) |
|
Foreign exchange |
(1) |
(50) |
(56) |
(107) |
|
At 31 December 2023 |
602 |
- |
333 |
935 |
|
Current |
586 |
- |
226 |
812 |
|
Non-current |
16 |
- |
107 |
123 |
Warranty Provision
The warranty provision represents management's best estimate of the costs anticipated to be incurred related to warranty claims, both current and future, from customers in respect of goods and services sold that remain within their warranty period. The estimate of future warranty costs is updated periodically based on the Company's actual experience of warranty claims from customers.
The element of the provision related to potential future claims is based on management's experience and is judgmental in nature. As for any product warranty, there is an inherent uncertainty around the likelihood and timing of a fault occurring that would cause further work to be undertaken or the replacement of equipment parts.
A standard warranty of up to two years from the date of commissioning is provided to all customers on goods and services sold and is included in the original cost of the product. Customers are also able to purchase extended warranties that extend the warranty period for up to a total of ten years.
Provision for Contract Losses
A provision is established for contract losses when it becomes known that a customer contract has become onerous. A contract is onerous when the unavoidable costs of fulfilling the Group's obligations under a contract are greater than the revenue that will be earned from it.
The unavoidable costs of fulfilling contract obligations will include both direct and indirect costs.
The creation of an additional provision is recognised immediately in profit and loss. The provision is used to offset subsequent costs incurred as the contract moves to completion.
In determining the amount to be provided, management has evaluated the likelihood of input costs continuing to rise against a backdrop of inflation and instability due to current macro-economic factors such as, the increasing price of oil feeding through to production and shipping costs and continuing supply chain issues.
Provisions in respect of contract losses relate to contracts which are expected to be delivered in 2025 and will therefore unwind during that year. Provisions in respect of contract losses relating to extended warranties for up to a total of ten years will unwind over that period.
22 Trade Receivables
|
2024 |
2023 |
|
|
£000 |
£000 |
|
|
Total trade receivables |
827 |
2,496 |
All trade receivables relate to receivables arising from contracts with customers.
Trade receivables are amounts due from customers for sales of vanadium flow battery systems in the ordinary course of business. Trade receivables do not bear interest and generally have 30-day payment terms and therefore are all classified as current.
The actual credit loss over 2024 was determined to be less than 1% of total sales (2023: less than 1%). An allowance for potential credit losses of £nil (2023: £139,639) has been recognised.
23 Cash and Cash Equivalents
|
2024 |
2023 |
|
|
£000 |
£000 |
|
|
Cash and cash equivalents |
3,352 |
5,014 |
|
Term deposits |
29,000 |
- |
|
Total cash and cash equivalents |
32,352 |
5,014- |
Term deposits are presented as cash equivalents if they have a maturity of three months or less from the date of acquisition.
24 Trade and Other Payables
|
2024 |
2023 |
|
|
£000 |
£000 |
|
|
Trade payables |
2,967 |
2,166 |
|
Other payables |
58 |
29 |
|
Accrued liabilities |
891 |
877 |
|
Accrued employee compensation |
571 |
772 |
|
Government remittances payable |
38 |
104 |
|
Total trade and other payables |
4,525 |
3,948 |
Trade payables are unsecured and are usually paid within 30 days.
The carrying amounts of trade and other payables are the same as their fair values due to the short-term nature of the underlying obligation representing the liability to pay.
25 Derivative Financial Instruments
|
2024 |
2023 |
|
|
£000 |
£000 |
|
|
Derivative value of warrants issued |
271 |
406 |
|
Total derivative financial instruments |
271 |
406 |
Investment Funding Arrangement
On 14 December 2022, the Company entered into an investment agreement with Riverfort Global Opportunities PCC Limited and YA II PN Ltd. ("Noteholders").
Pursuant to the facility, the Noteholders were granted warrants exercisable at 32.0 p to subscribe for 1,800,000 ordinary shares for a period of up to four years. These warrants remain outstanding.
Information about the Group's exposure to interest rate, foreign currency and liquidity risks is included in note 29.
26 Lease Liabilities
The Group's obligations under lease contracts are presented as follows:
|
2024 |
2023 |
|
|
At 31 December |
£000 |
£000 |
|
Current - due within 12 months |
550 |
723 |
|
Non-current - due after 12 months |
1,145 |
833 |
|
Total lease liabilities |
1,695 |
1,556 |
Payments of lease principal and interest in the period to 31 December were:
|
2024 |
2023 |
|
|
At 31 December |
£000 |
£000 |
|
Payments of lease principal |
676 |
629 |
|
Payments of interest |
92 |
44 |
|
Total payments under leases |
768 |
673 |
The contractual undiscounted cash flows for lease obligations at each period end were:
|
2024 |
2023 |
|
|
At 31 December |
£000 |
£000 |
|
Less than one year |
638 |
784 |
|
One to five years |
1,266 |
884 |
|
Total lease liabilities |
1,904 |
1,668 |
Lease liabilities represent the present value of the minimum lease payments the Group is obliged to make to lessors under contracts for the lease of assets that are presented as right-of-use assets.
Amounts recognised in the consolidated statement of profit and loss were:
|
2024 |
2023 |
|
|
£000 |
£000 |
|
|
Variable lease payments |
298 |
230 |
|
Expenses relating to short-term leases |
73 |
70 |
|
Expenses relating to leases of low-value assets |
15 |
8 |
27 Issued Share Capital and Reserves
|
2024 |
2023 |
|||
|
No: 000 |
£000 |
No: 000 |
£000 |
|
|
Authorised at 31 December |
1,000,000 |
- |
1,000,000 |
- |
|
Issued and fully paid |
||||
|
At 1 January |
191,067 |
51,348 |
119,007 |
50,716 |
|
Issued in the year |
249,494 |
2,125 |
72,060 |
632 |
|
At 31 December |
440,561 |
53,473 |
191,067 |
51,348 |
During the year, 249,494,432 new shares were issued with a nominal value of £2,124,711. The total gross proceeds were £57,386,945 with the balance of £55,239,060 credited to the share premium account. Total costs of issuance were £3,000,838 and these costs were charged directly to the share premium account.
On 22 November 2022, the Company subdivided each ordinary share of €0.50 nominal value into one ordinary share of €0.01 each and one Deferred A Share of €0.49 each. The Deferred A Shares did not have any voting rights and were not admitted to trading on AIM or any other market. They carried only a priority right to participate in any return of capital or in any dividend to the extent of €1 in aggregate over the class. The Deferred A Shares were, for all practical purposes, valueless. On 24 October 2024, the Deferred A shares were redeemed and cancelled by the Company for nil consideration.
Ordinary shares have a par value of €0.01. The holders of ordinary shares are entitled to receive dividends as may be declared from time to time and are entitled to one vote per share at meetings of the Company.
Share Capital and Share Premium
Share capital comprises issued capital in respect of issued and paid-up shares, at their par value. Share premium comprises the difference between the proceeds received and the par value of the issued and paid-up shares.
Share-based Payment Reserve
The share-based payment reserve comprises the equity component of the Company's share-based payments charges.
Currency Translation Reserve
The translation reserve comprises foreign currency differences arising from the translation of the financial statements of foreign operations.
Other Reserve
Other reserve comprises the portion of the consideration paid for redT energy Holdings (Ireland) Limited's minority interests over the fair value of the shares purchased.
28 Financial Assets and Liabilities
All financial assets are held at amortised cost. There were no financial assets measured at fair value through other comprehensive income nor through profit and loss in either period presented.
The maximum exposure to credit risk at the end of the reporting period is the carrying amount of each class of financial asset presented above. The carrying value of the financial assets approximate their fair values due to the short-term maturities of these instruments.
The Group does not currently use derivative instruments for managing financial risk. All financial liabilities are held at amortised cost.
Recognised Fair Value Measurements
The Group uses the following hierarchy for determining and disclosing the fair value of financial instruments by valuation technique:
Level 1: The fair value of financial instruments traded in active markets (such as publicly traded derivatives, and trading securities) is based on quoted market prices at the end of the reporting period.
The battery systems manufactured by the Company use vanadium metal as a key component in the electrolyte. Vanadium is an actively traded commodity for which quoted market prices are available.
The Company does not currently hold inventories of vanadium. Vanadium purchased from third parties is solely for the use in electrolyte and open purchase contracts are not accounted for as derivatives.
Level 2: The fair value of financial instruments that are not traded in an active market (for example, over-the-counter derivatives) is determined using valuation techniques that maximise the use of observable market data and rely as little as possible on entity-specific estimates. If all significant inputs required to fair value instrument are observable, the instrument is included in Level 2.
At 31 December 2024, the Company held warrants issued to Riverfort Global Opportunities and YA II PN Ltd as part of the December 2022 financing event. The warrants are valued using Level 2 inputs as they do not represent a fixed-for-fixed equity instrument and are valued using observable market factors such as the share price at the date of the grant, the term of the award, the share price volatility and the risk-free interest rate.
Level 3: If one or more of the significant inputs is not based on observable market data the instrument is included in Level 3.
The Group did not hold any financial assets or liabilities that were required to be valued using Level 3 inputs at 31 December 2024 (2023: none).
No other financial instruments were outstanding at the period end that required to be valued using a methodology that uses Level 1, 2 or 3 inputs.
29 Financial Risk Management
This note explains the Group's exposure to financial risks and how these risks could affect the Group's future financial performance. Current year profit and loss information has been included where relevant to add further context.
|
Risk |
Exposure arising from |
Measurement |
Management |
|
Market risk - foreign exchange |
Future commercial transactions Recognised financial assets and liabilities not denominated in GBP |
Cash flow forecasting Sensitivity analysis |
Cash is held in GBP until non-GBP requirements for up to the next six-months are established, at which point the GBP is sold in favour of the required currency, which is then remitted to the relevant Group entity |
|
Market risk - commodity price risk |
Price of vanadium to be used in the battery electrolyte |
Quoted market prices for vanadium |
Strategic supply arrangements with multiple pre-qualified suppliers |
|
Credit risk |
Cash and cash equivalents, short-term investments, trade receivables and contract assets |
Ageing analysis Credit ratings |
Monitoring accumulation of bank balances. Credit risk assessment for customers and pre-agreed deposits and interim payments within customer contracts |
|
Liquidity risk |
Borrowings and other liabilities |
Rolling cash flow forecasts |
Access to capital markets for equity or debt funding |
Market risk - Foreign Exchange Risk
The Group is primarily exposed to foreign exchange risk related to bank deposits, receivables or payables balances and other monetary working capital items that are denominated in a currency other than the Company's functional currency which has been determined to be GBP.
The Group does not speculate on foreign exchange and aims to mitigate its overall foreign exchange risk by holding currency in line with forecast regional operating expenses, providing an element of natural hedge against adverse foreign exchange movement.
The Group's exposure to foreign exchange risk at the end of the reporting period, expressed in GBP, was as follows:
|
Sterling |
Euro |
Canadian Dollar |
US Dollar |
Australian Dollar |
Total |
|
|
31 December 2024 |
£000 |
£000 |
£000 |
£000 |
£000 |
£000 |
|
Cash and cash equivalents |
30,710 |
54 |
934 |
650 |
4 |
32,352 |
|
Trade receivables |
14 |
- |
27 |
786 |
- |
827 |
|
Contract assets |
472 |
283 |
235 |
159 |
- |
1,149 |
|
Derivative financial instruments |
(271) |
- |
- |
- |
- |
(271) |
|
Trade and other payables |
(2,022) |
(77) |
(1,890) |
(536) |
- |
(4,525) |
|
Lease liabilities |
(682) |
- |
(603) |
(410) |
- |
(1,695) |
|
Net exposure |
28,221 |
260 |
(1,297) |
649 |
4 |
27,837 |
|
Sterling |
Euro |
Canadian Dollar |
US Dollar |
Australian Dollar |
Total |
|
|
31 December 2023 |
£000 |
£000 |
£000 |
£000 |
£000 |
£000 |
|
Cash and cash equivalents |
3,284 |
696 |
346 |
444 |
244 |
5,014 |
|
Trade receivables |
747 |
1,350 |
11 |
388 |
- |
2,496 |
|
Contract assets |
626 |
307 |
166 |
93 |
- |
1,192 |
|
Trade and other payables |
(1,799) |
(178) |
(1,466) |
(505) |
- |
(3,948) |
|
Derivative financial instruments |
(406) |
- |
- |
- |
- |
(406) |
|
Lease liabilities |
(254) |
- |
(1,169) |
(133) |
- |
(1,556) |
|
Net exposure |
2,198 |
2,175 |
(2,112) |
287 |
244 |
2,792 |
In the prior year management did not disclose contract assets (accrued revenue) in relation to revenue contracts in the above note relating to balances denominated in foreign currency balances. The balance excluded totalled £1.2 million which is now included in the comparative. This affects only the disclosure of the balances in this note and does not have a current and prior period accounting impact.
Sensitivity - Exchange Rates
The sensitivity of profit or loss to changes in quoted exchange rates for currencies to which the Group is exposed is as follows, based on each relevant exchange rate strengthening (or weakening) by 5%.
There is no impact on other components of equity as the Group is not party to any derivative financial instruments, such as hedging instruments, where currency gains and losses would be recognised in other comprehensive loss.
|
2024 |
2023 |
|
|
At 31 December +/- 5% |
£000 |
£000 |
|
Euro |
13 |
93 |
|
Canadian dollar |
(65) |
(114) |
|
US dollar |
32 |
10 |
|
Australian dollar |
- |
12 |
|
(20) |
1 |
Market Risk - Commodity Price Risk
The Group's batteries use an electrolyte incorporating vanadium. Vanadium is an elemental metal and is used primarily to strengthen steel, particularly for the construction industry.
Whilst it is not a mature market traded commodity, such that one can buy forward or derivative contracts, market prices for vanadium pentoxide (V2O5) at 98% purity are quoted in US dollars per pound.
Vanadium forms about two-thirds of the value of the electrolyte, which in turn forms about a quarter of the landed cost of a battery, and so a fluctuation in the price of vanadium will impact the profitability of battery sales. An increase or decrease in the market price of vanadium of 5% could cause the value of the electrolyte component of a battery to increase or decrease by approximately 3%.
Credit Risk - Cash Held on Deposit with Banks
Credit risk arises from cash and cash equivalents and deposits with banks and other financial institutions.
Credit risk related to holdings with financial institutions is managed by only maintaining bank accounts with reputable financial institutions. The Group aims only to place funds on deposit with institutions with a minimum credit rating of B2 Moody's.
The Group's cash at bank and short-term deposits are held with institutions with credit ratings as follows:
|
2024 |
2023 |
|
|
At 31 December |
£000 |
£000 |
|
Aa1 |
194 |
220 |
|
Aa2 |
1,192 |
566 |
|
A1 |
30,966 |
4,228 |
|
32,352 |
5,014 |
Credit Risk - Trade and Other Receivables
Past Due but not Impaired
The Group's credit risk from receivables encompasses the default risk of its customers and other counterparties. Its exposure to credit risk is influenced mainly by the individual characteristics of each customer or counterparty. The creditworthiness of potential and existing customers is assessed prior to entering each new transaction. A credit analysis is performed, and appropriate payment terms implemented that may include increased level of upfront deposits for the purchase of battery units. The Group's standard terms of trade provide that up to 90% of the sales price of a battery unit is paid prior to delivery.
Receivables are considered for impairment on a case-by-case basis when they are past due or where there is objective evidence that the customer or counter party may be a default risk. The Group takes into consideration the customer or counter party payment history, its credit worthiness together with the prevailing economic environment in which it operates to assess the potential impairment of receivables. The assessment reflects the probability-weighted outcome, the time value of money and reasonable and supportable information that is available at the reporting date about past events, current conditions and forecasts of future economic conditions.
On an ongoing basis, receivable balances attributable to each customer or other counterparty are monitored and appropriate action is taken when the relevant balance becomes or is considered likely to become overdue. The maximum exposure to loss arising from receivables is equal to invoiced value.
The ageing of trade receivable balances was:
|
2024 |
2023 |
|
|
At 31 December |
£000 |
£000 |
|
Current |
670 |
1,940 |
|
Past due - less than 30 days |
20 |
339 |
|
Past due - more than 30 days |
137 |
217 |
|
Total trade receivables |
827 |
2,496 |
Past due amounts at 31 December 2024, related to four customers (2023: six customers) and £nil (2023: £139,639) was considered to be impaired.
Liquidity Risk
Liquidity risk relates to the Group's ability to meet its obligations as they fall due.
The Group generates cash from its operations that are principally related to the manufacture and installation of vanadium flow batteries. The market for reliable and flexible grid-scale storage solutions for energy generated from renewable sources is growing and the technology continues to develop.
The development of new and enhanced storage technologies can be capital intensive and the Group has historically funded development and early-stage commercial activity primarily from equity investment but also using cash from operations and loan funding.
The Group forecasts cash generation using a comprehensive company financial model and monitors the timing and amount of its payment obligations.
The following table shows the Group's financial liabilities by relevant maturity grouping based on contractual maturities. The amounts included in the analysis are contractual, undiscounted cashflows.
|
Less than One Year |
One to |
Two to |
Over Five Years |
Total Contracted Cash Flows |
Carrying Amount |
|
|
31 December 2024 |
£000 |
£000 |
£000 |
£000 |
£000 |
£000 |
|
Trade and other payables |
4,525 |
- |
- |
- |
4,525 |
4,525 |
|
Derivative financial instrument |
271 |
- |
- |
- |
271 |
271 |
|
Lease liabilities |
638 |
465 |
801 |
- |
1,904 |
1,695 |
|
Total financial liabilities |
5,434 |
465 |
801 |
- |
6,700 |
6,491 |
|
Less than One Year |
One to |
Two to |
Over Five Years |
Total Contracted Cash Flows |
Carrying Amount |
|
|
31 December 2023 |
£000 |
£000 |
£000 |
£000 |
£000 |
£000 |
|
Trade and other payables |
3,948 |
- |
- |
- |
3,948 |
3,948 |
|
Derivative financial instruments |
406 |
- |
- |
- |
406 |
406 |
|
Lease liabilities |
784 |
422 |
462 |
- |
1,668 |
1,556 |
|
Total financial liabilities |
5,138 |
422 |
462 |
- |
6,022 |
5,910 |
Capital Management
The Group currently has no external debt outstanding and is funded by proceeds raised through equity placings.
The Board regularly reviews the Group's cash requirements and future projections to monitor cash usage and assess the need for additional funding. At 31 March 2025, the Group had £21.9 million of cash on hand.
30 Related Parties
The only related parties of the Group are the key management and close members of their family. Key management has been determined as the CEO and his direct reports.
During the period, no related party transactions were entered other than through key management personnel compensation and benefits.
Key management compensation is disclosed in note 8, Staff costs and headcount.
31 Group Entities
|
Ownership % |
|||||
|
Direct Subsidiary Undertakings |
Country of Incorporation |
Registered Office |
Principal Activity |
2024 |
2023 |
|
Camco Holdings UK Limited |
England |
128 City Road, London, EC1V 2NX, United Kingdom |
Holding company |
100% |
100% |
|
Invinity Energy Group Services Limited (formerly Camco Services (UK) Limited) |
England |
128 City Road, London, EC1V 2NX, United Kingdom |
Support services |
100% |
100% |
|
Camco (Mauritius) Limited |
Mauritius |
24 Dr Joseph Rivière Street 1st Floor, Felix House Port Lewis, Mauritius |
Holding company |
100% |
100% |
|
Invinity Energy Systems (U.S.) Corporation |
United States of America |
1201 Orange St. #600 Wilmington, DE USA 19899 |
Energy storage |
100% |
100% |
|
Invinity Energy Nexus Limited |
England |
128 City Road, London, EC1V 2NX, United Kingdom |
Energy storage |
100% |
100% |
|
Indirect Subsidiary Undertakings |
|||||
|
redT Energy Holdings (UK) Limited |
England |
128 City Road, London, EC1V 2NX, United Kingdom |
Research and consultancy |
100% |
100% |
|
Re-Fuel Technology Limited |
England |
128 City Road, London, EC1V 2NX, United Kingdom |
Energy storage |
99% |
99% |
|
Invinity Energy (UK) Limited |
England |
Office 207 New Broad Street House, 35 New Broad Street, London, England, EC2M 1NH United Kingdom |
Energy storage |
99% |
99% |
|
redT Energy Holdings (Ireland) Limited |
Ireland |
22 Northumberland Road Ballsbridge, Dublin 4 |
Energy storage |
99% |
99% |
|
Invinity Energy Systems (Ireland) Limited |
Ireland |
22 Northumberland Road Ballsbridge, Dublin 4 |
Energy storage |
99% |
99% |
|
redT energy (Australia) (Pty) Ltd |
Australia |
RSK Advisory, Level 2, Suite 7 66 Victoria Crescent Narre Warren, Victoria 3805 Australia |
Energy storage |
99% |
99% |
|
Invinity Energy (South Africa) (Pty) Ltd |
South Africa |
1st Floor, Kiepersol House Stonemill Office Park 300 Acacia Road Darrenwood Randburg 2194 |
Business Services |
100% |
100% |
|
Invinity Energy Systems (Canada) Corporation |
Canada |
2900-550 Burrard Street Vancouver, BC Canada V6C 0A3 |
Energy storage |
100% |
100% |
|
Suzhou Avalon Battery Company Limited |
The People's Republic of China |
1809 Building 4 no.11888 East Taihu Avenue, Songling Town, Wujiang District, Suzhou City |
Business Services |
100% |
100% |
|
Associates |
|||||
|
Vanadium Electrolyte Rental Limited |
England |
128 City Road, London, EC1V 2NX, United Kingdom |
Vanadium procurement |
50% |
50% |
32 Contingent Liabilities and Capital Commitments
The Group is involved in legal proceeding with a landlord with a received claim which has a possible range from £nil to £693k. While the outcome and timing of this matter is uncertain and difficult to predict, management believes that, based on the information currently available, the ultimate resolution of these matters will not have a material adverse effect on the Group's financial position.
Authorised and contracted future capital expenditure (excluding right-of-use assets) by the Group for which contracts had been placed but not provided in the financial statements at 31 December 2024 is estimated at £475k for the assembly of a conveyor system.
33 Events Occurring After the Report Period
Redomiciliation
On 9 January 2025, the Company announced that the scheme to redomicile the Company from Jersey to the UK by putting in place a new England and Wales incorporated parent company was effective. The ordinary shares of the new parent Company were admitted and are trading on AIM. Pursuant to the redomiciliation, the new 2025 Employee Share Option Plan was adopted to hold employee options in the new UK parent company.
Furthermore, the English Courts sanctioned the Reduction of Capital which had the effect of reducing the nominal value of the Company's ordinary shares from 14 pence per ordinary share to 1 pence per ordinary share and generated distributable reserves of £57,273,026.07 to support the payment of future dividends. The Company, however, does not plan on making dividend payments in the foreseeable future and there can be no assurance as to the level of future dividends. The number of shares admitted to trading were unchanged by the Reduction of Capital and has no impact on the Company's cash balance. The change to the nominal value is not expected to have any impact on the market value of the Company's ordinary shares. Following the redomiciliation, the former Jersey parent company was re-registered as a private company and changed its name from Invinity Energy Systems plc to Invinity Energy Systems Limited (Jersey).
Grant of Performance Based Options
On 30 January 2025, the Company granted performance-based options to the Executive Directors with an exercise price of 23.0 pence in two tranches with the following vesting conditions:
§ Tranche 1 will vest 1/3 per annum over 3 years, conditional on the Company's share price being at or above 16.0 pence at the time of vesting.
§ Tranche 2 will vest on 30 January 2028 conditional on the Company's share price being at or above 100.0 pence.
Lease Extension
On 30 January 2025, the Company signed a two year-extension agreement on a lease in Canada which will result in undiscounted cash outflow of approximately £713k over the term.
Corporate Re-organisation for LoDES Project
The Company announced on 31 March 2025, that it had reached an agreement to proceed with the Longer Duration Energy Storage ("LoDES") project on a site in the South East of England. Costs are expected to be up to £20 million including site acquisition, development costs and contingency, of which between £7 million-£10 million will be funded by the Department for Energy Security and Net Zero ("DESNZ") through the LoDES Demonstration Programme. This funding will be recognised as grant income by the Company. DESNZ has formally confirmed to Invinity that it can proceed with the project, which is planned to enter construction phase in H2 2025 ahead of operation in 2026. Invinity has acquired a special purpose vehicle which owns a 25-year lease over the site and which is capable of being extended by 15 years at its option.