Copano Energy L.L.C — Wells Fargo Securities 9th Annual Pipeline, MLP and E&P, Services & Utilities Symposiums (December 2010)
45 slides from Copano Energy L.L.C's conference presentation, Dec 6, 2010
Slide 1: Wells Fargo Securities 9th Annual Pipeline, MLP and E&P Symposiums
Wells Fargo Securities 9 th Annual Pipeline, MLP and E&P, Services & Utilites Symposiums December 7, 2010 NASDAQ: CPNO
Slide 2: Disclaimer
Disclaimer This presentation includes “forward-looking statements,” as defined in the federal securities laws. Statements that address activities or events that Copano believes will or may occur in the future are forward-looking statements. These statements include, but are not limited to, statement
Slide 3: Introduction to Copano
Introduction to Copano Independent midstream company founded in 1992 ■ Best in class service to customers ■ Entrepreneurial approach ■ Focus on long-term accretive growth Provides midstream services in multiple producing areas through three operating segments ■ Texas ● Conventional, Eagle Ford Shale
Slide 4: Key Metrics
Key Metrics Service throughput volumes approximate 1,800,000 MMBtu/d of natural gas (1) Over 6,700 miles of active pipelines 8 natural gas processing plants with over 1.1 Bcf/d of combined processing capacity One NGL fractionation facility with total capacity of 22,000 Bbls/d ■ Expansion underway to
Slide 5: Copano Energy
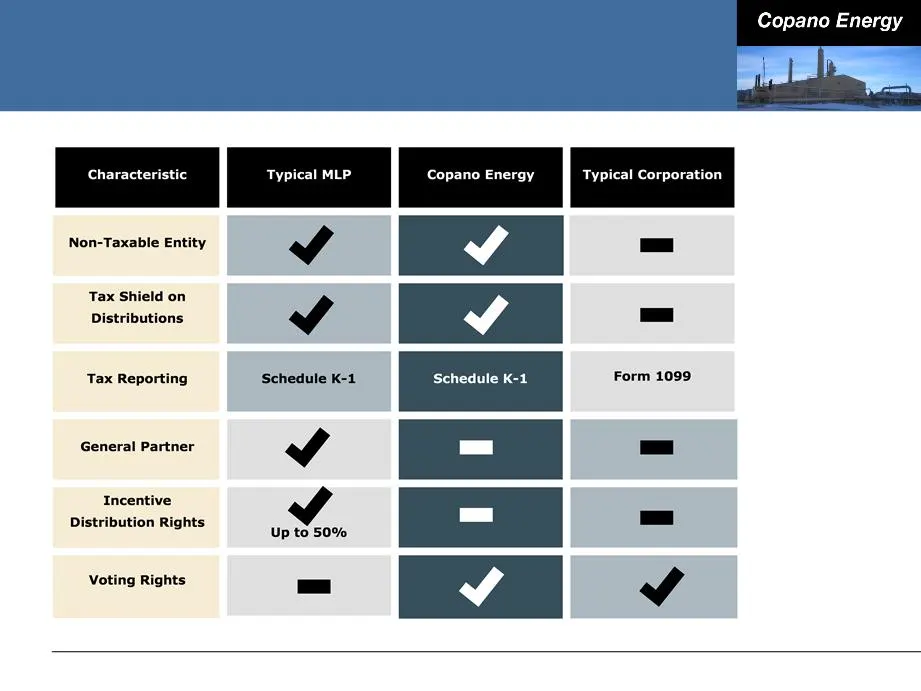
Copano Energy Characteristic Typical MLP Copano Energy Typical Corporation Non-Taxable Entity butions Tax Shield on 9 Form 1099 Tax Reporting Schedule K-1 General Partner Incentive Jo Distribution Rights aes = Voting Rights qr
Slide 6: Growth Strategy
Growth Strategy Goal: to become a diversified midstream company with scale and stability of cash flows, above-average returns on invested capital and “investment-grade quality distributions” Key tenets of growth strategy: ■ Execute on organic growth opportunities around existing assets ■ Explore opp
Slide 7: Agenda
Agenda Recent Developments and Outlook Commodity Prices and Margin Sensitivities Financing and Commodity Risk Management Conclusions
Slide 8: Texas Recent Developments
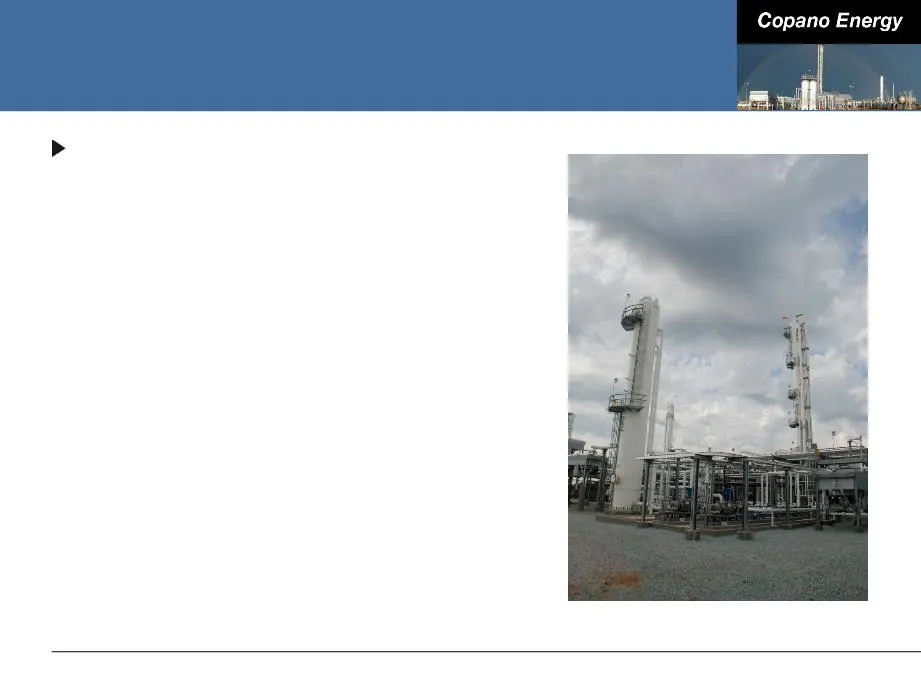
Texas Recent Developments Saint Jo plant ■ Primarily long-term gathering, treating and processing fee-for-service business ■ Additional 50 MMcf/d of compression placed in service October 2010, bringing total plant capacity to 100 MMcf/d ● Plant fully committed under contracts ● Additional expansion
Slide 9: Texas Recent Developments
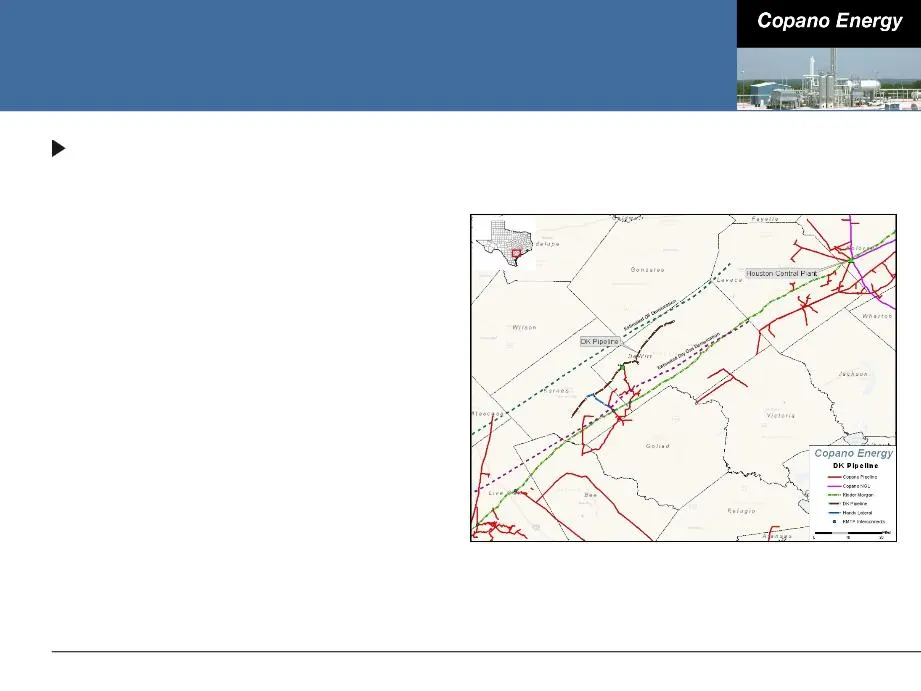
Texas Recent Developments DK Pipeline ■ 36 miles of 24” pipe ● Initial capacity of 185 MMcf/d with ability to expand to 275 MMcf/d ● Multiple producers running 11 rigs in areas served by the pipeline ● Active producers in the vicinity include: Pioneer, ConocoPhillips, Petrohawk, GeoSouthern and Tali
Slide 10: Texas Recent Developments
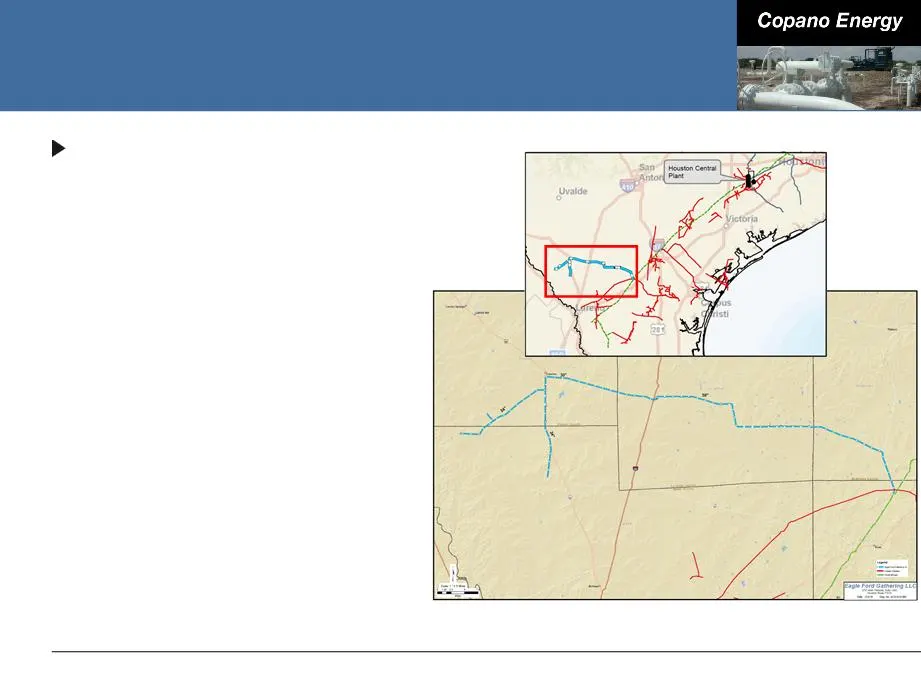
Texas Recent Developments Eagle Ford Gathering Joint Venture ■ Construction underway - expected to be fully completed September 2011 ● Approximately 111 miles of 30” and 24” pipe - first 22 miles expected in service 1Q ● Anticipated net capex - approximately $87.5 million ■ Gas services agreements w
Slide 11: Texas Recent Developments
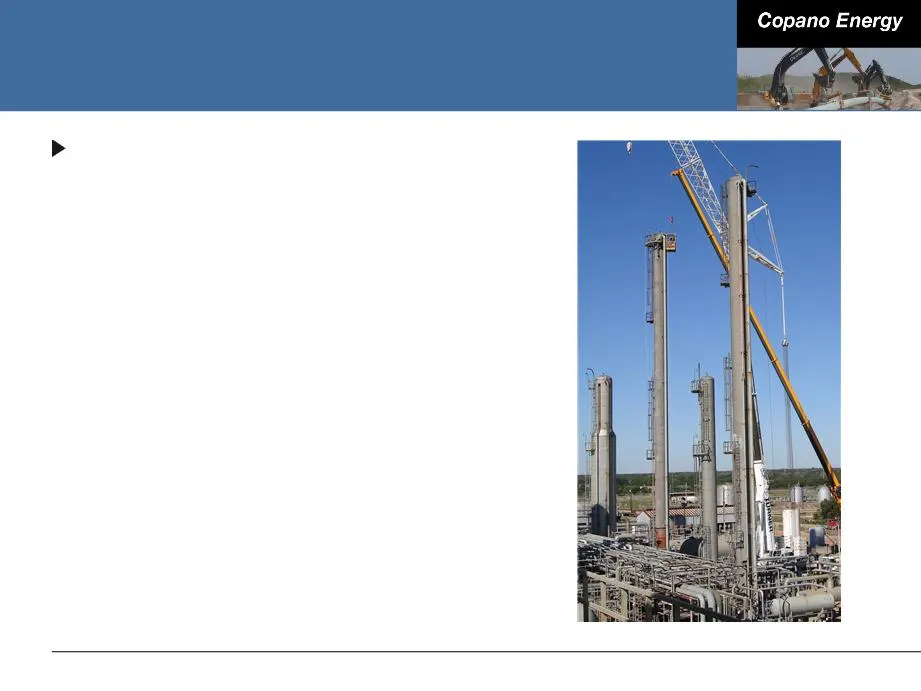
Texas Recent Developments Houston Central Complex fractionation expansion ■ Expansion will double Copano's current capacity from 22,000 Bbls/d to 44,000 Bbls/d ■ Anticipated capital spending for the fractionation and related product pipelines expansions is approximately $60 million ■ Expected in-ser
Slide 12: Texas Outlook
Texas Outlook Saint Jo gathering system ■ 19 rigs running in the area ● Approximately 30 new wells will be connected during 4Q 2010 ● Leasing activity continues ■ Crude oil play with associated gas requiring a full slate of midstream services ■ Based on producer drilling schedule, expect increase in
Slide 13: Woodford Shale Activity
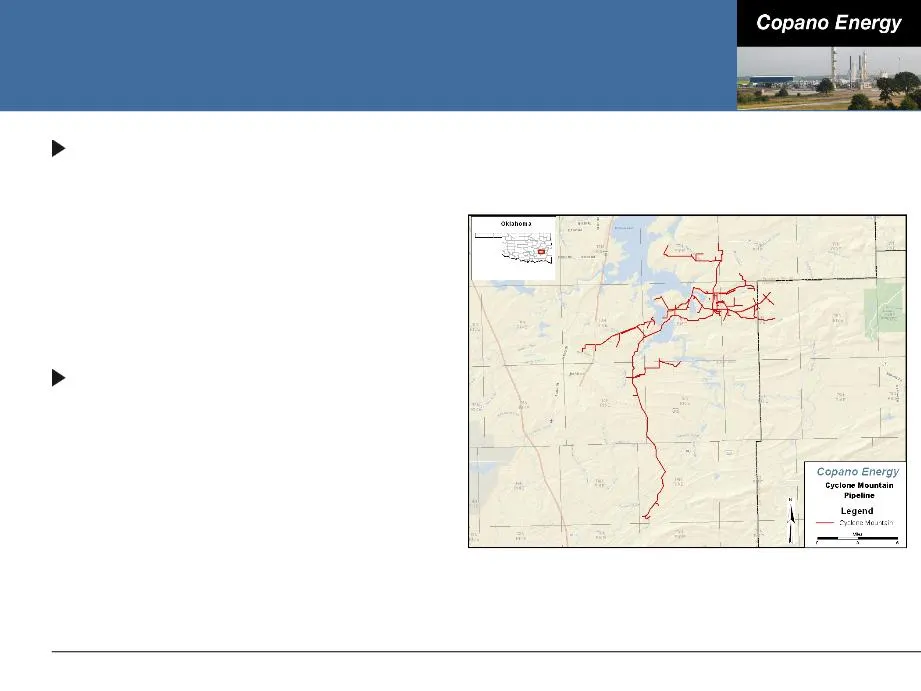
Woodford Shale Activity Significant drilling activity in the Woodford Shale around Copano’s Cyclone Mountain system ■ 3Q 2010 average volumes of approximately 72,000 MMBtu/d vs. 58,000 MMBtu/d in 2Q 2010 Current system capacity approximately 120 MMcf/d, including recent expansion ■ Based on producer
Slide 14: Oklahoma Outlook
Oklahoma Outlook Rich gas (primarily Hunton Dewatering play) ■ Drilling activity remains steady so far in 4Q 2010 ■ 2 rigs currently running in the Hunton and 11 rigs in other rich gas areas ■ Attractive processing upgrade and low geologic risk ■ 4Q 2010 volumes expected to be flat to slightly down
Slide 15: Rocky Mountains Outlook
Rocky Mountains Outlook Drilling and dewatering will be driven by commodity prices and producer economics 4Q 2010 volumes for Bighorn expected to be slightly lower to flat vs. 3Q 2010 4Q 2010 volumes for Fort Union expected to be slightly lower vs. 3Q 2010 2010 Adjusted EBITDA expected to be slightl
Slide 16: 4Q 2010 Outlook
4Q 2010 Outlook Texas ■ Significant drilling and development activity in the Barnett Shale Combo play ■ Ramp up of Eagle Ford Shale directed drilling ■ Expect reduced NGL recoveries at Houston Central Complex for approximately 10 days due to unscheduled boiler repairs Oklahoma ■ Moderate drilling ac
Slide 17: 4Q 2010 Outlook
4Q 2010 Outlook Commodity prices ■ Higher forward price curves for NGLs and oil compared to 3Q 2010 Total Distributable Cash Flow (Total DCF) ■ 4Q 2010 - flat to slightly lower compared to 3Q 2010 due to unscheduled repairs at Houston Central Complex ● Estimated impact of $2.0 million ■ First half 2
Slide 18: Commodity Prices and Margin Sensitivities
Commodity Prices and Margin Sensitivities Recent Developments and Outlook Commodity Prices and Margin Sensitivities Financing and Commodity Risk Management Conclusions
Slide 19: Historical Commodity Prices
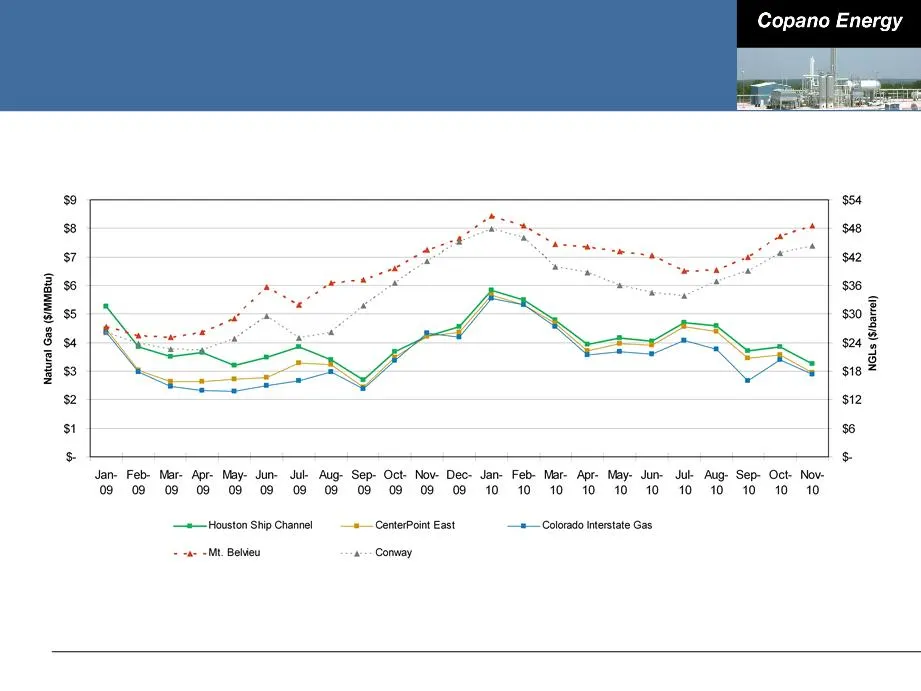
Historical Commodity Prices Note: NGL prices for Jan-09 through Sep-10 are calculated based on the weighted-average product mix for the period indicated. NGL prices for Oct-10 through Nov-10 are calculated based on the third quarter 2010 product mix.
Slide 20: Forward Commodity Prices
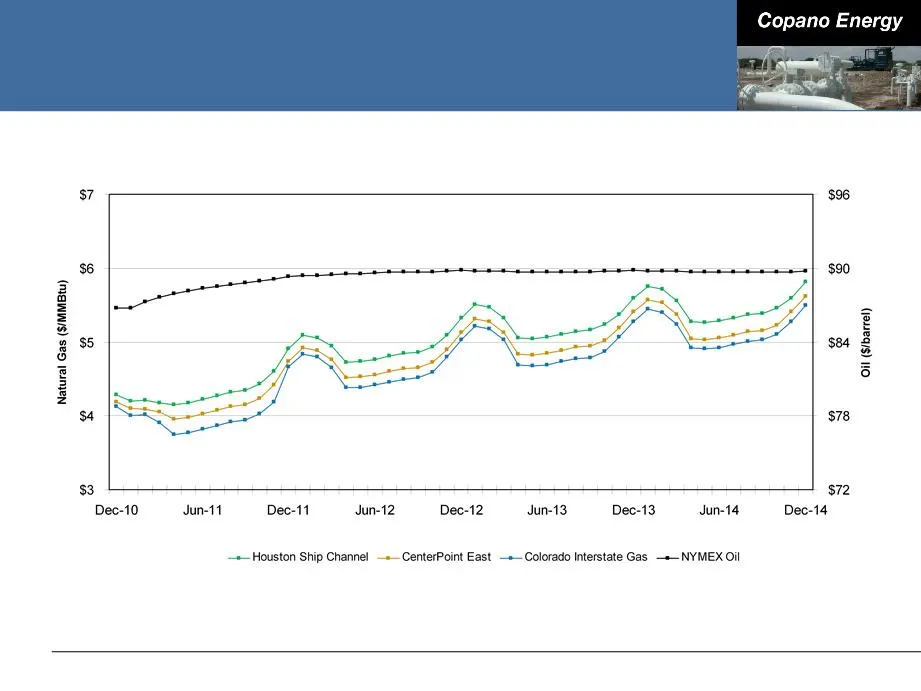
Forward Commodity Prices Note: Forward prices as of December 1, 2010
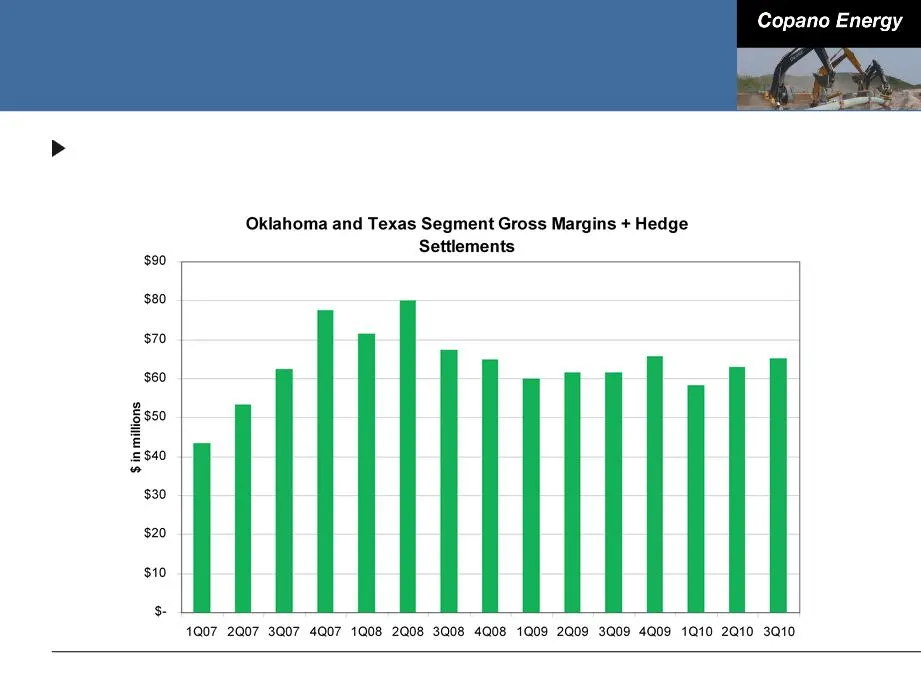
Slide 21: Combined Commodity-Sensitive Segment Margins and Hedging Settlements
Combined Commodity-Sensitive Segment Margins and Hedging Settlements Copano’s hedge portfolio supports cash flow stability
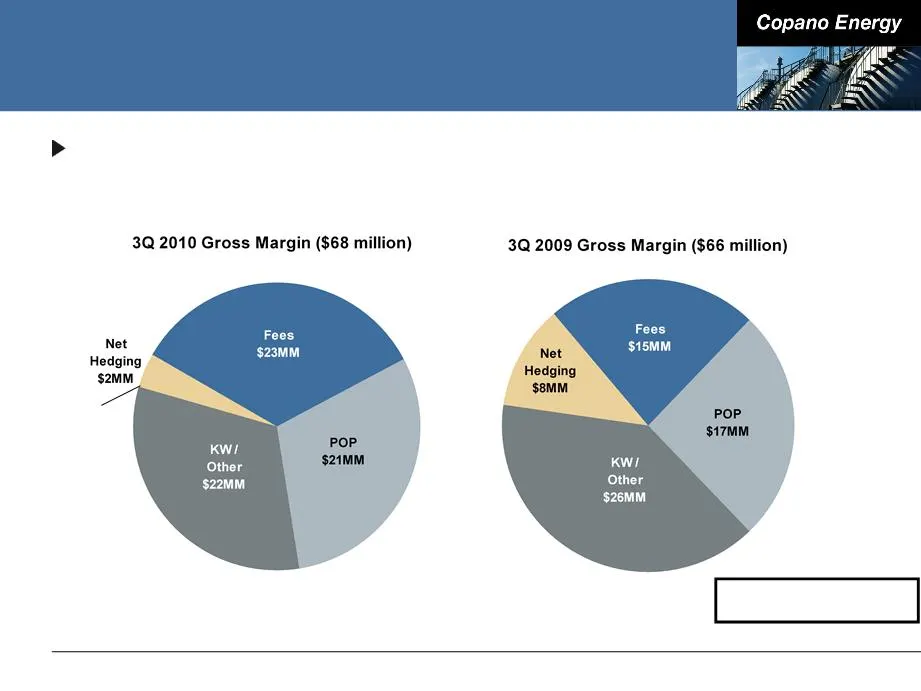
Slide 22: Commodity Price Exposure
Commodity Price Exposure As Eagle Ford and Barnett Shale Combo volumes grow, transition to more fee-based volumes will continue to reduce direct commodity price exposure Note: Includes Copano’s share of gross margin from unconsolidated affiliates. Approximate percentages based on Copano internal fin
Slide 23: Financing and Commodity Risk Management
Financing and Commodity Risk Management Recent Developments and Outlook Commodity Prices and Margin Sensitivities Financing and Commodity Risk Management Conclusions
Slide 24: 2010 Expansion Capex
2010 Expansion Capex 2010 expansion capex estimated to be approximately $170 million (1) Major areas of focus include: ■ Eagle Ford Shale and Houston Central Complex in Texas ● DK Pipeline ● Eagle Ford Gathering joint venture ● Fractionation expansion from 22,000 to 44,000 Bbls/d at Houston Central
Slide 25: Hedging Strategy
Hedging Strategy Calendar Year Put Strike Put Volumes Propane (Mt. Belvieu) 2012 $1.07/gal 600 Bbls/d Normal Butane (Mt. Belvieu) 2012 $1.46/gal 150 Bbls/d WTI Crude Oil 2012 $90.00/Bbl 200 Bbls/d WTI Crude Oil 2013 $90.00/Bbl 400 Bbls/d Option-based, product-specific 2011 hedged at or near policy l
Slide 26: Conclusions
Conclusions Recent Developments and Outlook Commodity Prices and Margin Sensitivities Financing and Commodity Risk Management Conclusions
Slide 27: Conclusions
Conclusions Recently completed growth projects are expected to contribute to Total DCF as volumes come online ■ Burbank plant (Oklahoma) in service ■ Expansion of Saint Jo plant to 100 MMcf/d - volumes increasing ■ Fractionator at Houston Central Complex in service ■ DK Pipeline in service Significa
Slide 28: Copano Energy
Copano Energy
Slide 29: Copano Energy
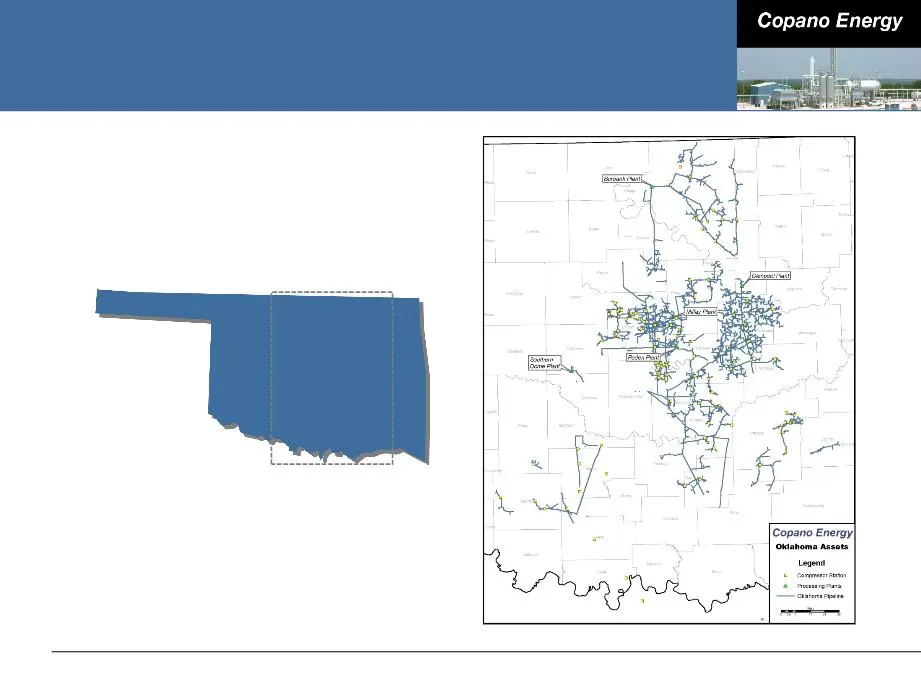
Copano Energy [Copano Eneray|
Slide 30: South Texas Assets
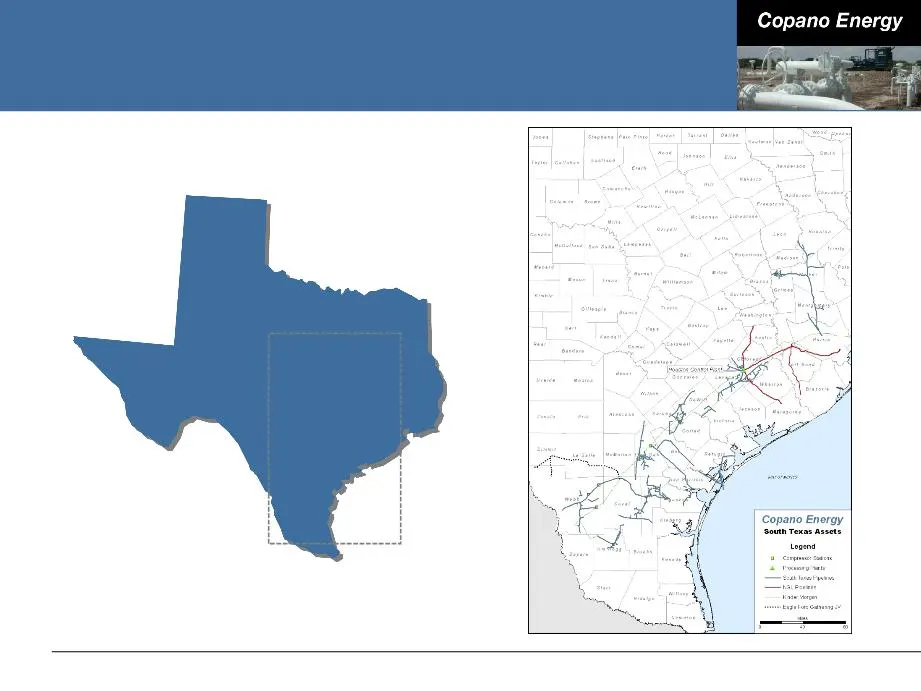
South Texas Assets TEXAS
Slide 31: Copano Energy
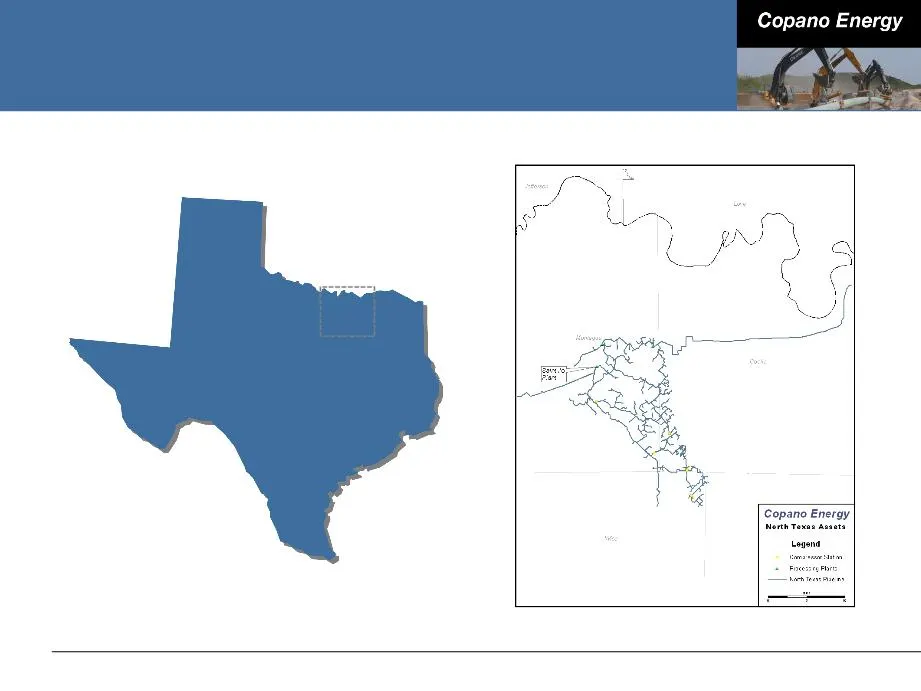
Copano Energy Copano Energy
Slide 32: Rocky Mountains Assets
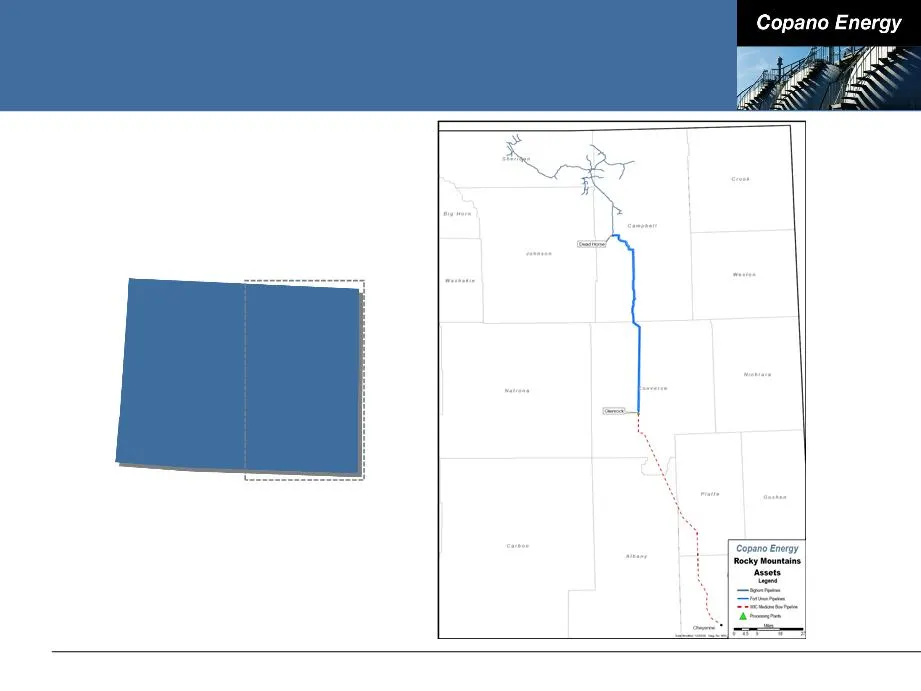
Rocky Mountains Assets WYOMING
Slide 33: Processing Modes
Processing Modes Full Recovery Texas and Oklahoma - If the value of recovered NGLs exceeds the fuel and gas shrinkage costs of recovering NGLs Ethane Rejection Texas and Oklahoma - If the value of ethane is less than the fuel and shrinkage costs to recover ethane (in Oklahoma, ethane rejection at Pa
Slide 34: Commodity-Related Margin Sensitivities
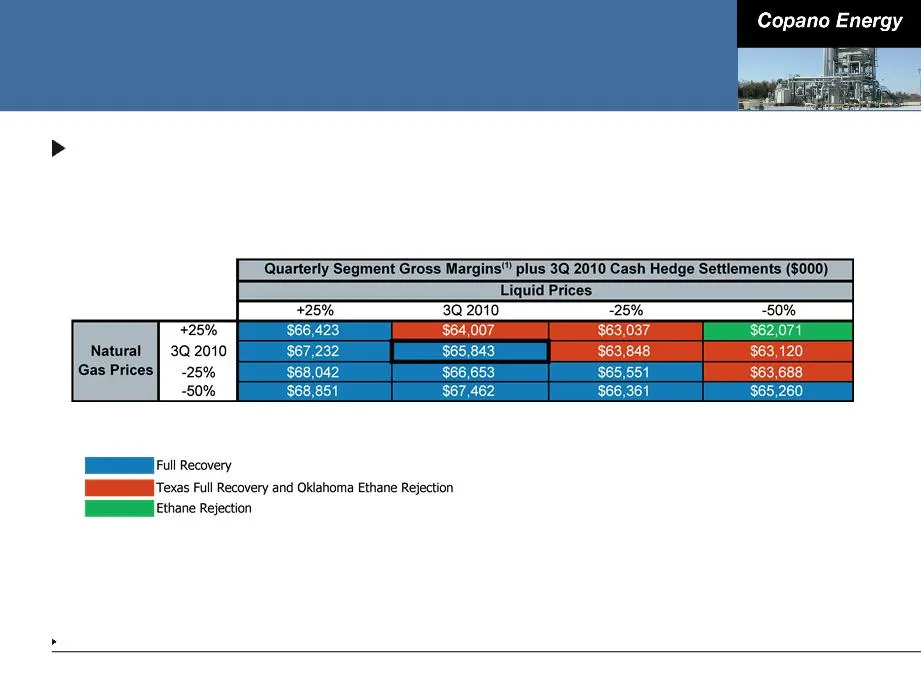
Commodity-Related Margin Sensitivities Matrix reflects 3Q 2010 wellhead and plant inlet volumes, adjusted using Copano’s 2010 planning model Note: Please see this Appendix for definitions of processing modes and additional details. Consists of Texas and Oklahoma Segment gross margins.
Slide 35: Combined Commodity-Sensitive Segment Margins and Hedging Settlements
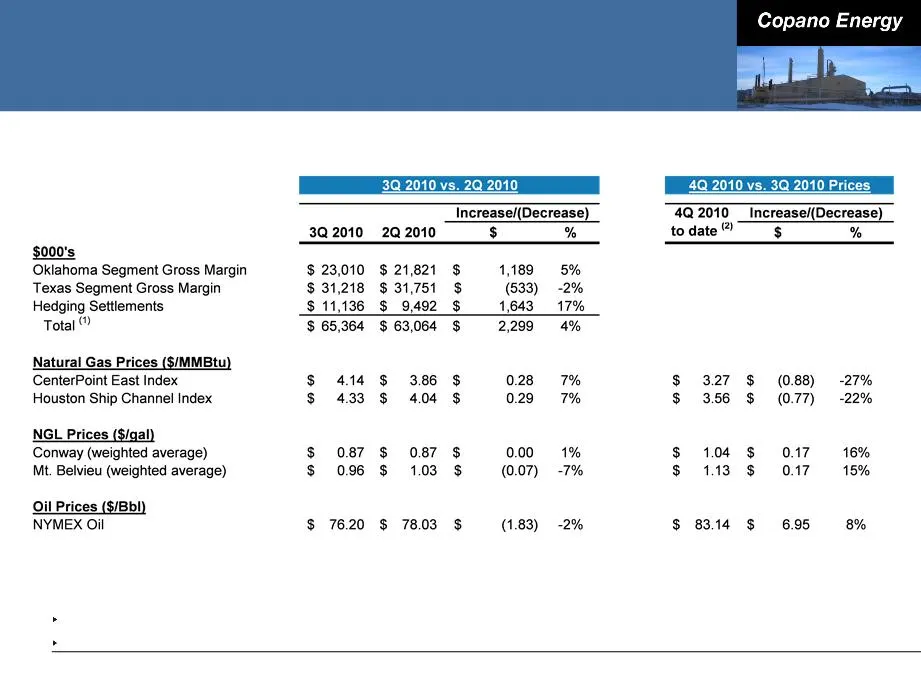
Combined Commodity-Sensitive Segment Margins and Hedging Settlements Note: Weighted average NGL prices are based on Copano product mix for period indicated. Does not include non-cash expenses included in Corporate and Other for purposes of calculating Total Segment Gross Margin. See Appendix for rec
Slide 36: Oklahoma Net Commodity Exposure
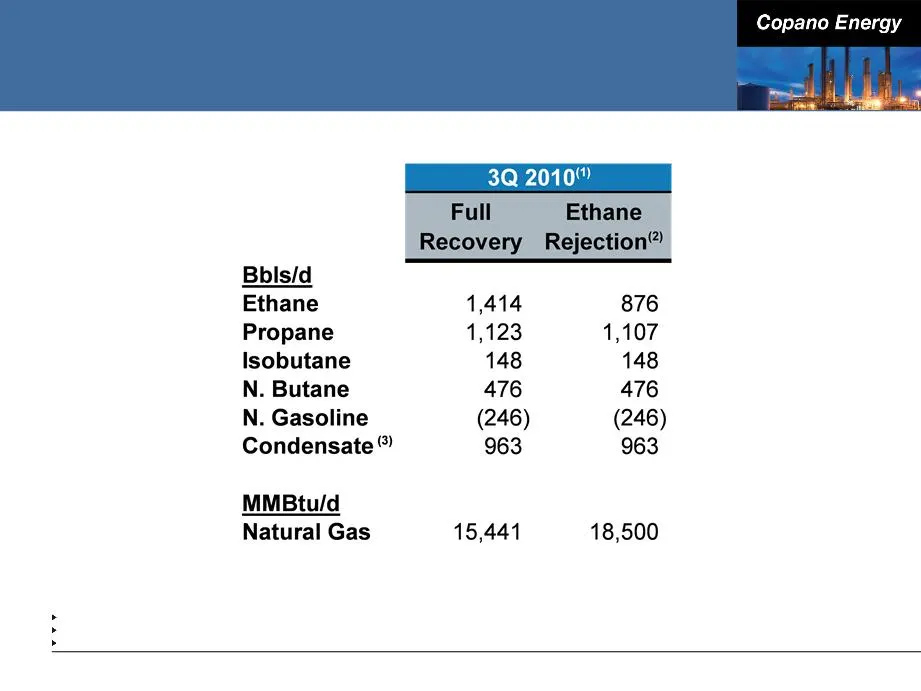
Oklahoma Net Commodity Exposure Note: See explanation of processing modes in this Appendix. Values reflect rounding. Source: Copano Energy internal financial planning models. Ethane rejection at Paden plant is limited by nitrogen rejection facilities. Reflects impact of producer delivery point alloc
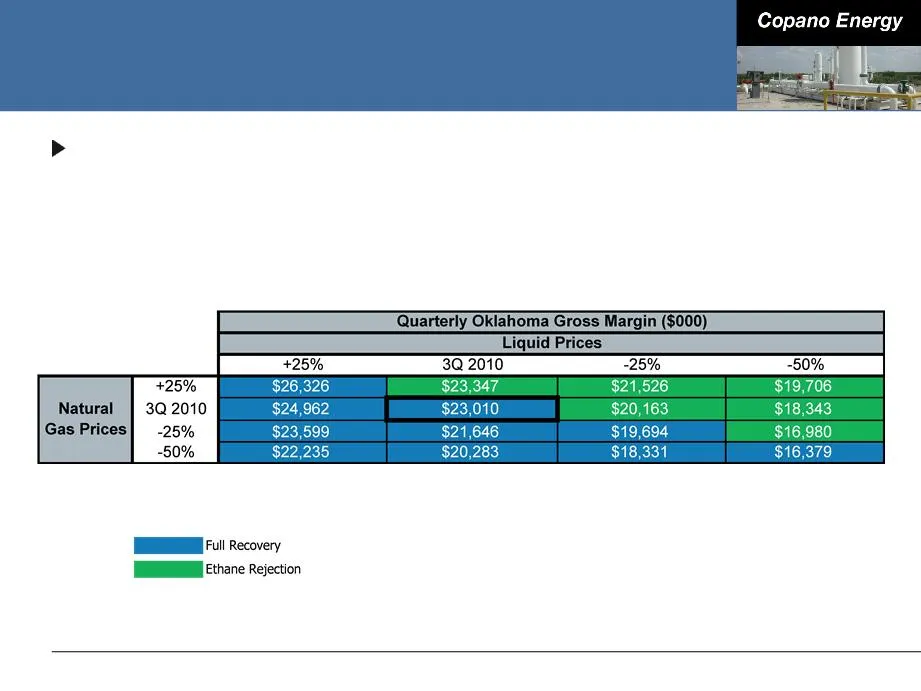
Slide 37: Oklahoma Commodity Price Sensitivities
Oklahoma Commodity Price Sensitivities Oklahoma segment gross margins excluding hedge settlements ■ Matrix reflects 3Q 2010 volumes, adjusted using Copano’s 2010 planning model Note: Please see this Appendix for definitions of processing modes and additional details.
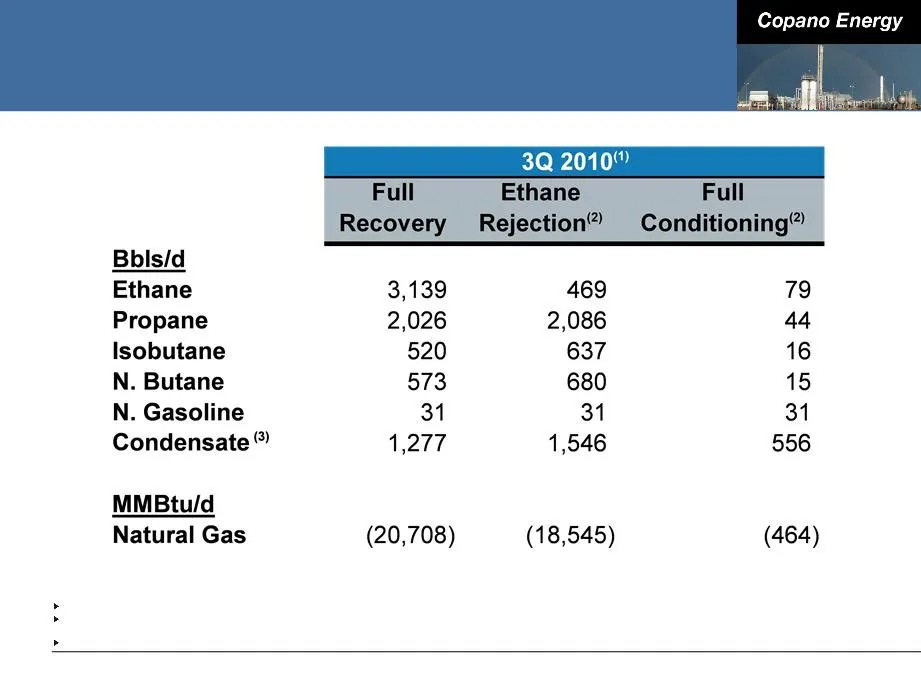
Slide 38: Texas Net Commodity Exposure
Texas Net Commodity Exposure Note: See explanation of processing modes in this Appendix. Source: Copano Energy internal financial planning models. Based on 3Q 2010 daily wellhead/plant inlet volumes. Fractionation at Houston Central Complex permits significant reductions in ethane recoveries in etha
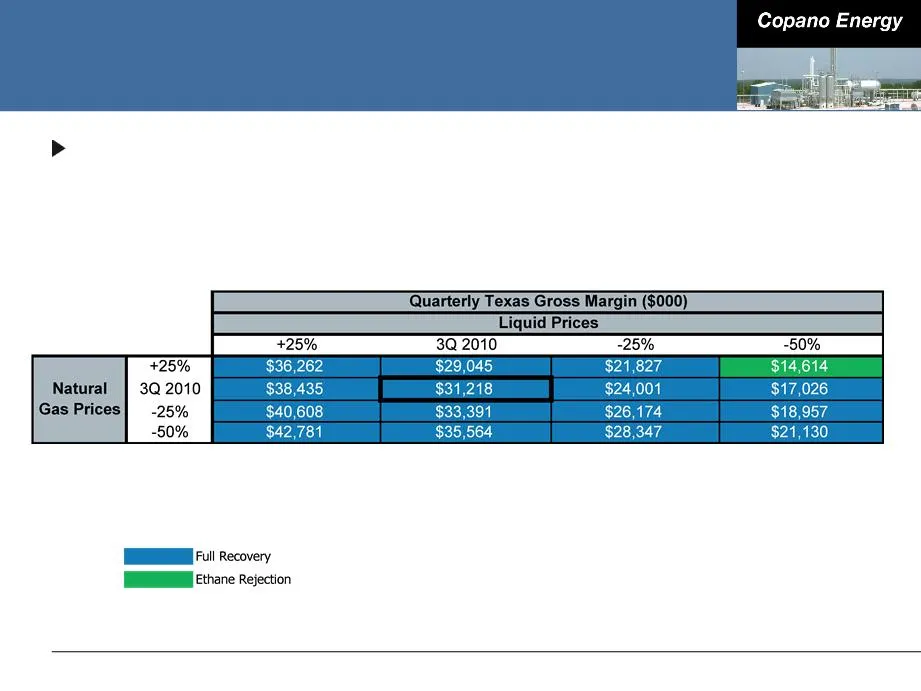
Slide 39: Texas Commodity Price Sensitivities
Texas Commodity Price Sensitivities Texas segment gross margins excluding hedge settlements ■ Matrix reflects 3Q 2010 volumes and operating conditions, adjusted using Copano’s 2010 planning model Note: Please see this Appendix for definitions of processing modes and additional details.
Slide 40: Rocky Mountains Sensitivities
Rocky Mountains Sensitivities 3Q 2010 Adjusted EBITDA volume sensitivity (positive or negative impact) ■ Bighorn: 10,000 MMBtu/d = $247,000 (1) ■ Fort Union: 10,000 MMBtu/d = $70,000 (1) Note: See this Appendix for reconciliation of Adjusted EBITDA. Values reflect rounding. Impact on Adjusted EBITDA
Slide 41: Hedging Impact of Commodity Price Sensitivities
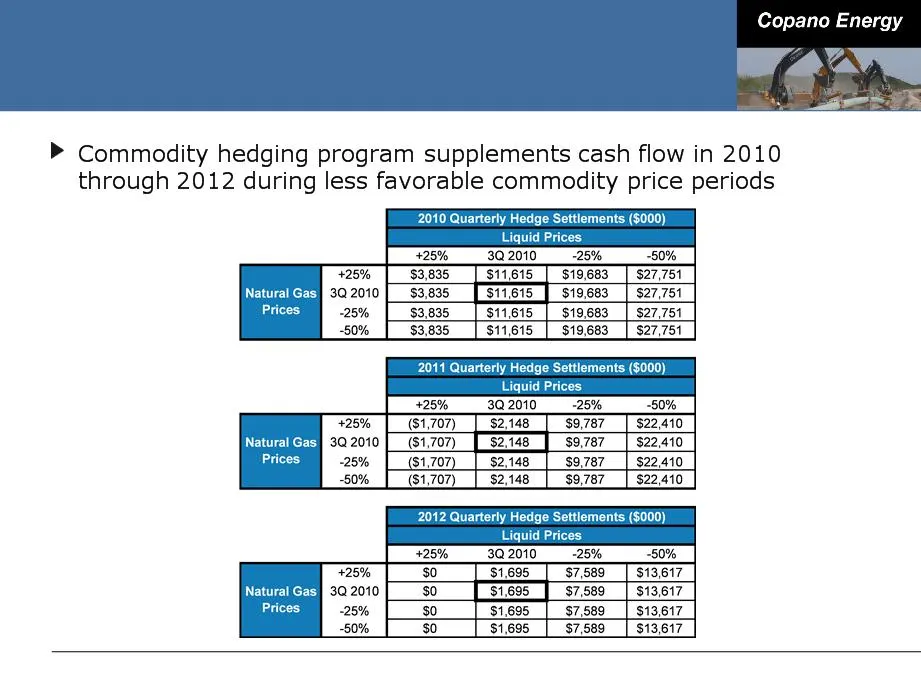
Hedging Impact of Commodity Price Sensitivities
Slide 42: Reconciliation of Non-GAAP Financial Measures
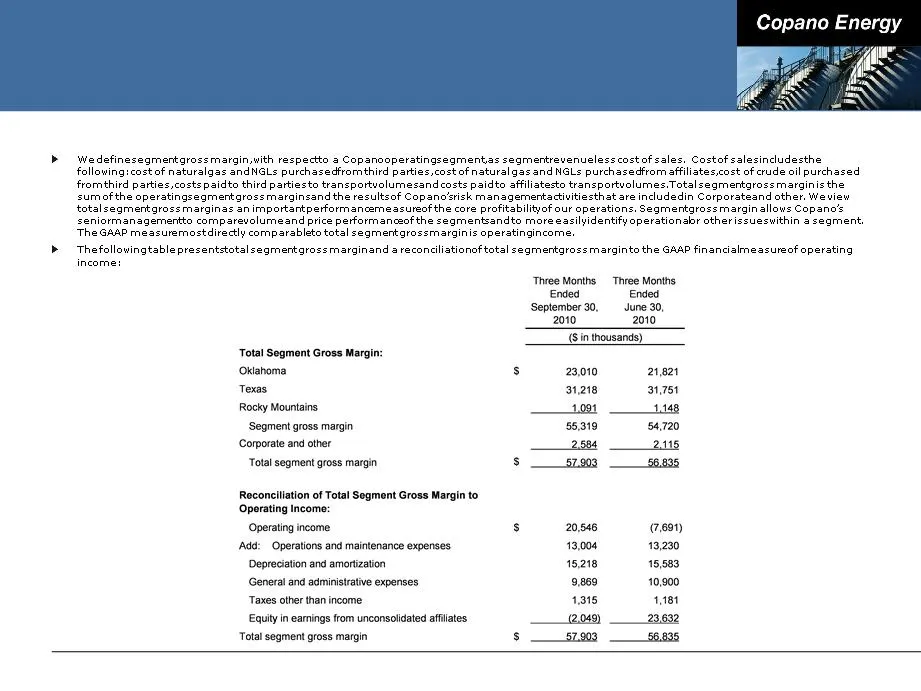
Reconciliation of Non-GAAP Financial Measures Segment Gross Margin and Total Segment Gross Margin
Slide 43: Reconciliation of Non-GAAP Financial Measures
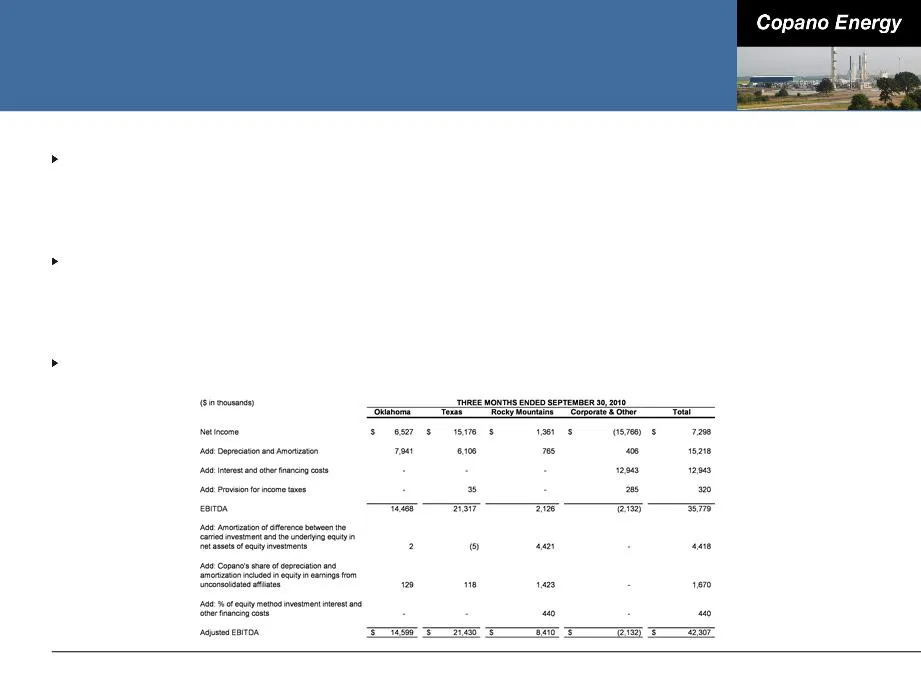
Reconciliation of Non-GAAP Financial Measures Adjusted EBITDA We define EBITDA as net income (loss) plus interest expense, provision for income taxes and depreciation and amortization expense. Because a portion of our net income (loss) is attributable to equity in earnings (loss) from our equity inv
Slide 44: Reconciliation of Non-GAAP Financial Measures
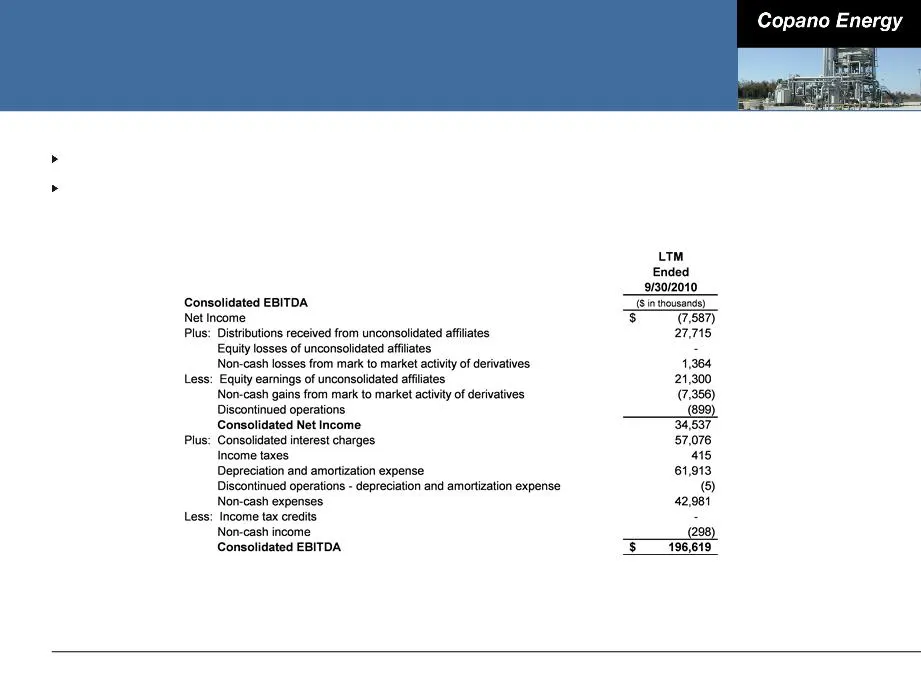
Reconciliation of Non-GAAP Financial Measures Consolidated EBITDA EBITDA is also a financial measure that, with negotiated pro formal adjustments relating to acquisitions completed during the period, is reported to our lenders as Consolidated EBITDA and is used to compute our financial covenants und
Slide 45: Definitions of Non-GAAP Financial Measures
Definitions of Non-GAAP Financial Measures Total Distributable Cash Flow We define total distributable cash flow as net income plus: (i) depreciation, amortization and impairment expense (including amortization expense relating to the option component of our risk management portfolio); (ii) cash dis
Source: SEC EDGAR · 8-K filed Dec 6, 2010
More decks from Copano Energy L.L.C.
 2012 RBC Capital Markets MLP Conference35 slides · Nov 15, 2012
 2012 Citi One-on-One MLP/Midstream Infrastructure Conference35 slides · Aug 21, 2012
 Investor Presentation (June 2012)34 slides · Jun 18, 2012
 NAPTP 2012 MLP Investor Conference34 slides · May 22, 2012
 Morgan Stanley MLP and Diversified Natural Gas Corporate Access Day 201245 slides · Mar 7, 2012
 2011 RBC Capital Markets MLP Conference42 slides · Nov 17, 2011