Copano Energy L.L.C — Investor Presentation (June 2012)
34 slides from Copano Energy L.L.C's investor presentation, Jun 18, 2012

Slide 1: June 2012 Investor Presentation
June 2012 Investor Presentation June 18, 2012 NASDAQ: CPNO

Slide 2: Disclaimer
Disclaimer Forward-Looking Statements This presentation includes “forward-looking statements,” as defined in the federal securities laws. Statements that address activities or events that Copano believes will or may occur in the future are forward-looking statements. These statements include, but ar

Slide 3: Agenda: Eagle Ford Shale Update
Eagle Ford Shale Update Agenda Eagle Ford Shale Update Eagle Ford Shale Growth Projects Business Segment Outlook Eagle Ford Shale Growth Projects Business Segment Outlook

Slide 4: Long-term Value of Eagle Ford Strategy Unchanged
Long-term Value of Eagle Ford Strategy Unchanged Eagle Ford Shale play considered one of the best in North America • Size, quality and proximity to markets Copano assets well positioned • Existing pipes and processing capacity with significant tailgate market access • New, large-diameter pipelines i

Slide 5: Processing
Eagle Ford Shale Processing We expect combined actual NGL recoveries to remain above or near contractually fixed recoveries for the balance of the year • Margins from fixed recovery contract terms are in addition to the fixed fees we collect for our midstream services Houston Central performance • 2

Slide 6: Houston Central Complex Expansion Projects
Houston Central Complex Expansion Projects New 400 MMcf/d cryogenic expansion expected in service 1Q 2013 • Average recoveries will improve when the new cryogenic expansion comes online • When Formosa’s new fractionator becomes operational in 2Q 2013, recoveries will further improve with access to a
Slide 7: Long-term Gas Contracts
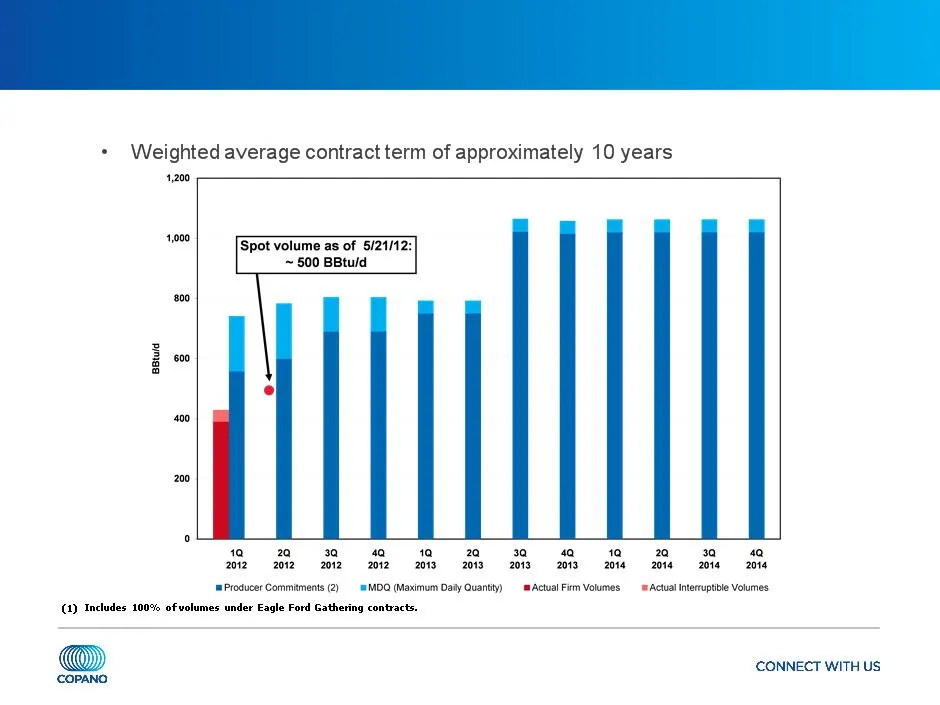
Long-term Eagle Ford Shale Gas Contracts (1) Eagle Ford Shale will drive shift to fee-based volumes (2) Includes substantial, long-term acreage dedication from GeoSouthern in northern Eagle Ford Shale.

Slide 8: Agenda: Growth Projects
Eagle Ford Shale Update Agenda Eagle Ford Shale Growth Projects Eagle Ford Shale Growth Projects Business Segment Outlook Eagle Ford Shale Update Business Segment Outlook
Slide 9: DK Pipeline Southwest Extension
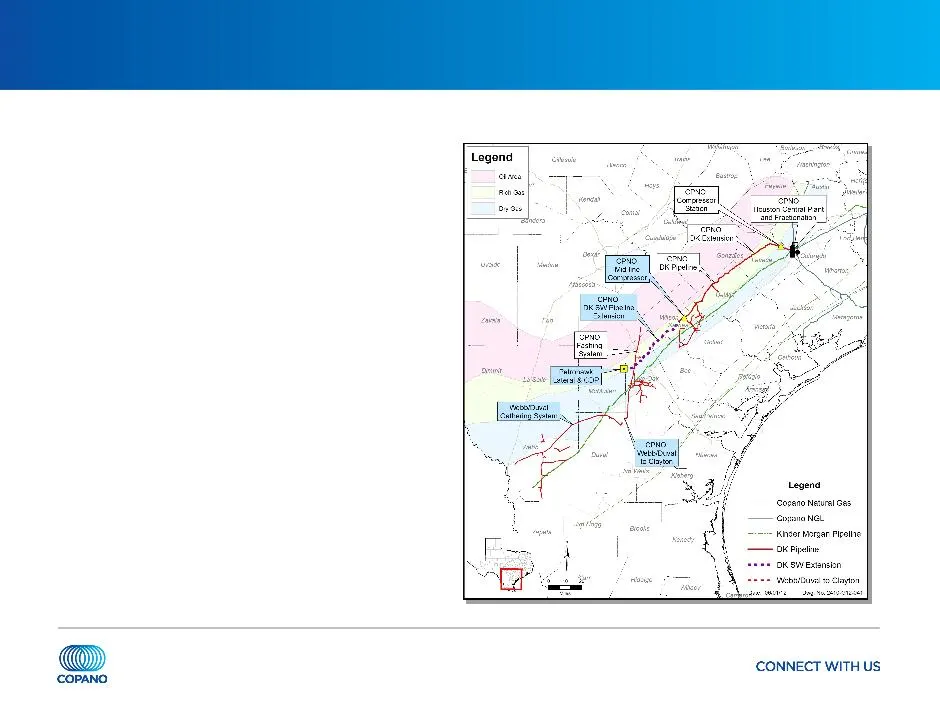
DK Pipeline Southwest Extension Further extend DK pipeline by adding approximately 65 miles of 24” pipeline southwest into McMullen County • Provides access to significant new Eagle Ford Shale volumes • Ties additional existing Copano gathering systems directly to Houston Central complex • Supported
Slide 10: Double Eagle Condensate Pipeline Joint Venture
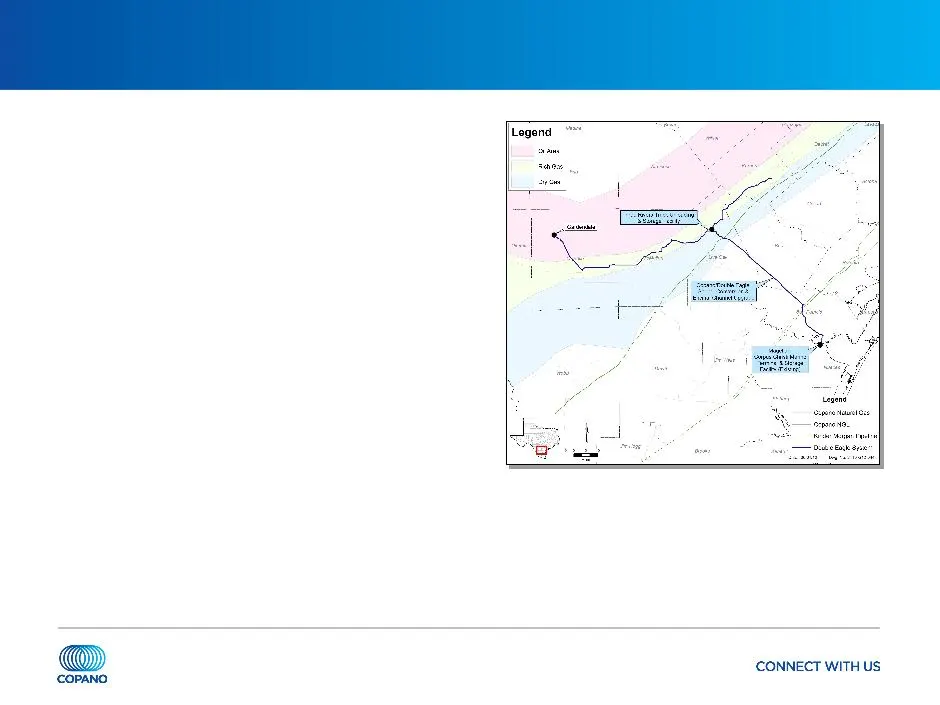
Double Eagle Condensate Pipeline Joint Venture 50/50 JV with Magellan Midstream • Constructing 140-mile condensate gathering system • Utilizes Copano’s existing 14” Goebel pipeline and dual-line rights of way • 100,000 Bbls/d of nominal capacity • Ties into existing and expanded Magellan storage and
Slide 11: Summary of Infrastructure
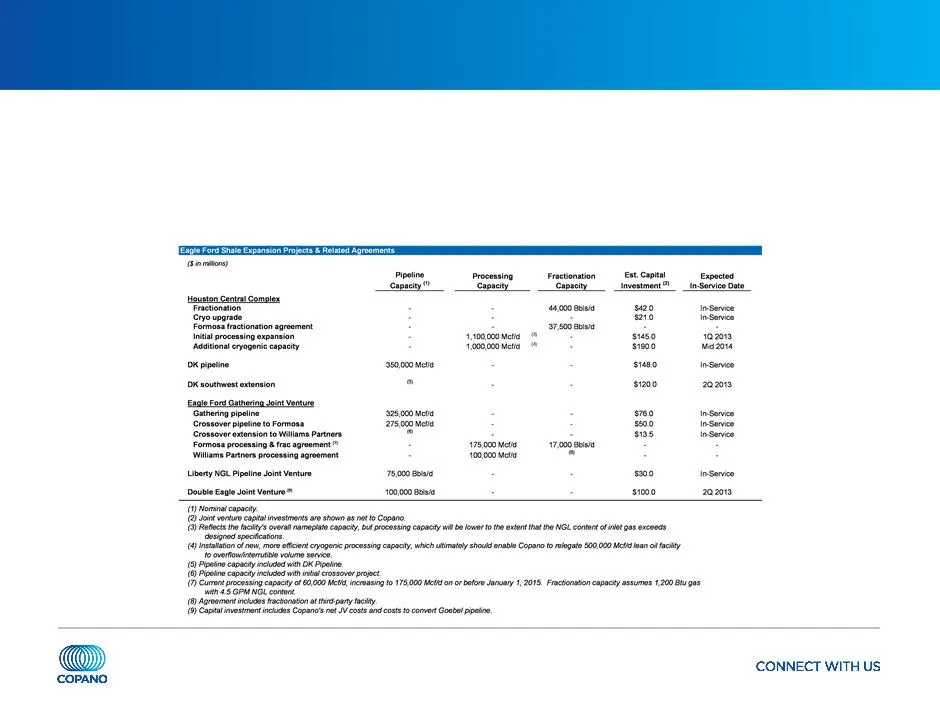
Summary of Eagle Ford Shale Infrastructure Announced total capital investment of over $930 million In excess of 1 Bcf/d of pipeline and processing capacity Greater than 100,000 Bbls/d of fractionation capacity
Slide 12: Agenda: Business Segment Outlook
Eagle Ford Shale Update Agenda Business Segment Outlook Eagle Ford Shale Growth Projects Business Segment Outlook Eagle Ford Shale Update Eagle Ford Shale Growth Projects
Slide 13: Texas Recent Developments
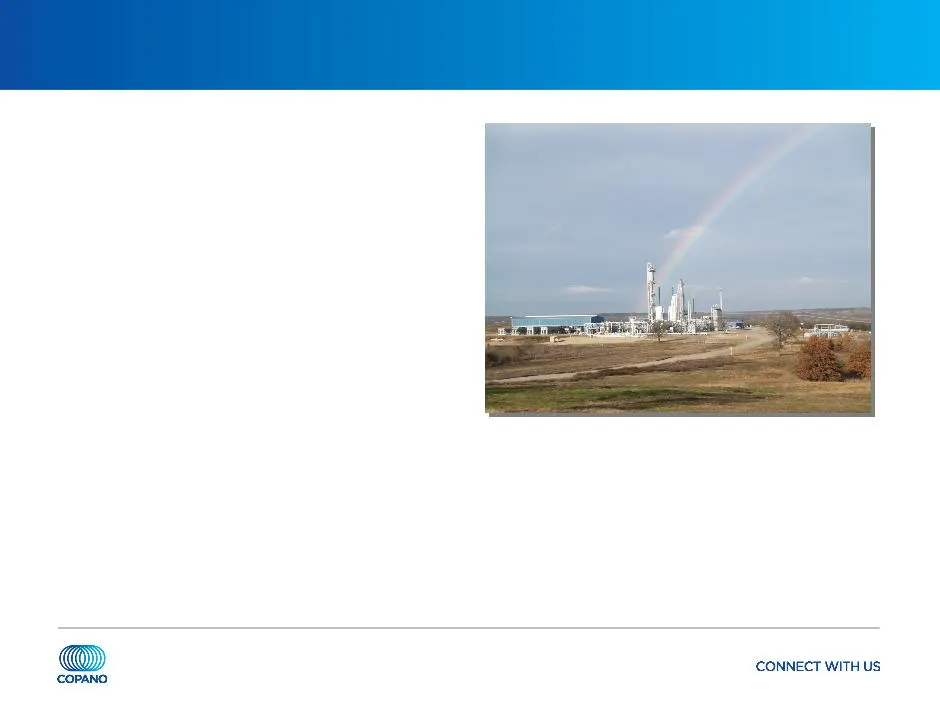
Texas Recent Developments Saint Jo system - north Barnett Shale Combo • Plant fully committed under long-term, fee-based contracts • Plant running at or above nameplate capacity • Treating capacity expansion at Saint Jo plant completed March 2012 - Provides for a maximum of 110 MMcf/d of inlet capac

Slide 14: Texas Recent Developments
Texas Recent Developments Eagle Ford Shale • Copano’s total Eagle Ford Shale volumes (including Eagle Ford Gathering volumes) averaged approximately 430,000 MMBtu/d in 1Q 2012 Lake Charles plant • Processed approximately 133,000 MMBtu/d in 1Q 2012 - Currently running on an opportunistic basis - At c

Slide 15: Texas Outlook
Texas Outlook Saint Jo system • Copano’s largest producer continues an active drilling program in the area • Leasing activity continues Eagle Ford Shale • Approximately 240 rigs currently running in the Eagle Ford Shale • Continue to expect volume increases on both wholly owned and joint venture ass

Slide 16: Oklahoma Recent Developments
Oklahoma Recent Developments Woodford Shale • Volumes on the Cyclone Mountain system up in 2Q 2012 from 1Q 2012 • Treating and compression capacity optimization ongoing Mississippi Lime • Drilling near Copano infrastructure continues to be active • Expanding Osage system gathering footprint by insta

Slide 17: Oklahoma Outlook
Oklahoma Outlook Rich gas (primarily Hunton dewatering and Mississippi Lime) • Drilling activity remains steady in 2Q 2012 compared to 1Q 2012 • 3 rigs running in the Hunton, 6 rigs in the Mississippi Lime and 10 rigs in other rich gas areas • In the Mississippi Lime, volume growth expected as drill

Slide 18: Rocky Mountains Outlook
Rocky Mountains Outlook Drilling and dewatering activity will be driven by commodity prices and producer economics • 2Q 2012 volumes for Bighorn expected to be lower compared to 1Q 2012 • 2Q 2012 volumes for Fort Union expected to be lower compared to 1Q 2012 2Q 2012 Adjusted EBITDA expected to be $

Slide 19: Copano
(@) COPANO

Slide 20: Introduction to Copano
Introduction to Copano Independent midstream company founded in 1992 • Producer focused • Entrepreneurial approach • Focus on long-term accretive growth • Publicly traded LLC - No general partner or incentive distribution rights - Tax benefits similar to MLPs, but with corporate governance of a C-co

Slide 21: Area of Operations
Area of Operations Operating segments • Texas • Oklahoma • Rocky Mountains Copano currently has assets in five U.S. resource plays • Eagle Ford Shale • North Barnett Shale Combo • Woodford Shale • Mississippi Lime • Powder River Basin Niobrara
Slide 22: Liquidity and Capitalization
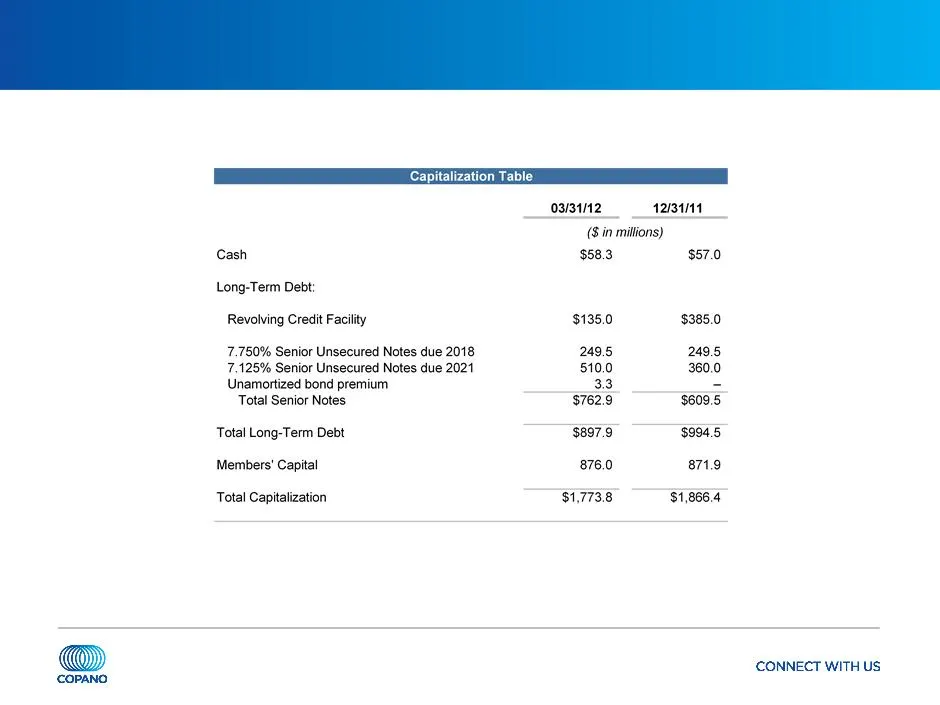
Liquidity and Capitalization As of March 31, 2012, total available liquidity approximately $385 million
Slide 23: Shifting Contract Mix
Shifting Contract Mix Contract Mix as a % of Gross Margin 1Q 2010 4Q 2011 1Q 2012 Fee-based 27% 47% 58% Percentage-of- proceeds 39% 27% 26% Keep- whole/Other 36% 41% 22% Net hedging -2% -15% -6% Net commodity exposed 73% 53% 42% Continued shift towards a more fee-based mix • Eagle Ford Shale and nor
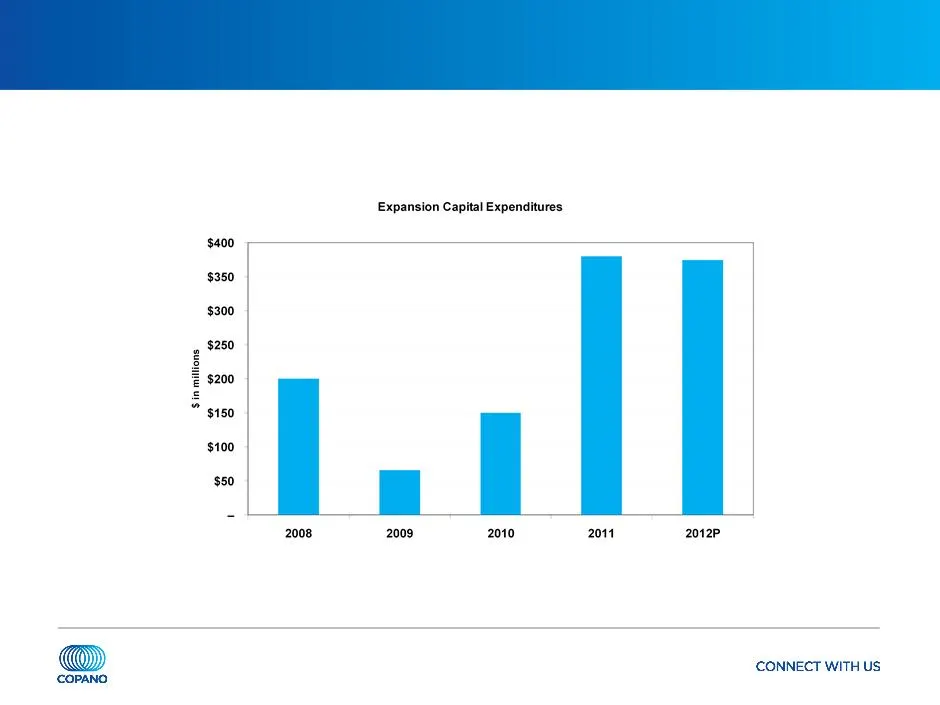
Slide 24: Expansion Capital Expenditures
Expansion Capital Expenditures Board approved 2012 expansion capex of approximately $375 million

Slide 25: Hedging Strategy
Hedging Strategy Continued shift towards a more fee-based contract mix • Reliance on hedging will decrease as contract mix changes over time 2012 hedged near policy limits for all products except ethane • Approximately 90% of propane, butane, natural gasoline and condensate exposure hedged • Approxi
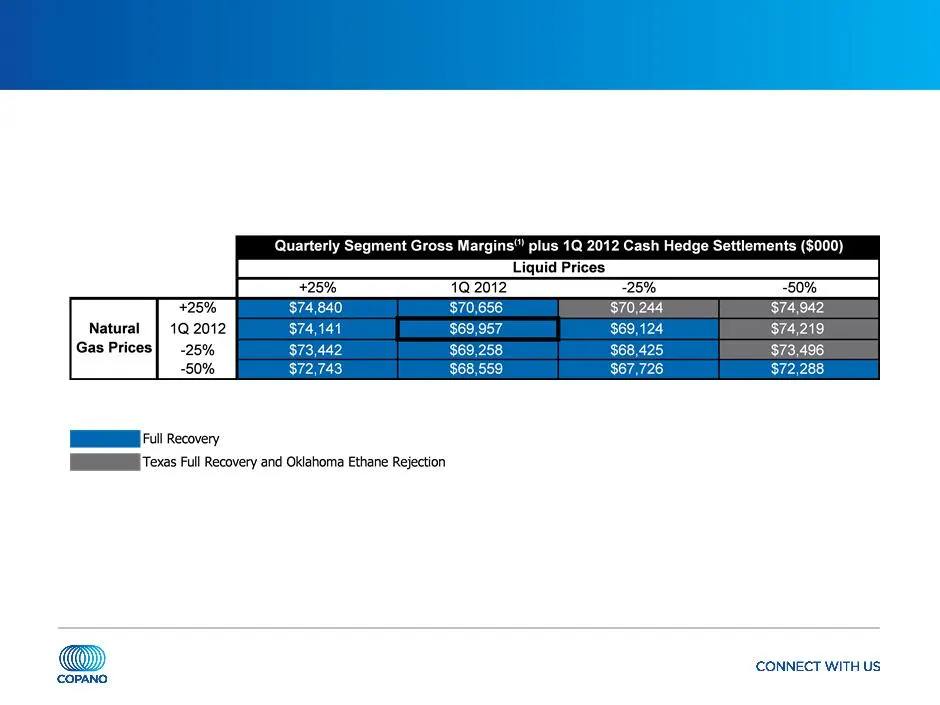
Slide 26: Commodity-Related Margin Sensitivities
Commodity-Related Margin Sensitivities Matrix reflects 1Q 2012 wellhead and plant inlet volumes, adjusted using Copano’s 2012 planning model (1) Consists of Texas and Oklahoma Segment gross margins.
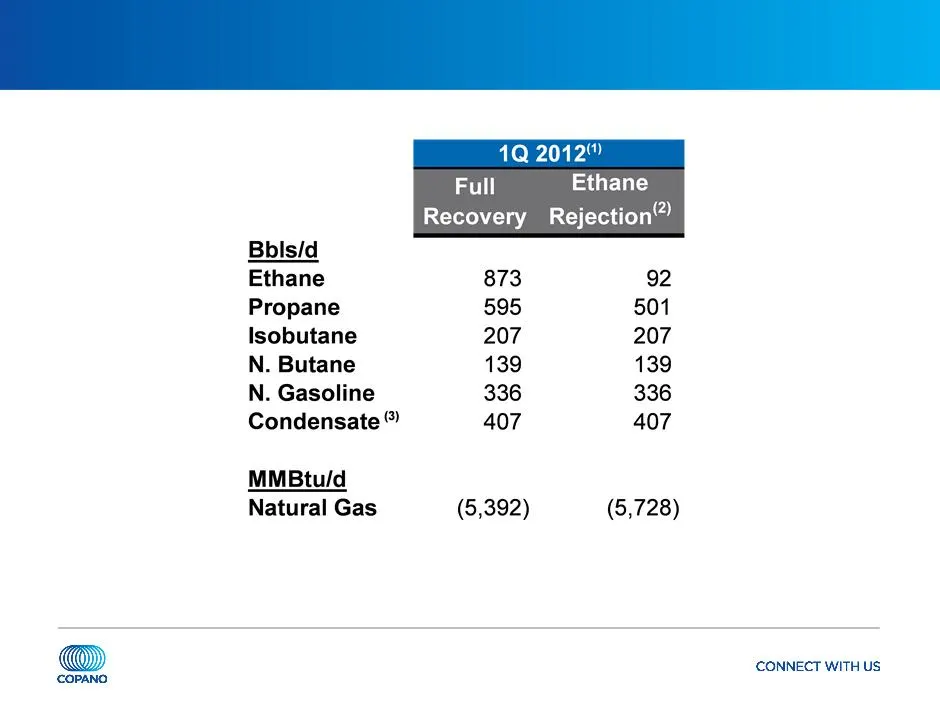
Slide 27: Texas Net Commodity Exposure
Texas Net Commodity Exposure Note: See explanation of processing modes in this Appendix. (1) Source: Copano Energy internal financial planning models. Based on 1Q 2012 daily wellhead/plant inlet volumes. (2) Fractionation at Houston Central complex permits significant reductions in ethane recoveries
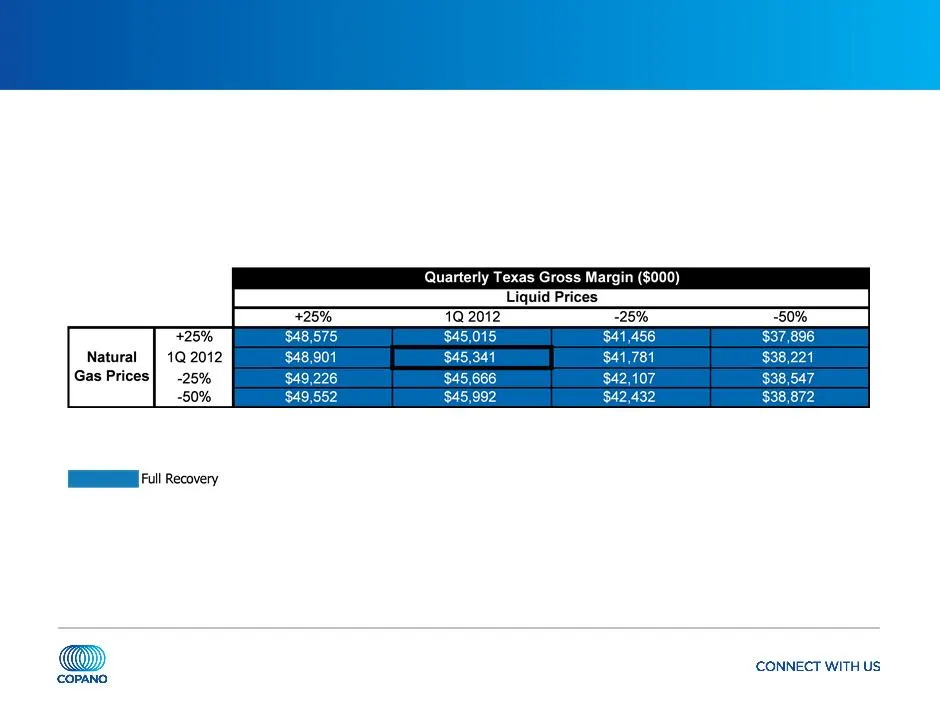
Slide 28: Texas Commodity Price Sensitivities
Texas Commodity Price Sensitivities Texas segment gross margins excluding hedge settlements • Matrix reflects 1Q 2012 volumes and operating conditions, adjusted using Copano’s 2012 planning model Note: Please see this Appendix for definitions of processing modes and additional details.
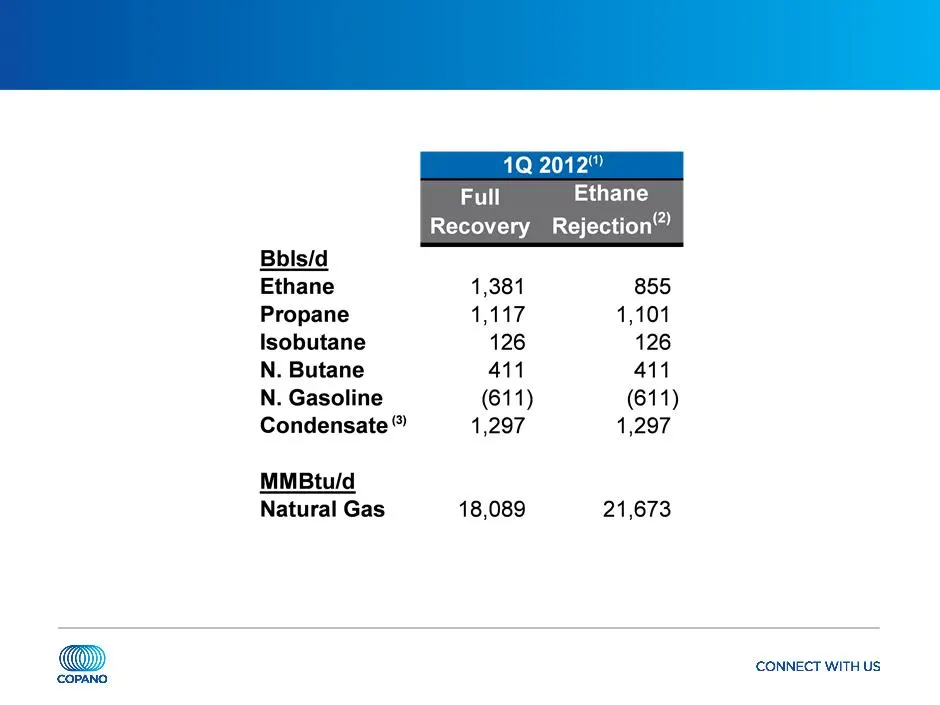
Slide 29: Oklahoma Net Commodity Exposure
Oklahoma Net Commodity Exposure Note: See explanation of processing modes in this Appendix. Values reflect rounding. (1) Source: Copano Energy internal financial planning models. (2) Ethane rejection at Paden plant is limited by nitrogen rejection facilities. (3) Reflects impact of producer delivery
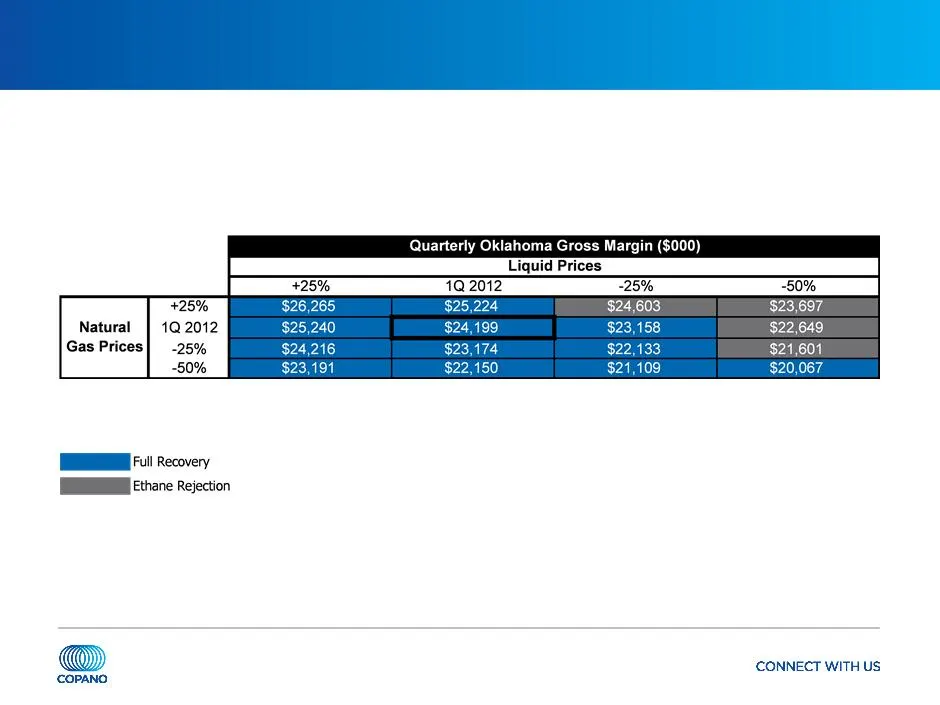
Slide 30: Oklahoma Commodity Price Sensitivities
Oklahoma Commodity Price Sensitivities Oklahoma segment gross margins excluding hedge settlements • Matrix reflects 1Q 2012 volumes, adjusted using Copano’s 2012 planning model Note: Please see this Appendix for definitions of processing modes and additional details.

Slide 31: Rocky Mountains Sensitivities
Rocky Mountains Sensitivities 1Q 2012 Adjusted EBITDA volume sensitivity (positive or negative impact) • Bighorn: 10,000 MMBtu/d = $250,000 (1) • Fort Union: 10,000 MMBtu/d = immaterial impact until physical volumes exceed long- term contractual volume commitments - 1Q 2012 pipeline throughput: 658,
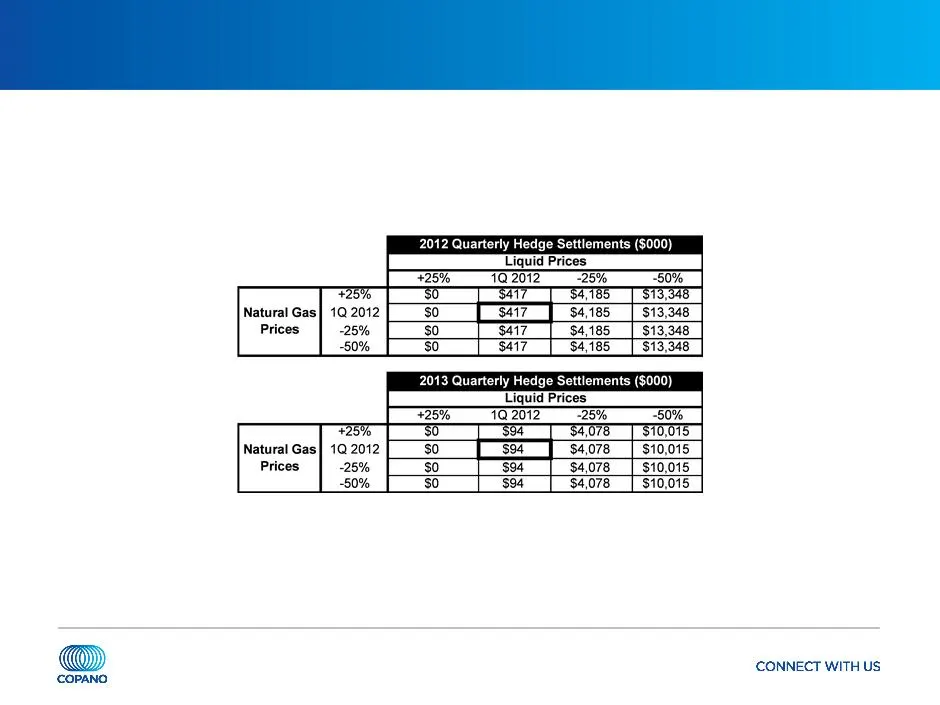
Slide 32: Hedging Impact of Commodity Price Sensitivities
Hedging Impact of Commodity Price Sensitivities Commodity hedging program supplements cash flow in 2012 through 2013 during less favorable commodity price periods
Slide 33: Processing Modes
Processing Modes Full Recovery Texas and Oklahoma - If the value of recovered NGLs exceeds the fuel and gas shrinkage costs of recovering NGLs Ethane Rejection Texas and Oklahoma - If the value of ethane is less than the fuel and shrinkage costs to recover ethane (in Oklahoma, ethane rejection at Pa
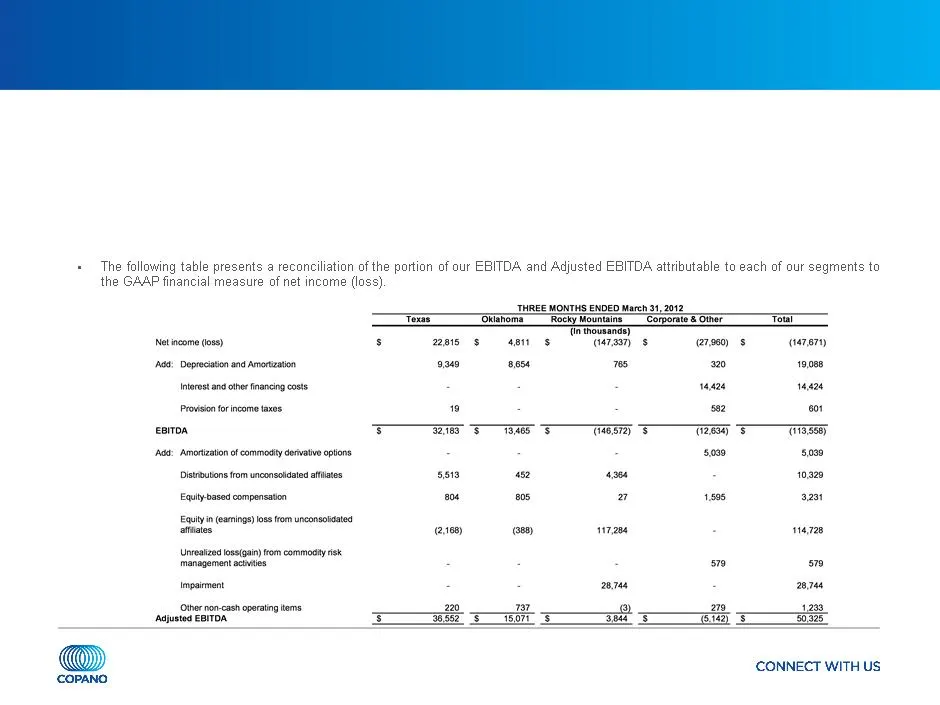
Slide 34: Reconciliation of Non-GAAP Financial Measures
Reconciliation of Non-GAAP Financial Measures Adjusted EBITDA • We define adjusted EBITDA as: - net income (loss); - plus interest and other financing costs, provision for income taxes, depreciation, amortization and impairment expense, non-cash amortization expense associated with our commodity der
Source: SEC EDGAR · 8-K filed Jun 18, 2012
More decks from Copano Energy L.L.C.
 2012 RBC Capital Markets MLP Conference35 slides · Nov 15, 2012
 2012 Citi One-on-One MLP/Midstream Infrastructure Conference35 slides · Aug 21, 2012
 NAPTP 2012 MLP Investor Conference34 slides · May 22, 2012
 Morgan Stanley MLP and Diversified Natural Gas Corporate Access Day 201245 slides · Mar 7, 2012
 2011 RBC Capital Markets MLP Conference42 slides · Nov 17, 2011
 Deutsche Bank 19th Annual Leveraged Finance Conference 201143 slides · Oct 12, 2011