Navistar International Corporation
Navistar International — Q4 2015 Earnings Presentation
39 slides from Navistar International's earnings presentation, Dec 17, 2015
Slide 1: Q4 2015 Earnings Presentation
Exhibit 99.2 Q4 2015 EARNINGS PRESENTATION DECEMBER 17, 2015 International® is a registered trademark of , Inc.
Slide 2: Safe Harbor Statement and Other Cautionary Notes
Safe Harbor Statement and Other Cautionary Notes Information provided and statements contained in this presentation that are not purely historical are forward-looking statements within the meaning of Section 27A of the Securities Act of 1933, as amended, Section 21E of the Securities Exchange Act of
Slide 3: Agenda
Agenda Overview Troy Clarke Financial Results Walter Borst Summary Troy Clarke NYSE: NAV 3 Q4 2015 Earnings – 12/17/2015
Slide 4: Fourth Quarter 2015 Results
TH 4 QUARTER 2015 RESULTS Troy Clarke, President & CEO NYSE: NAV
Slide 5: 2015 Summary
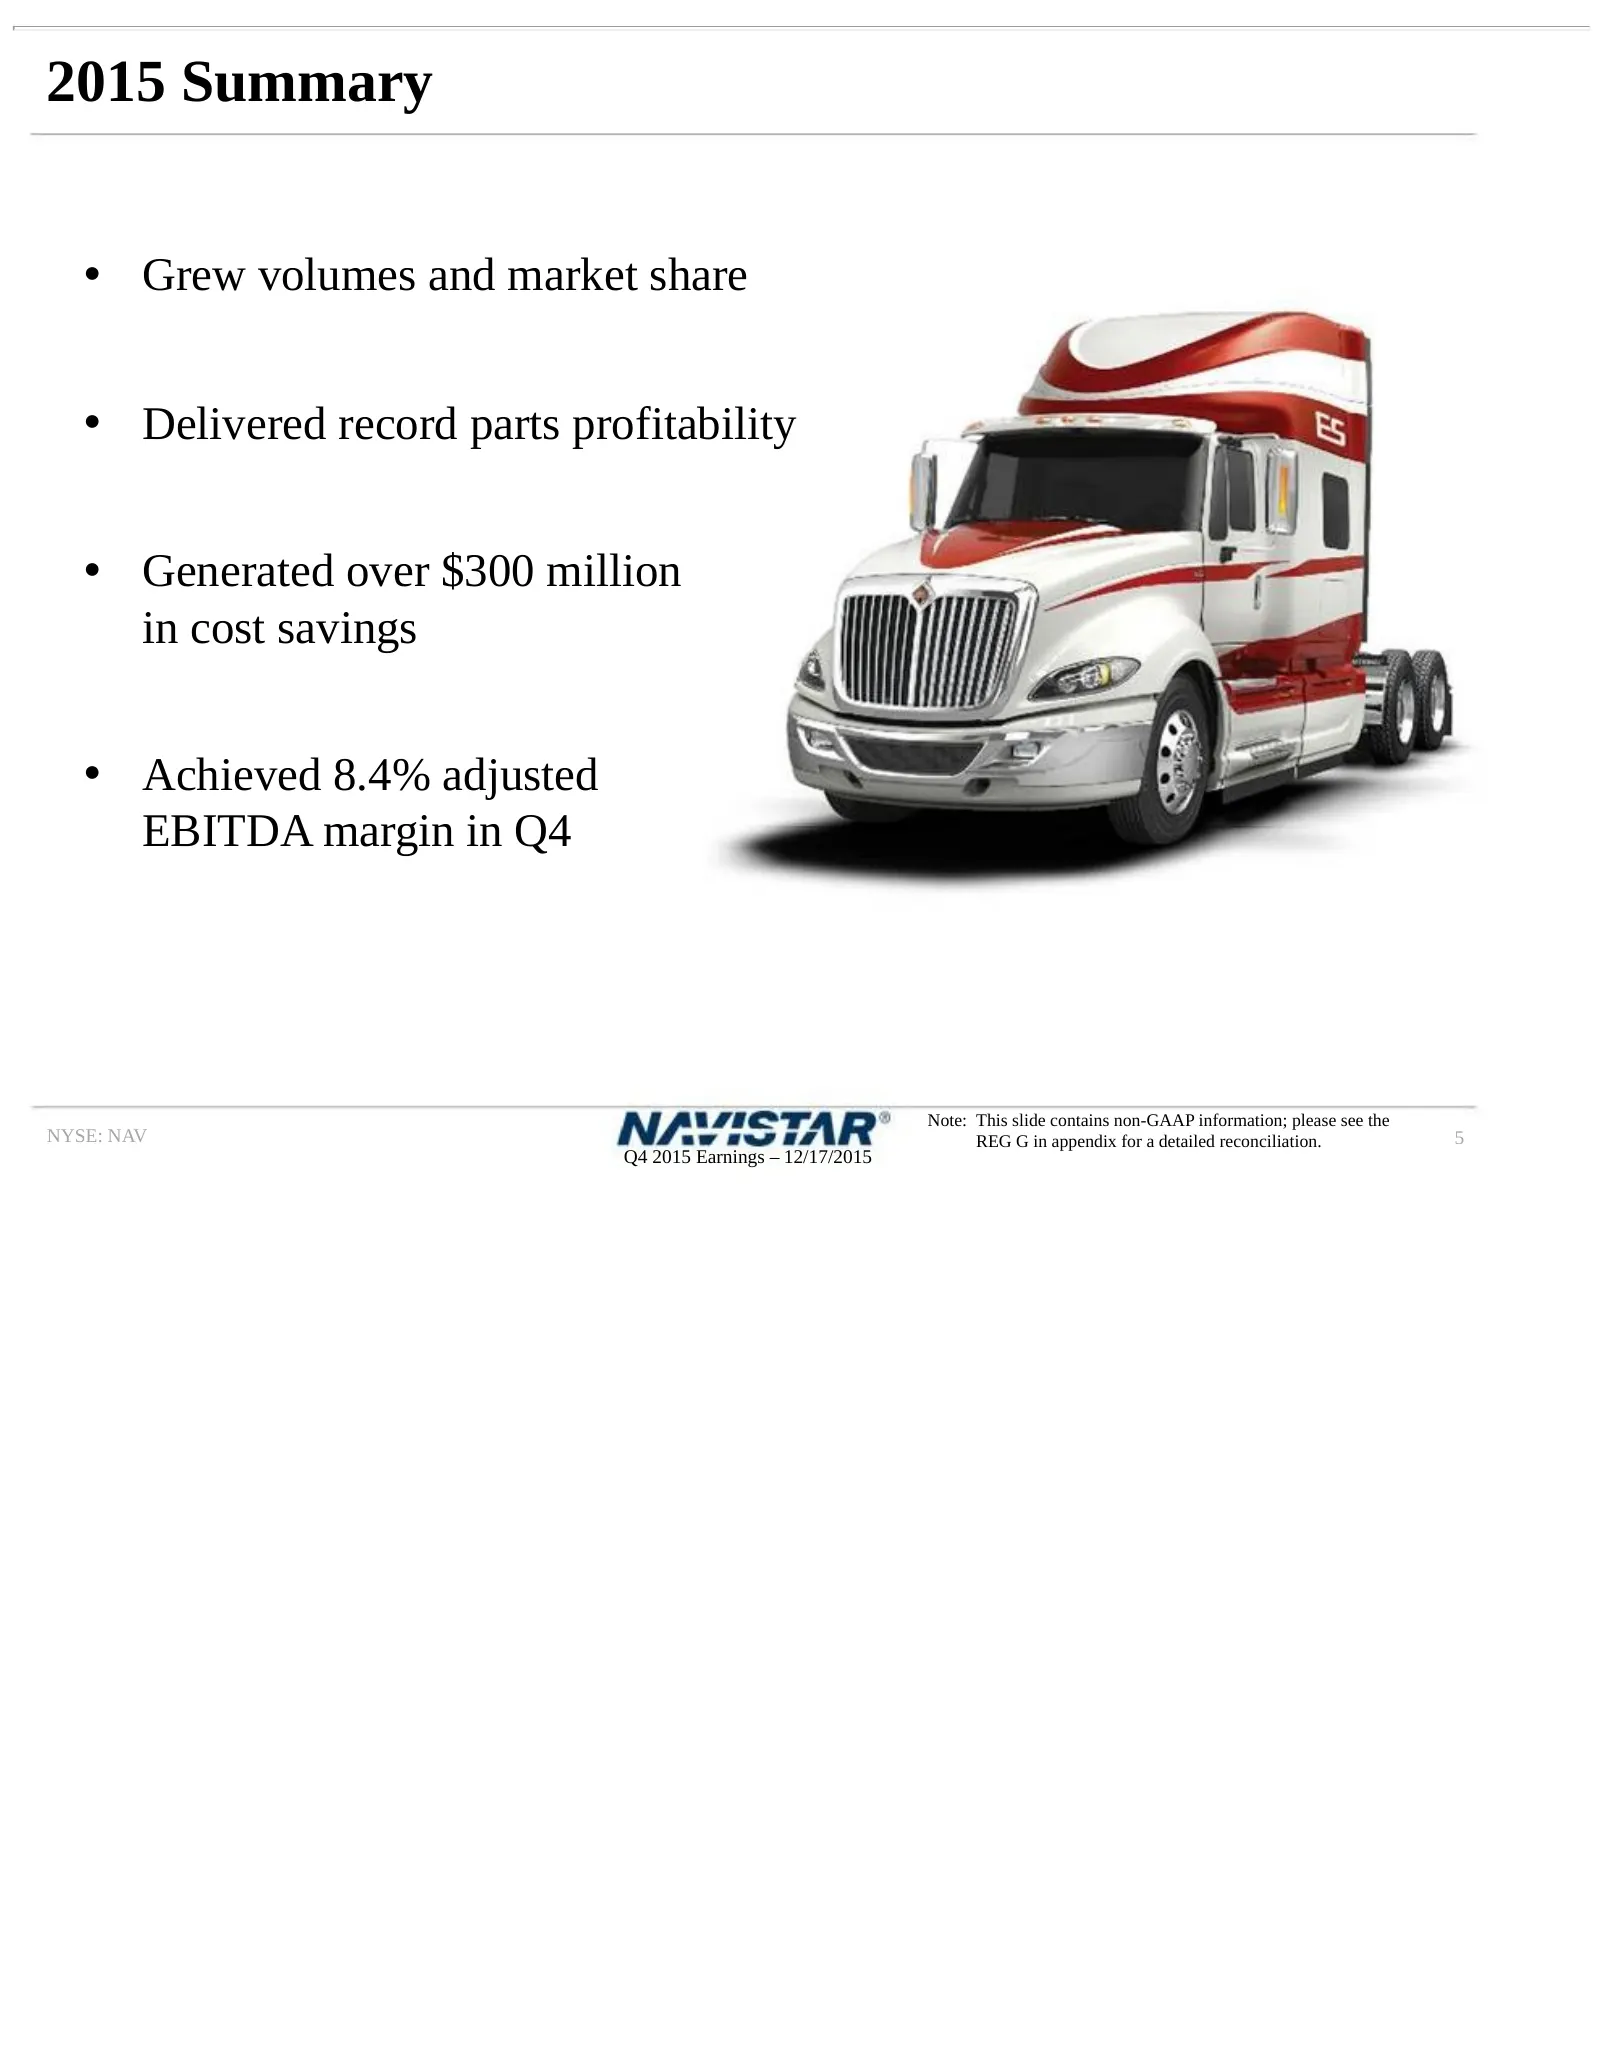
2015 Summary • Grew volumes and market share • Delivered record parts profitability • Generated over $300 million in cost savings • Achieved 8.4% adjusted EBITDA margin in Q4 Note: This slide contains non-GAAP information; please see the NYSE: NAV REG G in appendix for a detailed reconciliation. 5 Q
Slide 6: Financial Results
FINANCIAL RESULTS Walter Borst, Executive Vice President & CFO NYSE: NAV
Slide 7: Financial Summary
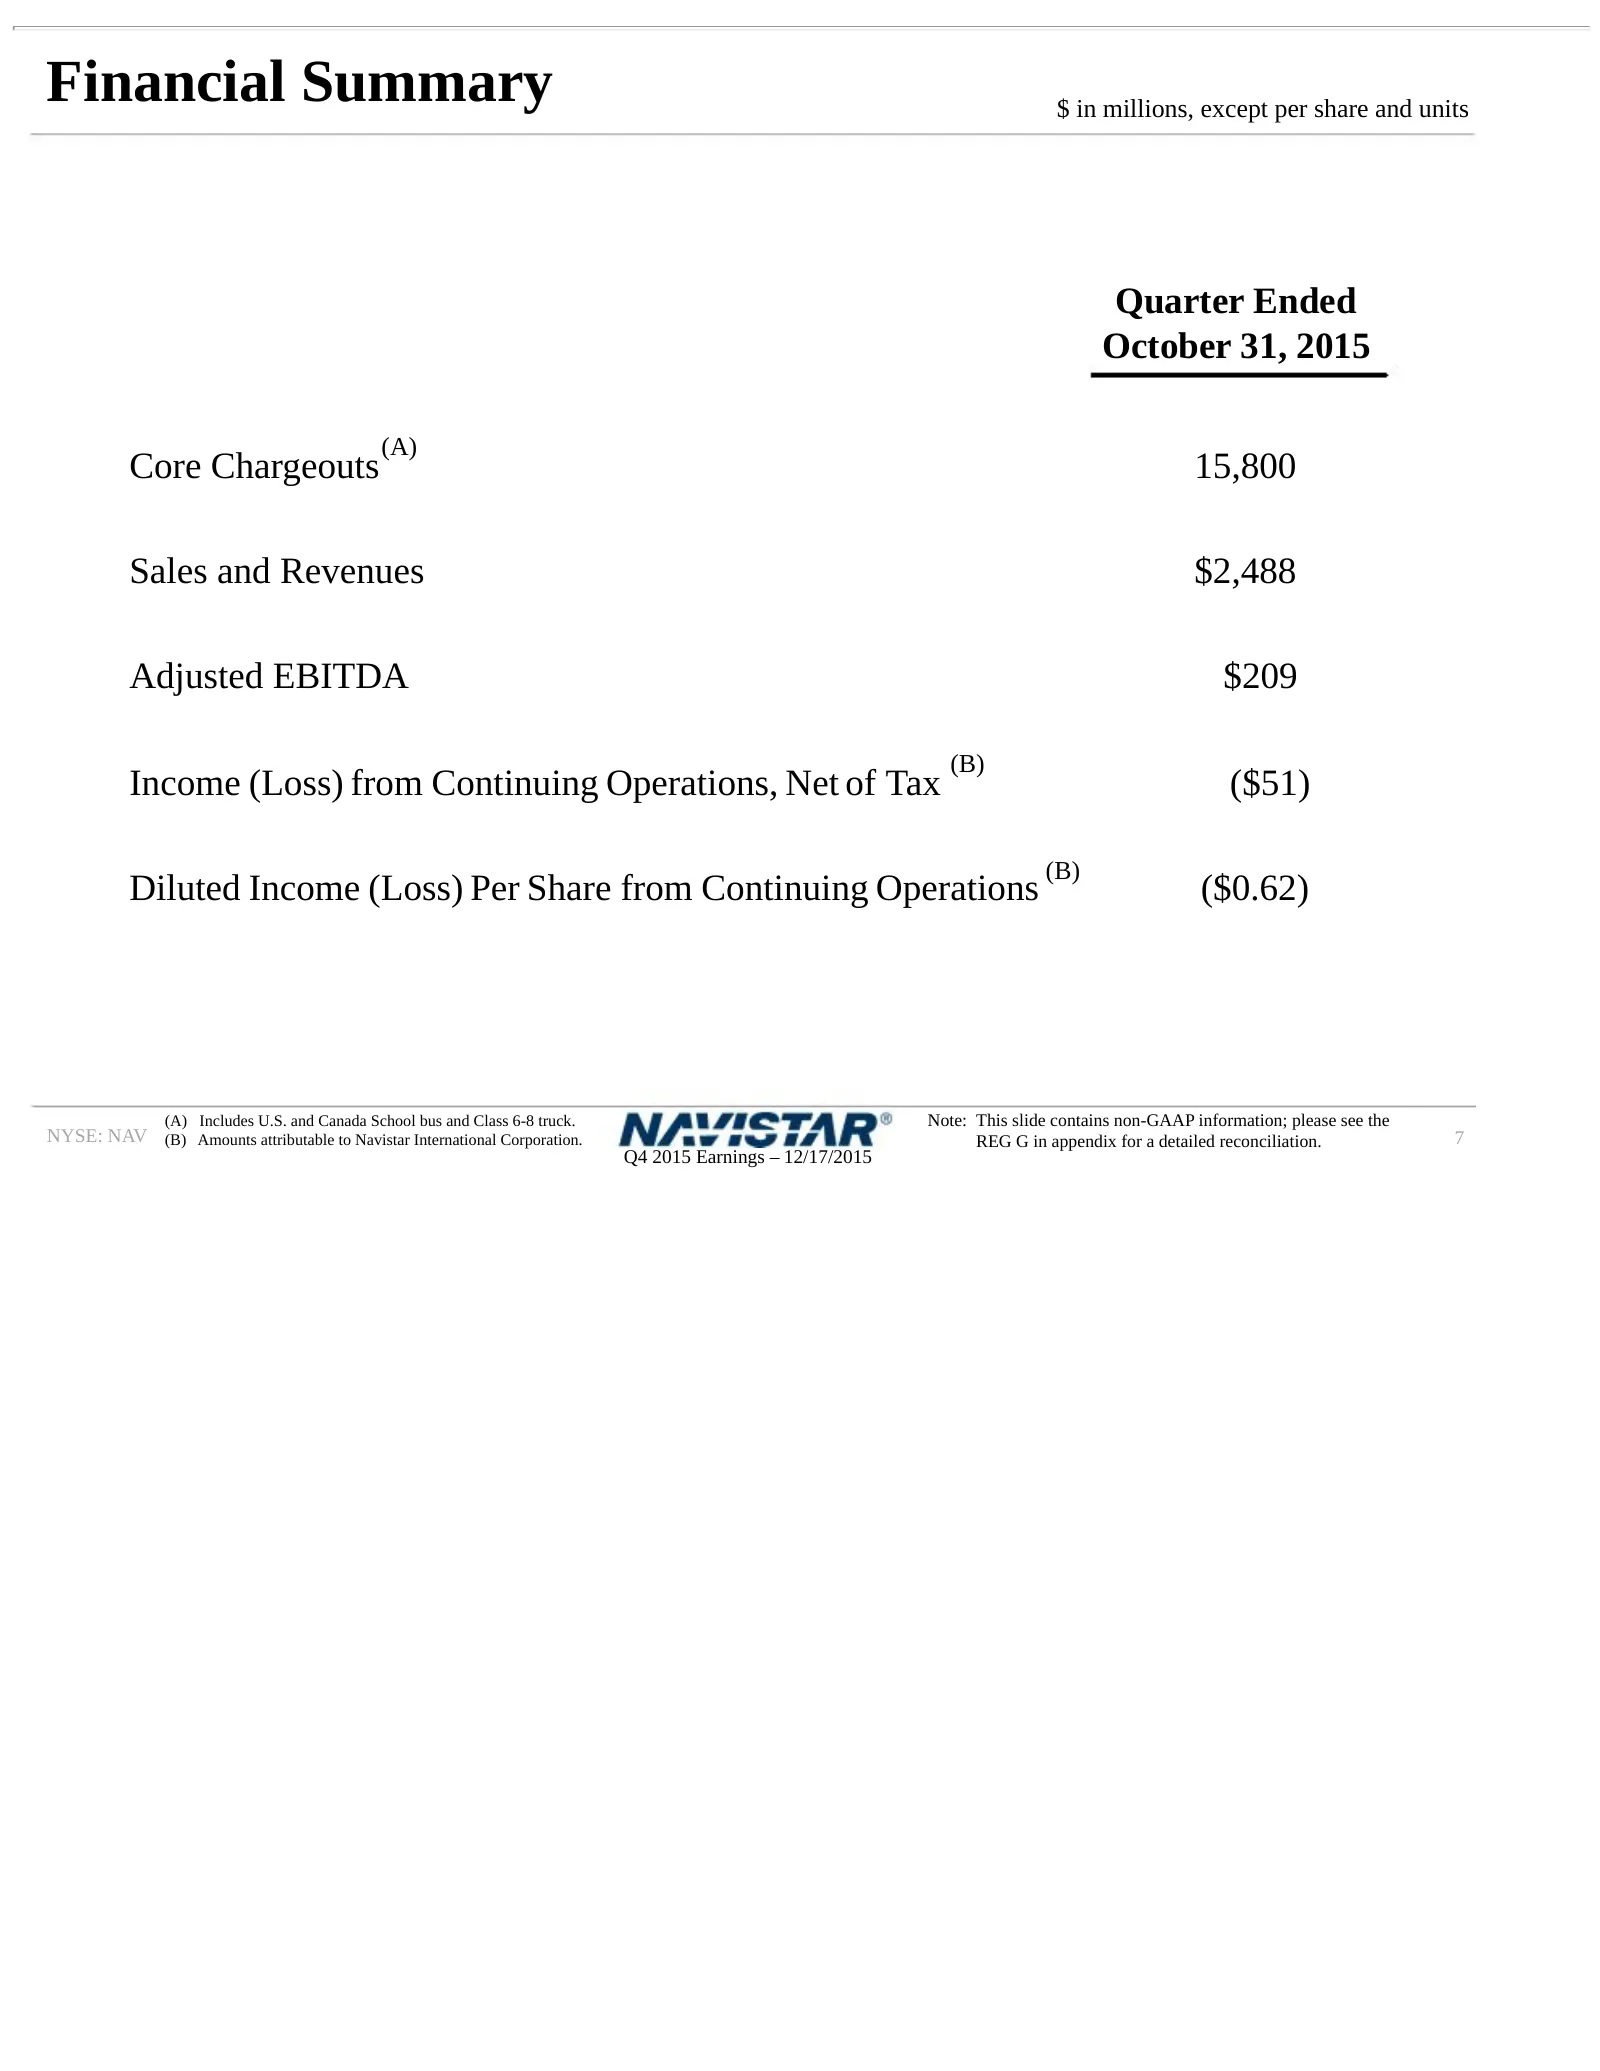
Financial Summary $ in millions, except per share and units Quarter Ended October 31, 2015 (A) Core Chargeouts 15,800 Sales and Revenues $2,488 Adjusted EBITDA $209 (B) Income (Loss) from Continuing Operations, Net of Tax ($51) (B) Diluted Income (Loss) Per Share from Continuing Operations ($0.62) (
Slide 8: Q4 2015 Adjusted EBITDA Within Guidance
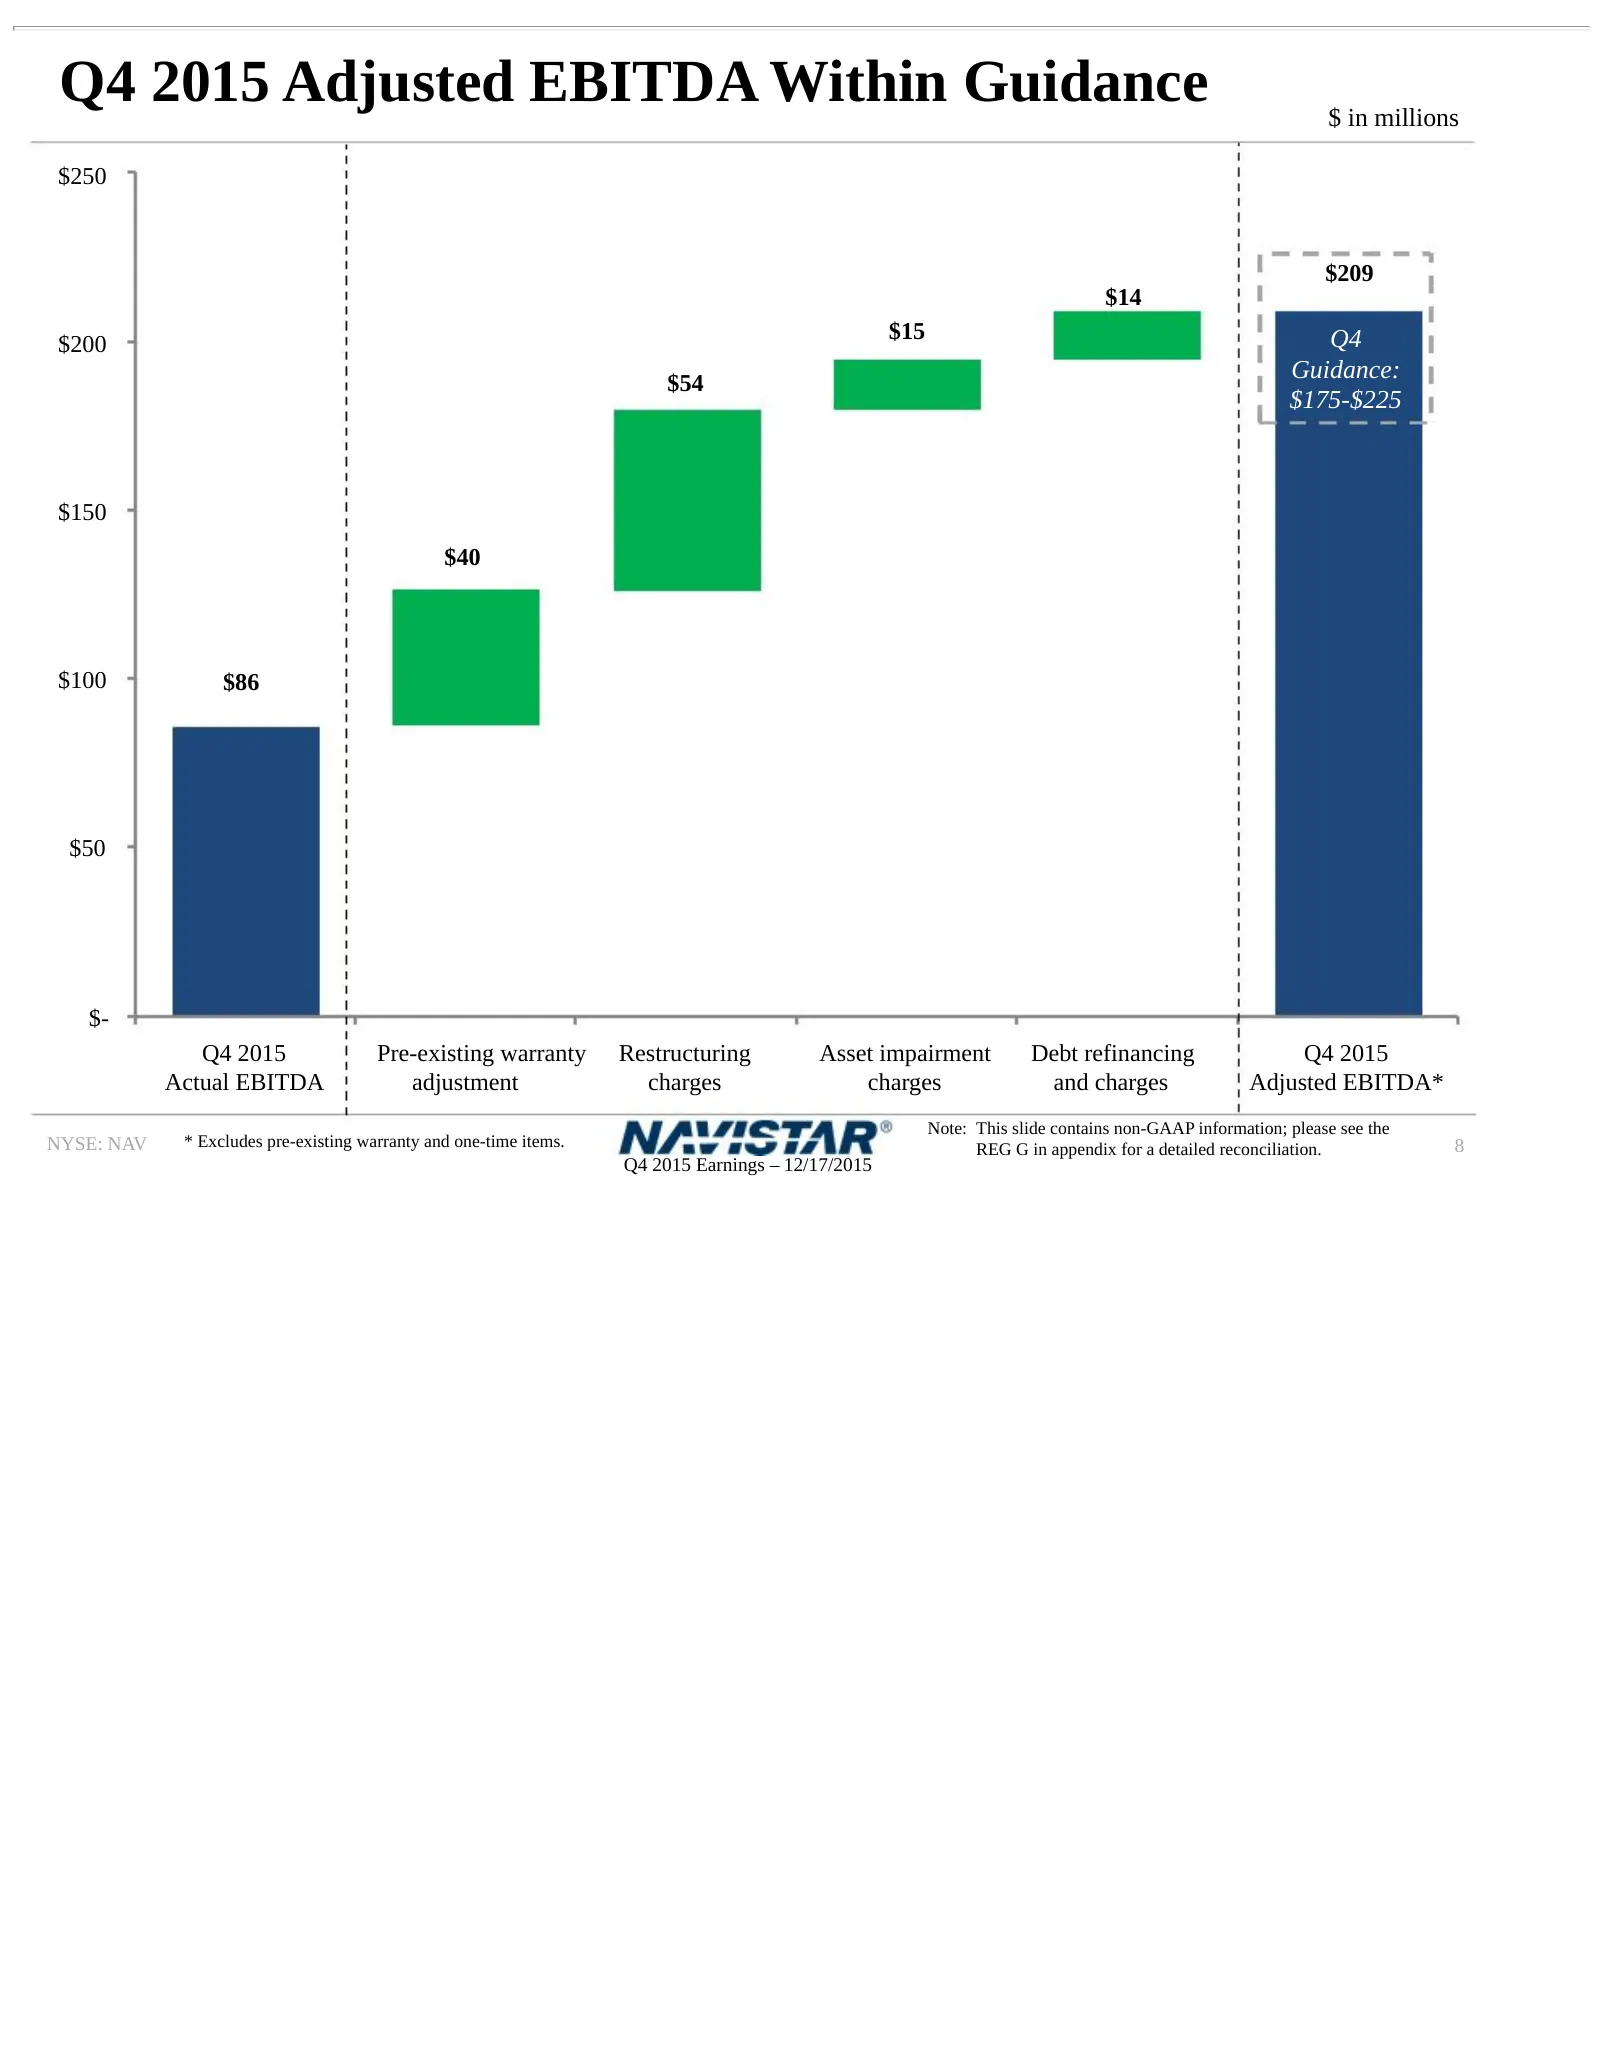
Q4 2015 Adjusted EBITDA Within Guidance $ in millions $250 $209 $14 $15 Q4 $200 Guidance: $54 $175-$225 $150 $40 $100 $86 $50 $- Q4 2015 Pre-existing warranty Restructuring Asset impairment Debt refinancing Q4 2015 Actual EBITDA adjustment charges charges and charges Adjusted EBITDA* Note: This slid
Slide 9: Achieved Adjusted EBITDA Margin Goal
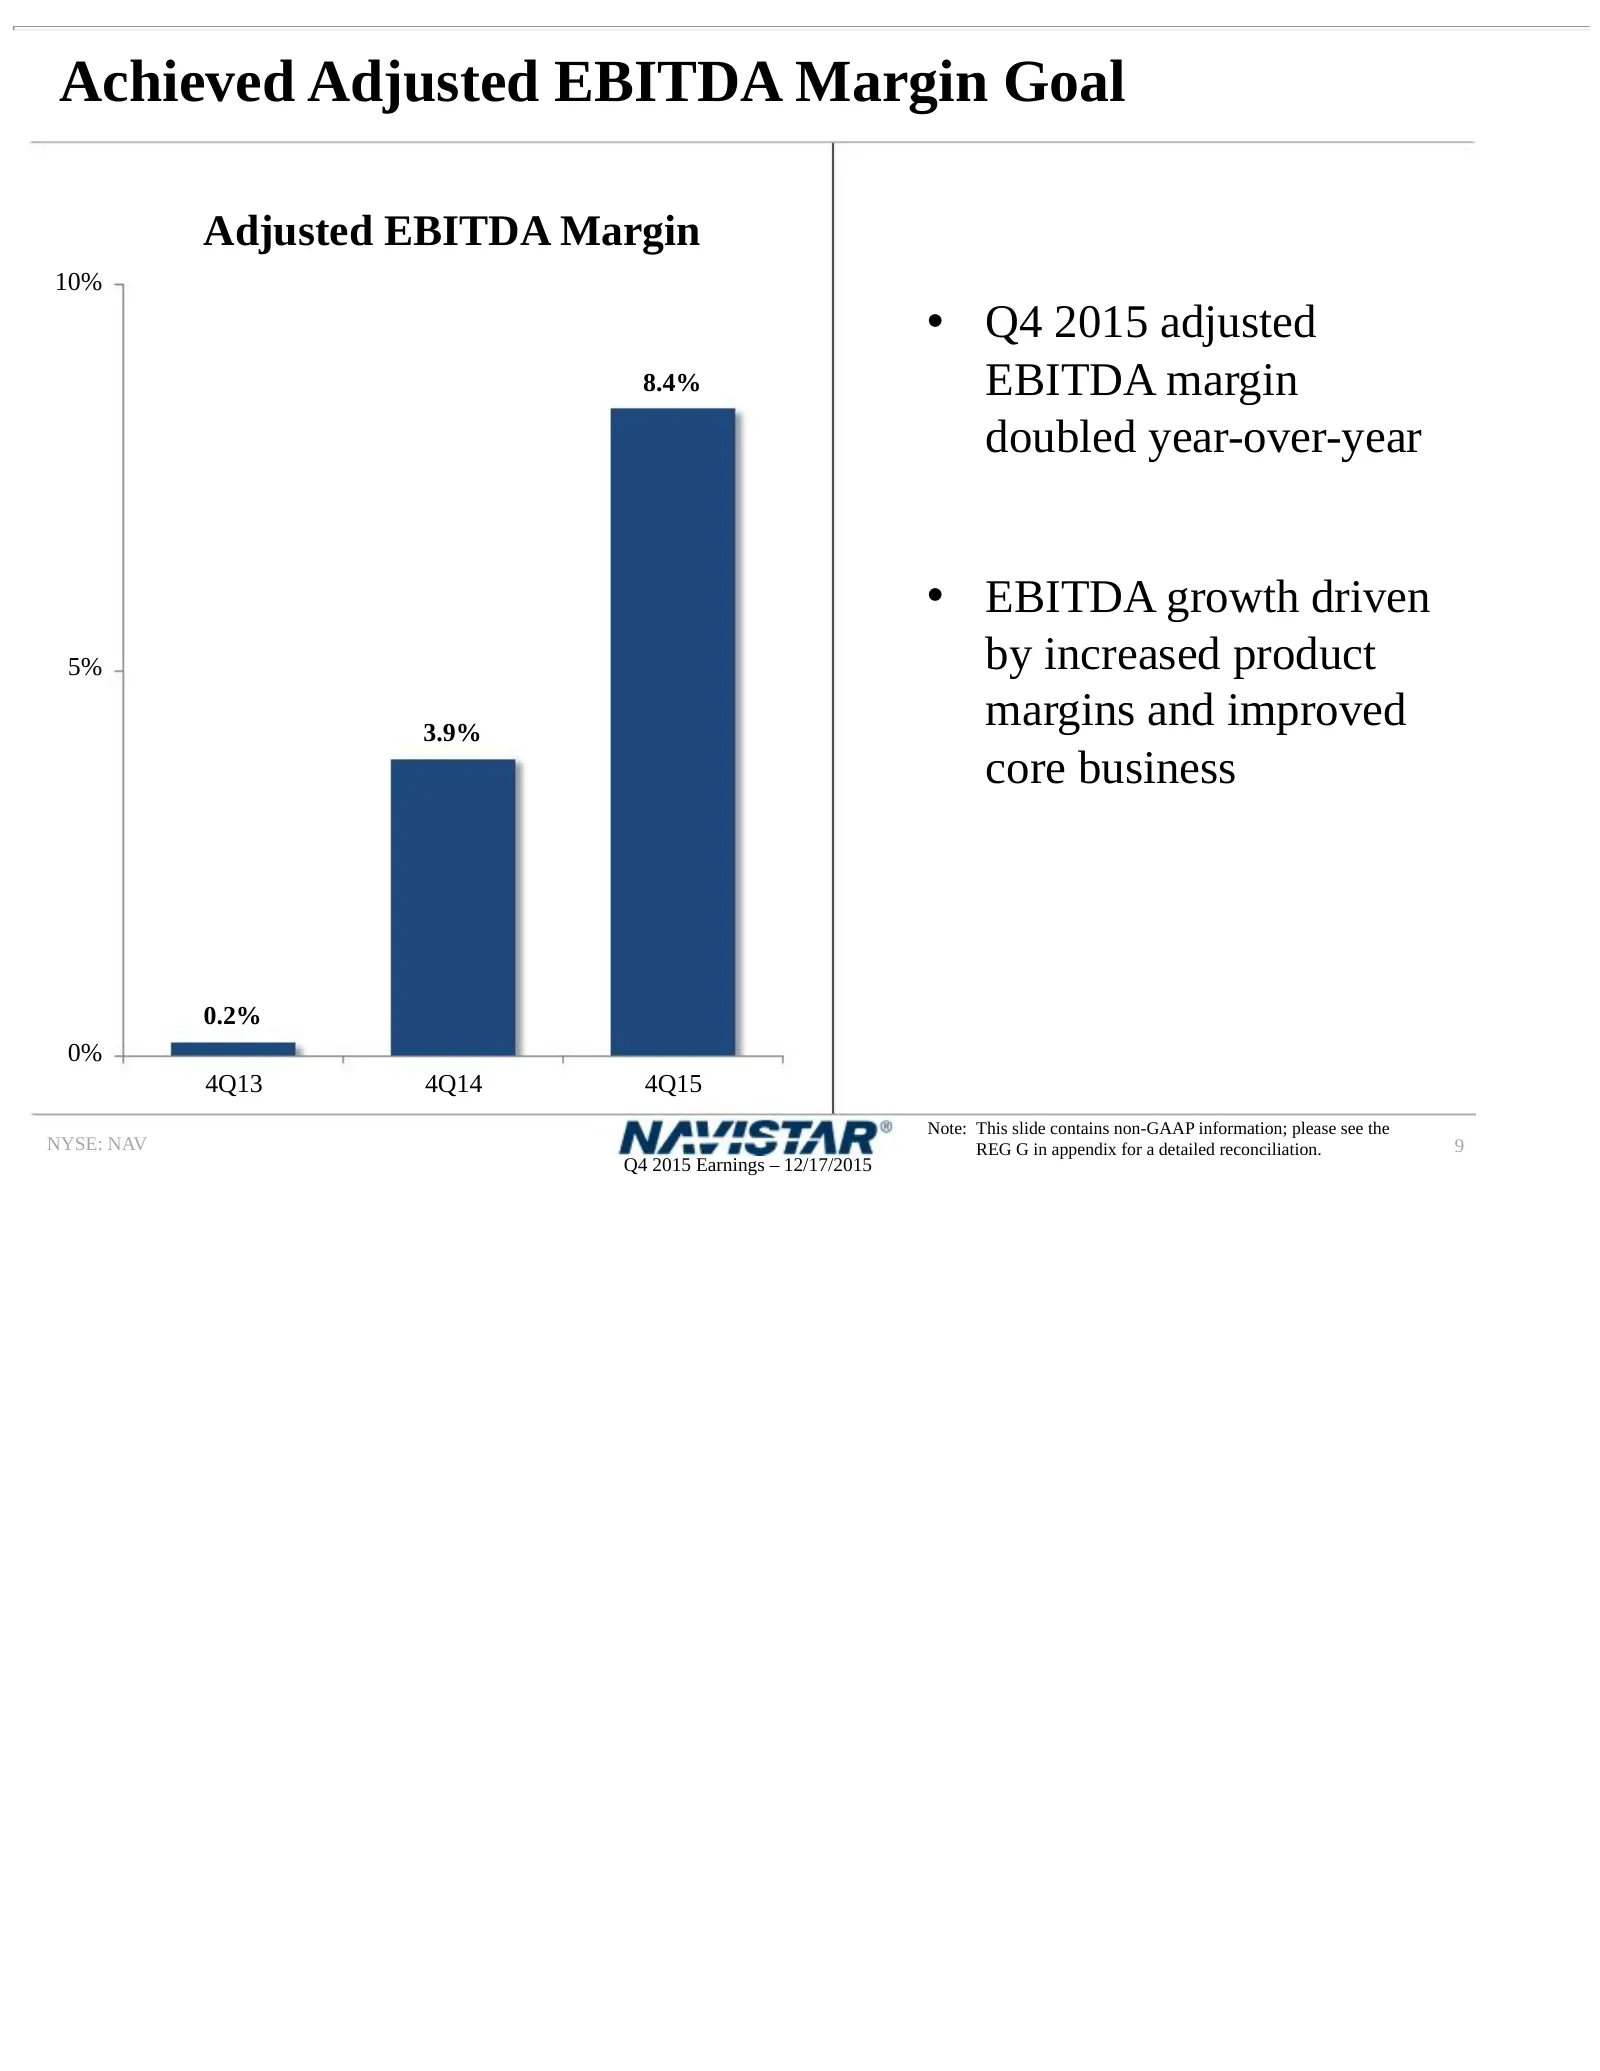
Achieved Adjusted EBITDA Margin Goal Adjusted EBITDA Margin 10% • Q4 2015 adjusted 8.4% EBITDA margin doubled year-over-year • EBITDA growth driven 5% by increased product 3.9% margins and improved core business 0.2% 0% 4Q13 4Q14 4Q15 Note: This slide contains non-GAAP information; please see the NY
Slide 10: Q4 2015 Segment Results
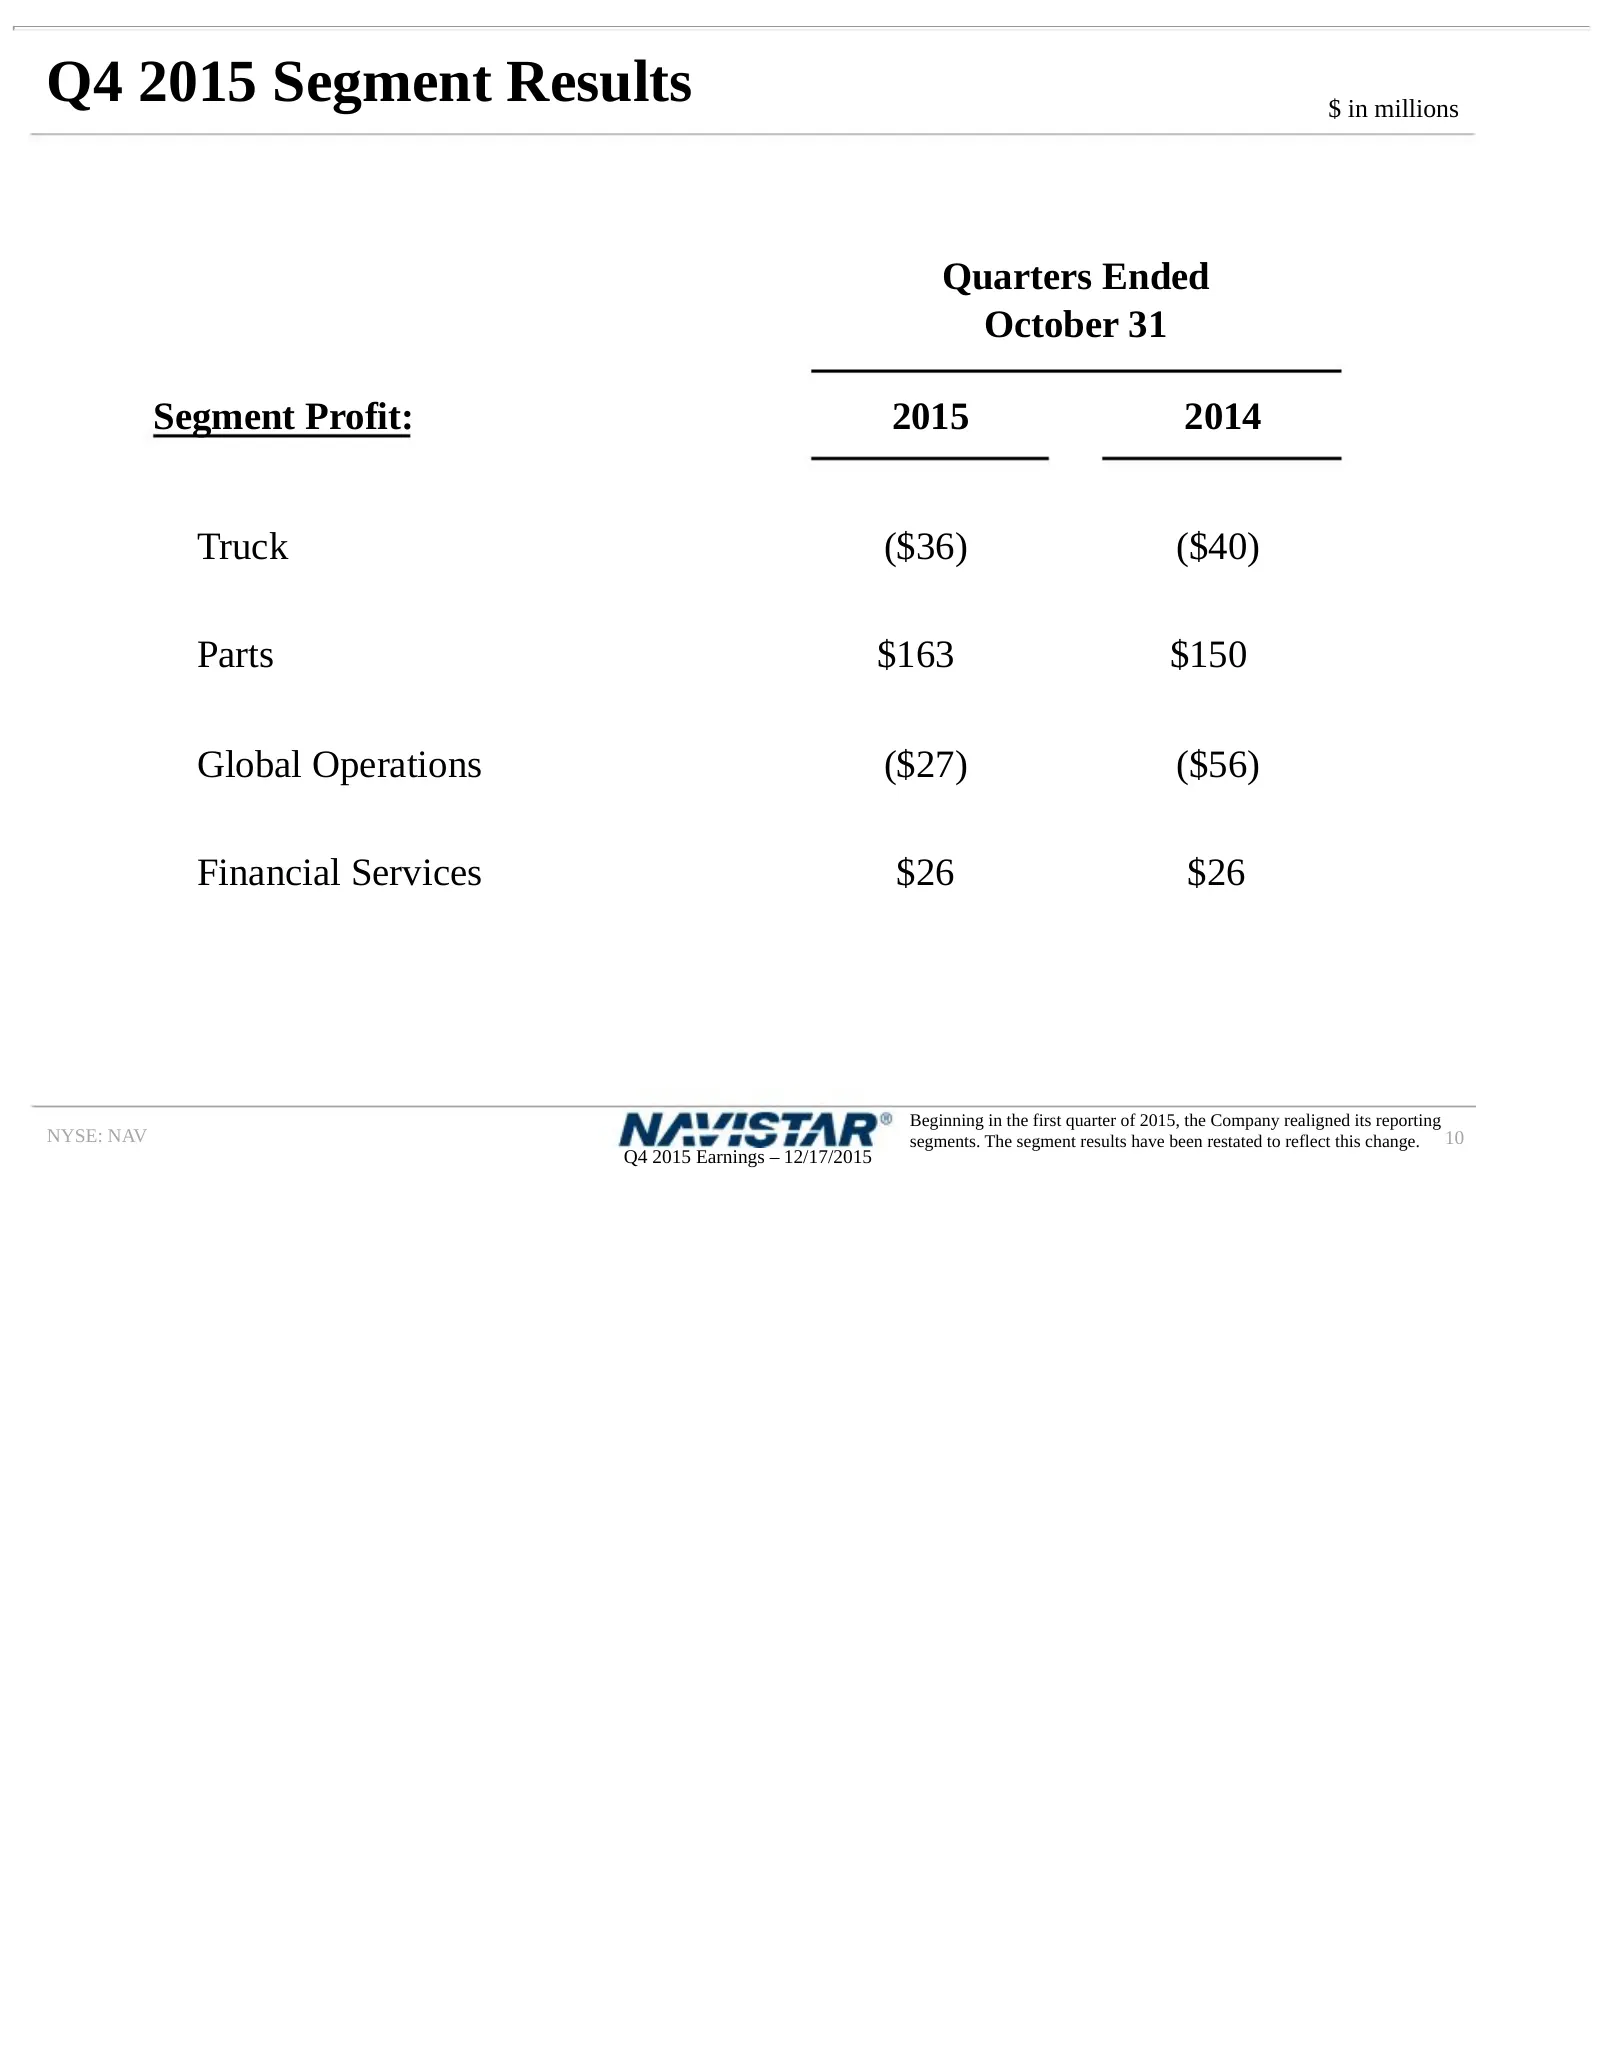
Q4 2015 Segment Results $ in millions Quarters Ended October 31 Segment Profit: 2015 2014 Truck ($36) ($40) Parts $163 $150 Global Operations ($27) ($56) Financial Services $26 $26 Beginning in the first quarter of 2015, the Company realigned its reporting NYSE: NAV segments. The segment results hav
Slide 11: Delivering on Cost Reduction Actions
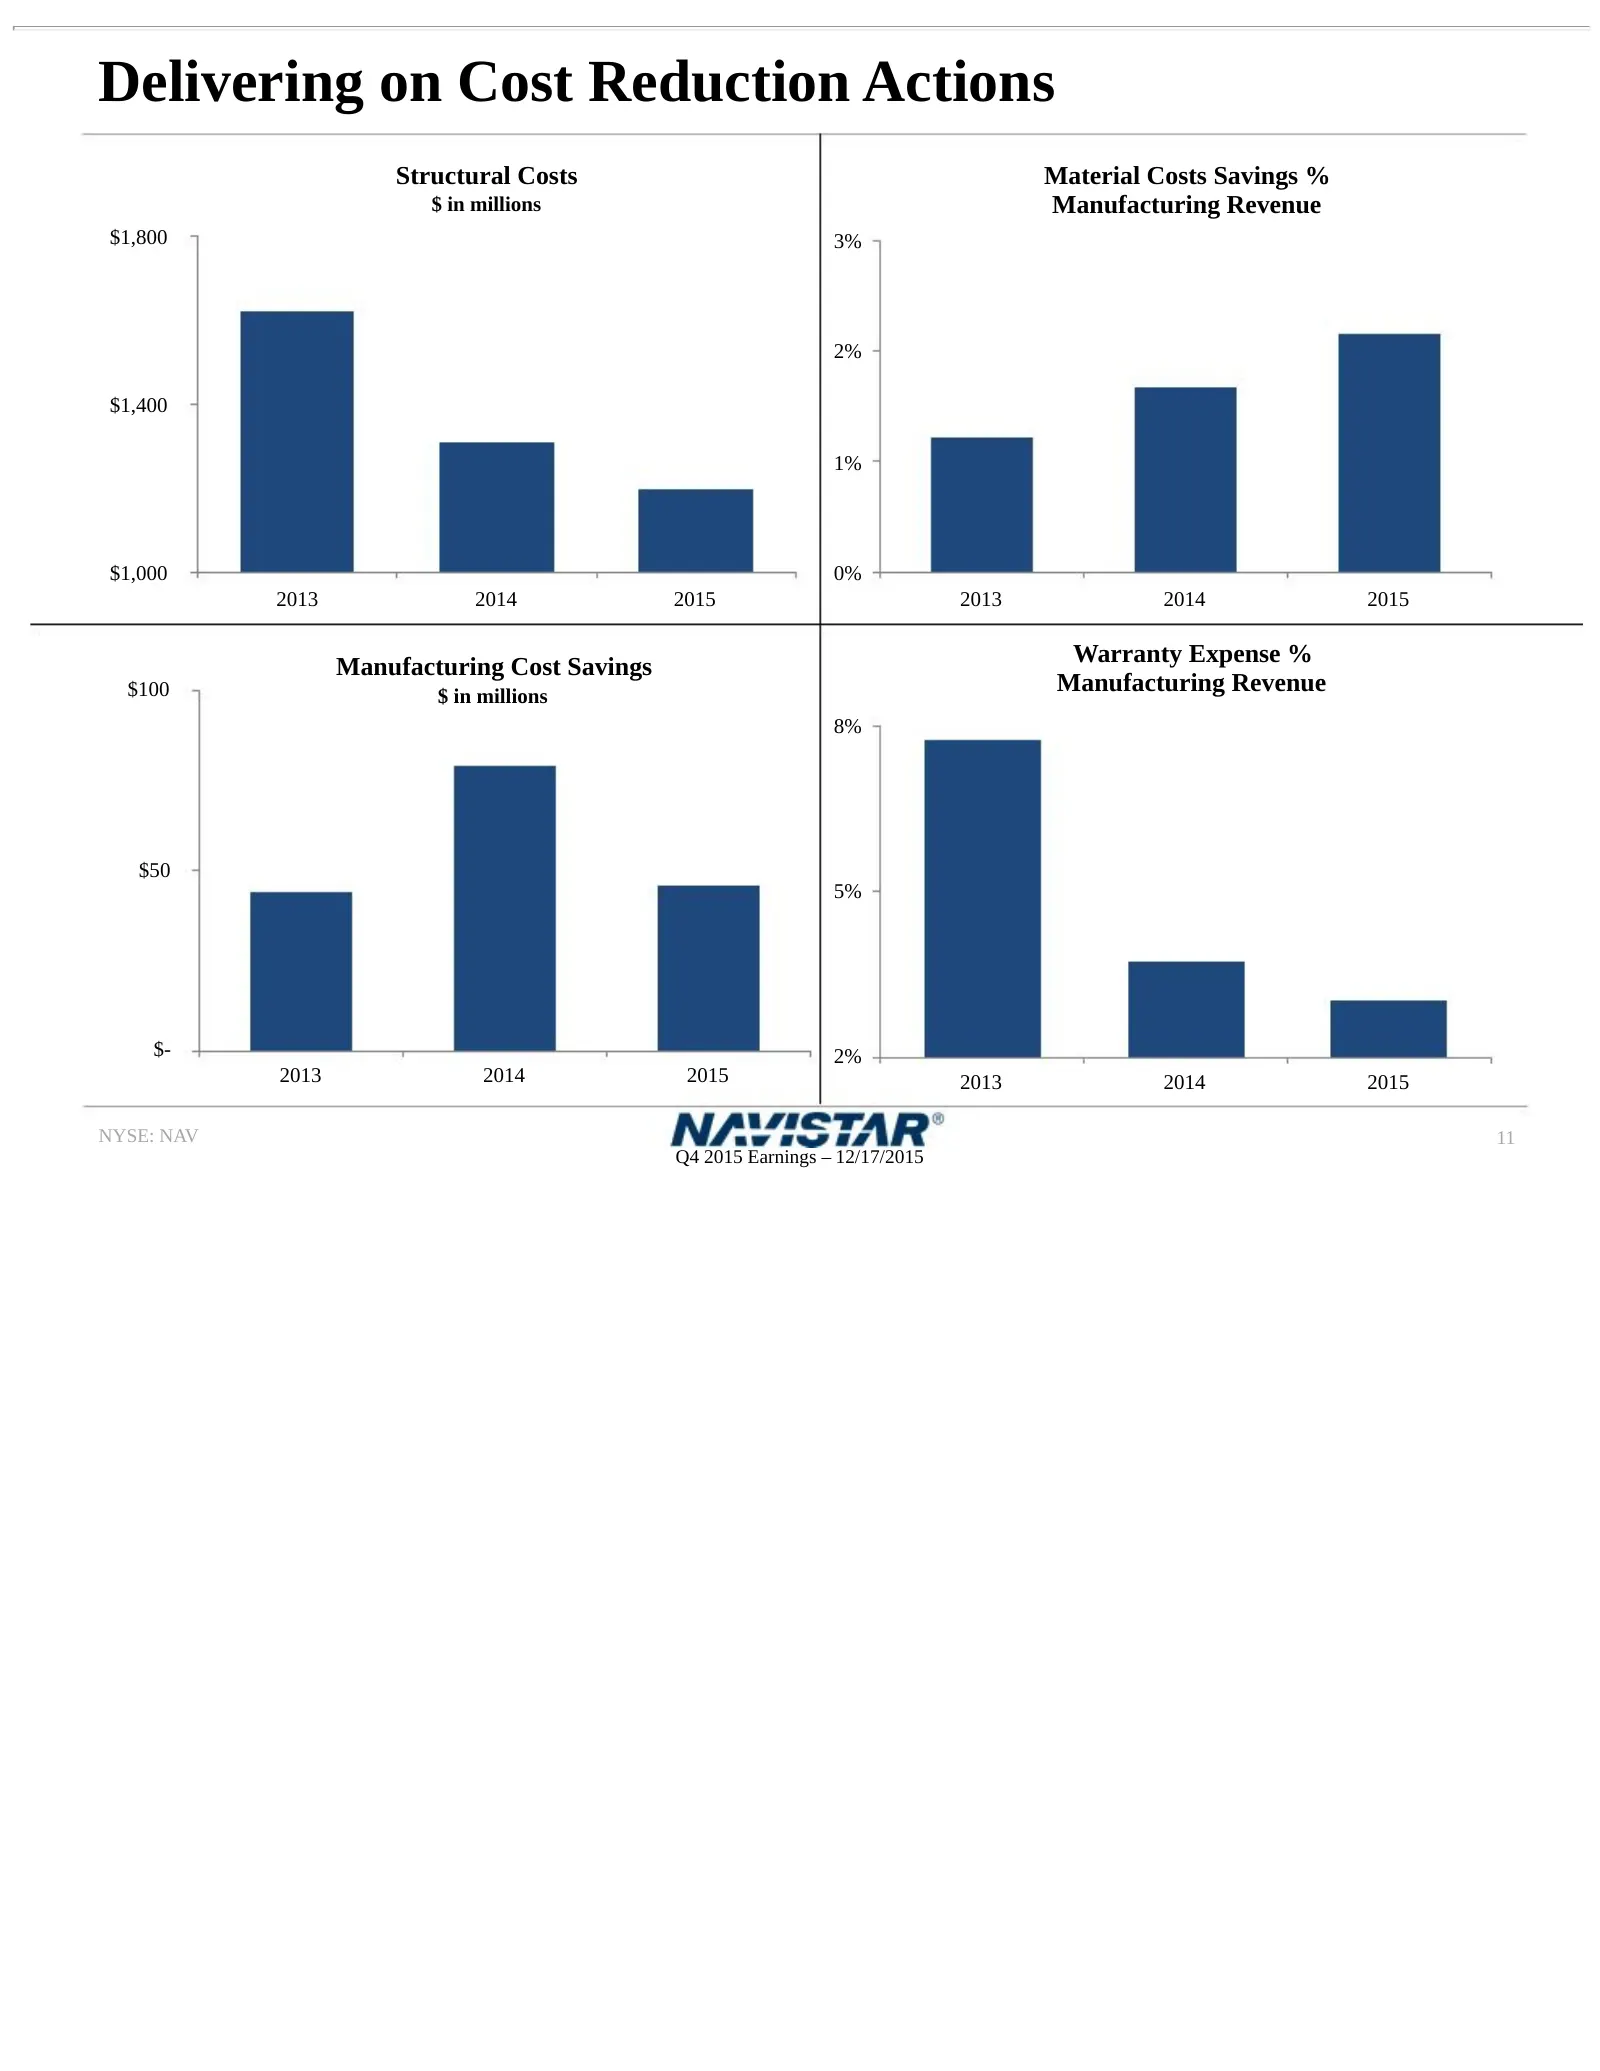
Delivering on Cost Reduction Actions Structural Costs Material Costs Savings % $ in millions Manufacturing Revenue $1,800 3% 2% $1,400 1% $1,000 0% 2013 2014 2015 2013 2014 2015 Warranty Expense % Manufacturing Cost Savings $100 $ in millions Manufacturing Revenue 8% $50 5% $- 2% 2013 2014 2015 2013
Slide 12: Used Truck Update
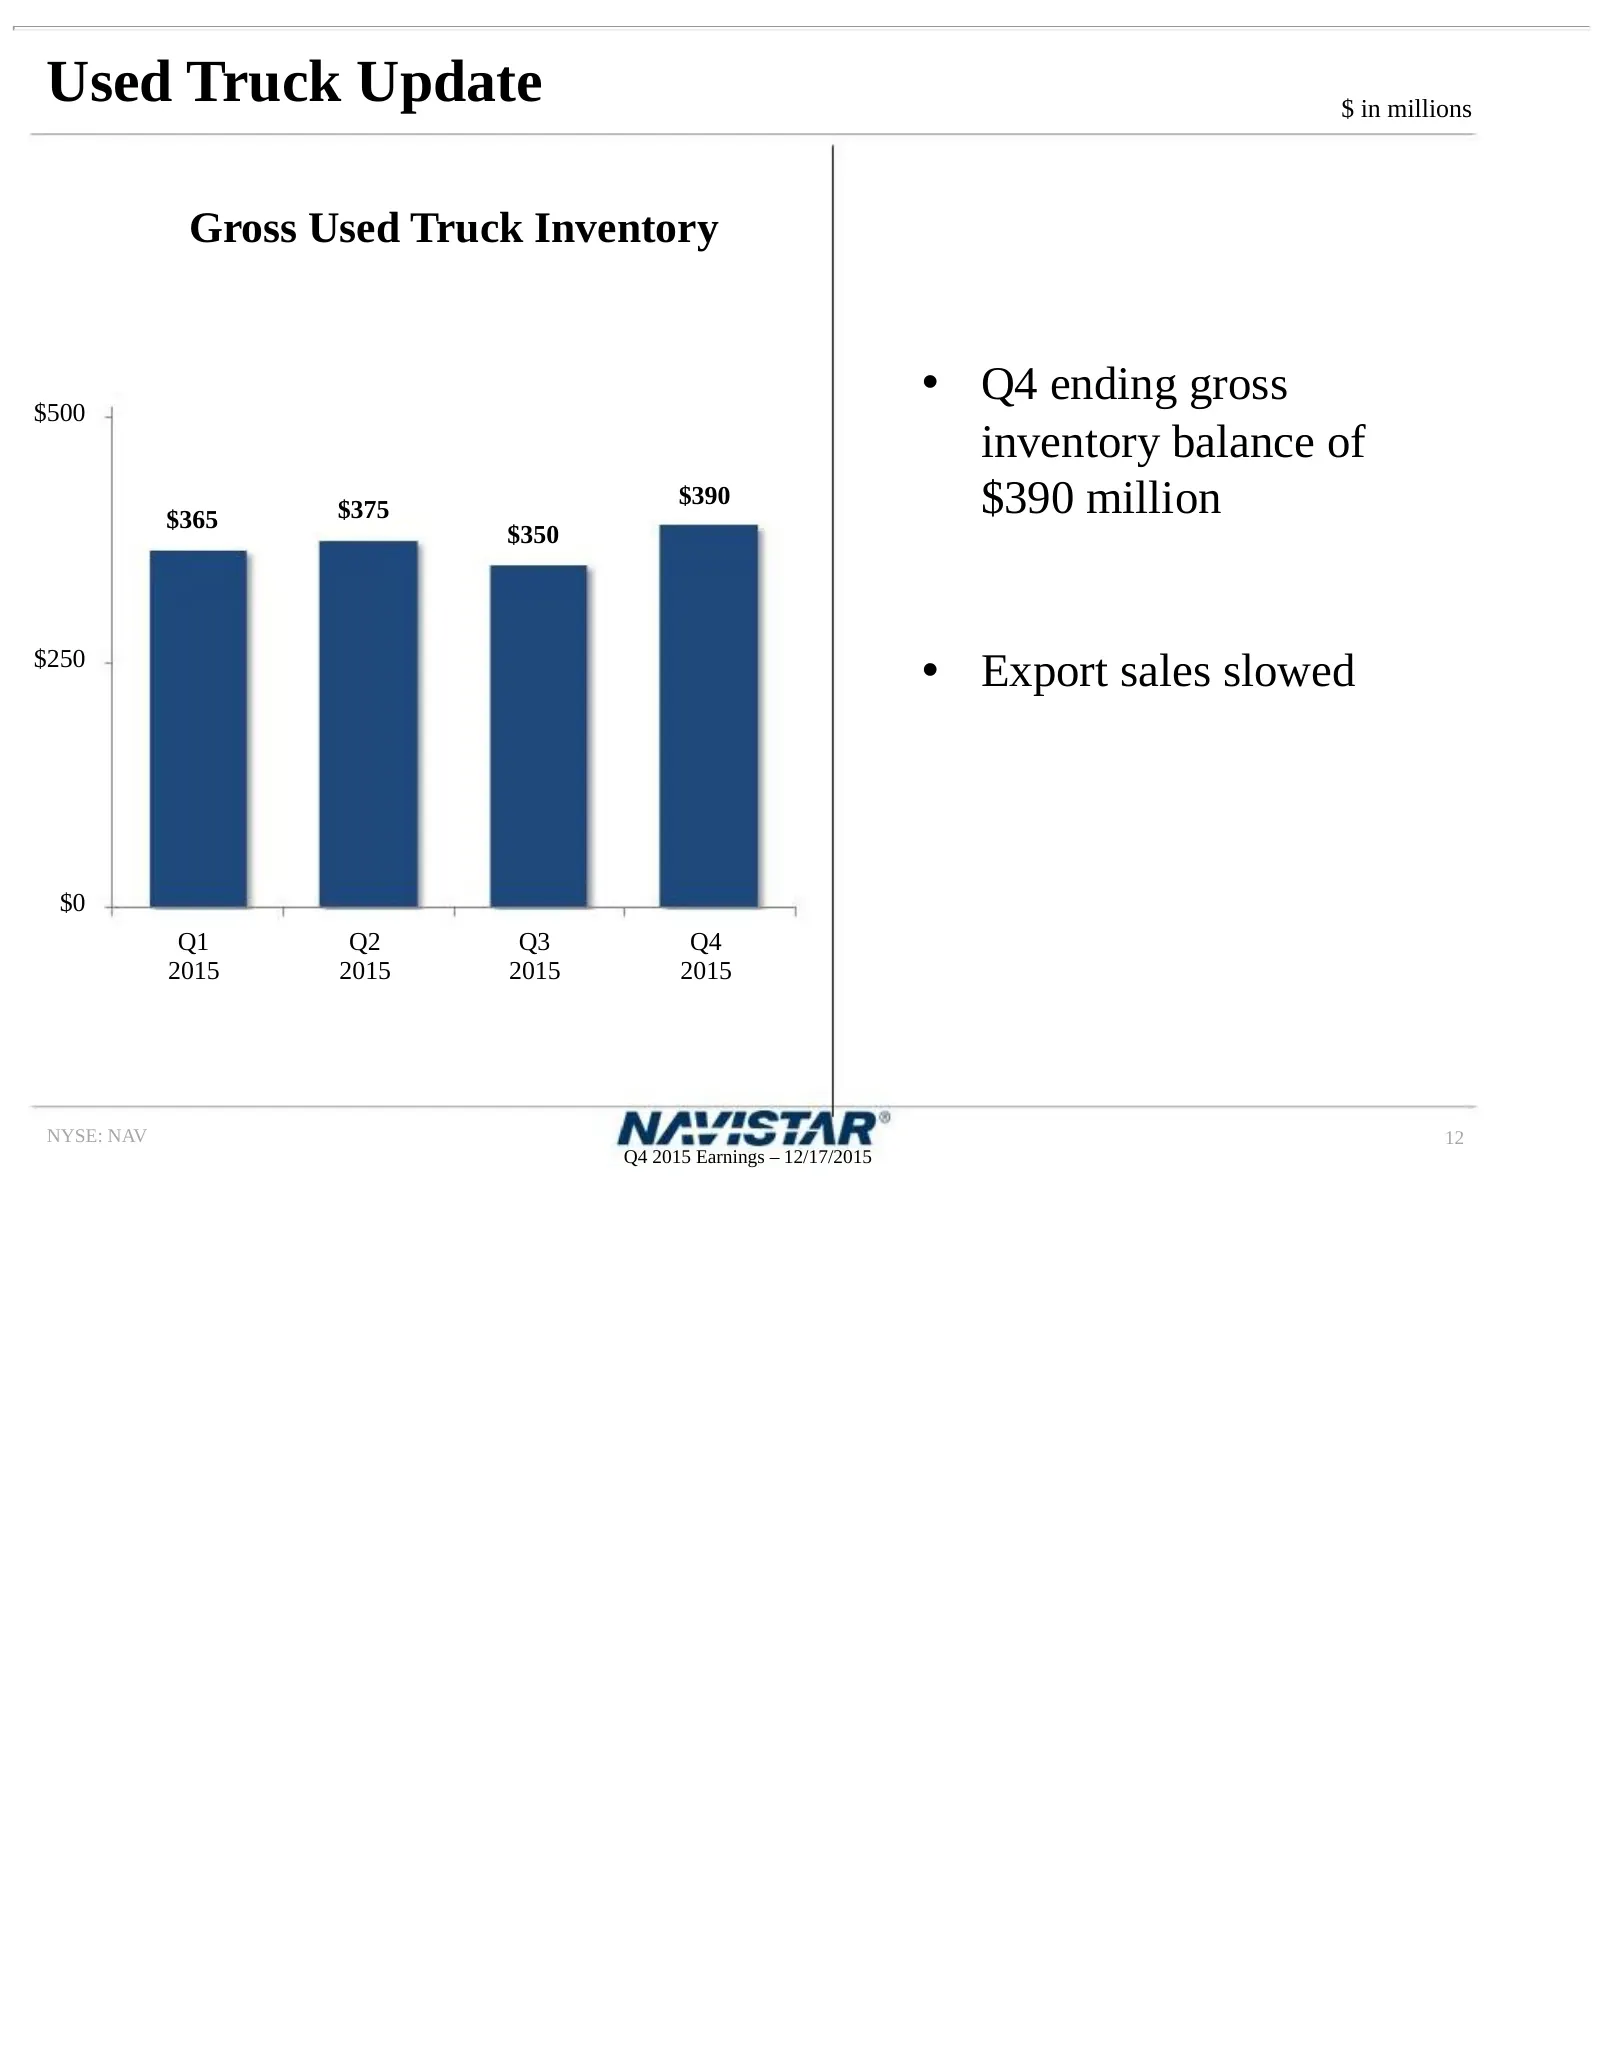
Used Truck Update $ in millions Gross Used Truck Inventory • Q4 ending gross $500 inventory balance of $365 $375 $390 $390 million $350 $250 • Export sales slowed $0 Q1 Q2 Q3 Q4 2015 2015 2015 2015 NYSE: NAV 12 Q4 2015 Earnings – 12/17/2015
Slide 13: Q4 2015 Manufacturing Cash Within Guidance
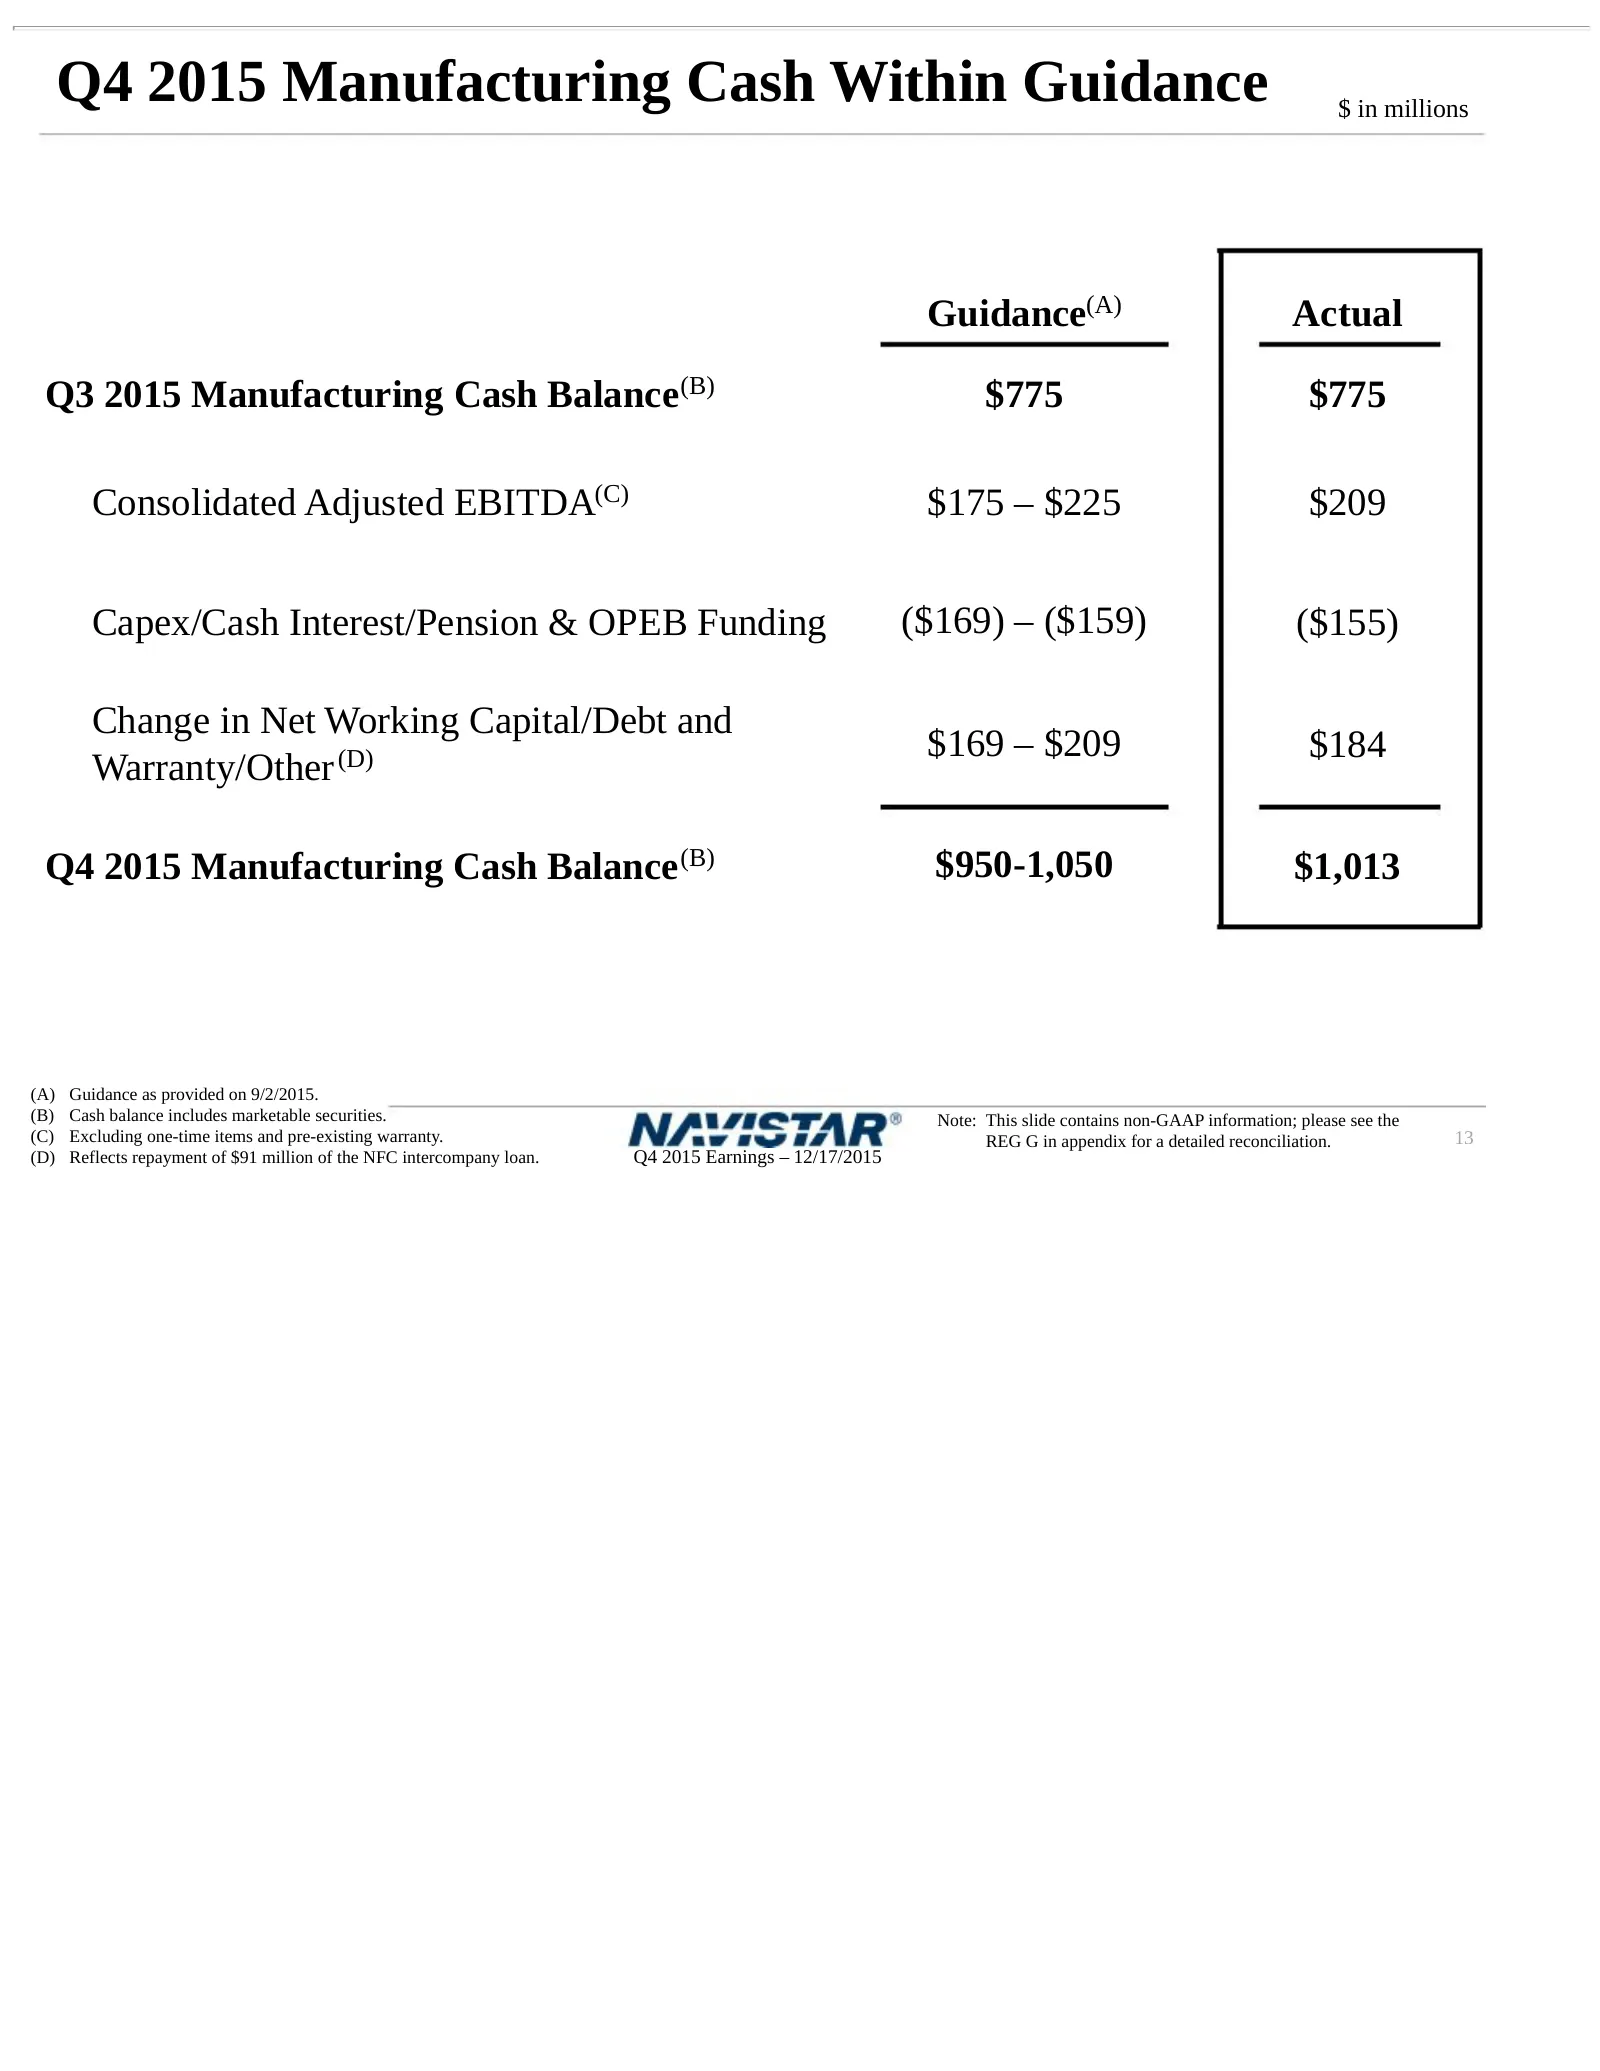
Q4 2015 Manufacturing Cash Within Guidance $ in millions Guidance(A) Actual Q3 2015 Manufacturing Cash Balance(B) $775 $775 Consolidated Adjusted EBITDA(C) $175 – $225 $209 Capex/Cash Interest/Pension & OPEB Funding ($169) – ($159) ($155) Change in Net Working Capital/Debt and $169 – $209 $184 Warra
Slide 14: Stable Revenue Despite Declining Class 8 Industry
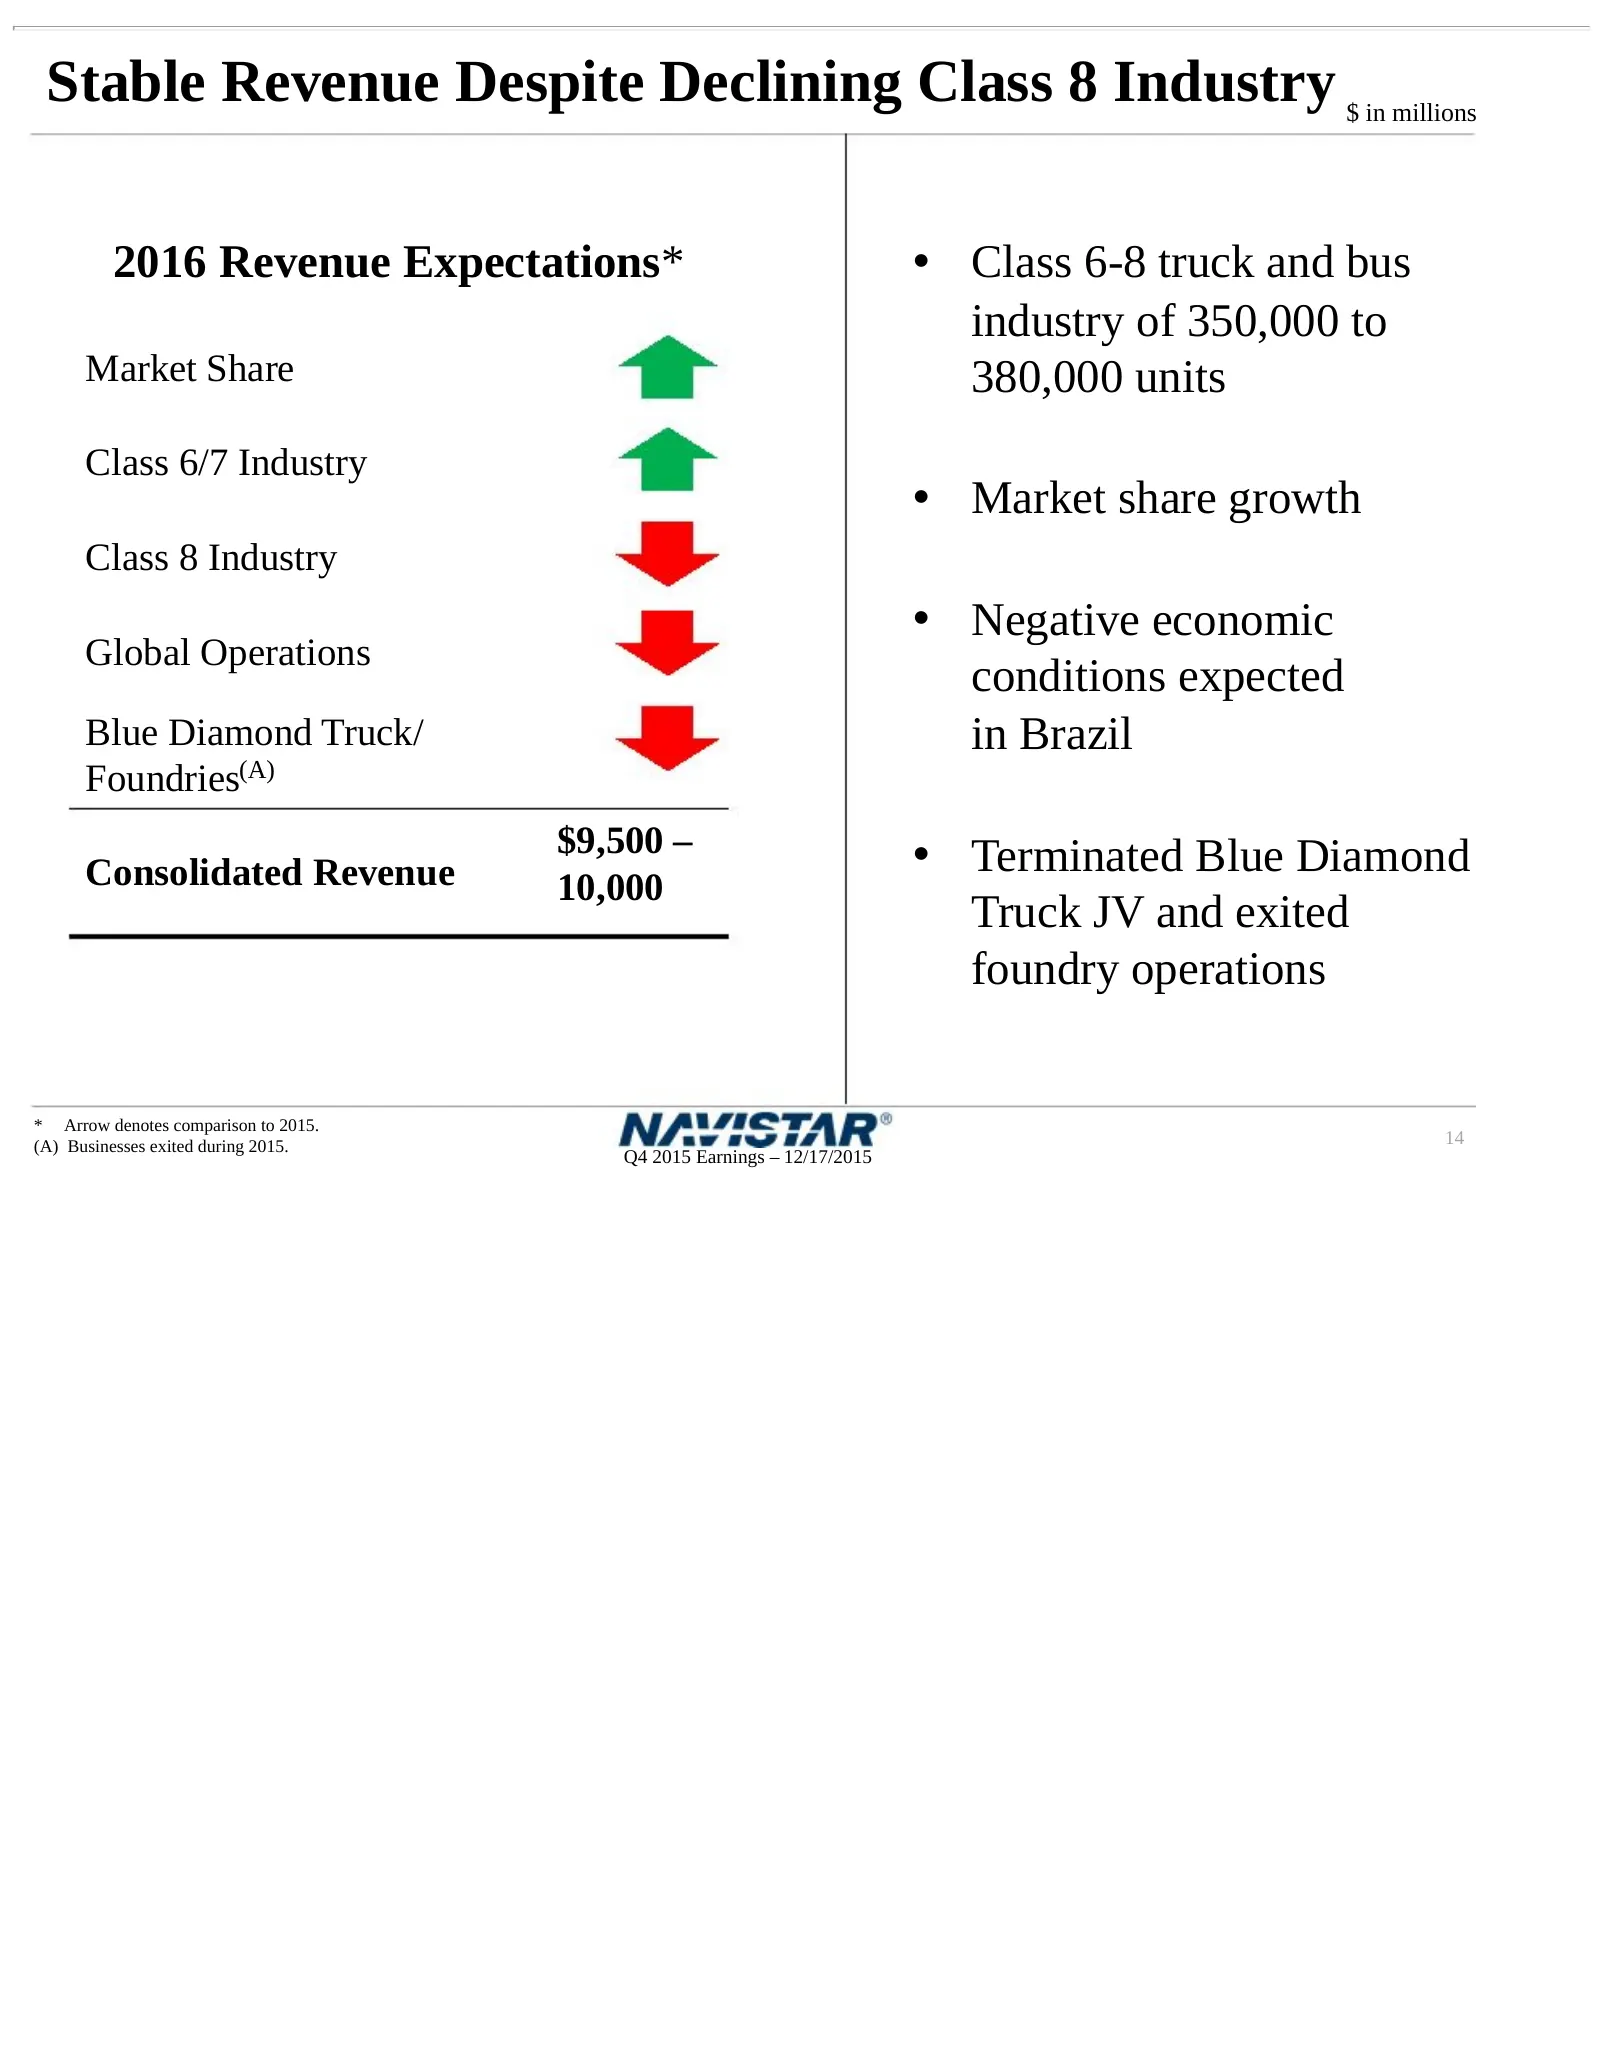
Stable Revenue Despite Declining Class 8 Industry $ in millions 2016 Revenue Expectations* • Class 6-8 truck and bus industry of 350,000 to Market Share 380,000 units Class 6/7 Industry • Market share growth Class 8 Industry • Negative economic Global Operations conditions expected Blue Diamond Truc
Slide 15: Expect Additional Cost Savings in 2016
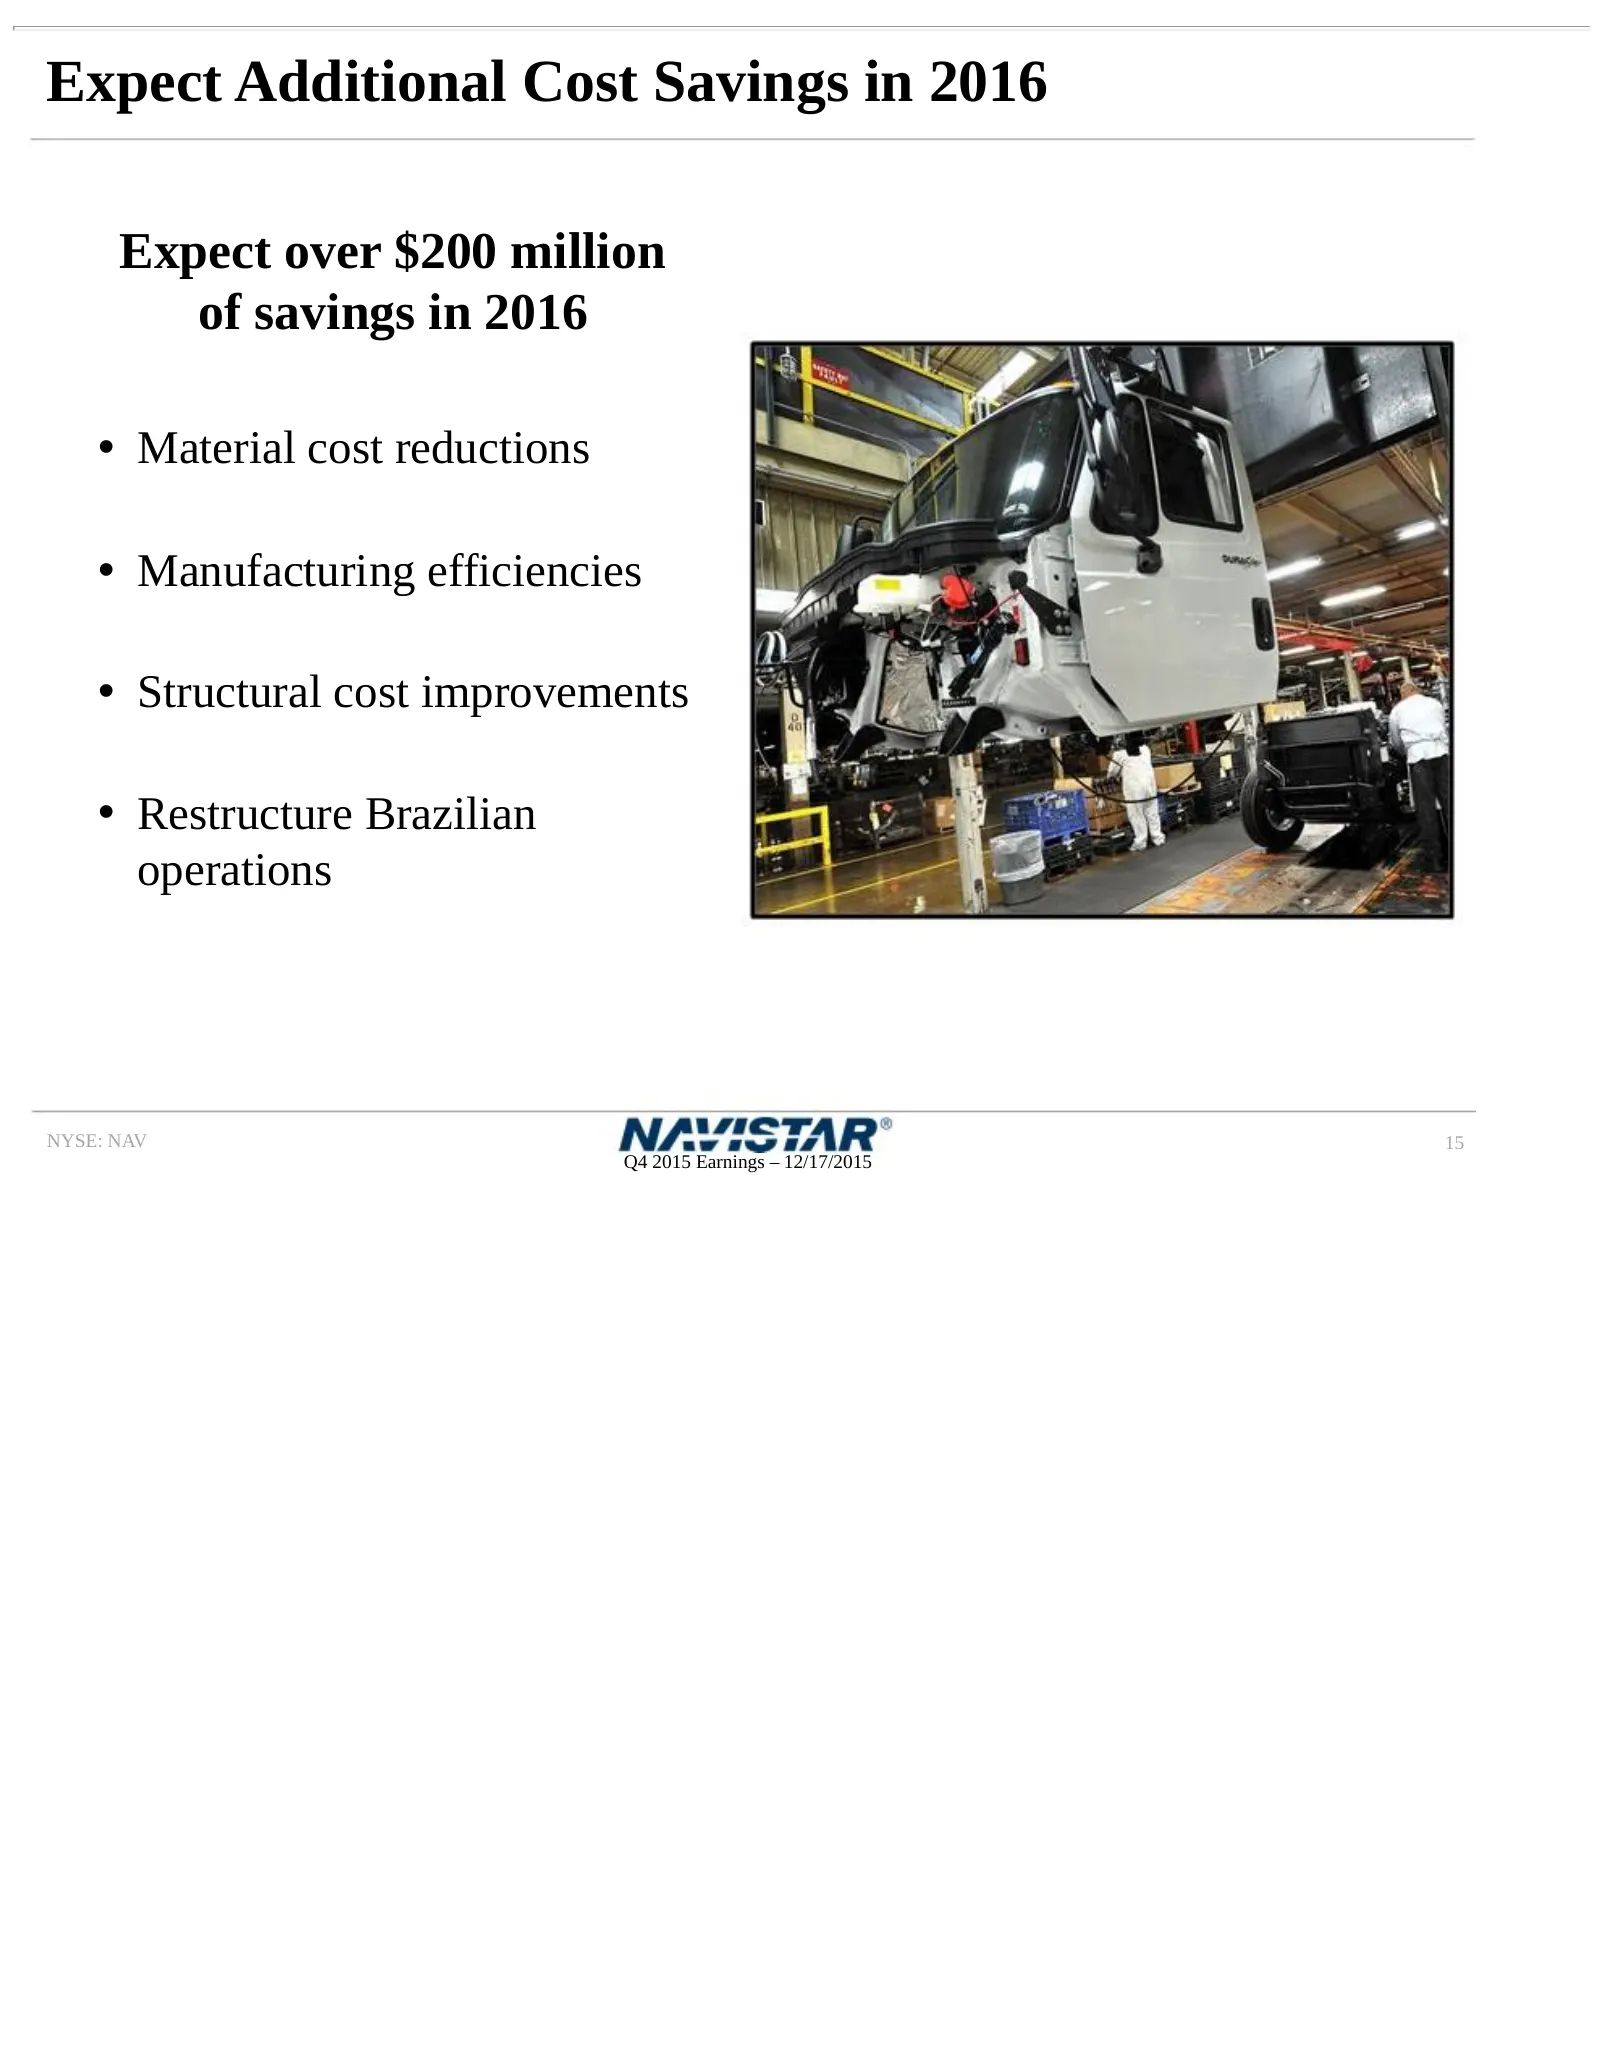
Expect Additional Cost Savings in 2016 Expect over $200 million of savings in 2016 • Material cost reductions • Manufacturing efficiencies • Structural cost improvements • Restructure Brazilian operations NYSE: NAV 15 Q4 2015 Earnings – 12/17/2015
Slide 16: Expect EBITDA Growth in 2016
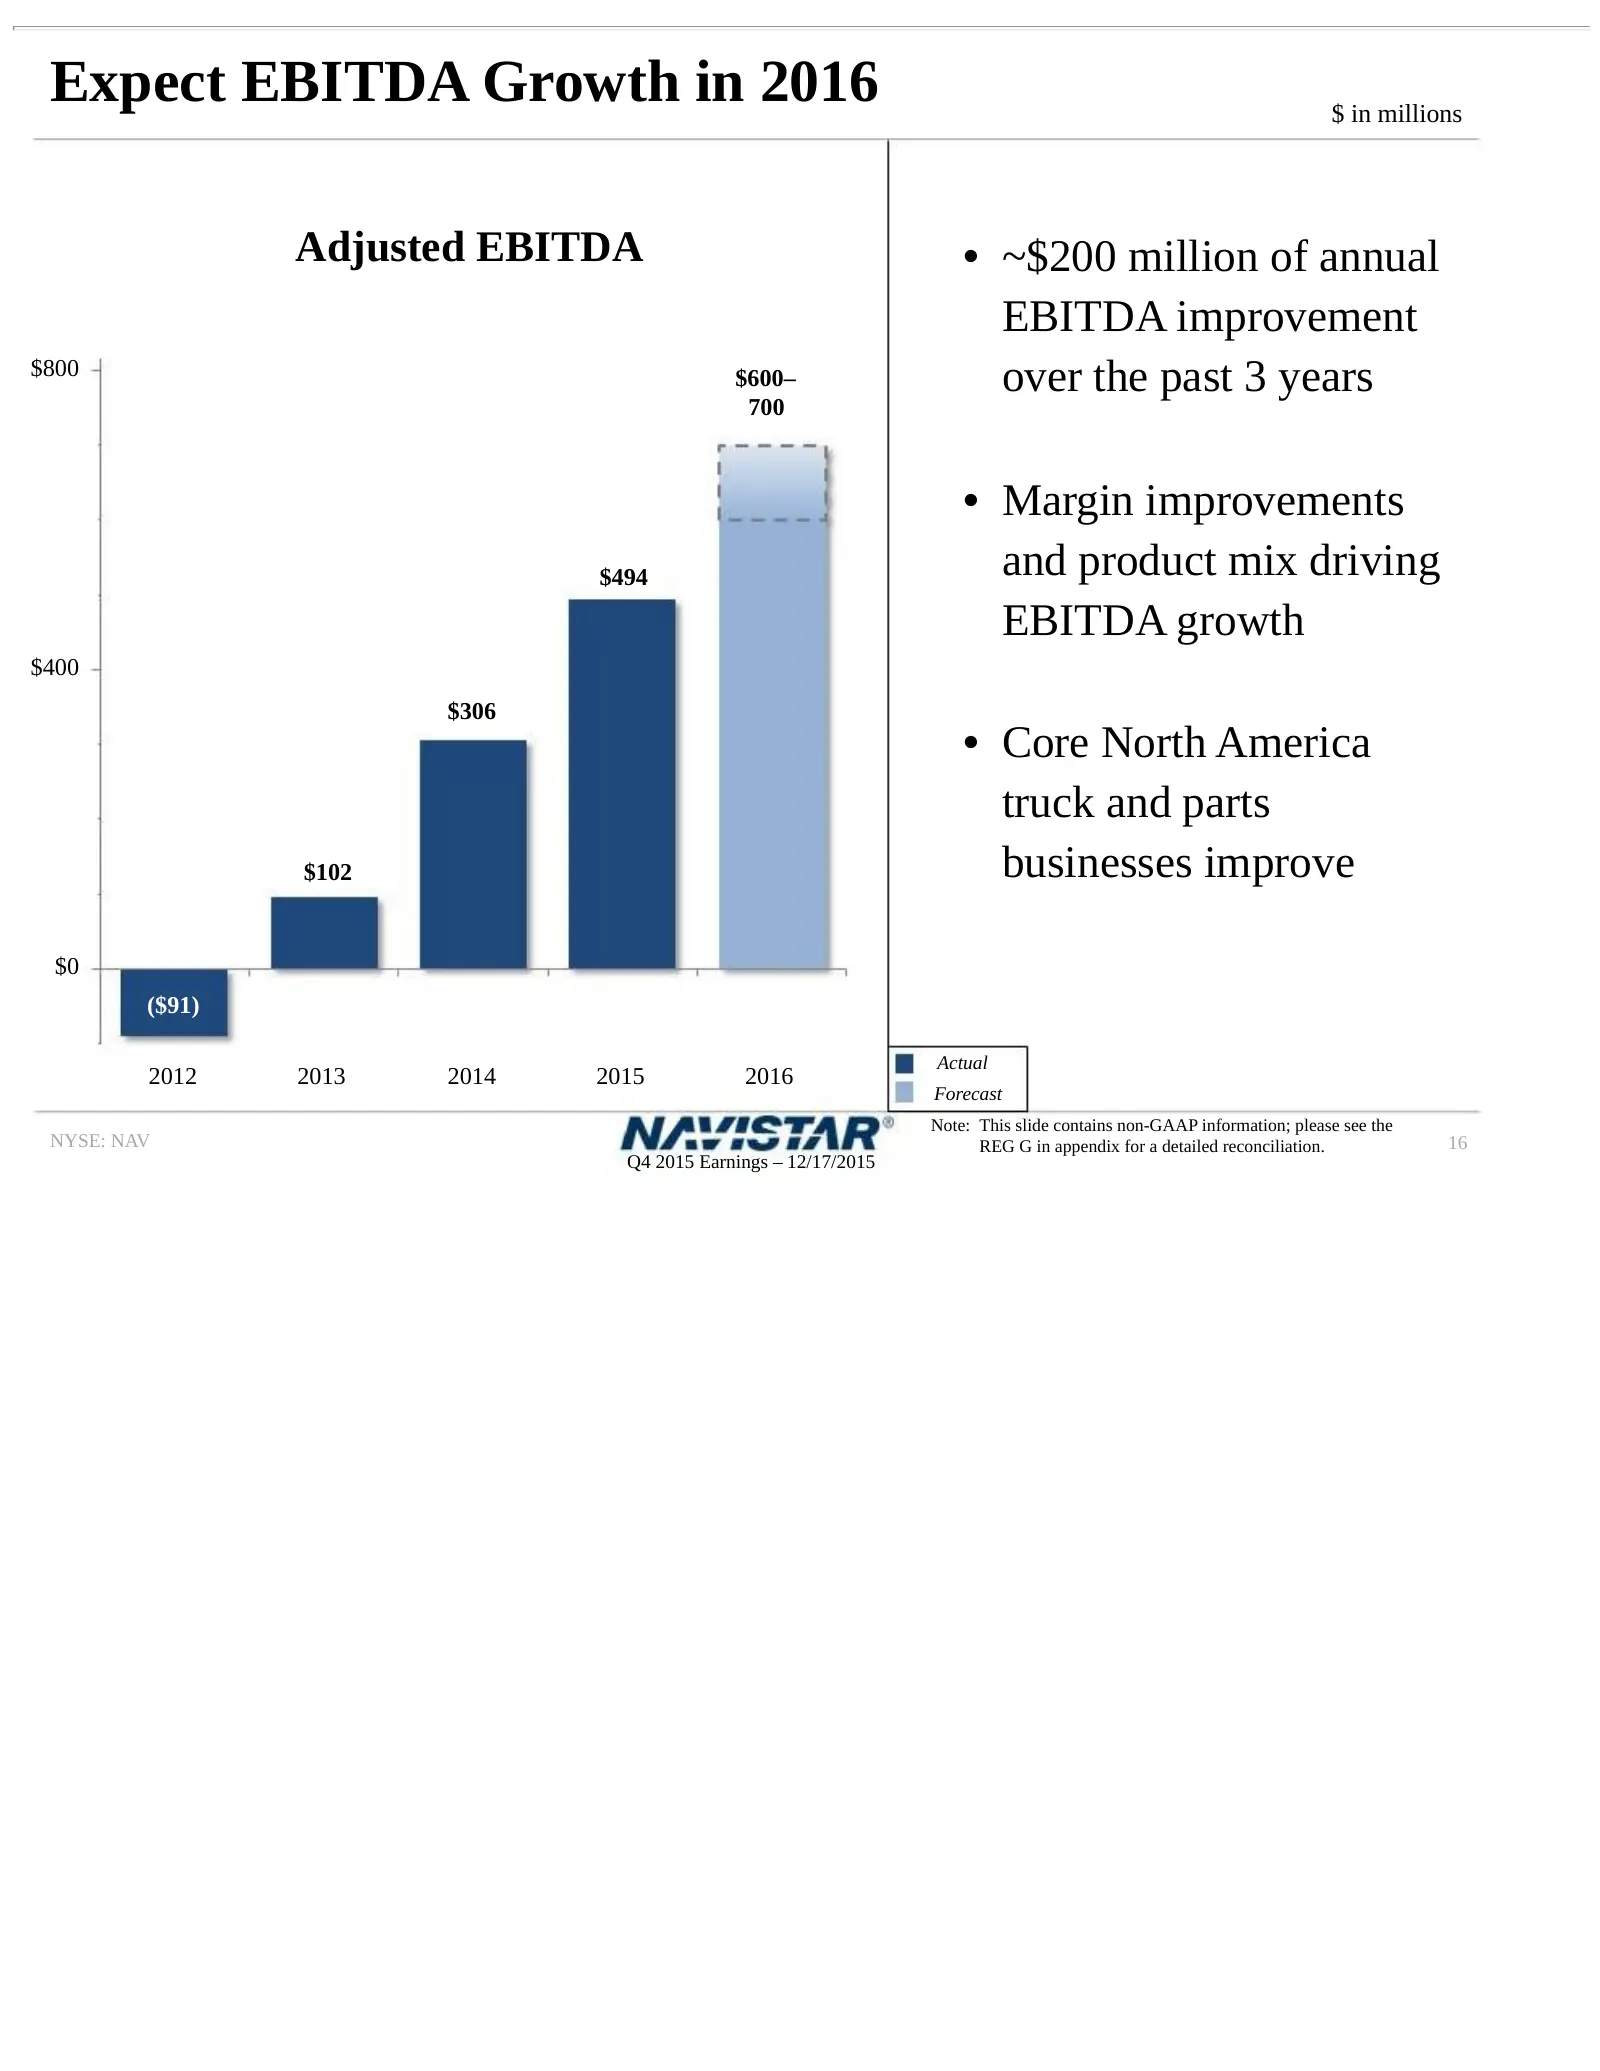
Expect EBITDA Growth in 2016 $ in millions Adjusted EBITDA • ~$200 million of annual EBITDA improvement $800 $600– over the past 3 years 700 • Margin improvements $494 and product mix driving EBITDA growth $400 $306 • Core North America truck and parts $102 businesses improve $0 ($91) Actual 2012 20
Slide 17: Expect Positive Manufacturing Free Cash Flow in 2016
Expect Positive Manufacturing Free Cash Flow in 2016 • Pension cash contributions greater than expense by ~$50 million • Capital expenditures of ~$125 million • Manufacturing interest expense of ~$240 million • Cash taxes of ~$35 million • Warranty spend greater than expense by ~$150 million • Used
Slide 18: Summary
Summary 2015 Accomplishments: • Achieved ~$200 million of annual EBITDA improvement • Increased core North America truck and parts sales • Delivered over $300 million of cost savings • Ended the year with over $1 billion of manufacturing cash 2016: • EBITDA improvement • Positive free cash flow NYSE
Slide 19: Summary
SUMMARY Troy Clarke, President & CEO NYSE: NAV
Slide 20: Building on Our Progress
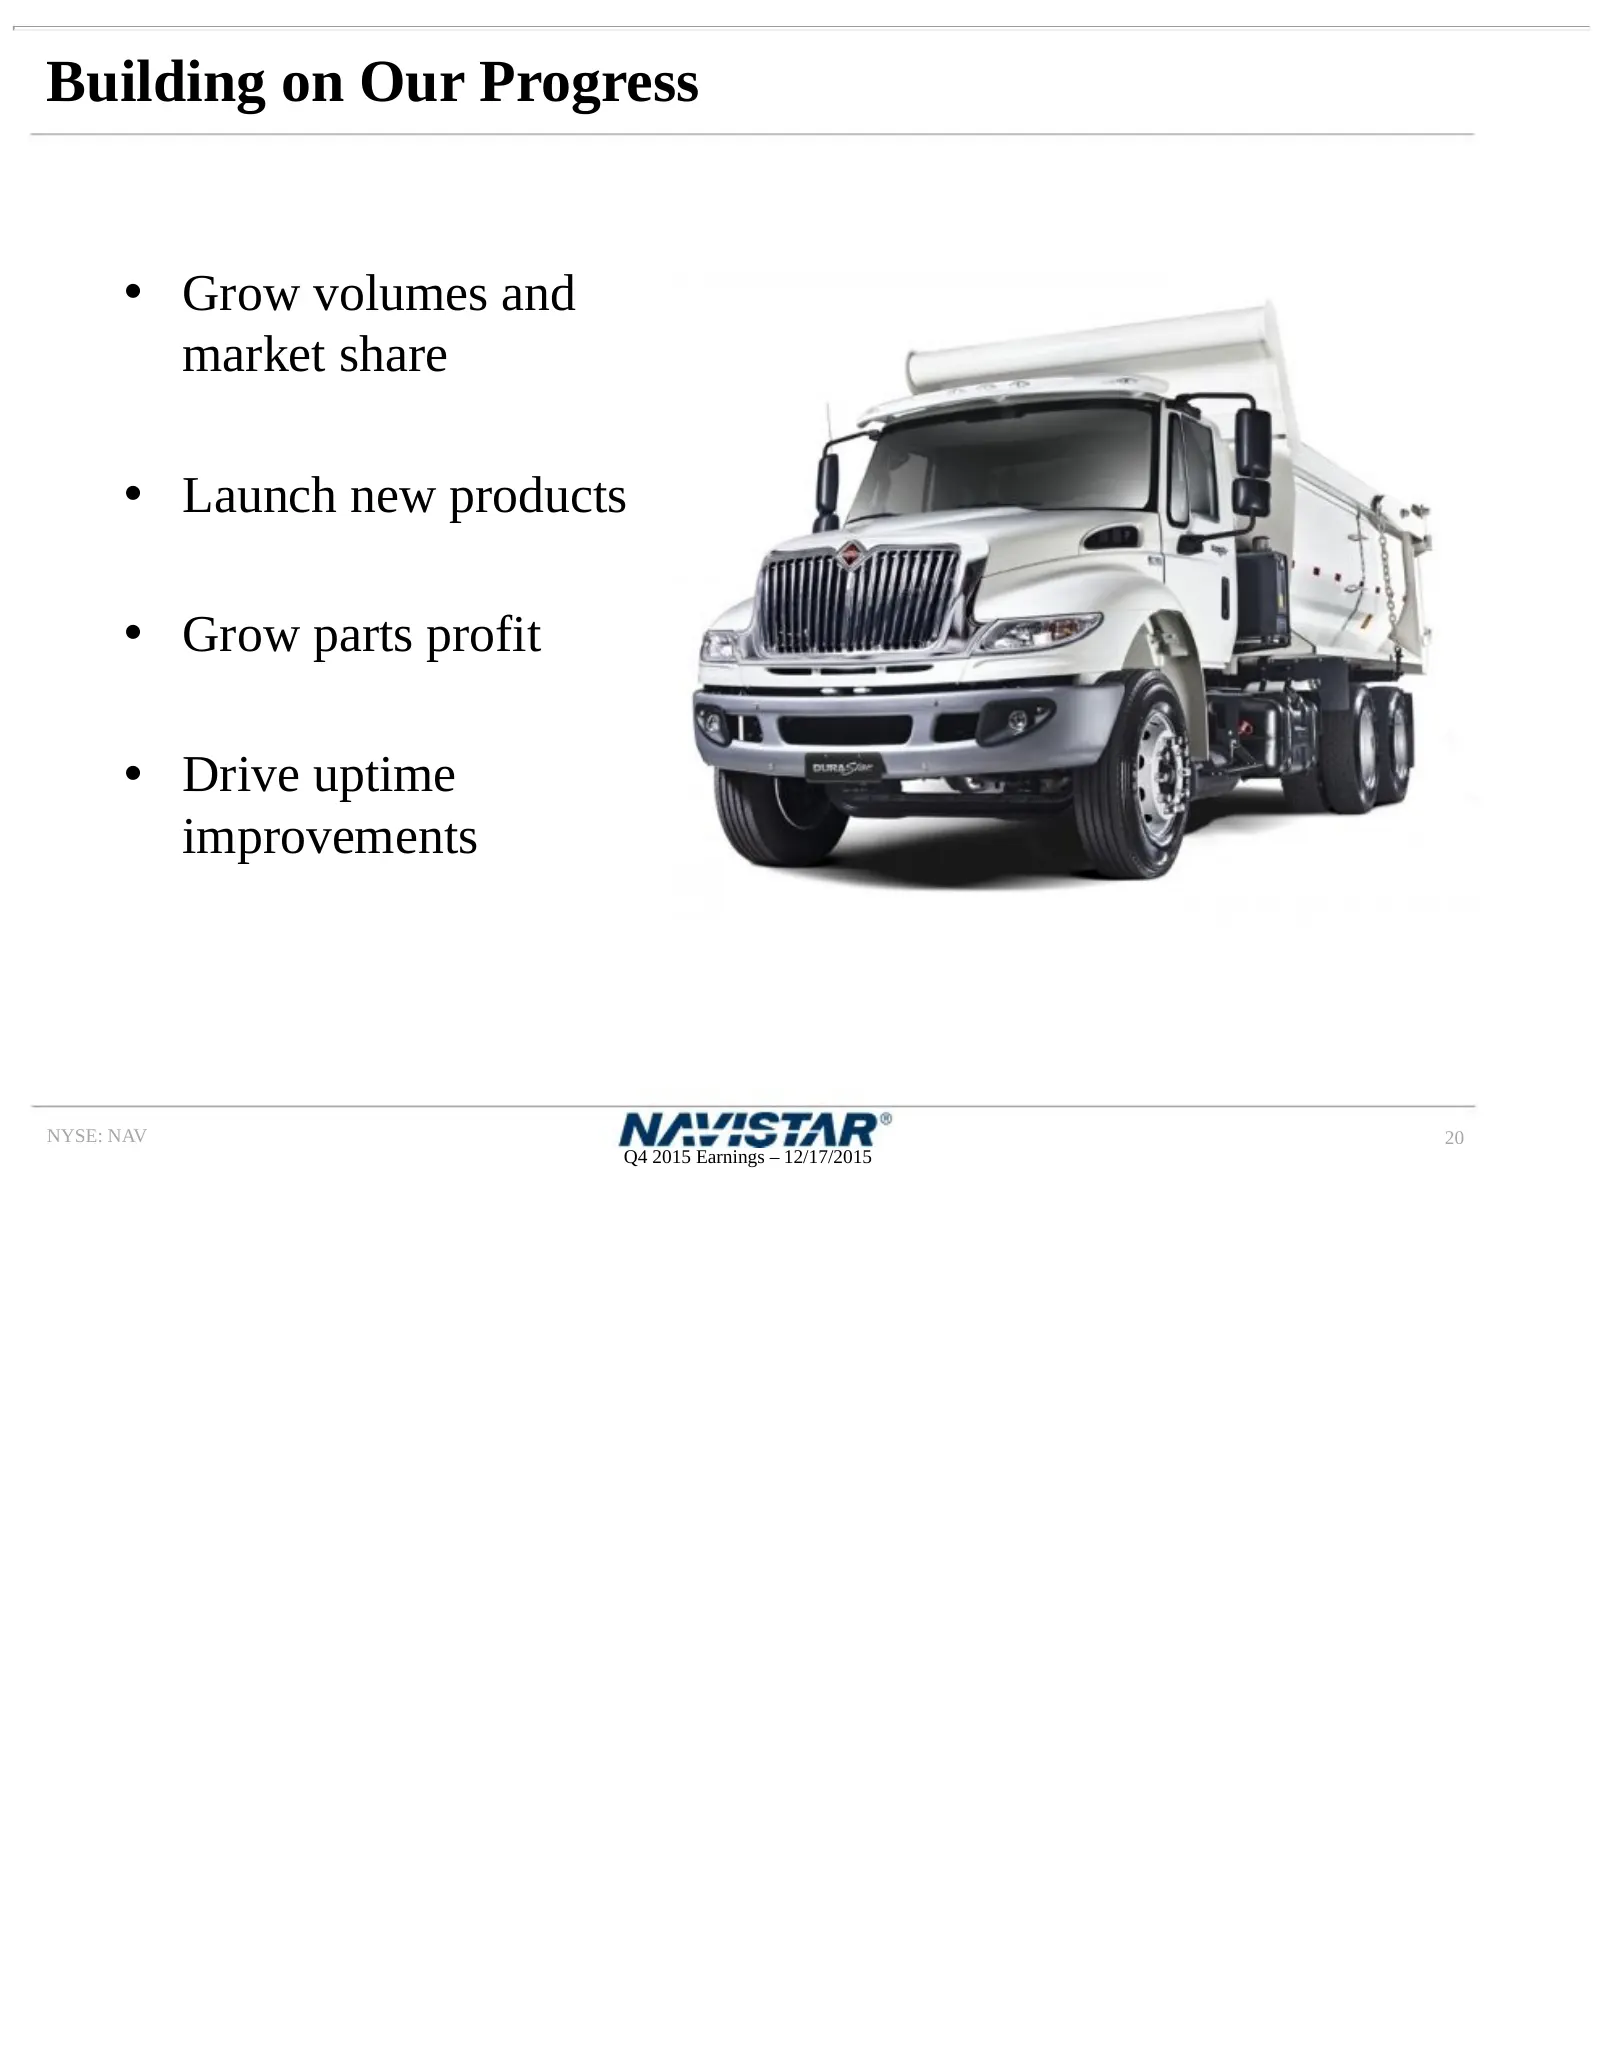
Building on Our Progress • Grow volumes and market share • Launch new products • Grow parts profit • Drive uptime improvements NYSE: NAV 20 Q4 2015 Earnings – 12/17/2015
Slide 21: 2016 Expectations
2016 Expectations • Continue to reduce costs • Invest in key growth areas • Return to profitability • Generate positive free cash flow NYSE: NAV 21 Q4 2015 Earnings – 12/17/2015
Slide 22: Appendix
APPENDIX NAVISTAR®
Slide 23: Navistar Financial Corporation
Navistar Financial Corporation Highlights • Financial Services Segment profit of $98 million for 2015, $26 million for Q4 • U.S. financing availability of $323 million as of October 31, 2015 • Financial Services Debt/Equity Leverage of 3.3:1 • BMO Financial Group completed the purchase of GE Capital
Slide 24: Retail Market Share in Commercial Vehicle Segments
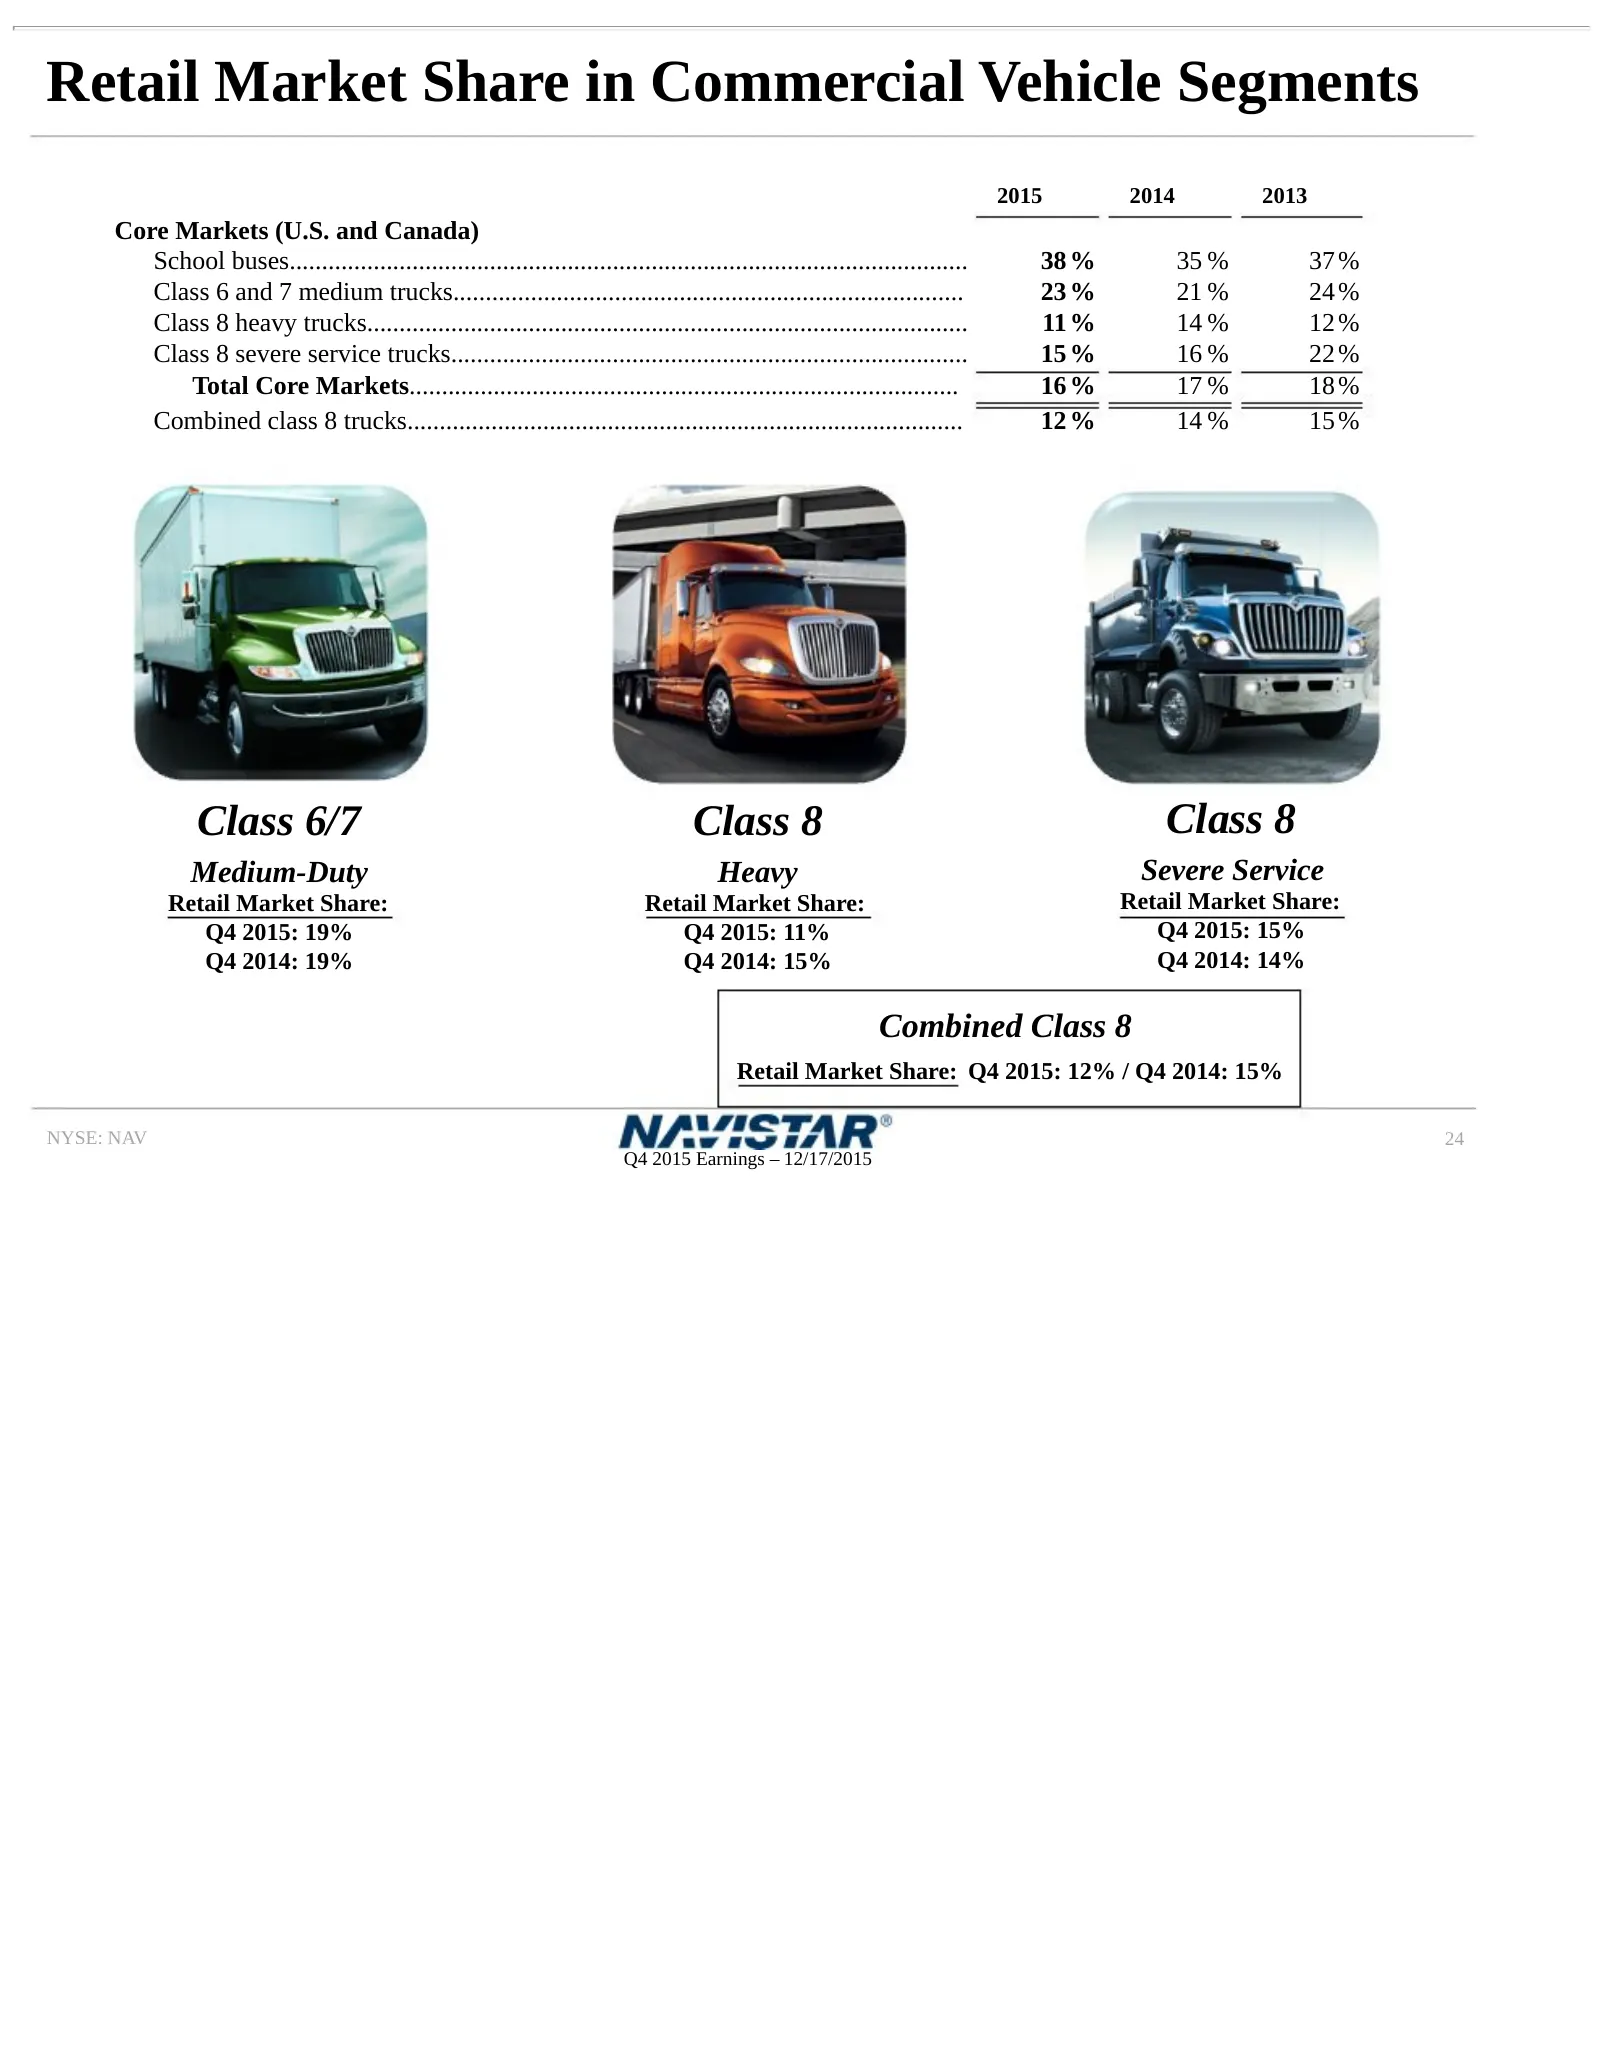
Retail Market Share in Commercial Vehicle Segments 2015 2014 2013 Core Markets (U.S. and Canada) School buses......................................................................................................... 38 % 35 % 37 % Class 6 and 7 medium trucks...........................................
Slide 25: Worldwide Truck Chargeouts
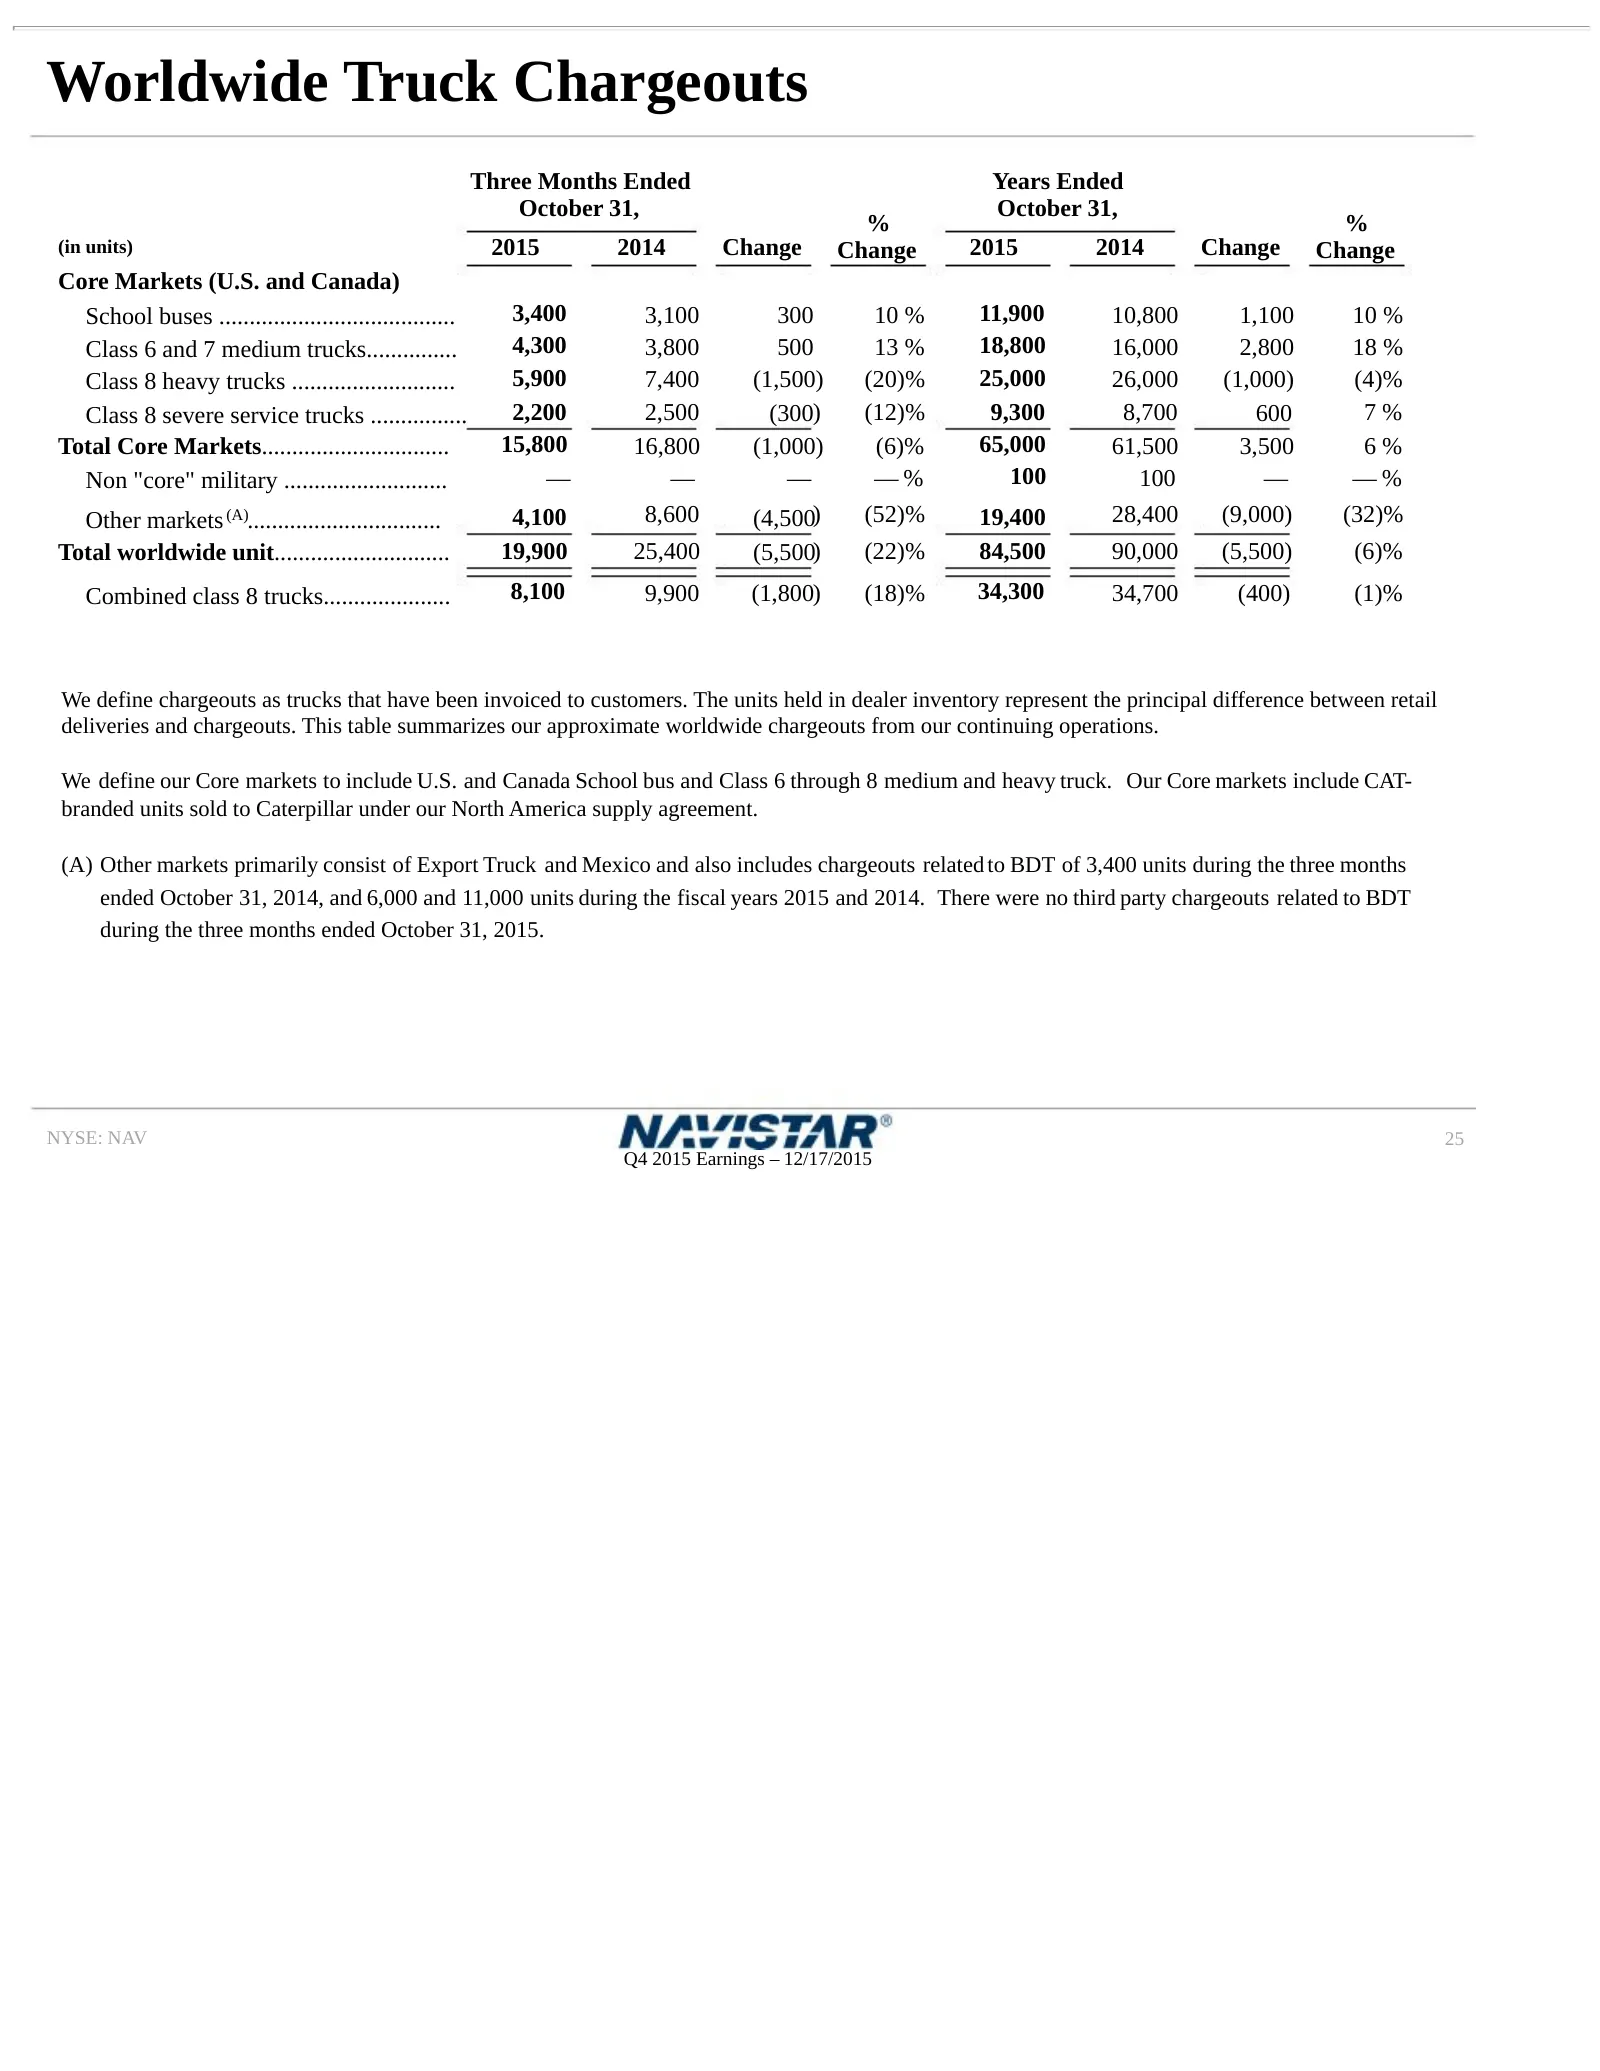
Worldwide Truck Chargeouts Three Months Ended Years Ended October 31, October 31, % % (in units) 2015 2014 Change Change 2015 2014 Change Change Core Markets (U.S. and Canada) School buses ....................................... 3,400 3,100 300 10 % 11,900 10,800 1,100 10 % Class 6 and 7 medium truc
Slide 26: Worldwide Engine Shipments
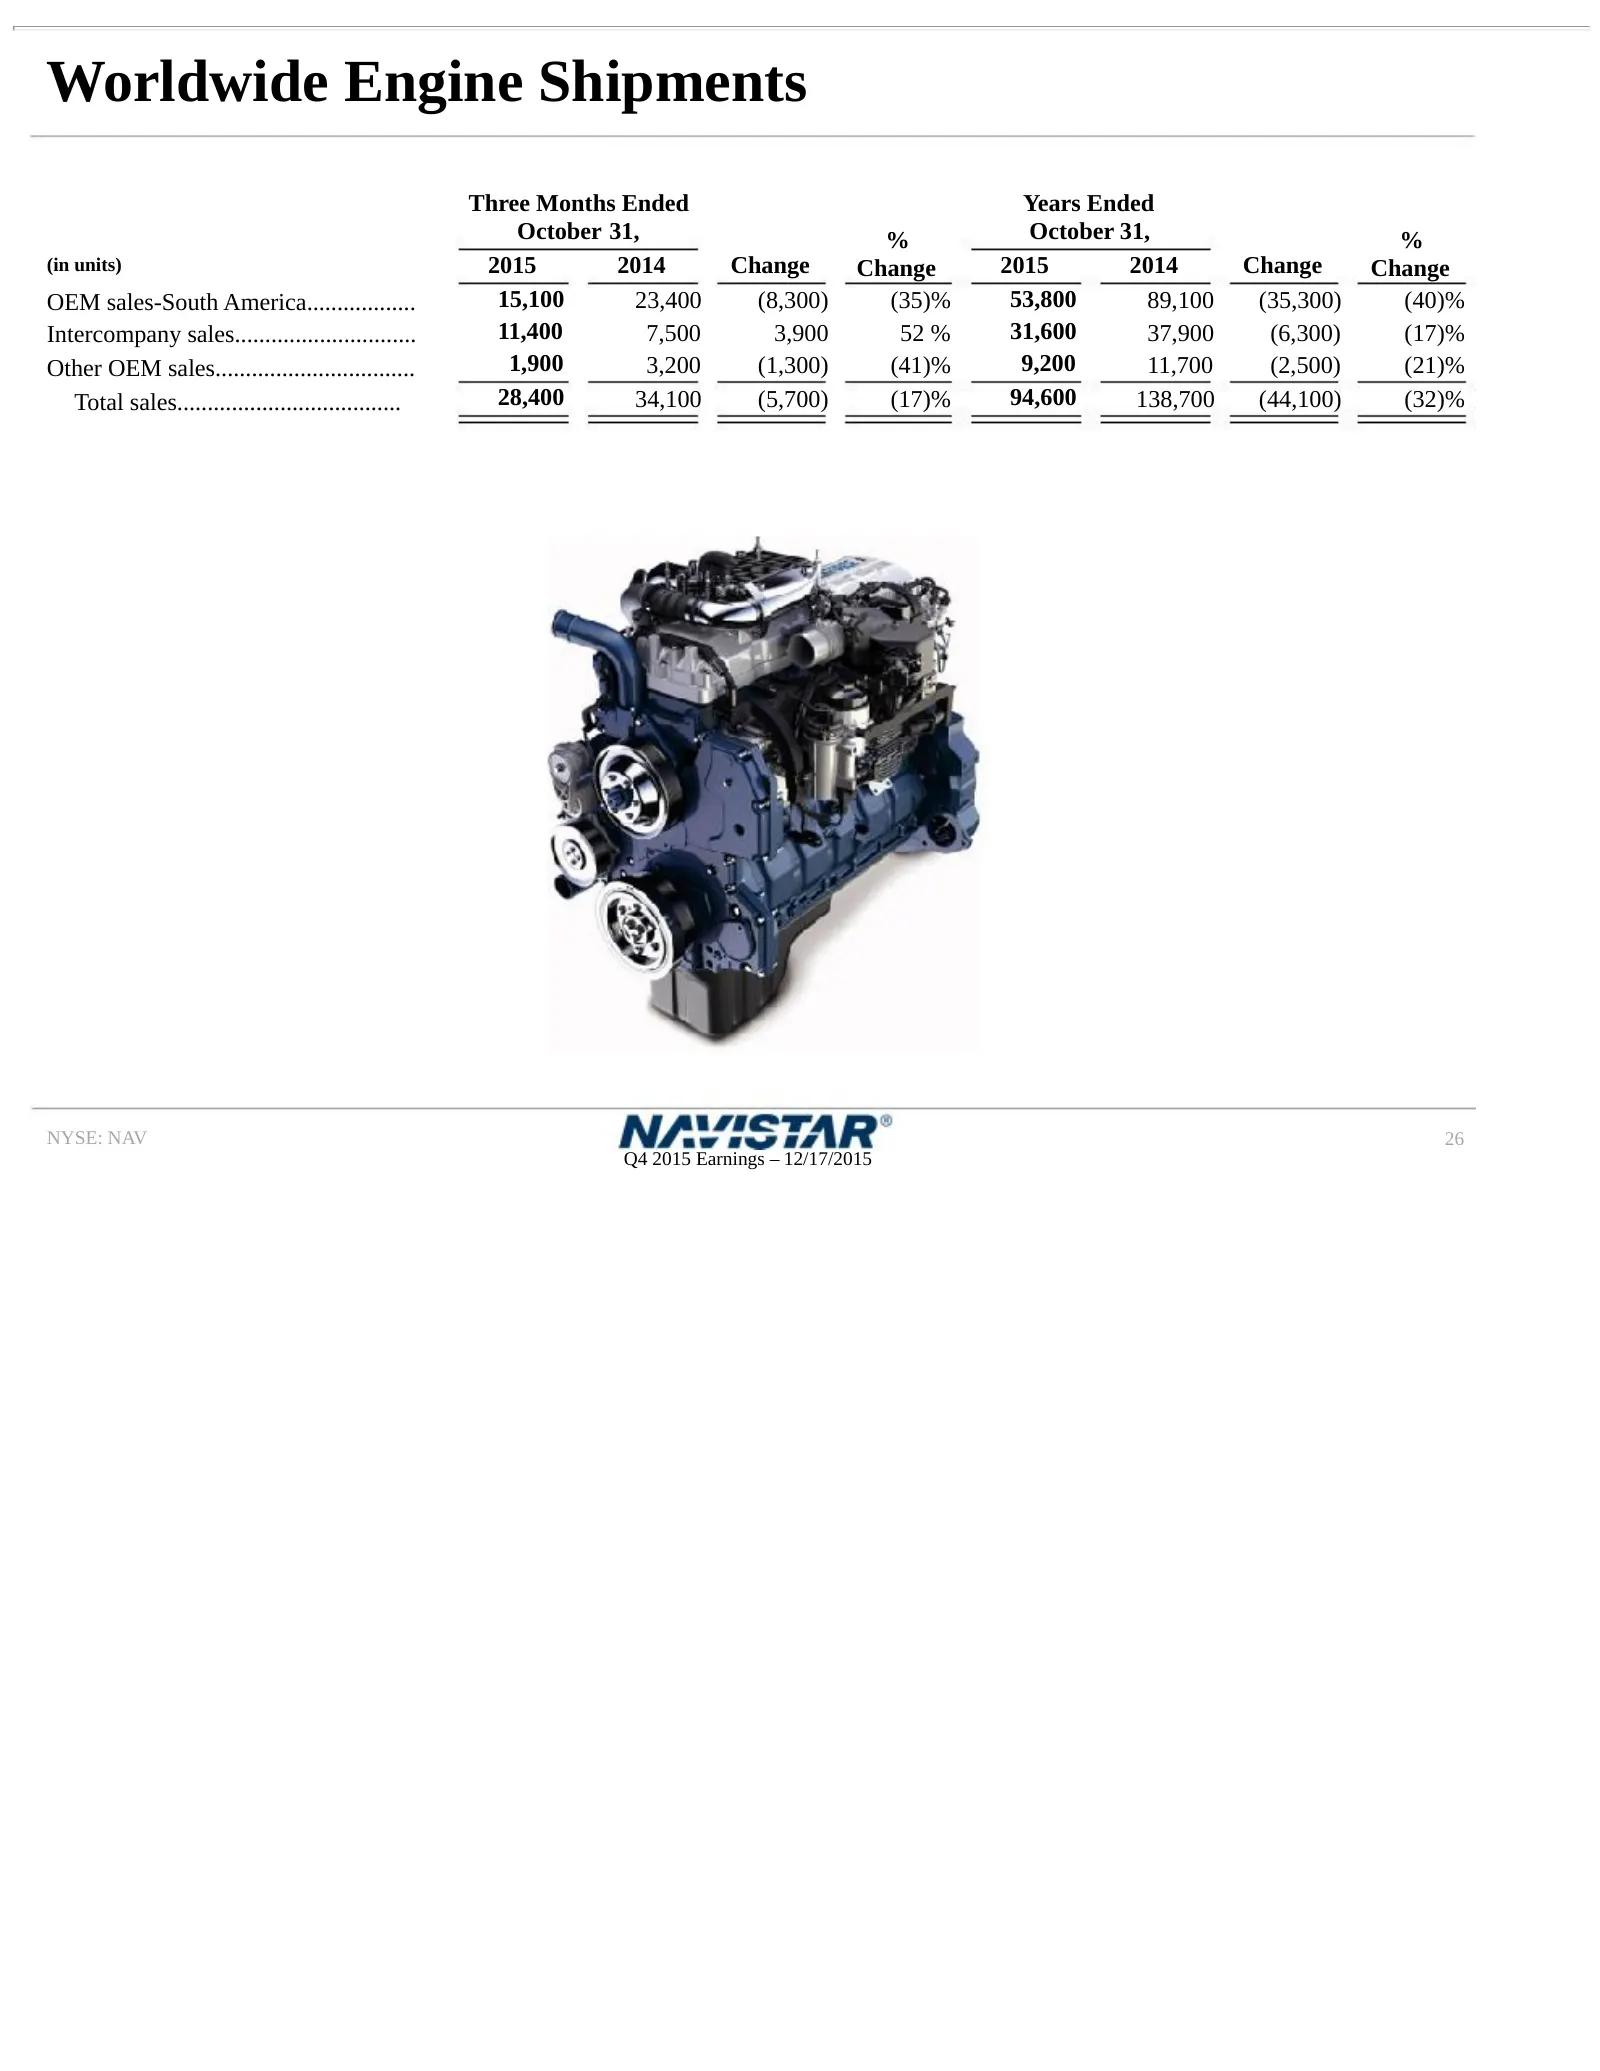
Worldwide Engine Shipments Three Months Ended Years Ended October 31, % October 31, % (in units) 2015 2014 Change Change 2015 2014 Change Change OEM sales-South America.................. 15,100 23,400 (8,300) (35)% 53,800 89,100 (35,300) (40)% Intercompany sales.............................. 11,400
Slide 27: U.S. and Canada Dealer Stock Inventory
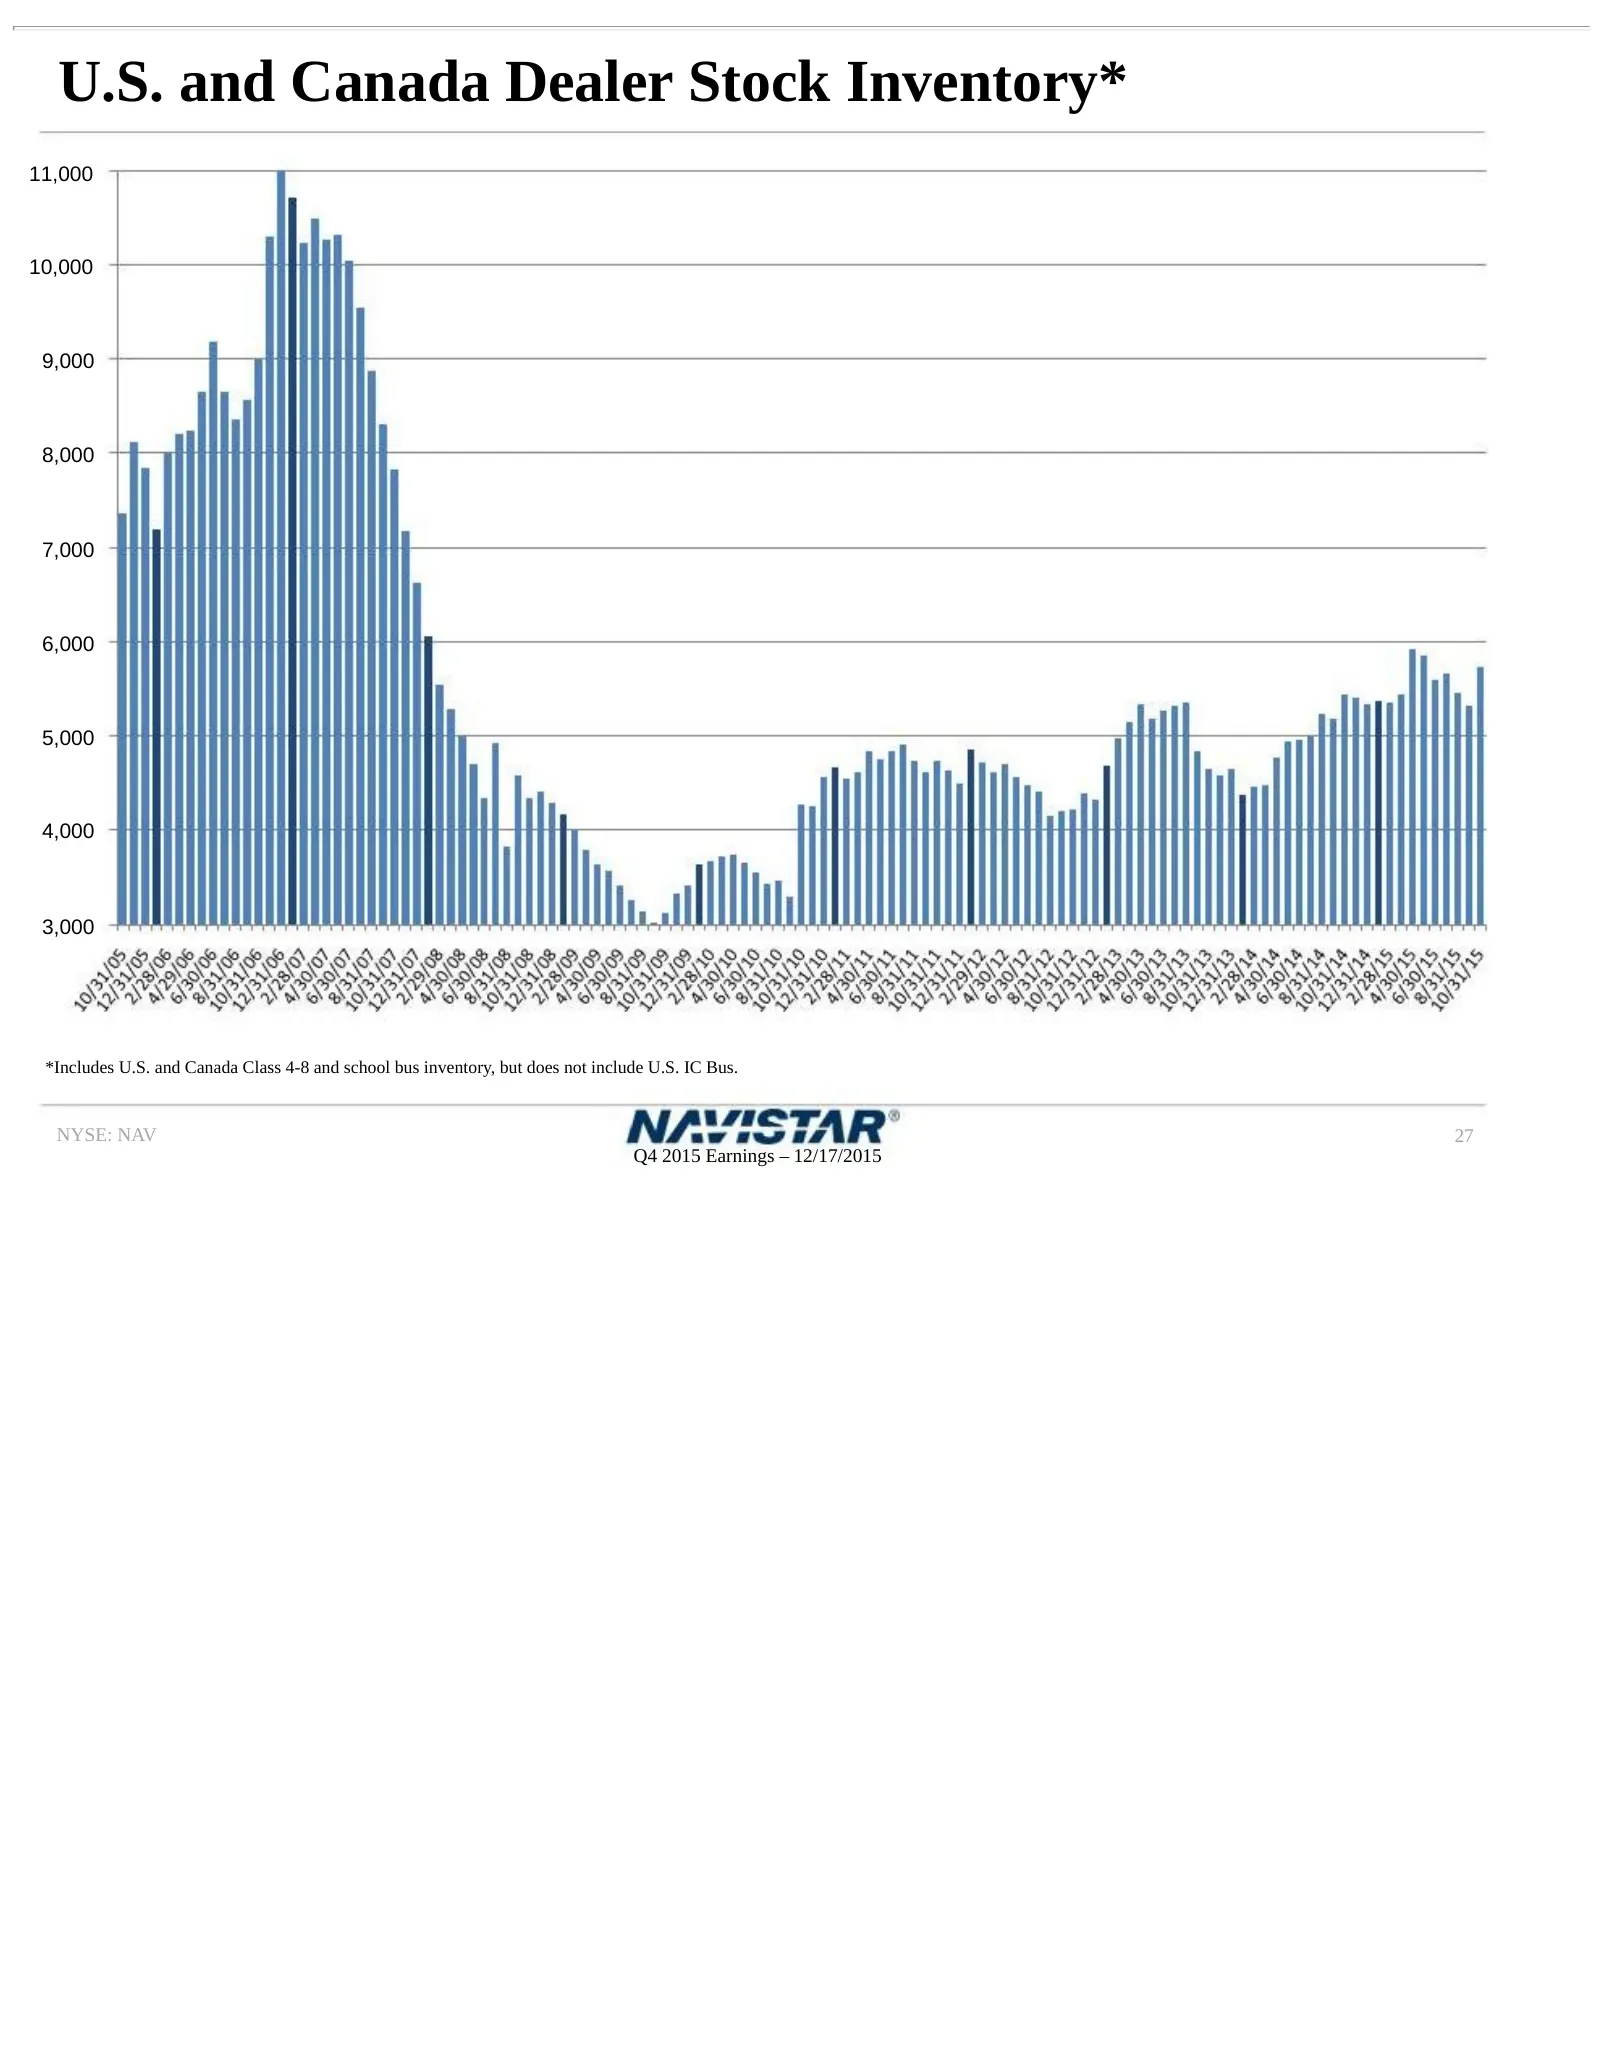
U.S. and Canada Dealer Stock Inventory* 11,000 10,000 9,000 8,000 7,000 6,000 5,000 4,000 3,000 *Includes U.S. and Canada Class 4-8 and school bus inventory, but does not include U.S. IC Bus. NYSE: NAV 27 Q4 2015 Earnings – 12/17/2015
Slide 28: Frequently Asked Questions
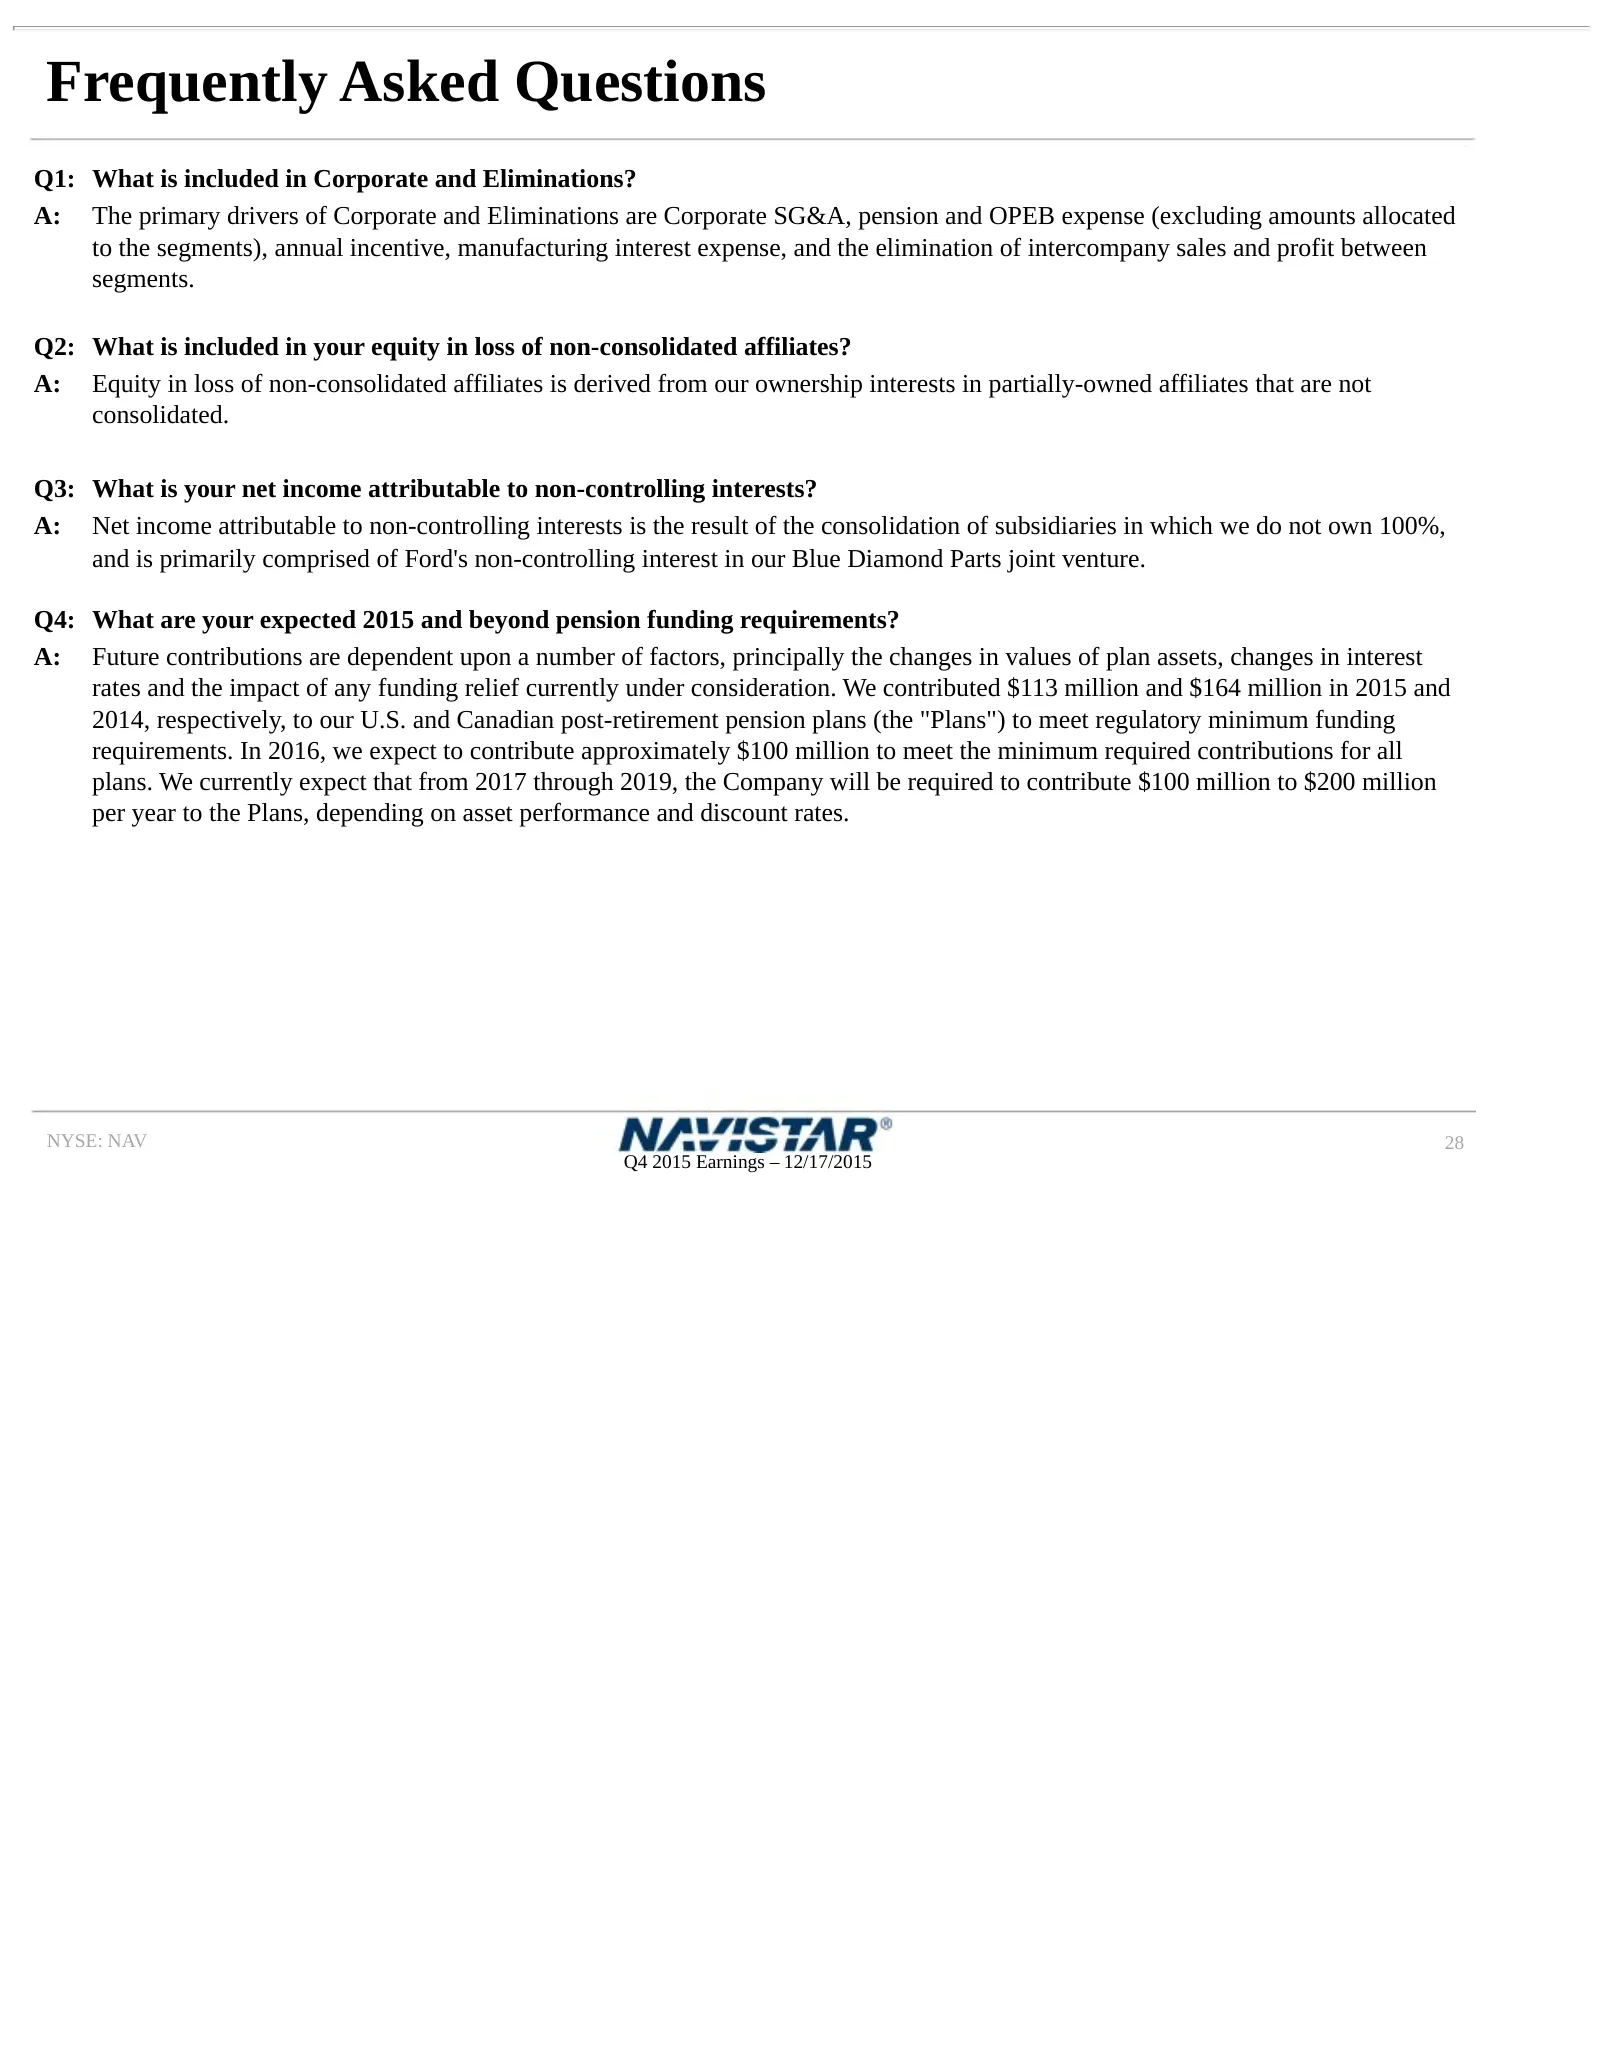
Frequently Asked Questions Q1: What is included in Corporate and Eliminations? A: The primary drivers of Corporate and Eliminations are Corporate SG&A, pension and OPEB expense (excluding amounts allocated to the segments), annual incentive, manufacturing interest expense, and the elimination of int
Slide 29: Frequently Asked Questions
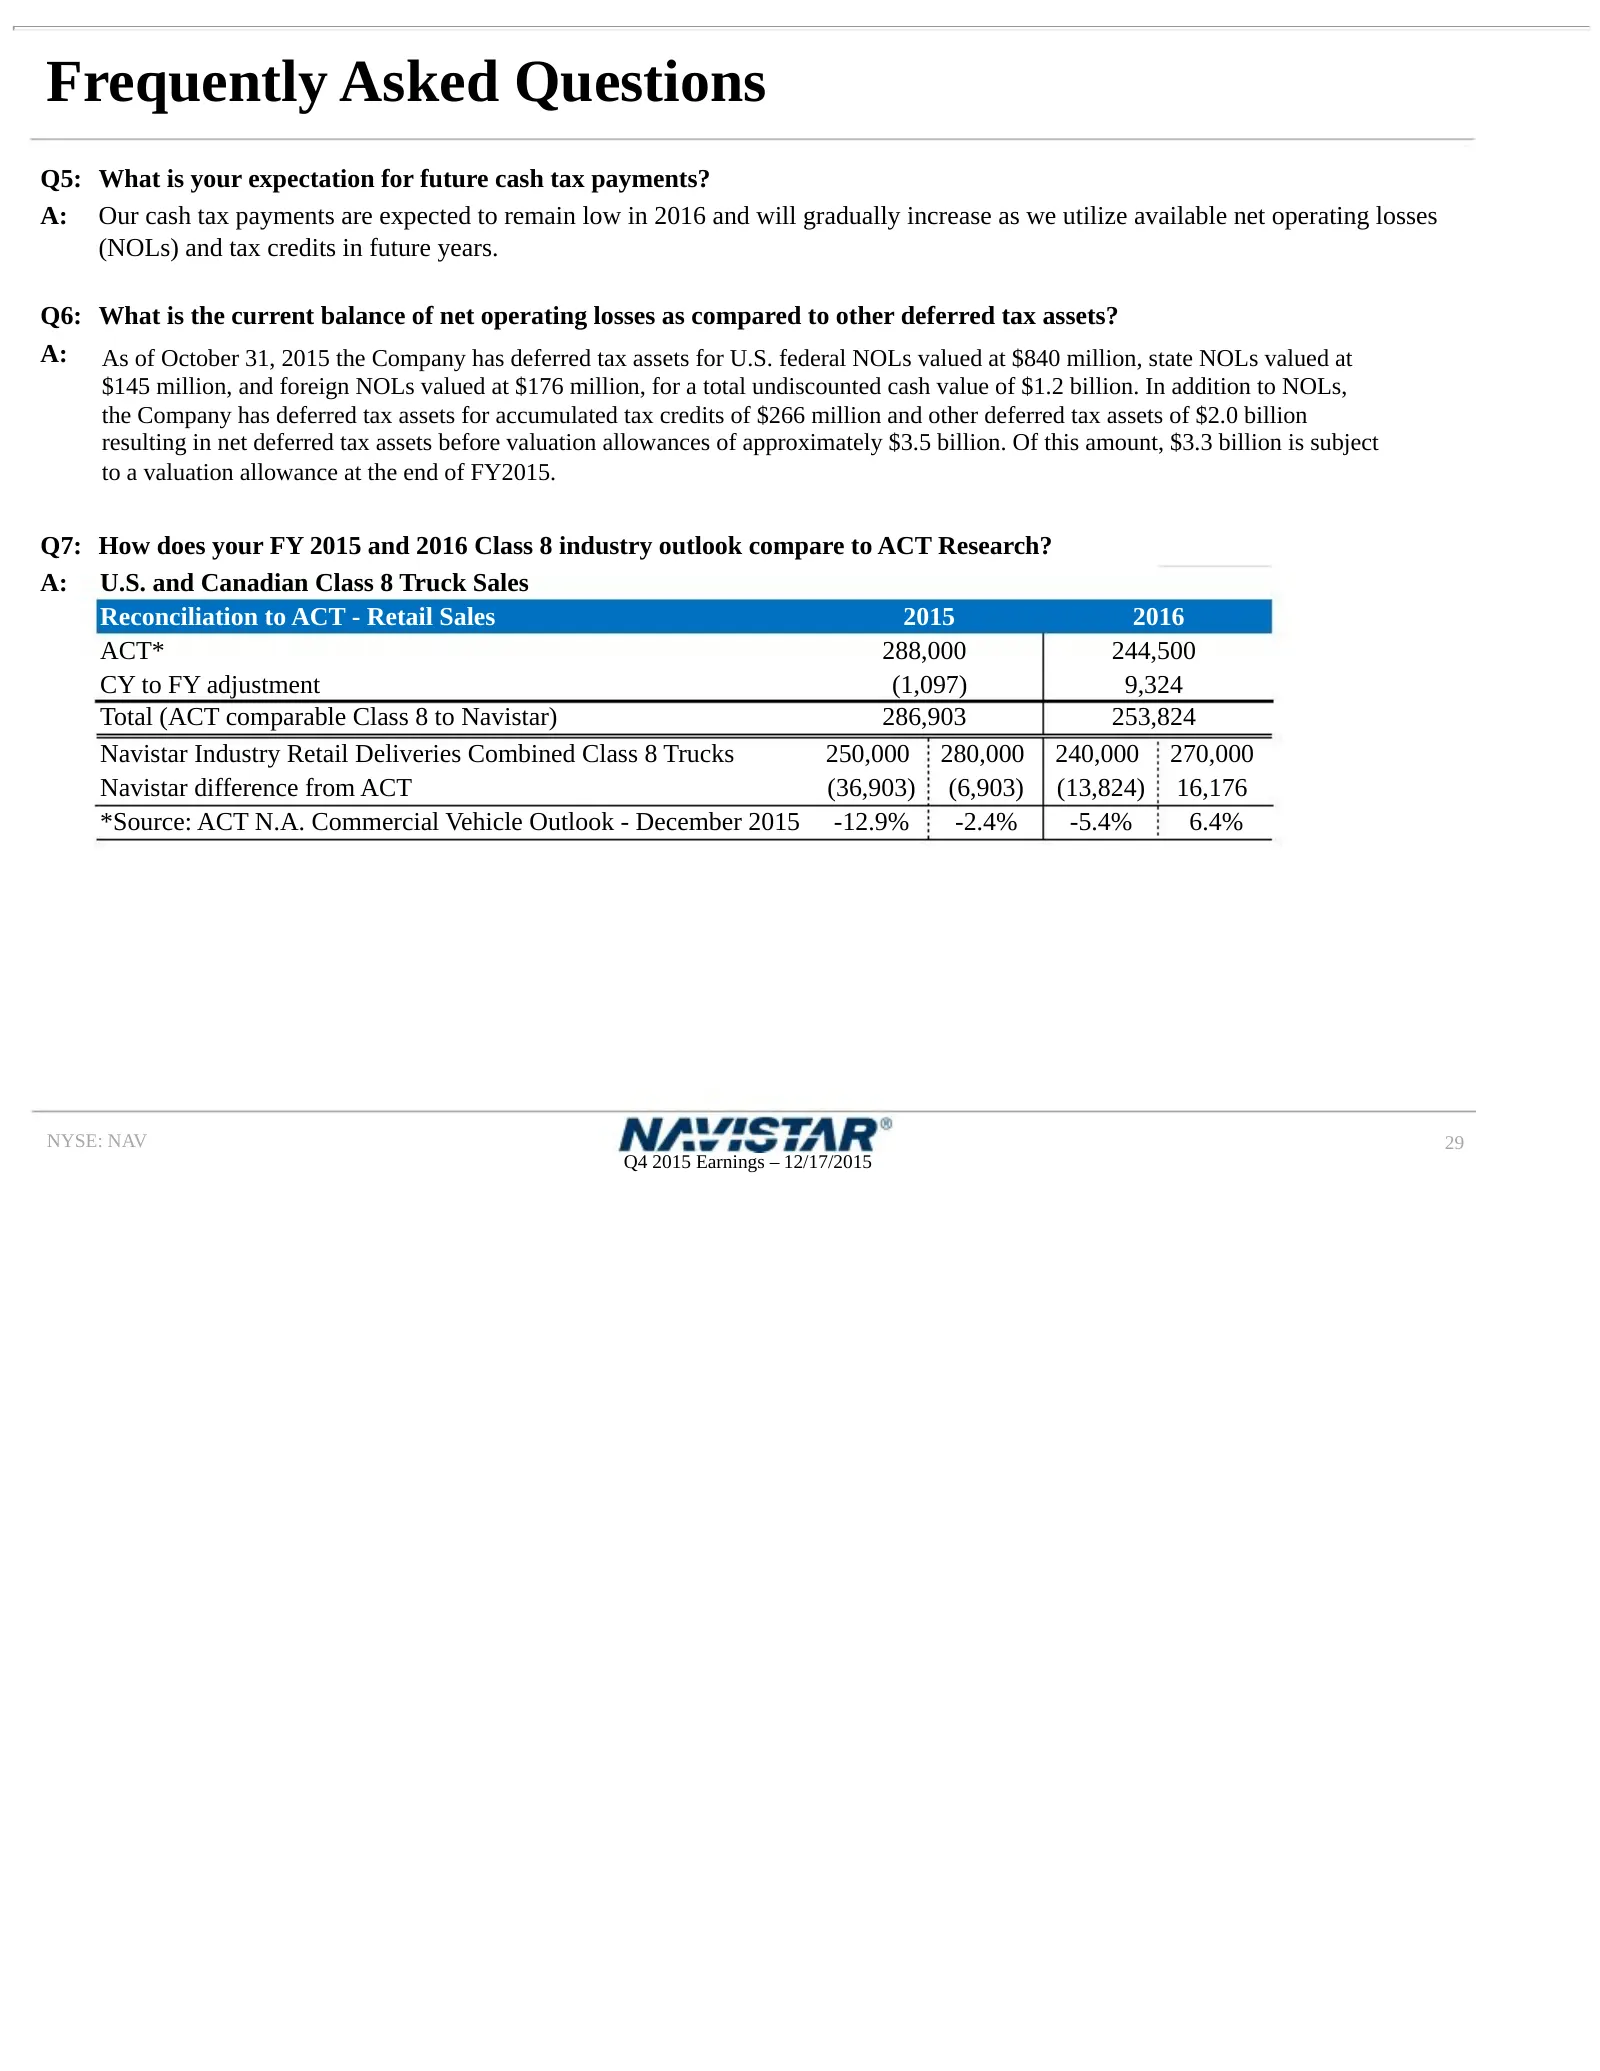
Frequently Asked Questions Q5: What is your expectation for future cash tax payments? A: Our cash tax payments are expected to remain low in 2016 and will gradually increase as we utilize available net operating losses (NOLs) and tax credits in future years. Q6: What is the current balance of net op
Slide 30: Frequently Asked Questions
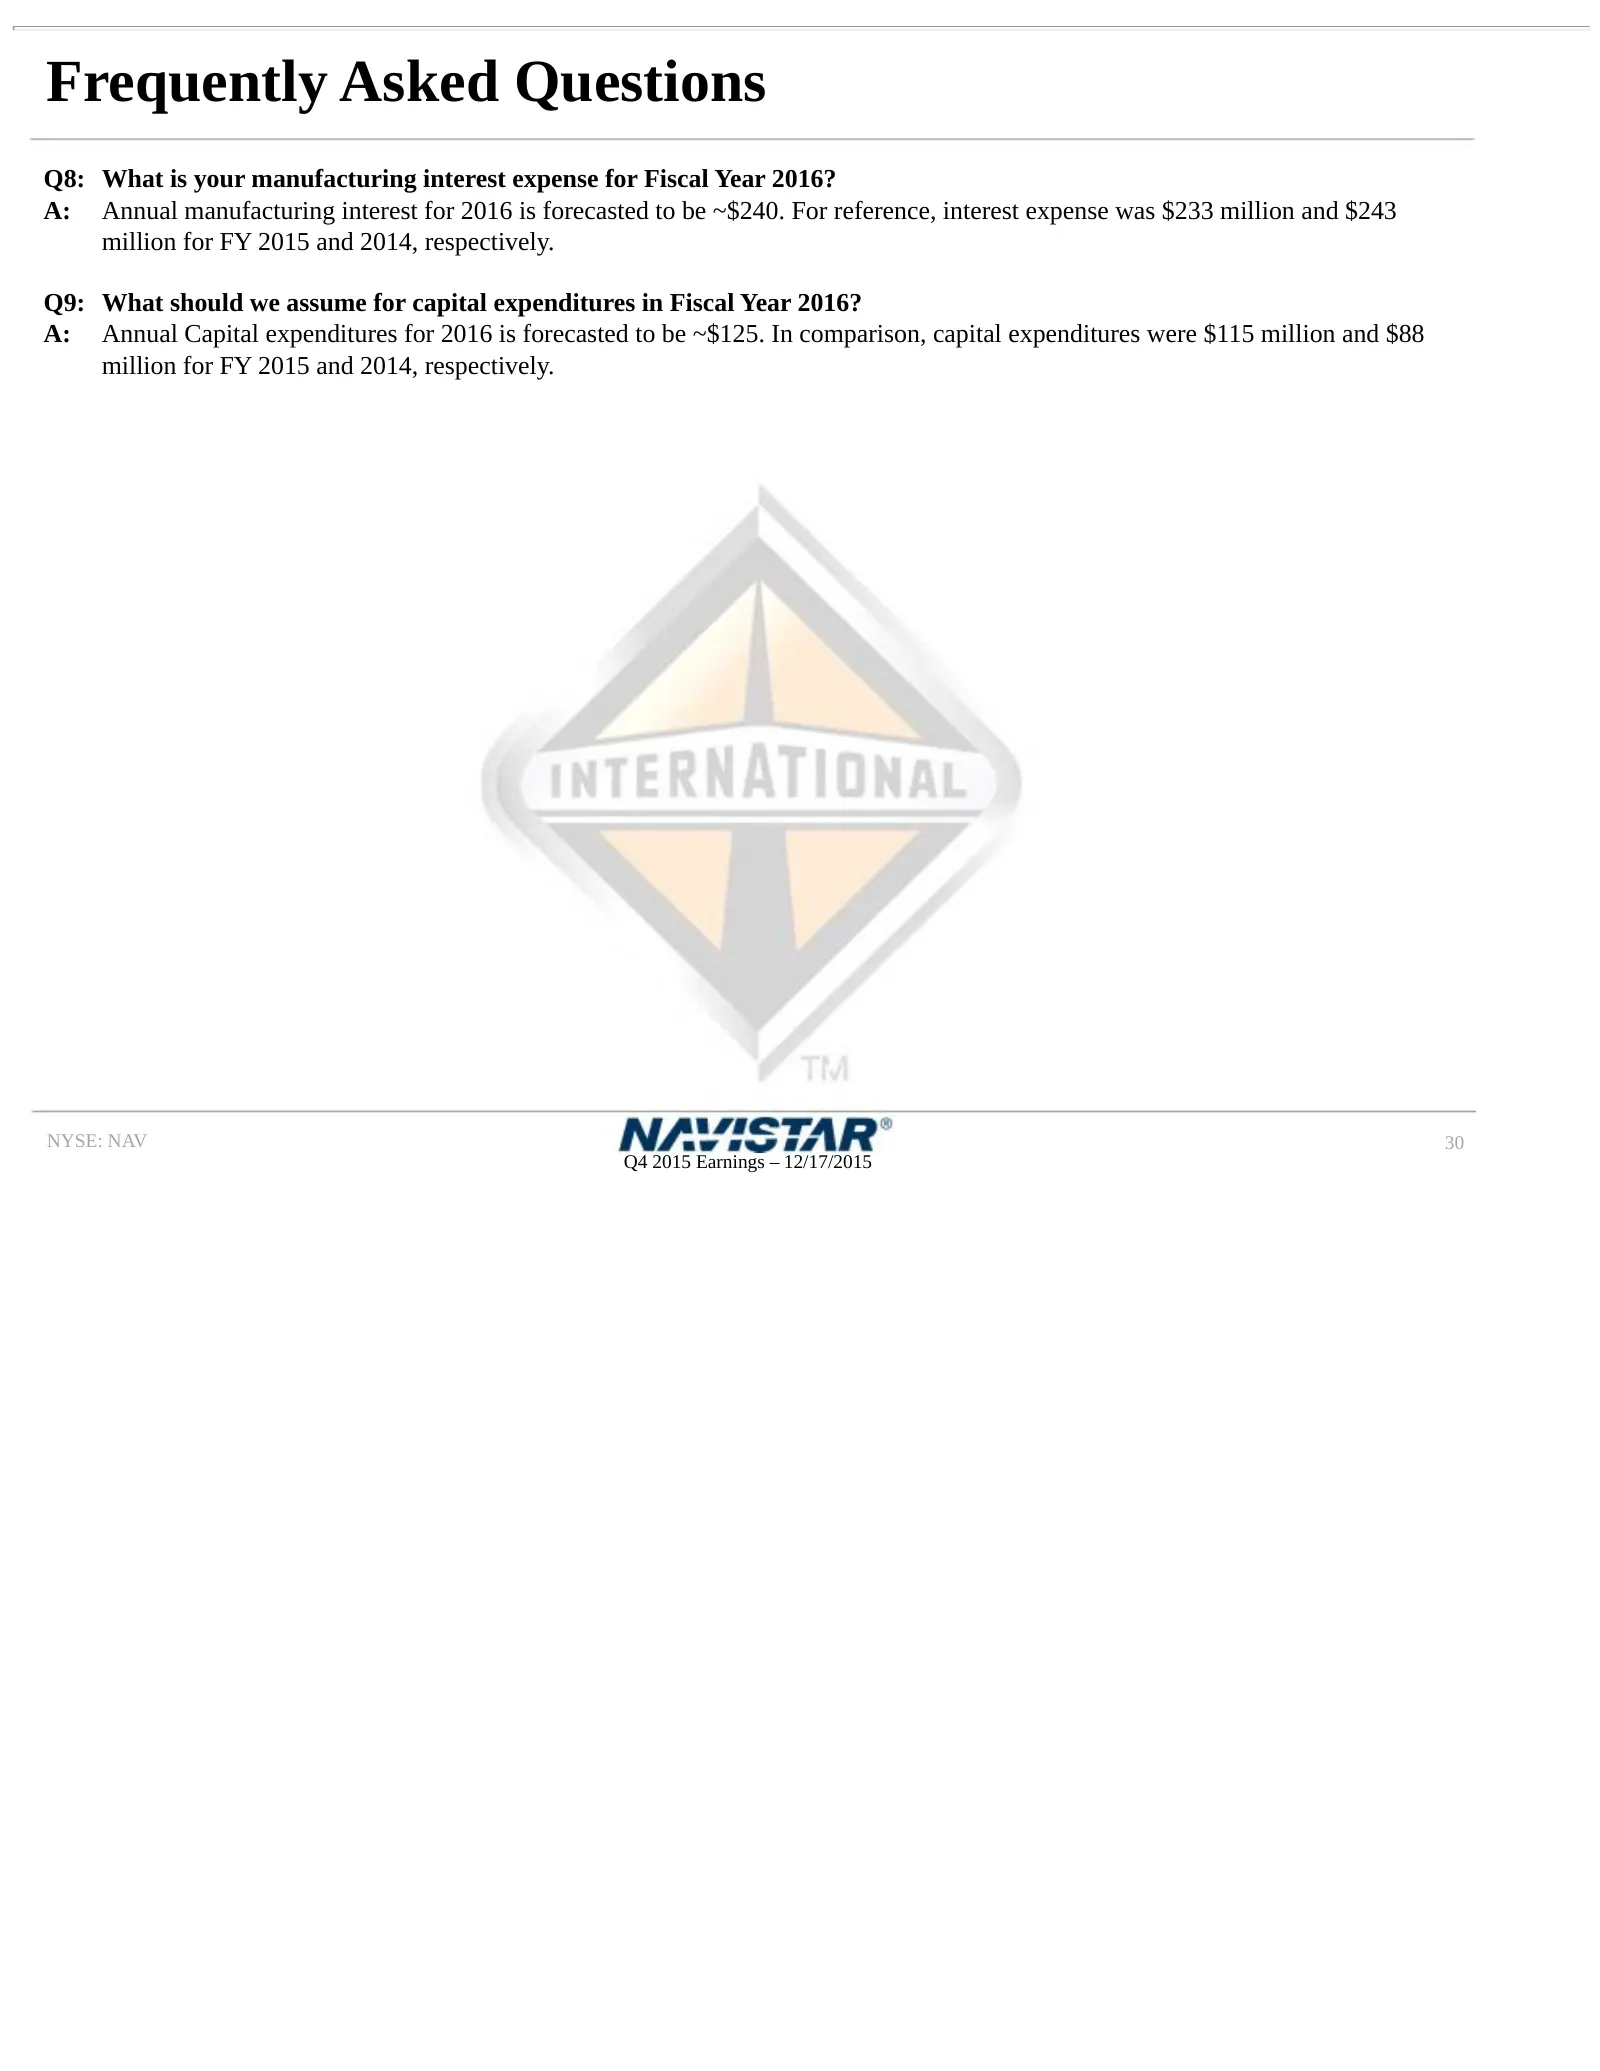
Frequently Asked Questions Q8: What is your manufacturing interest expense for Fiscal Year 2016? A: Annual manufacturing interest for 2016 is forecasted to be ~$240. For reference, interest expense was $233 million and $243 million for FY 2015 and 2014, respectively. Q9: What should we assume for ca
Slide 31: Outstanding Debt Balances
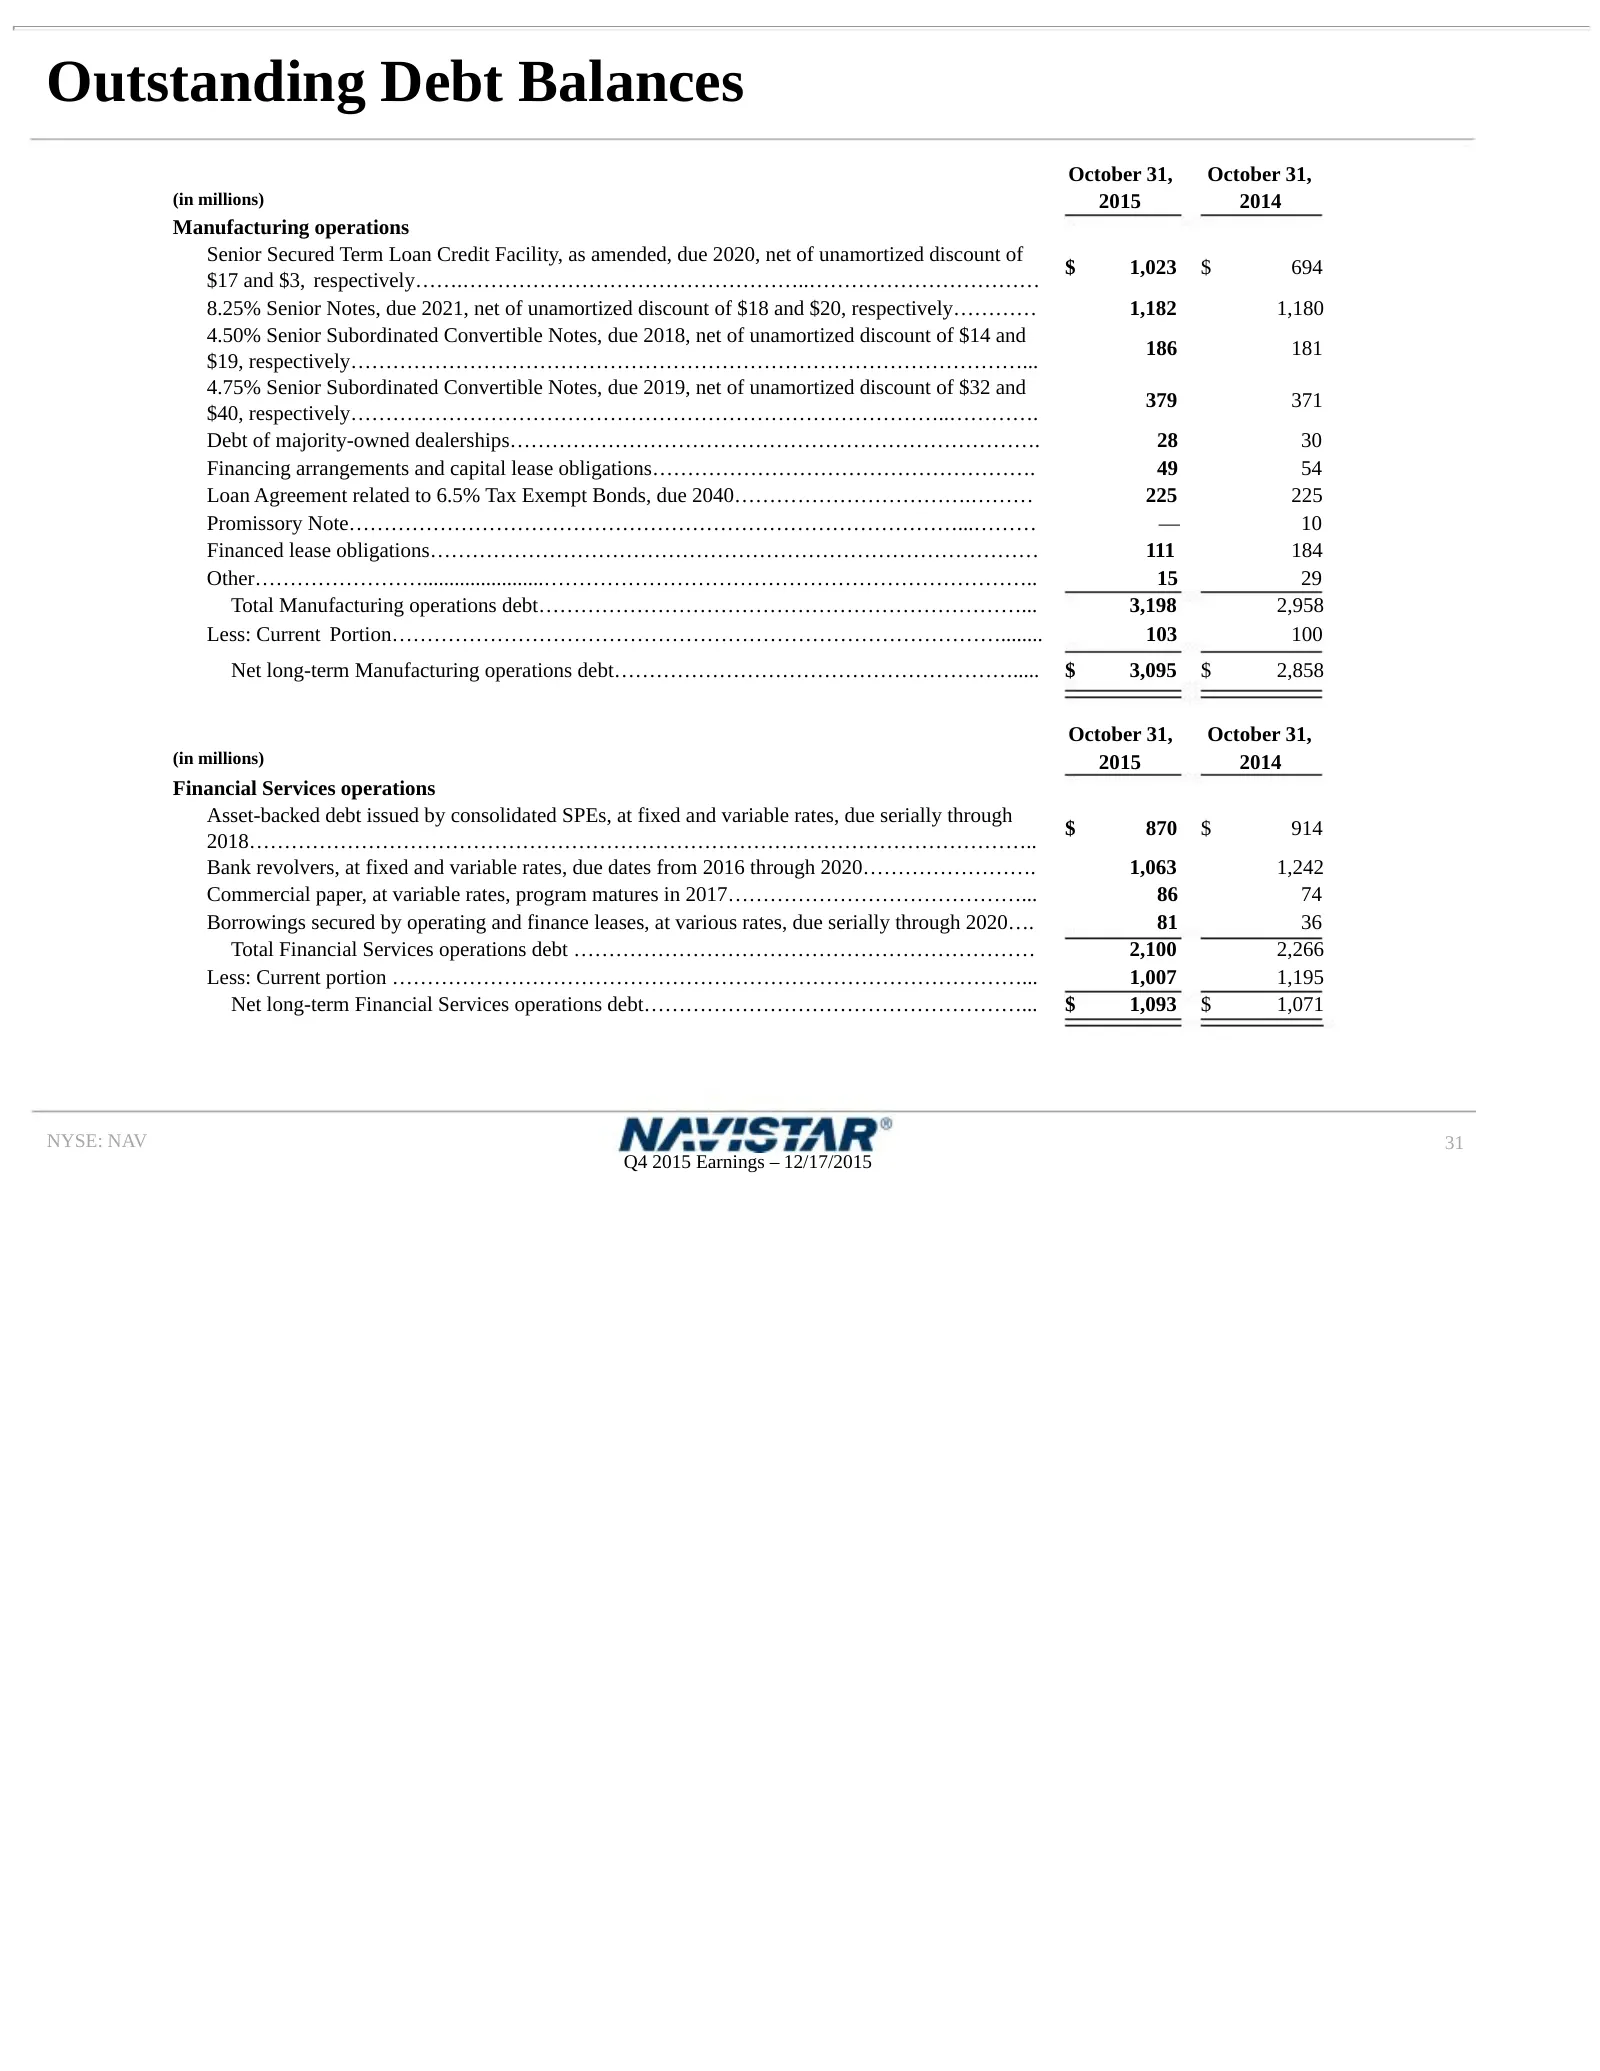
Outstanding Debt Balances October 31, October 31, (in millions) 2015 2014 Manufacturing operations Senior Secured Term Loan Credit Facility, as amended, due 2020, net of unamortized discount of $ 1,023 $ 694 $17 and $3, respectively…….…………………………………………..…………………………… 8.25% Senior Notes, due 2021, net o
Slide 32: SEC Regulation G Non-GAAP Reconciliation
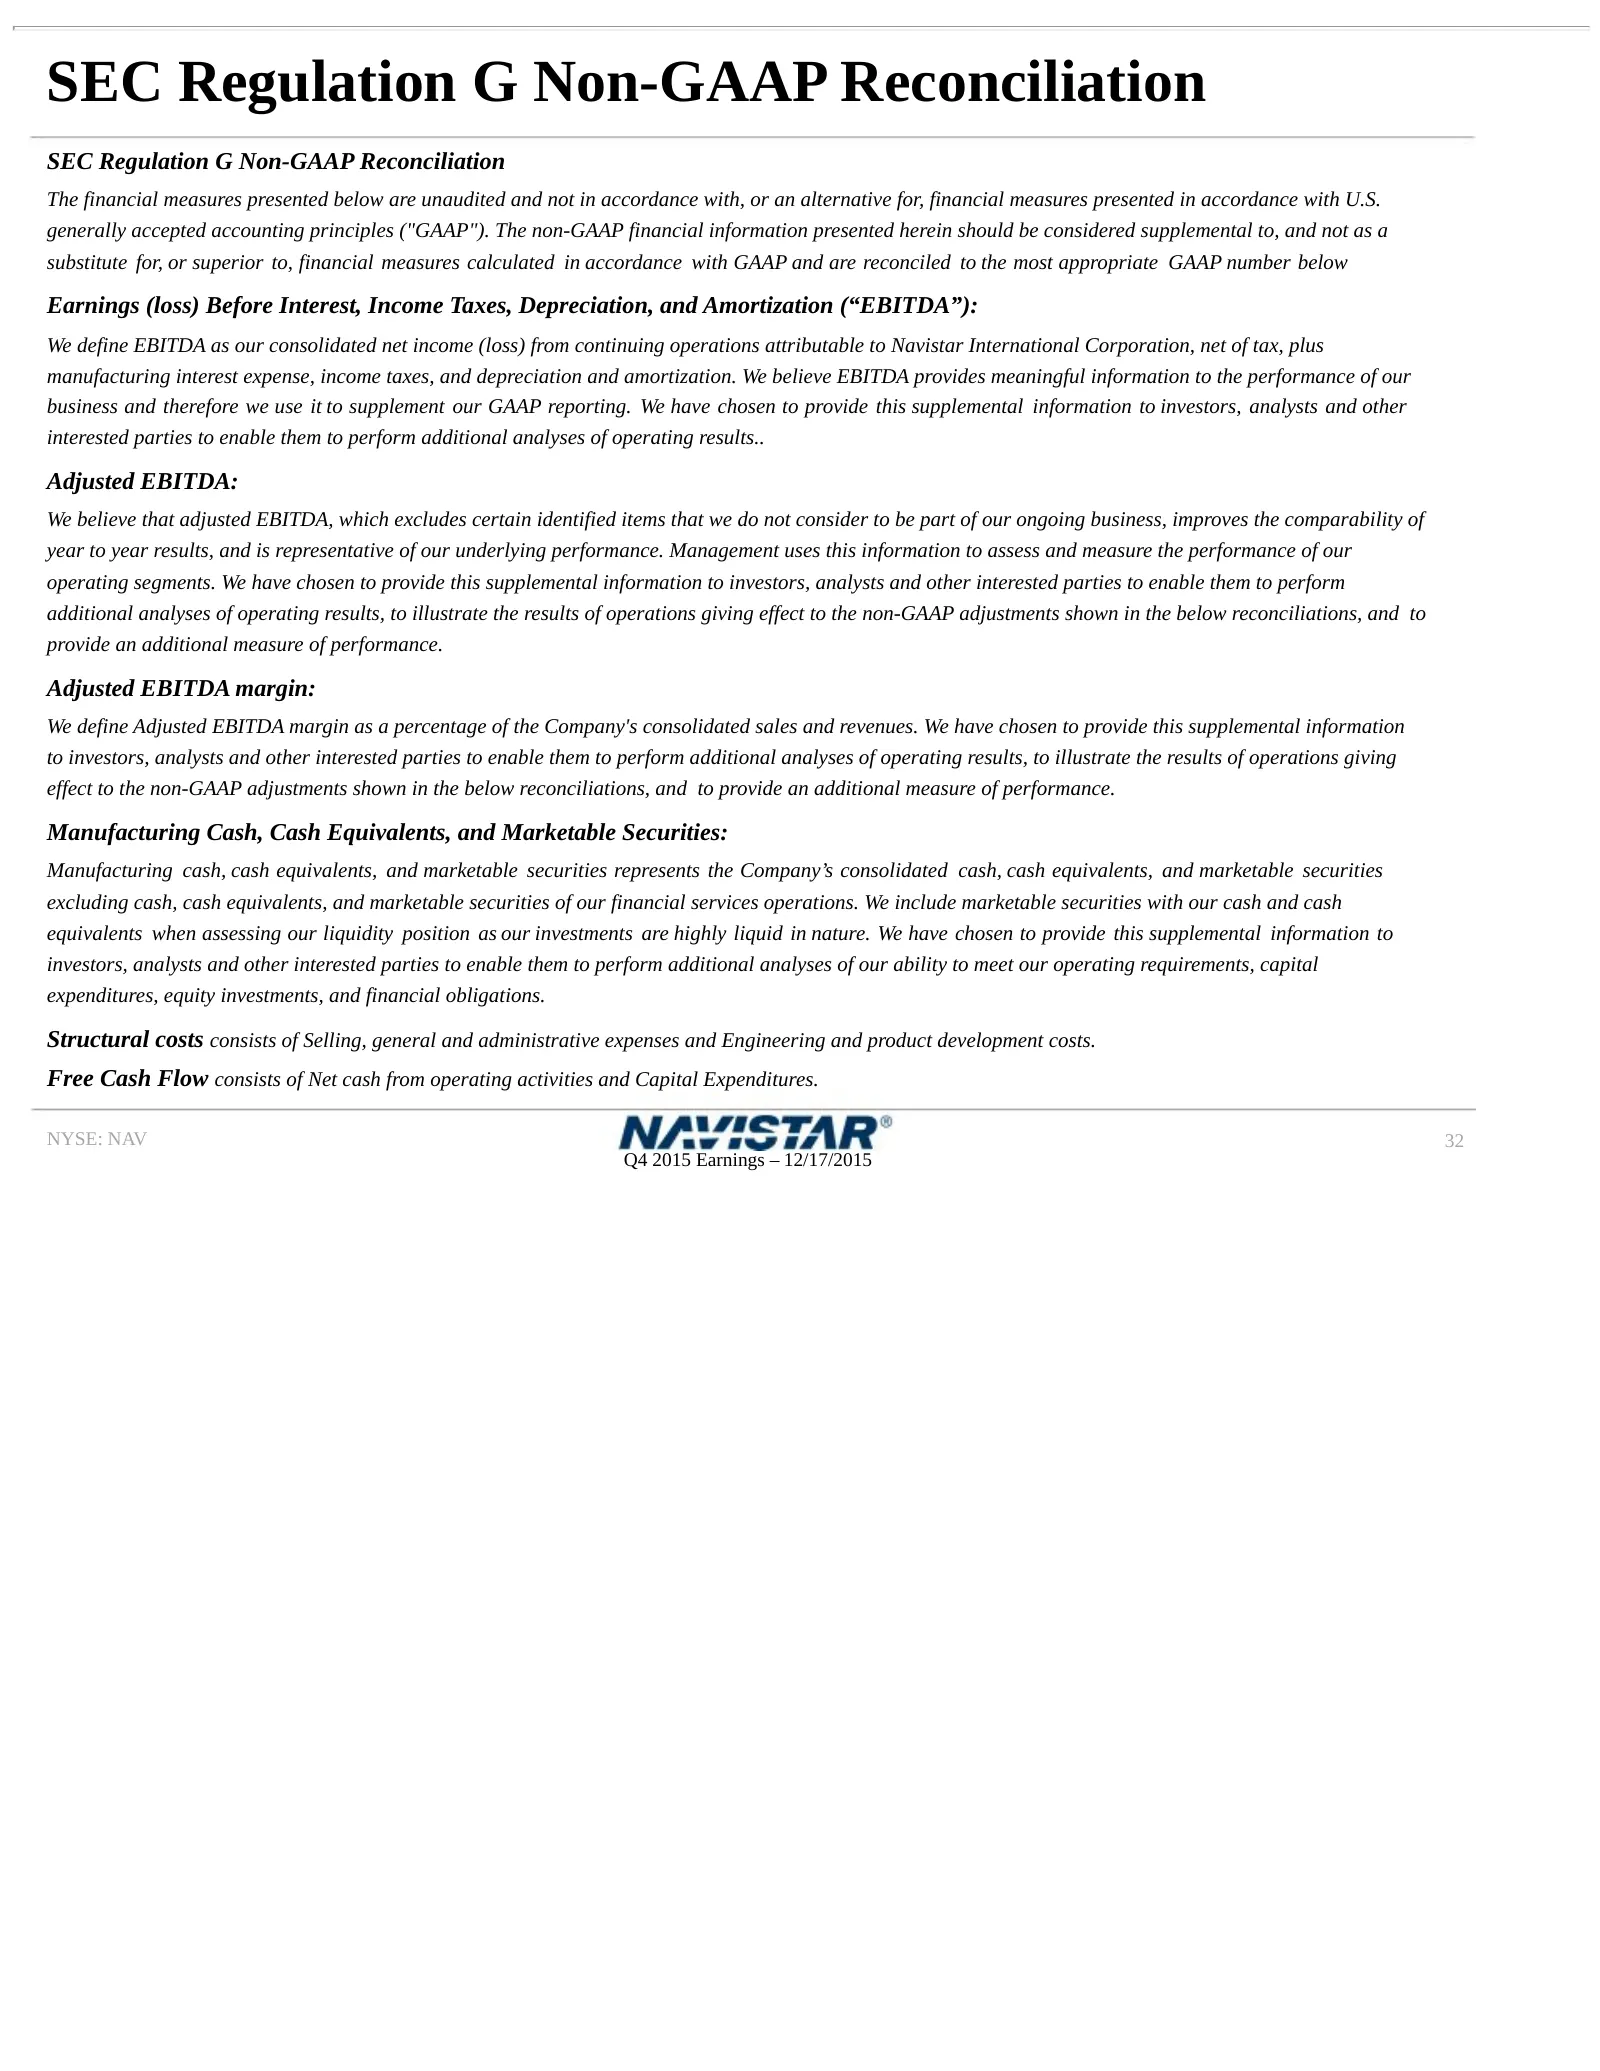
SEC Regulation G Non-GAAP Reconciliation SEC Regulation G Non-GAAP Reconciliation The financial measures presented below are unaudited and not in accordance with, or an alternative for, financial measures presented in accordance with U.S. generally accepted accounting principles ("GAAP"). The non-GA
Slide 33: SEC Regulation G Non-GAAP Reconciliations
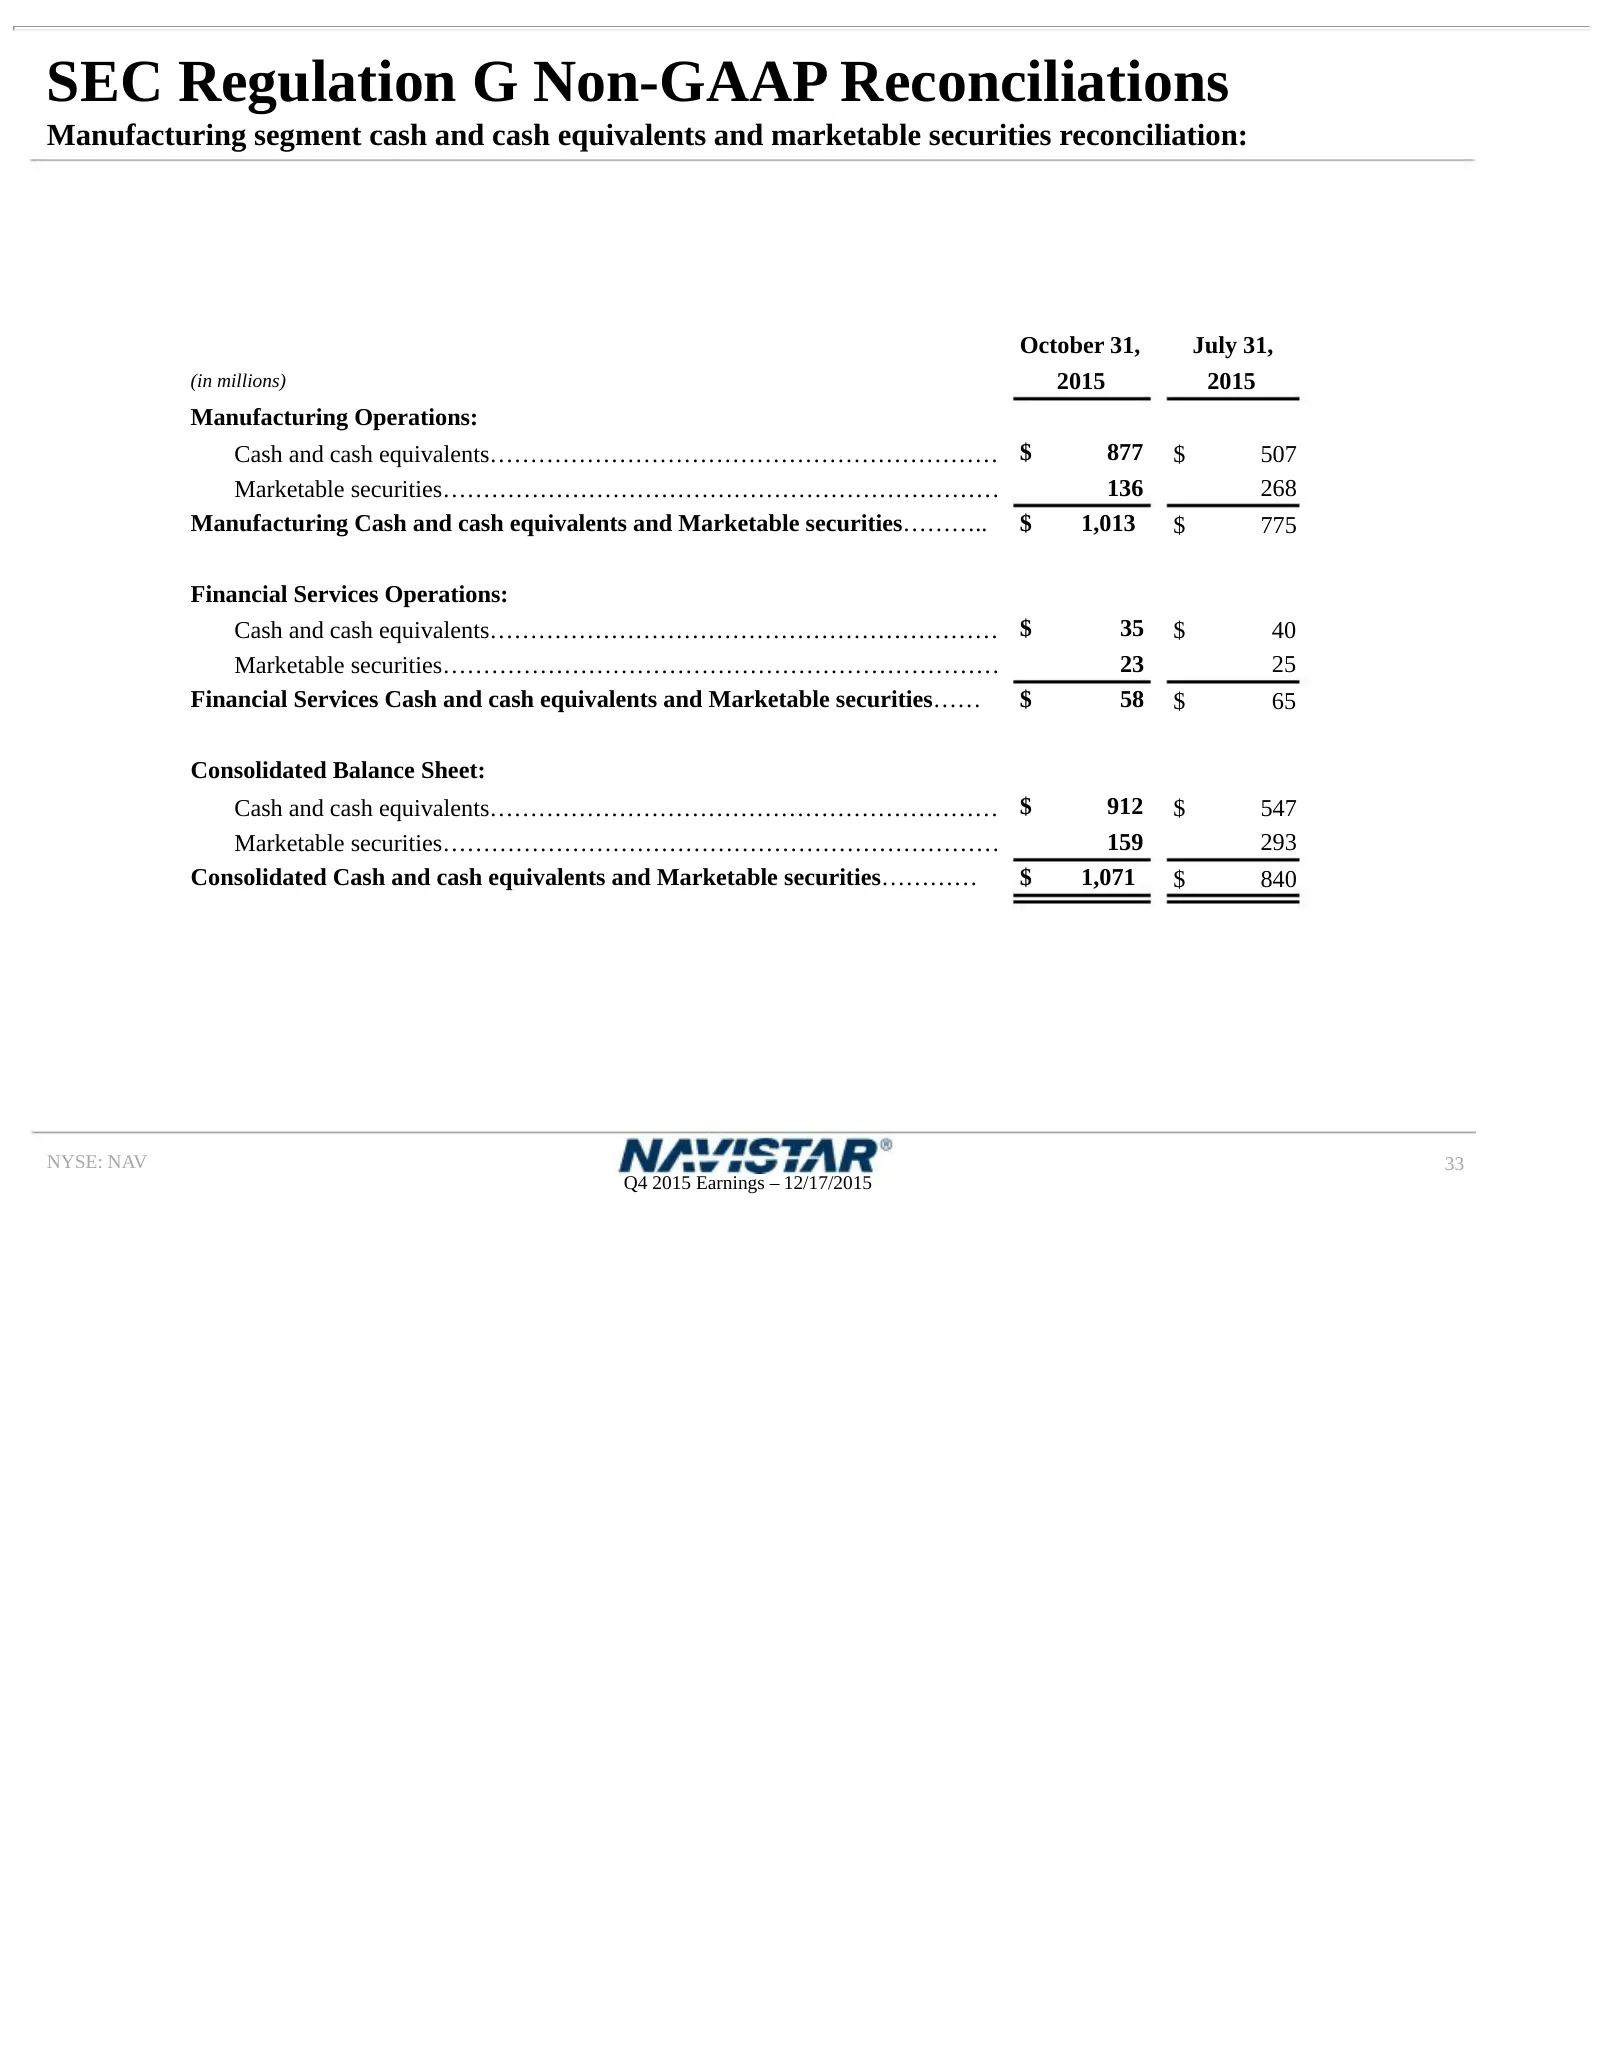
SEC Regulation G Non-GAAP Reconciliations Manufacturing segment cash and cash equivalents and marketable securities reconciliation: October 31, July 31, (in millions) 2015 2015 Manufacturing Operations: Cash and cash equivalents……………………………………………………… $ 877 $ 507 Marketable securities……………………………………………
Slide 34: SEC Regulation G Non-GAAP Reconciliations
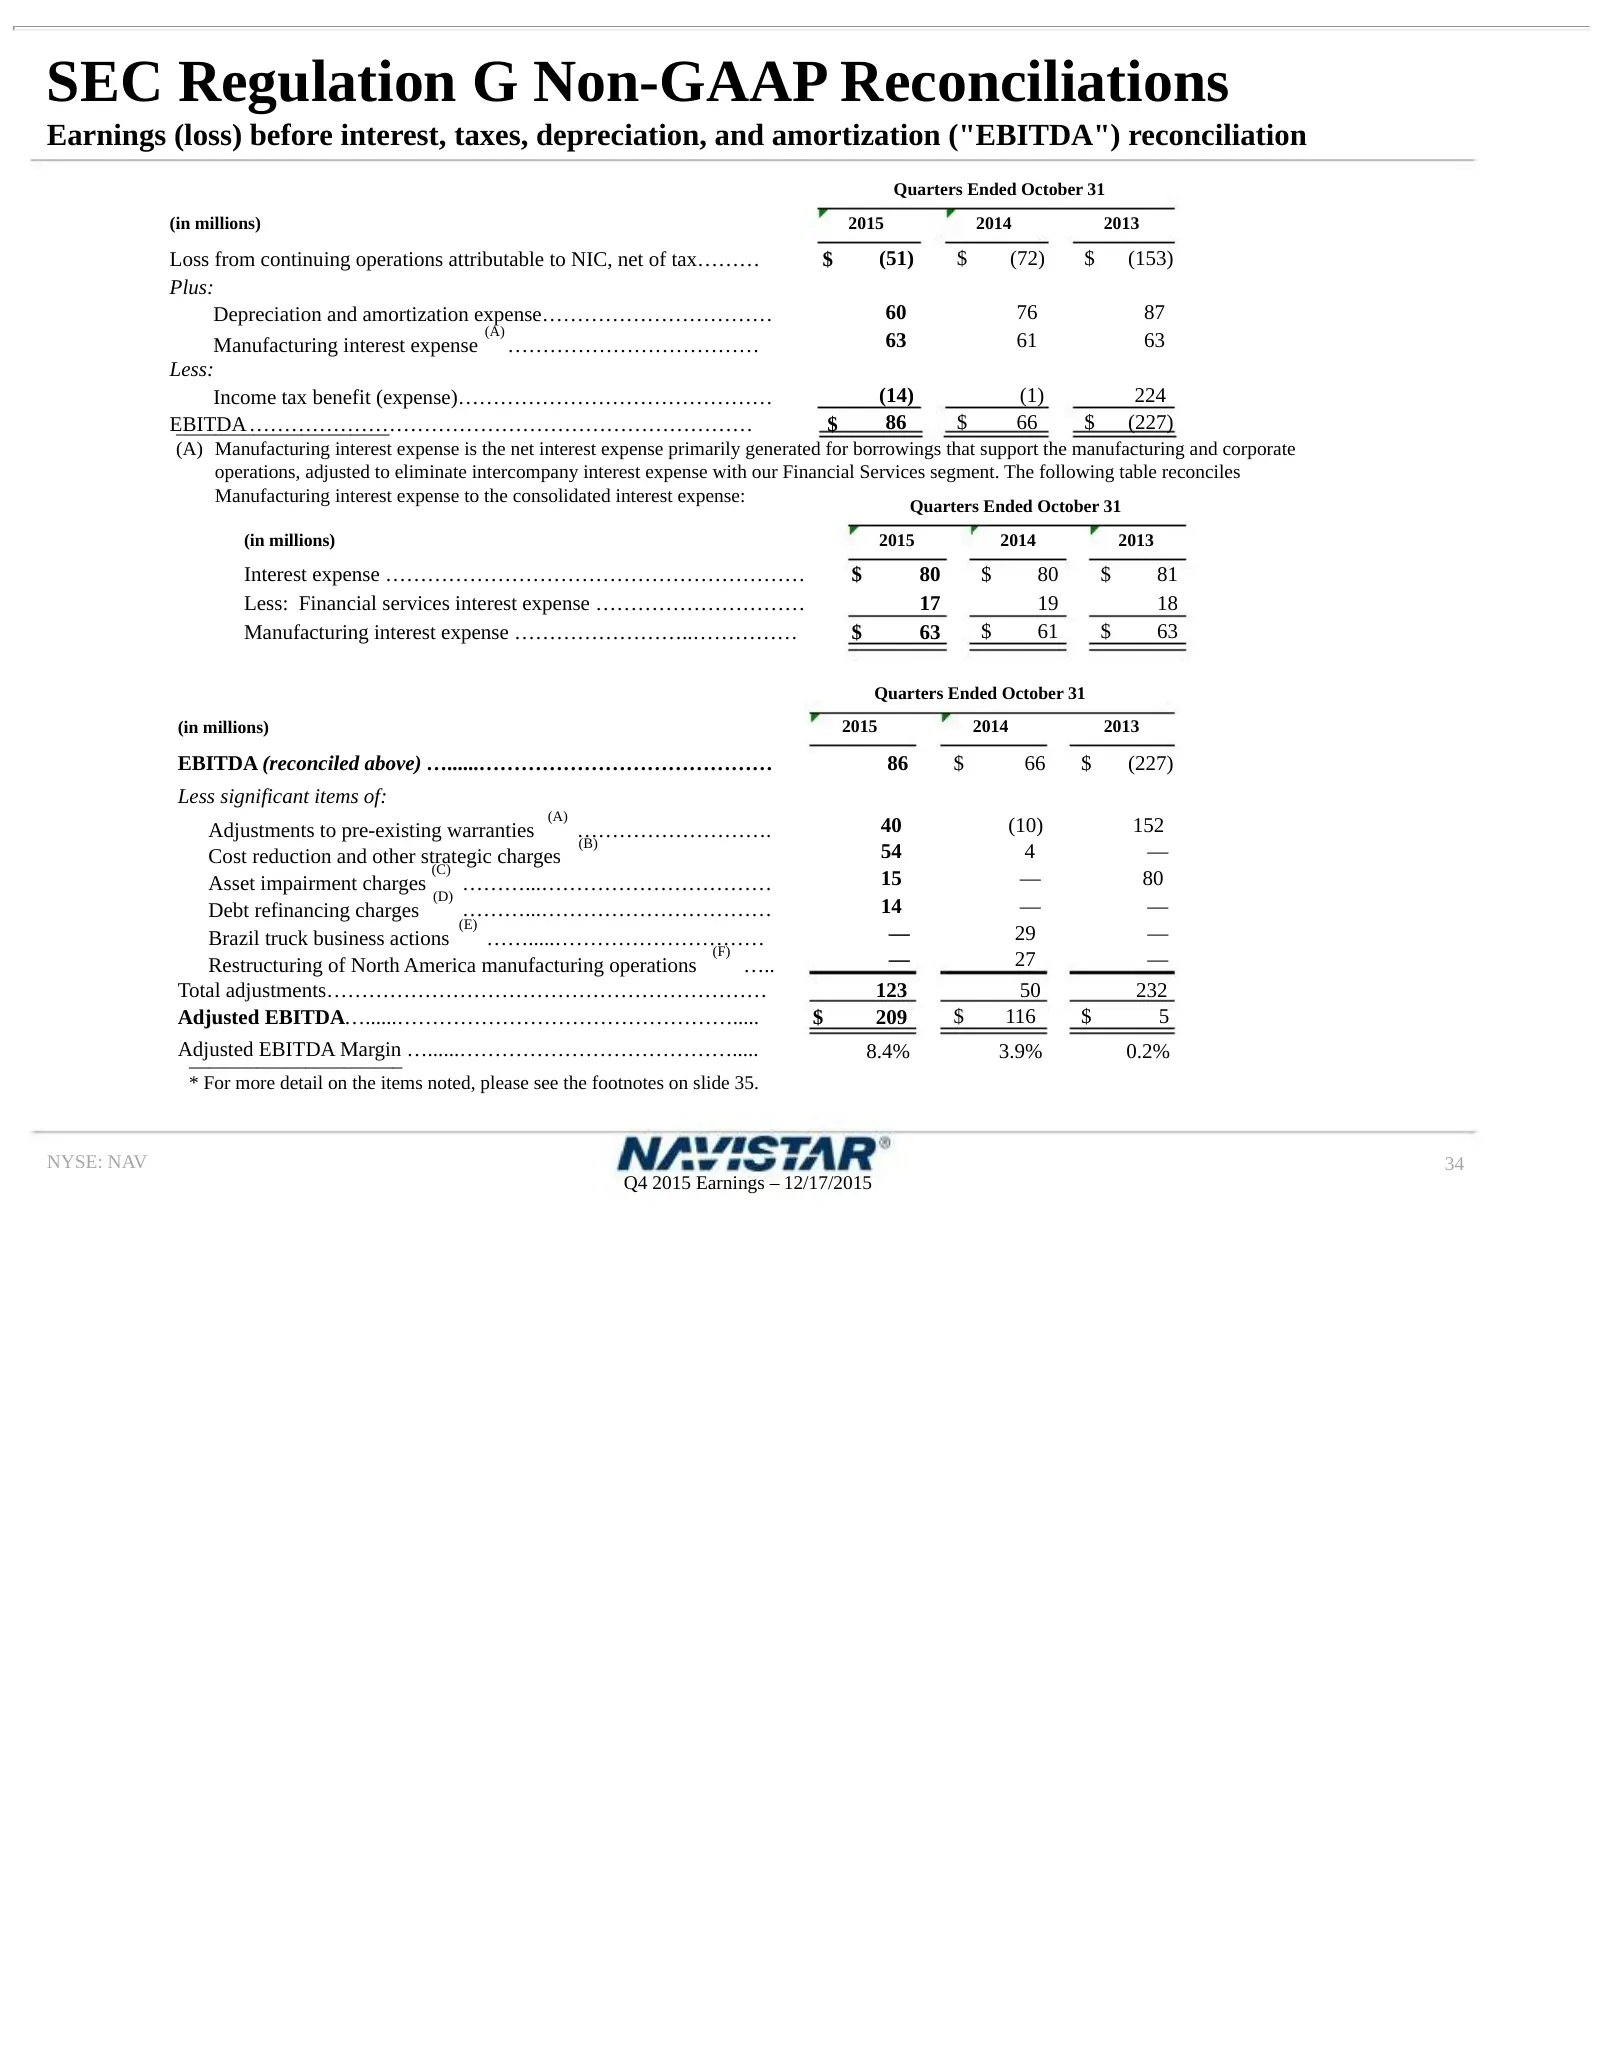
SEC Regulation G Non-GAAP Reconciliations Earnings (loss) before interest, taxes, depreciation, and amortization ("EBITDA") reconciliation Quarters Ended October 31 (in millions) 2015 2014 2013 Loss from continuing operations attributable to NIC, net of tax……… $ (51) $ (72) $ (153) Plus: Depreciatio
Slide 35: Significant Items Included Within Our Results
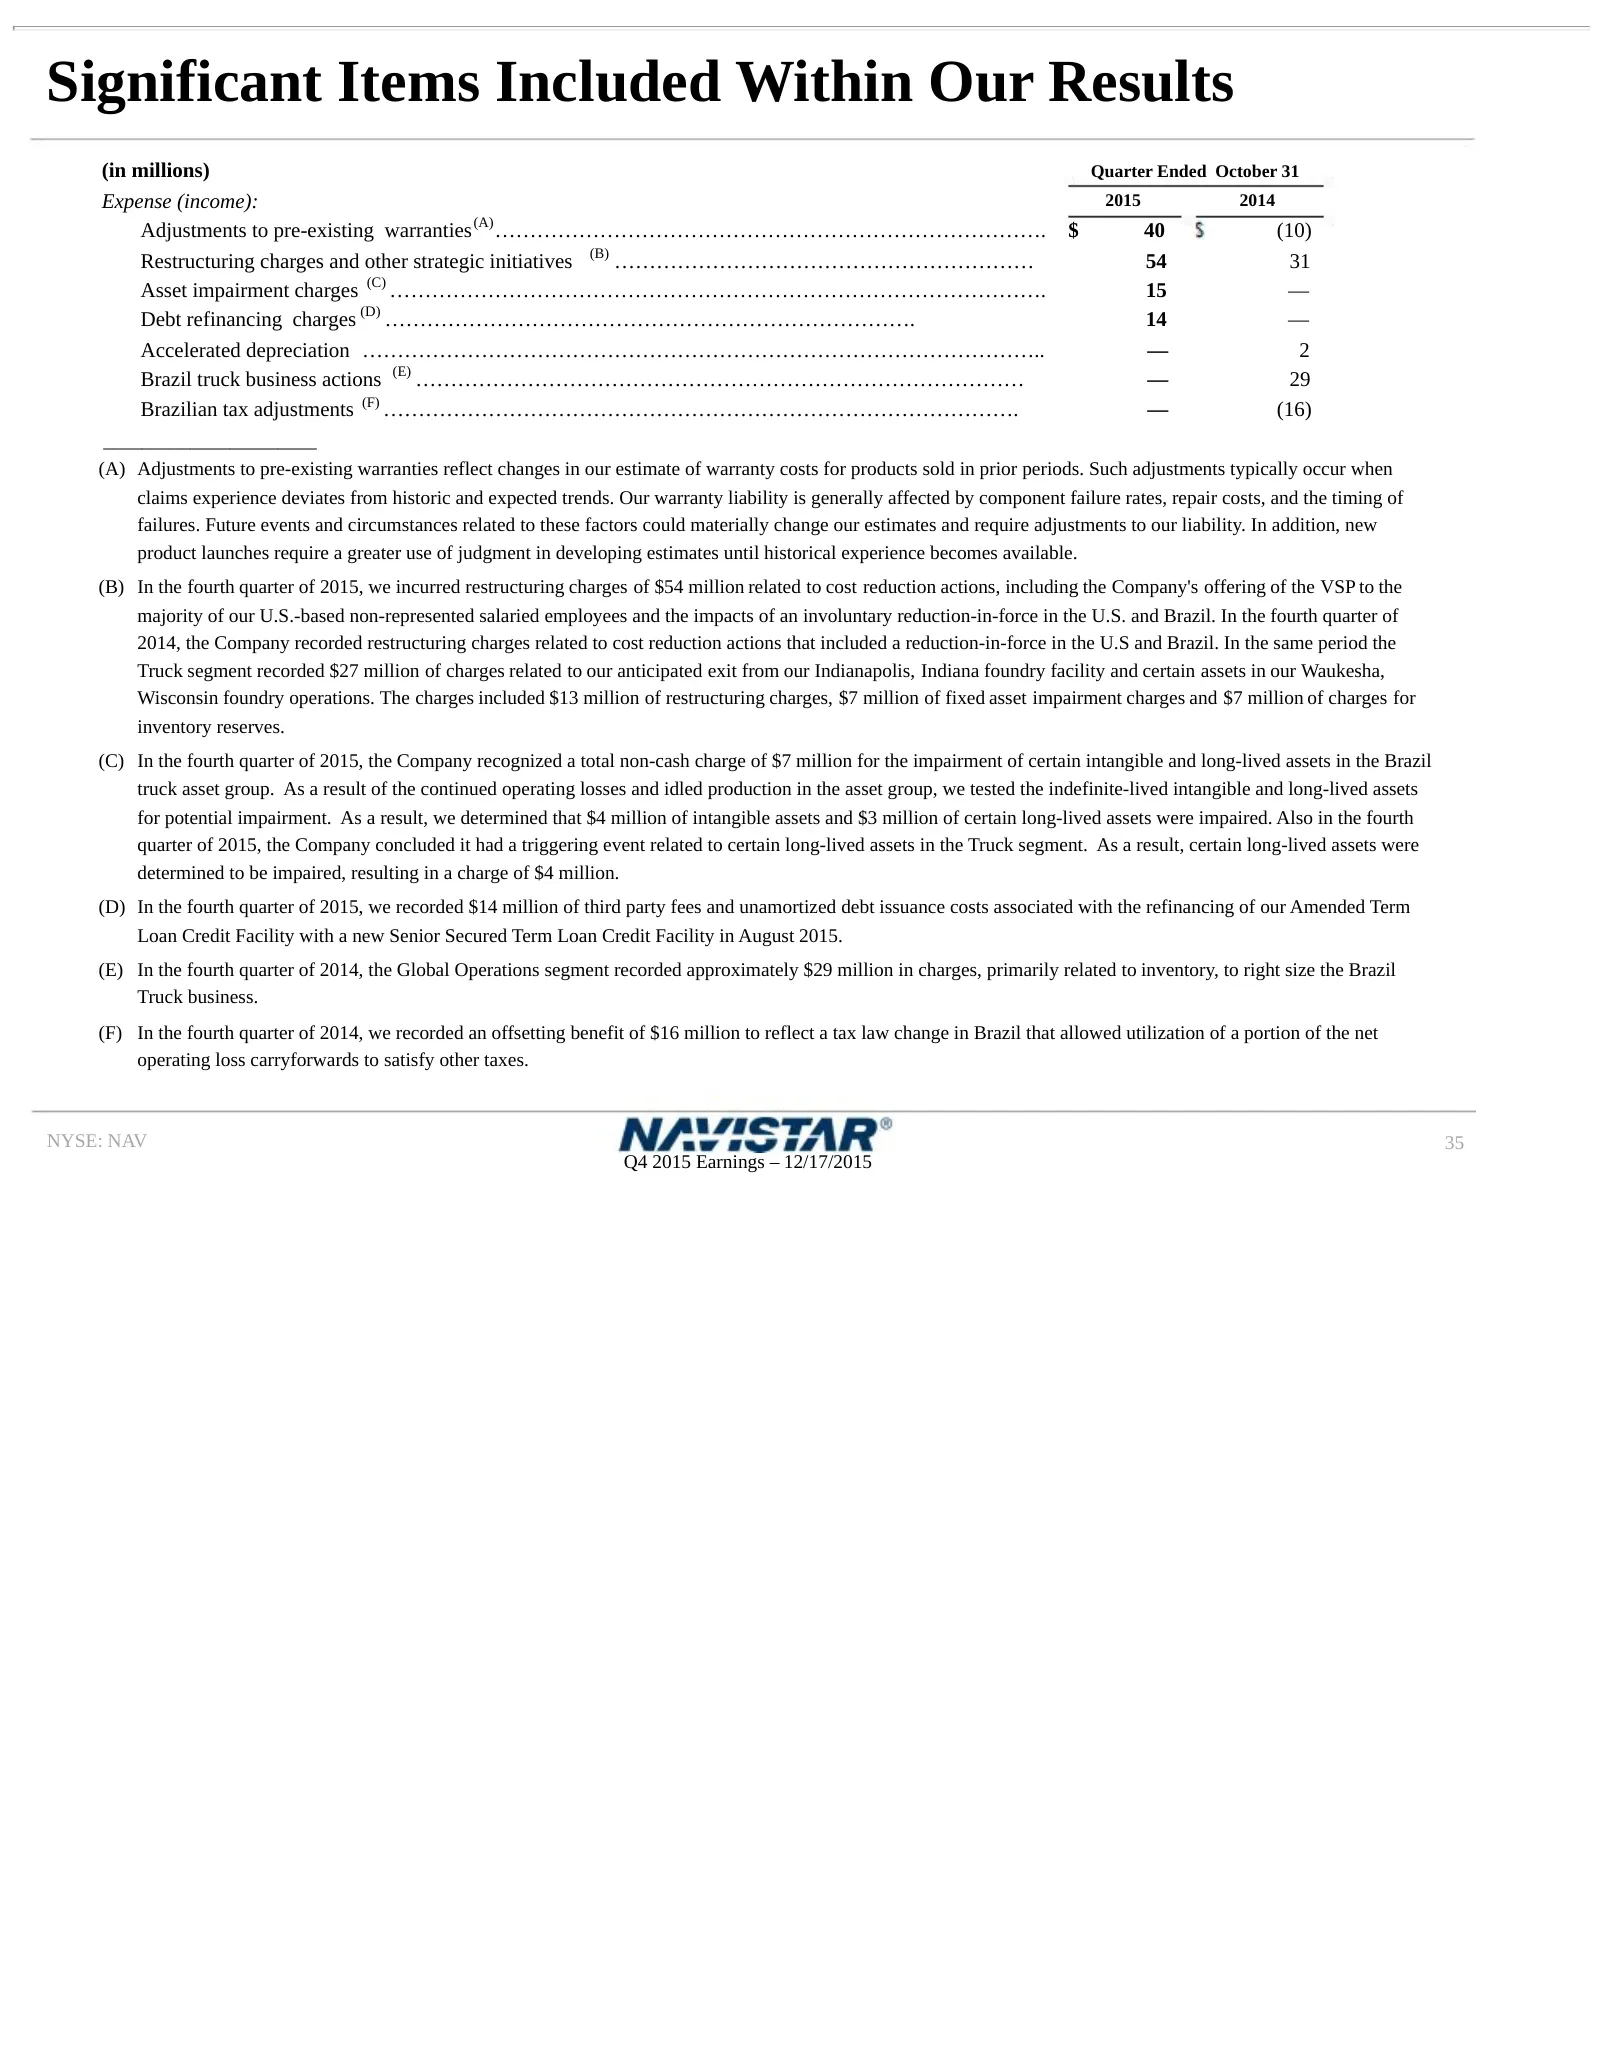
Significant Items Included Within Our Results (in millions) Quarter Ended October 31 Expense (income): 2015 2014 Adjustments to pre-existing warranties (A) ……………………………………………………………………. $ 40 (10) Restructuring charges and other strategic initiatives (B) …………………………………………………… 54 31 Asset impairment char
Slide 36: SEC Regulation G Non-GAAP Reconciliations
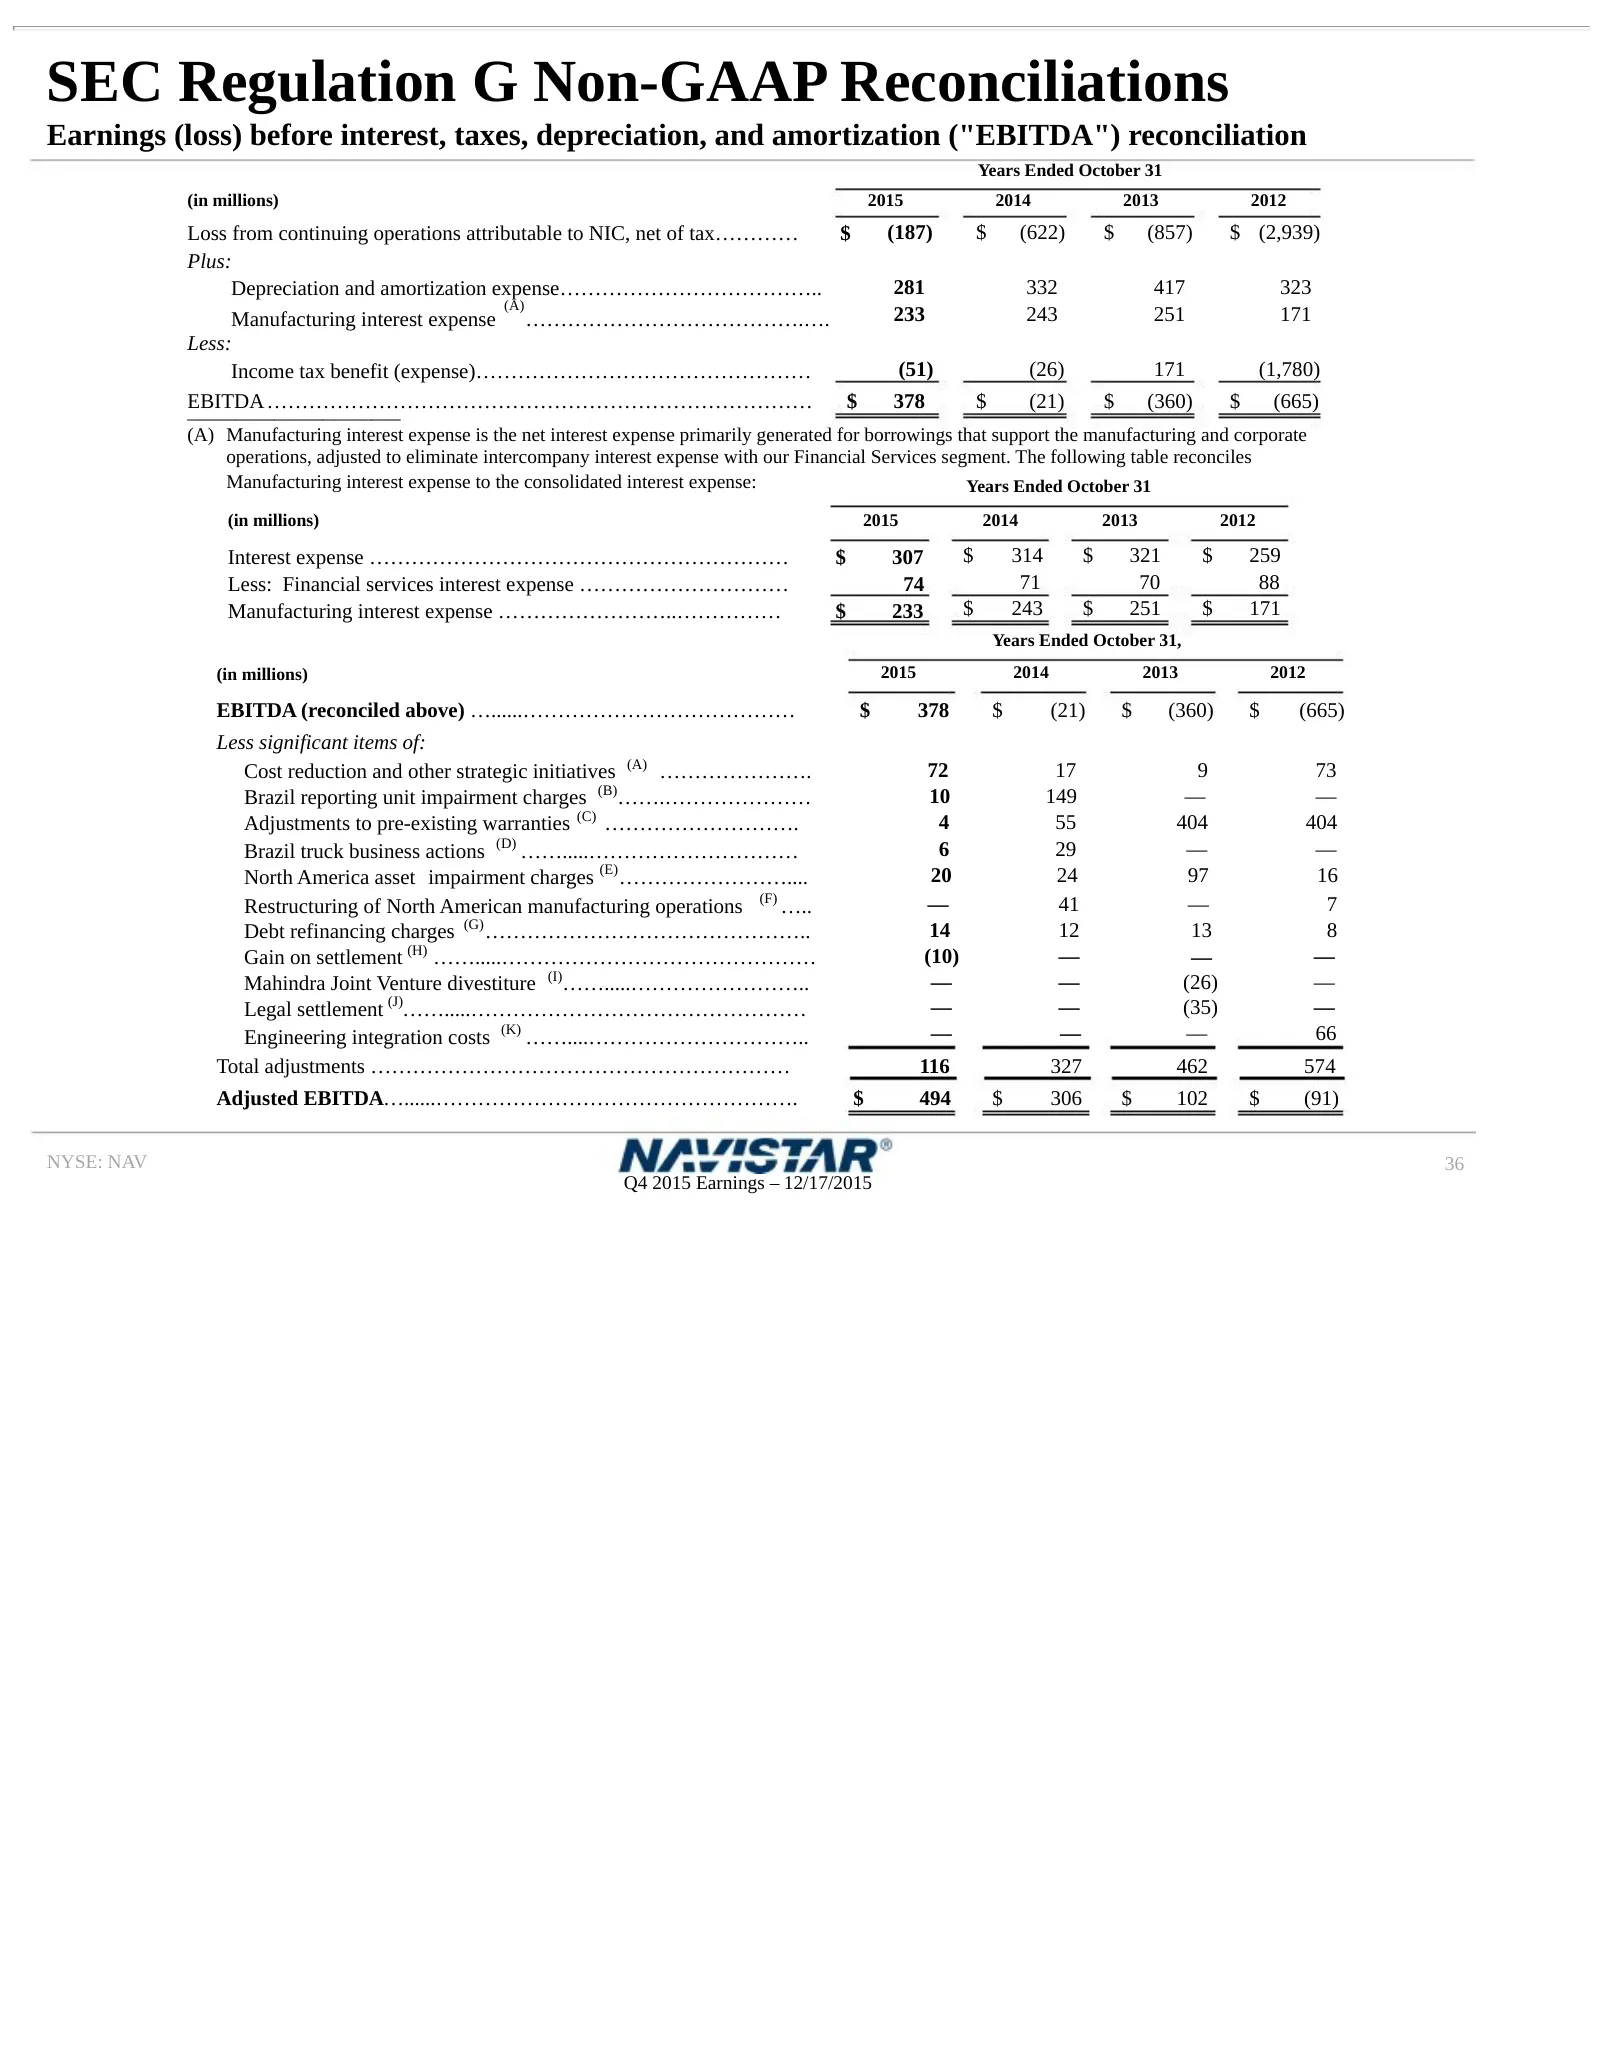
SEC Regulation G Non-GAAP Reconciliations Earnings (loss) before interest, taxes, depreciation, and amortization ("EBITDA") reconciliation Years Ended October 31 (in millions) 2015 2014 2013 2012 Loss from continuing operations attributable to NIC, net of tax………… $ (187) $ (622) $ (857) $ (2,939) Pl
Slide 37: SEC Regulation G Non-GAAP Reconciliations
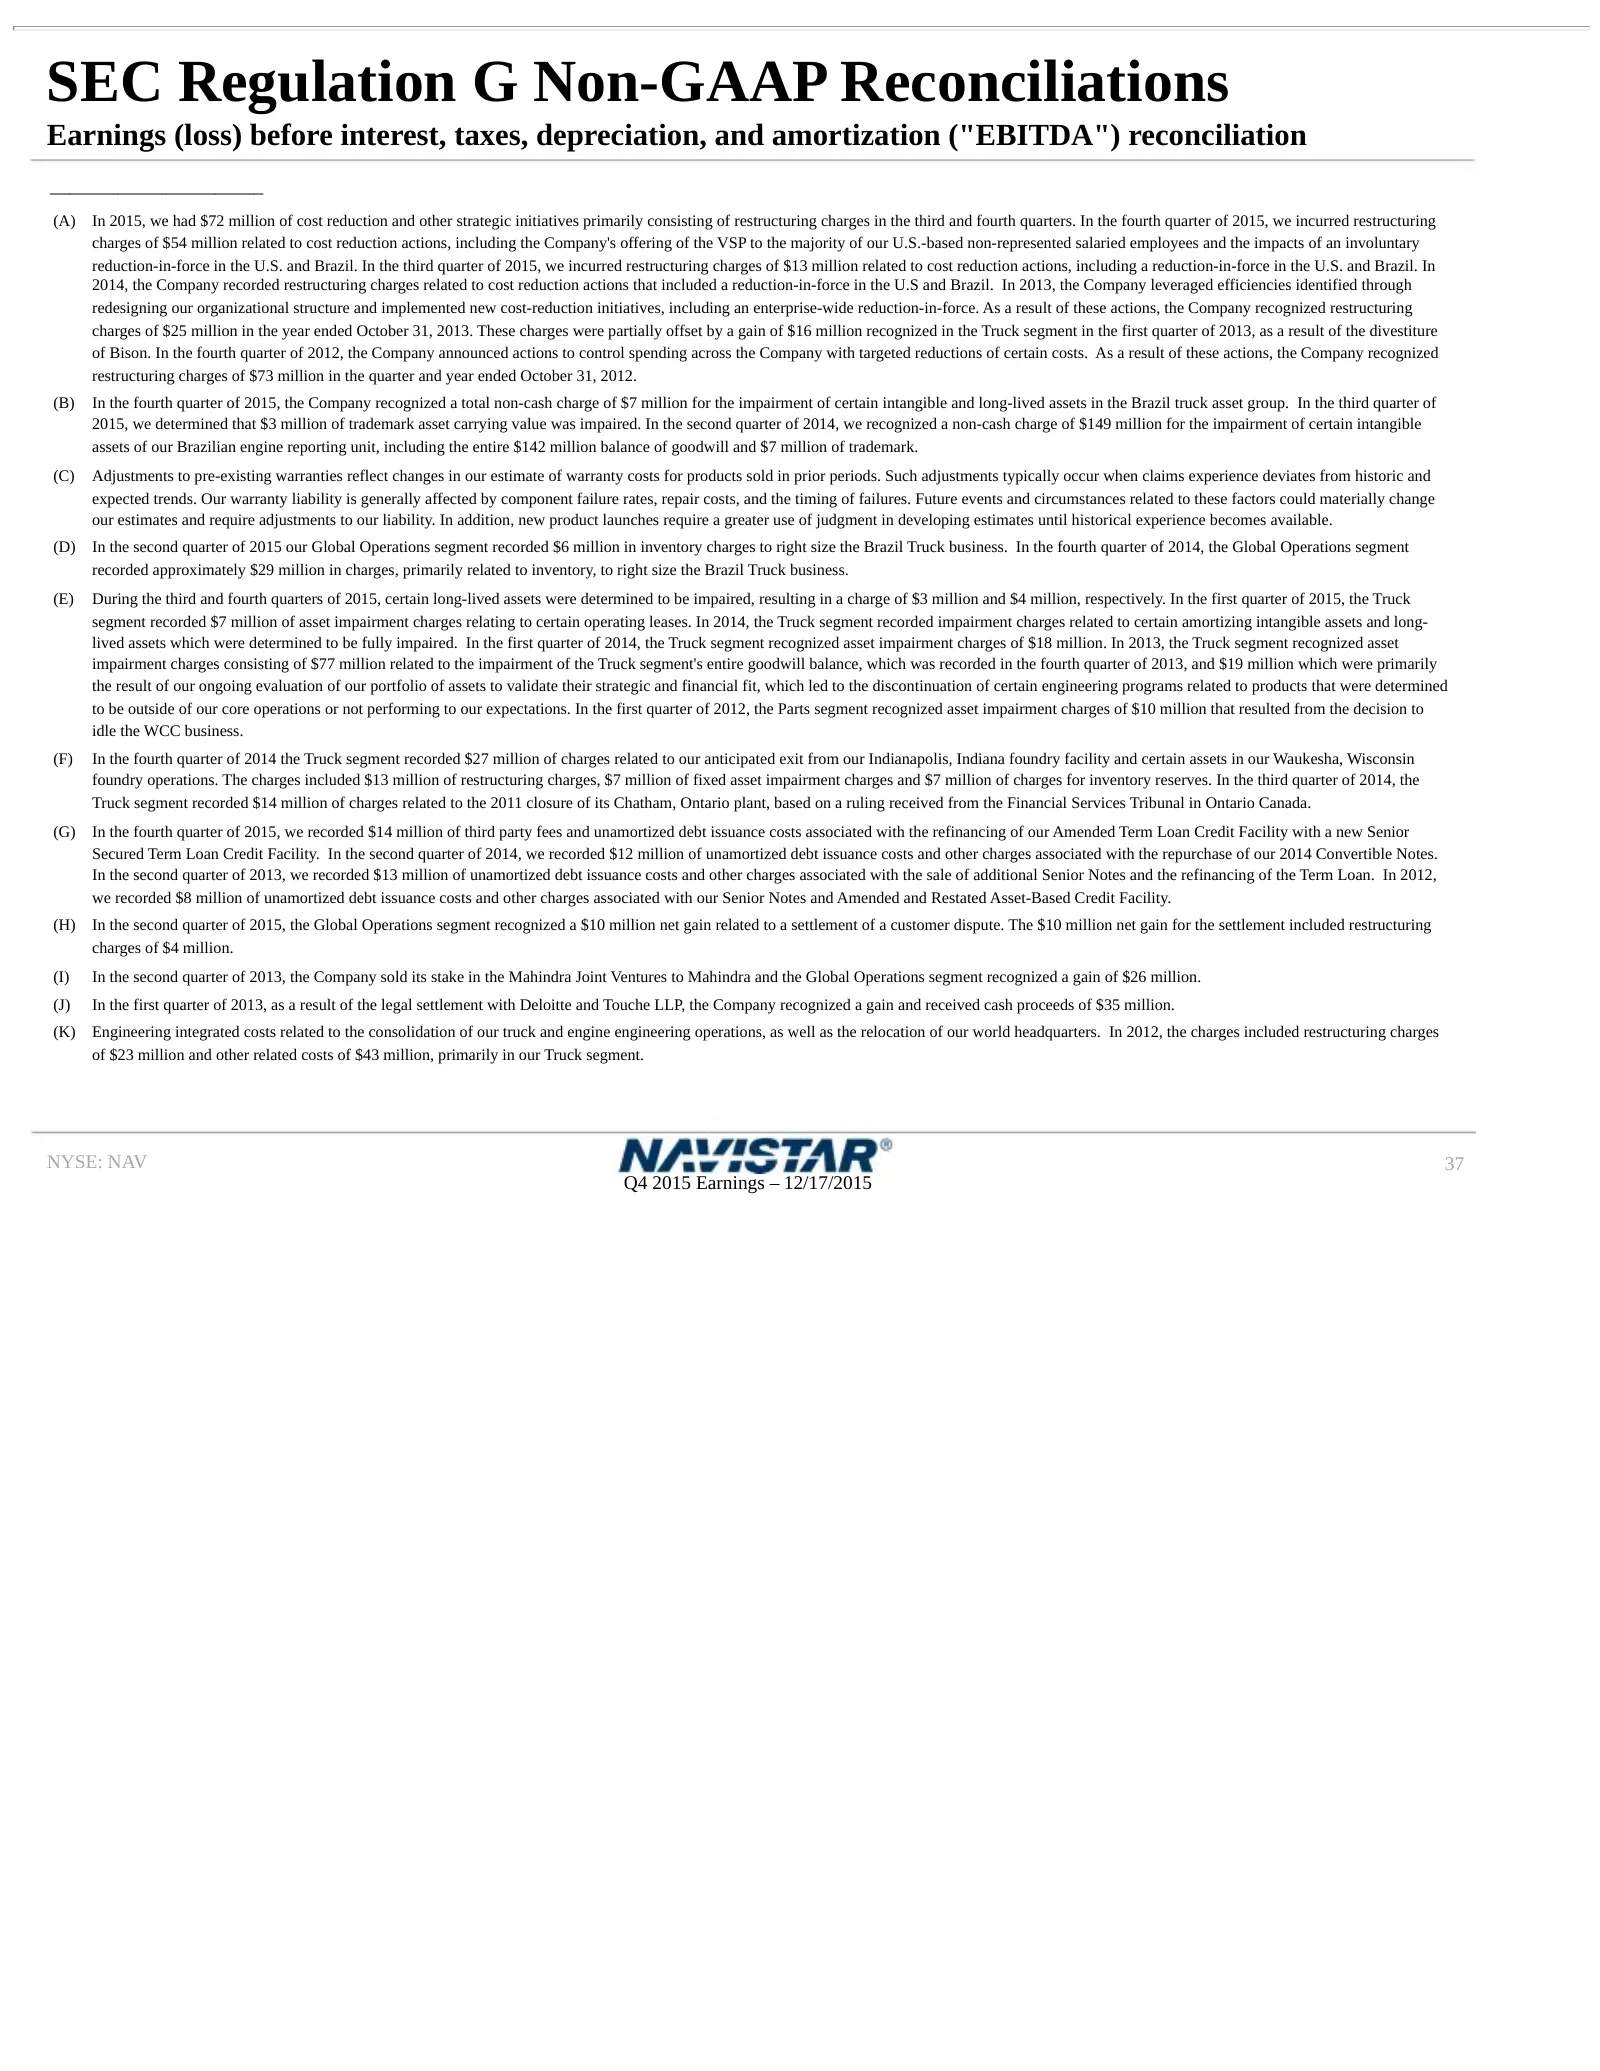
SEC Regulation G Non-GAAP Reconciliations Earnings (loss) before interest, taxes, depreciation, and amortization ("EBITDA") reconciliation ______________________ (A) In 2015, we had $72 million of cost reduction and other strategic initiatives primarily consisting of restructuring charges in the thi
Slide 38: Significant Items Included Within Our Results
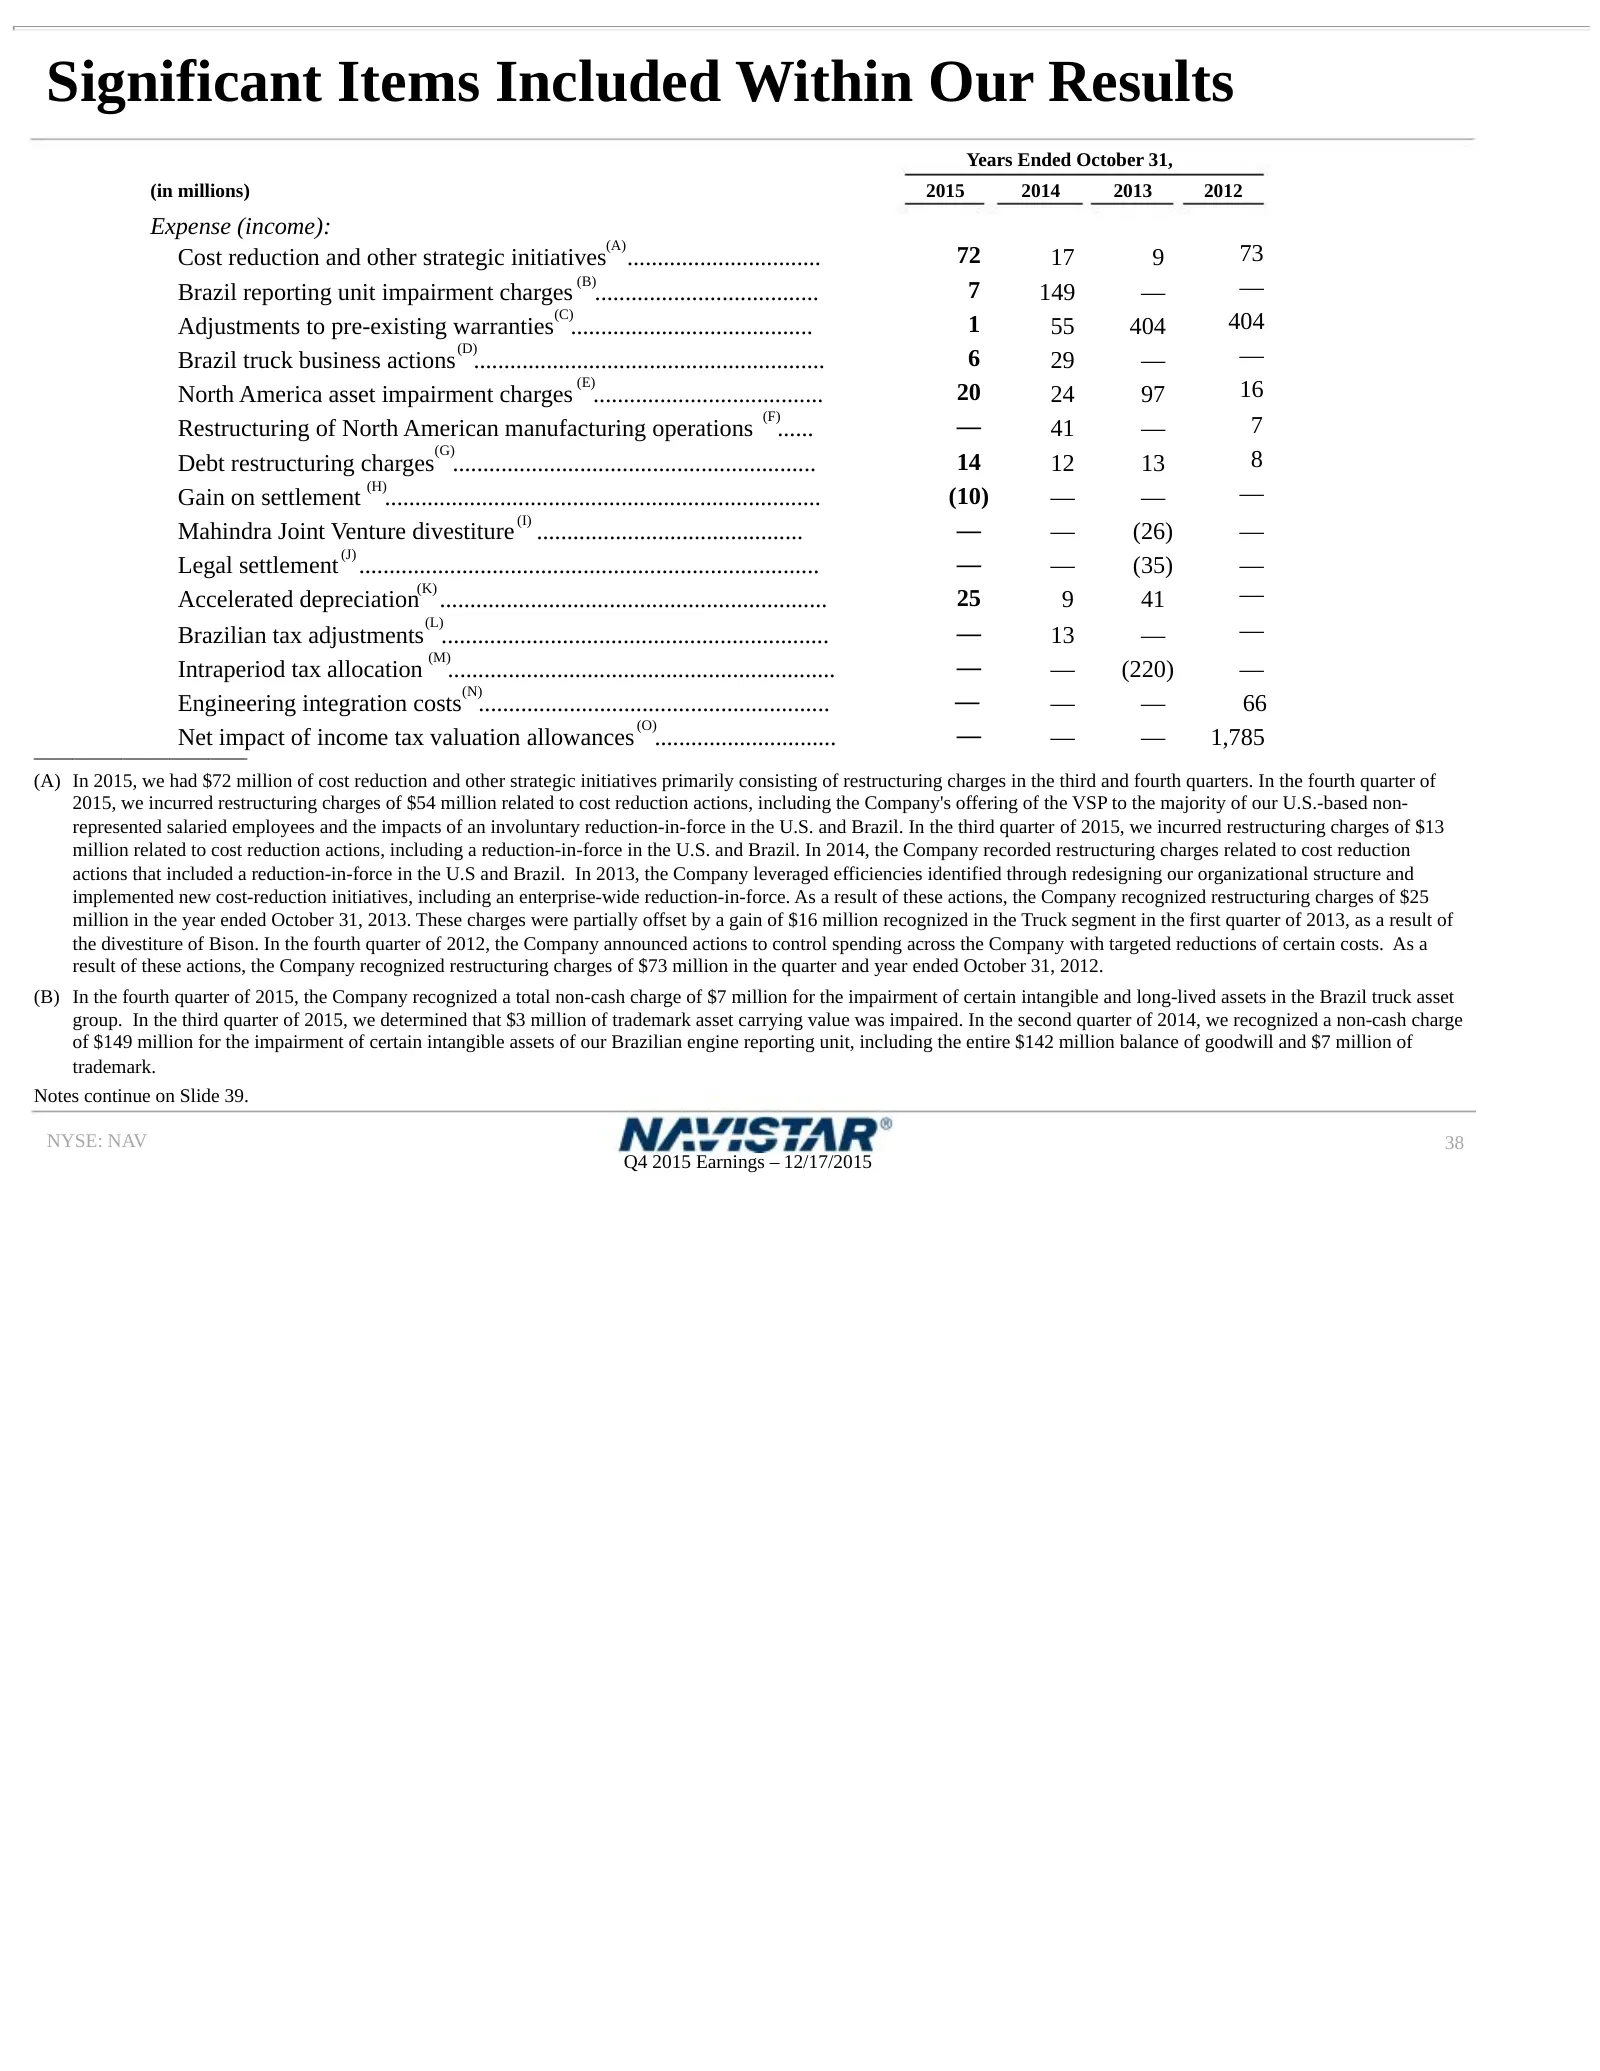
Significant Items Included Within Our Results Years Ended October 31, (in millions) 2015 2014 2013 2012 Expense (income): (A) Cost reduction and other strategic initiatives ................................ 72 17 9 73 (B) Brazil reporting unit impairment charges .....................................
Slide 39: Significant Items Included Within Our Results
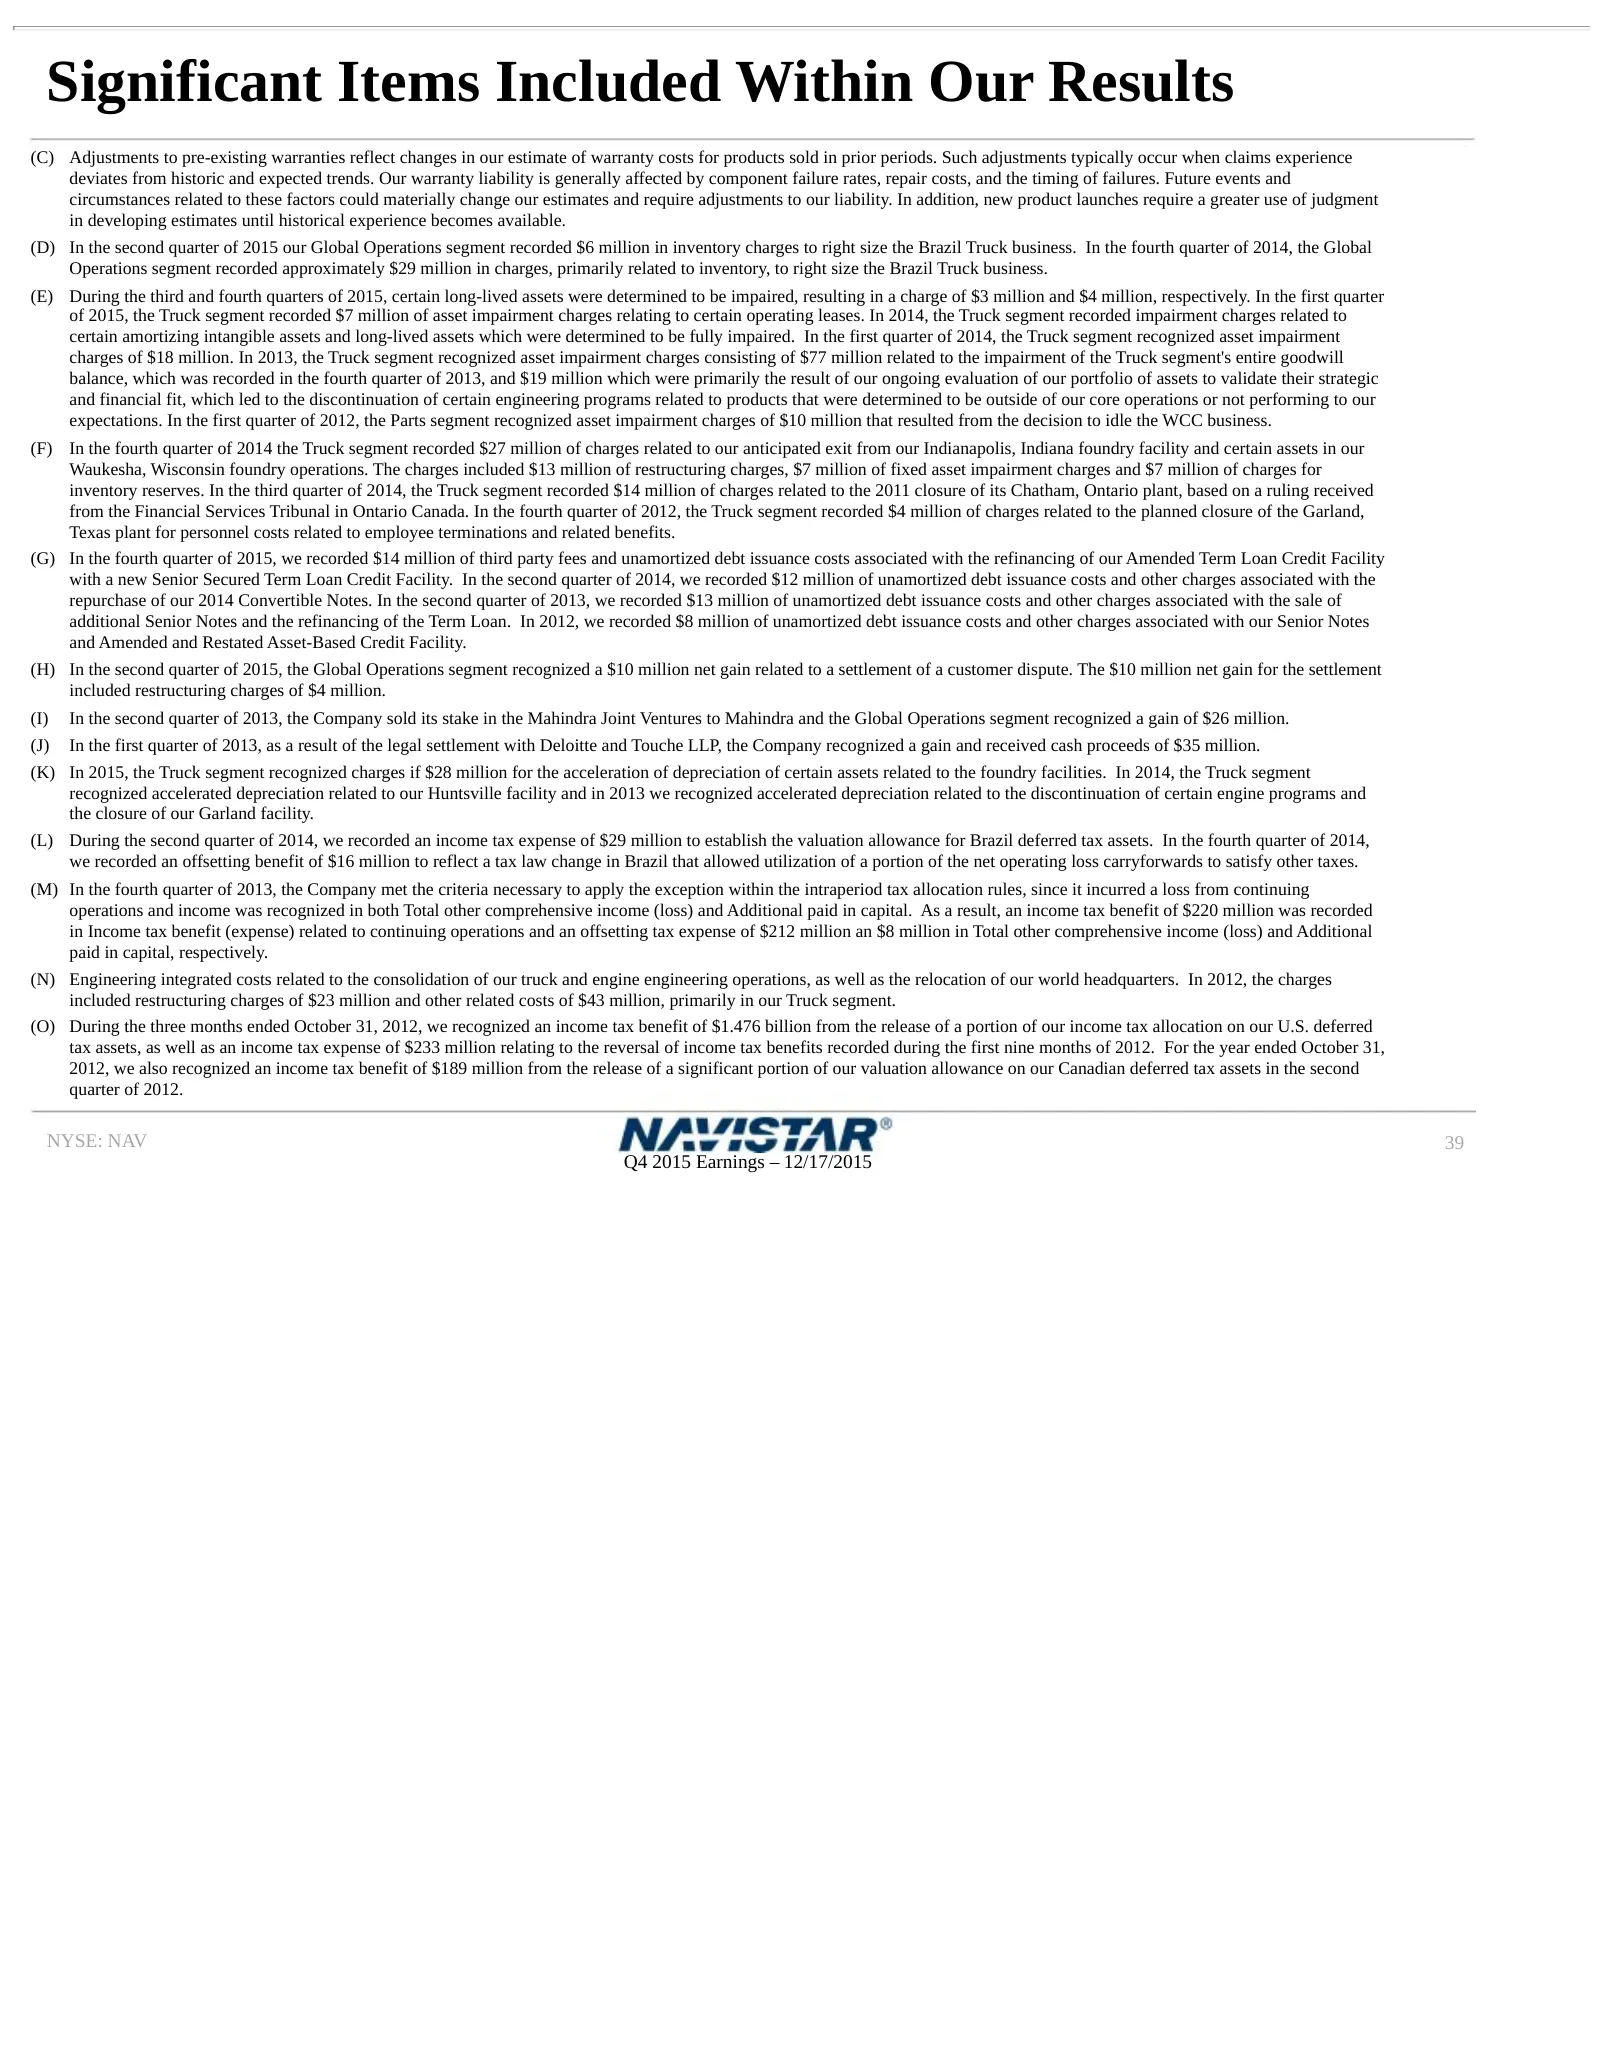
Significant Items Included Within Our Results (C) Adjustments to pre-existing warranties reflect changes in our estimate of warranty costs for products sold in prior periods. Such adjustments typically occur when claims experience deviates from historic and expected trends. Our warranty liability is
Source: SEC EDGAR · 8-K filed Dec 17, 2015
More decks from Navistar International Corporation
 Q2 2021 Earnings Presentation20 slides · Jun 8, 2021
 Q1 2021 Earnings Presentation20 slides · Mar 9, 2021
 Q4 2020 Earnings Presentation22 slides · Dec 17, 2020
 Q3 2020 Earnings Presentation21 slides · Sep 9, 2020
 Q2 2020 Earnings Presentation21 slides · Jun 4, 2020
 Q1 2020 Earnings Presentation21 slides · Mar 4, 2020