Navistar International Corporation
Navistar International — Q1 2020 Earnings Presentation
21 slides from Navistar International's earnings presentation, Mar 4, 2020
Slide 1: Q1 2020 Earnings Presentation
Q1 2020 EARNINGS PRESENTATION March 4, 2020 Exhibit 99.2
Slide 2: Safe Harbor Statement and Other Cautionary Notes
Safe Harbor Statement and Other Cautionary Notes Information provided and statements contained in this presentation that are not purely historical are forward-looking statements within the meaning of Section 27A of the Securities Act of 1933, as amended ("Securities Act"), Section 21E of the Securit
Slide 3: First Quarter 2020 Summary
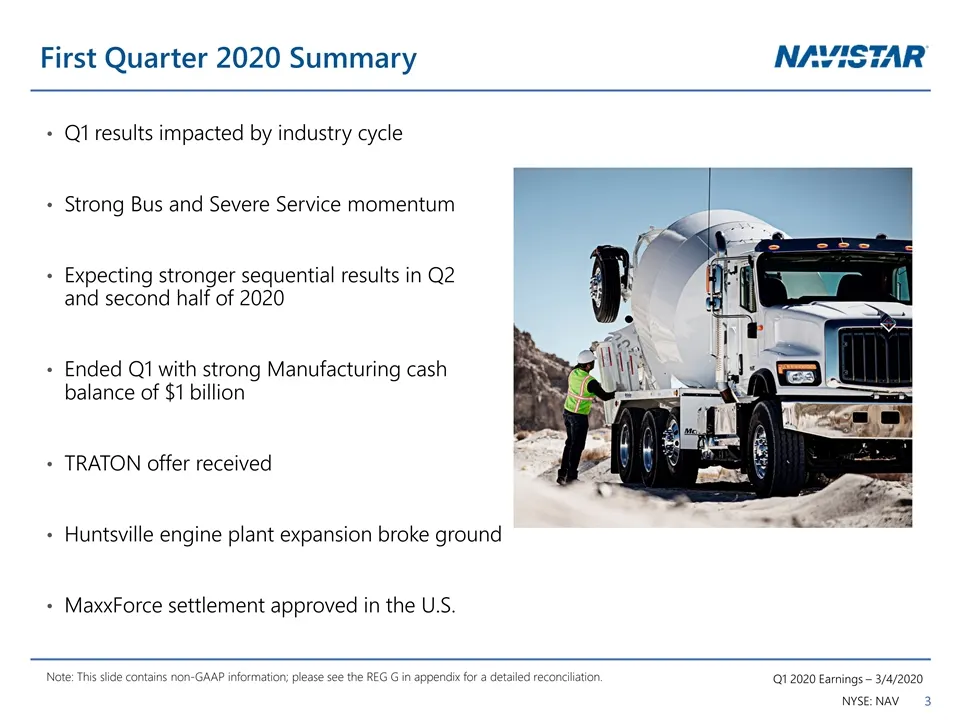
Q1 results impacted by industry cycle Strong Bus and Severe Service momentum Expecting stronger sequential results in Q2 and second half of 2020 Ended Q1 with strong Manufacturing cash balance of $1 billion TRATON offer received Huntsville engine plant expansion broke ground MaxxForce settlement app
Slide 4: First Quarter 2020 Consolidated Results
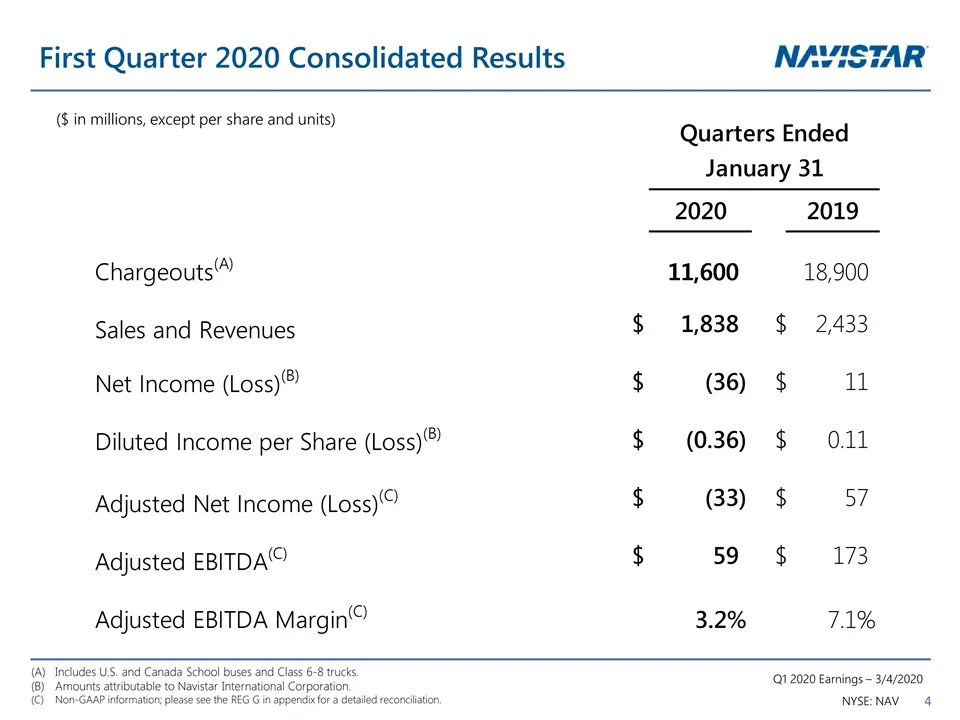
First Quarter 2020 Consolidated Results ($ in millions, except per share and units) Includes U.S. and Canada School buses and Class 6-8 trucks. Amounts attributable to Navistar International Corporation. Non-GAAP information; please see the REG G in appendix for a detailed reconciliation.
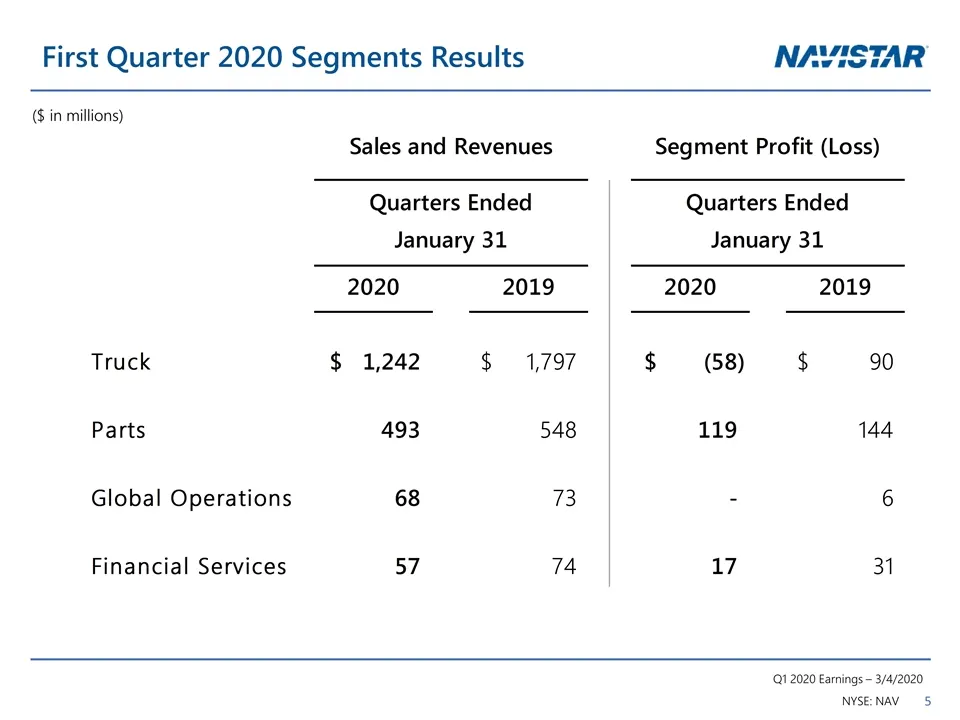
Slide 5: First Quarter 2020 Segments Results
First Quarter 2020 Segments Results ($ in millions)
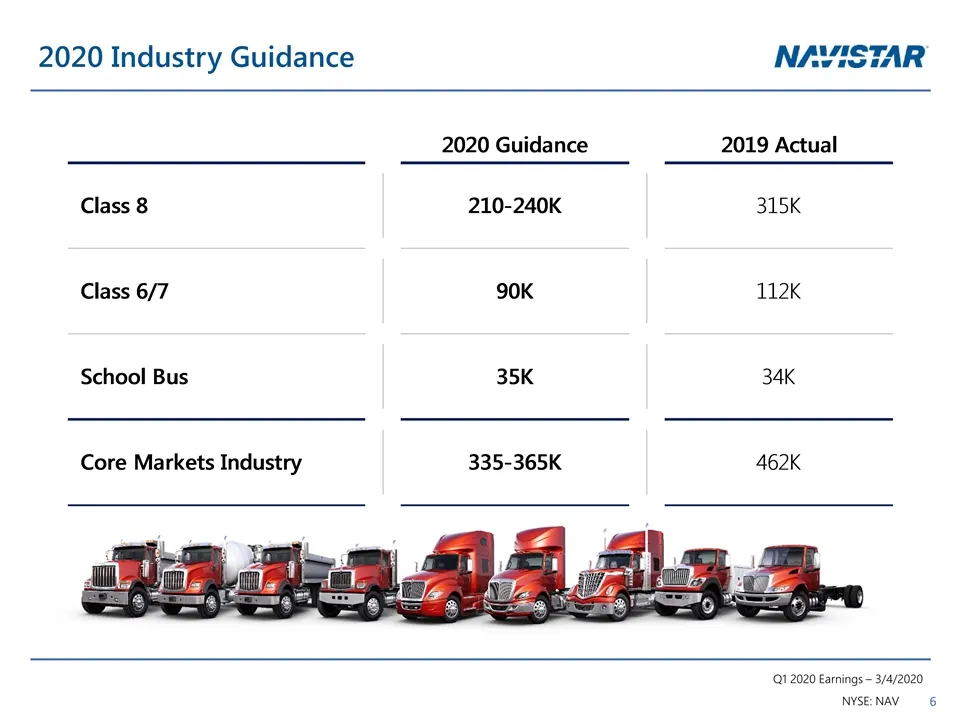
Slide 6: 2020 Industry Guidance
2020 Industry Guidance 2020 Guidance 2019 Actual Class 8 210-240K 315K Class 6/7 90K 112k School Bus 35K 34K Core Markets Industry 335-365K 462K Q1 2020 Earnings ~ 3/4/2020 NYSE: NAV
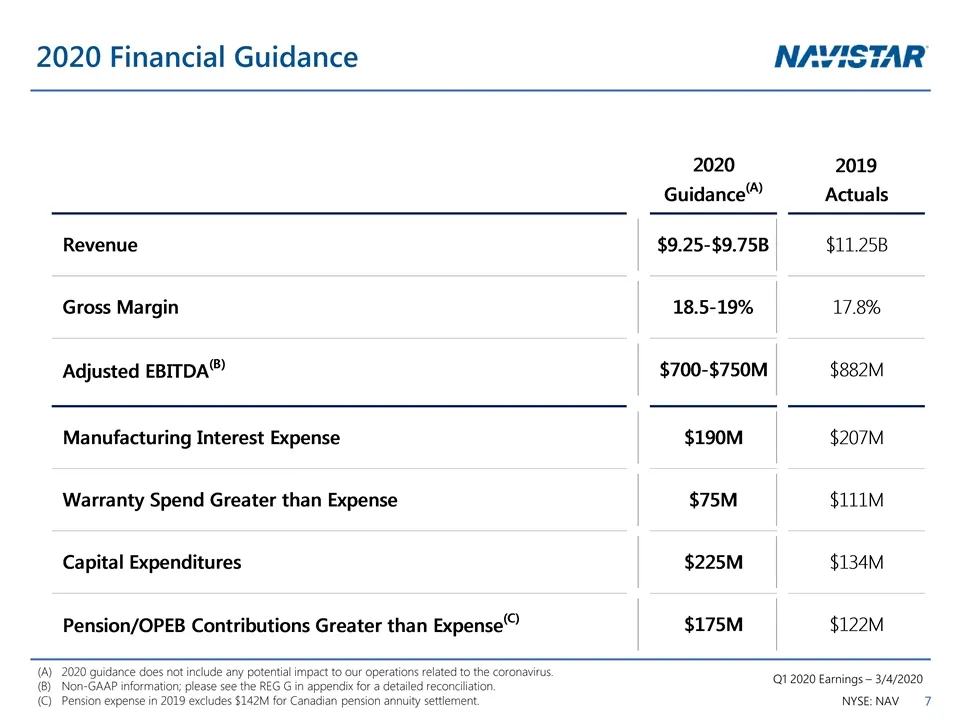
Slide 7: 2020 Financial Guidance
2020 Financial Guidance 2020 guidance does not include any potential impact to our operations related to the coronavirus. Non-GAAP information; please see the REG G in appendix for a detailed reconciliation. Pension expense in 2019 excludes $142M for Canadian pension annuity settlement.
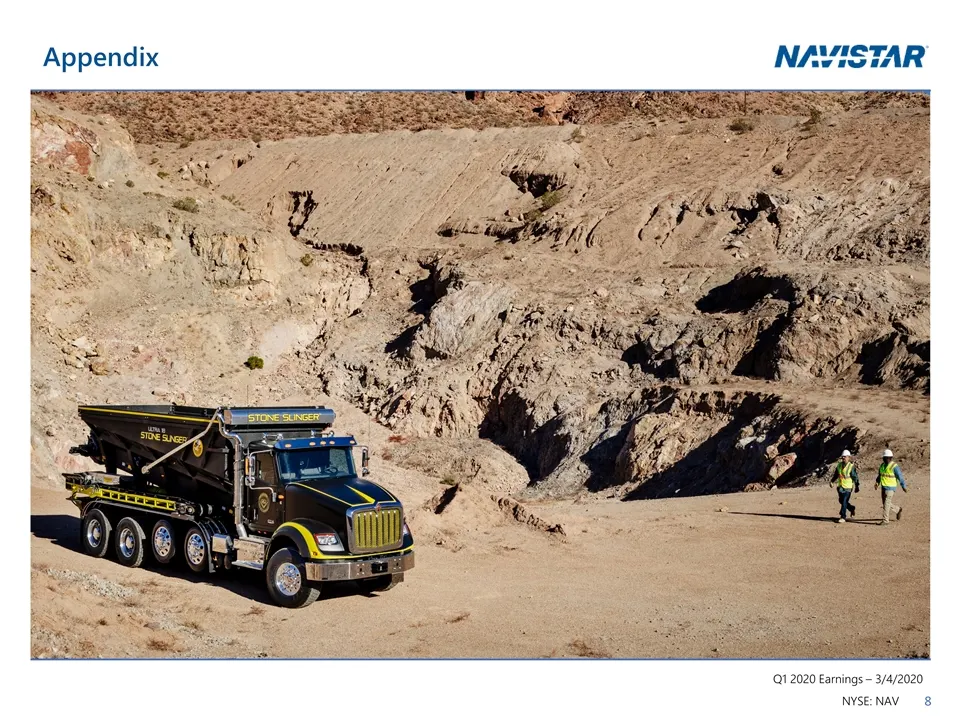
Slide 8: Appendix
Appendix 1 2020 Earnings ~ 3/4/2020 NYSE:NAV 8.
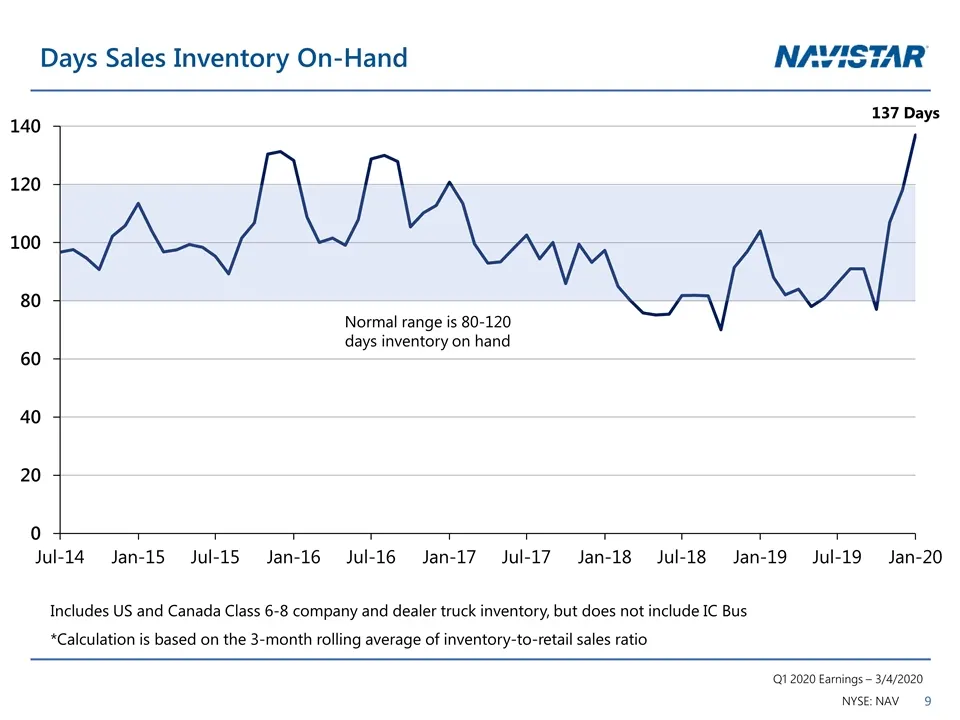
Slide 9: Days Sales Inventory On-Hand
137 Days Includes US and Canada Class 6-8 company and dealer truck inventory, but does not include IC Bus *Calculation is based on the 3-month rolling average of inventory-to-retail sales ratio Normal range is 80-120 days inventory on hand Days Sales Inventory On-Hand
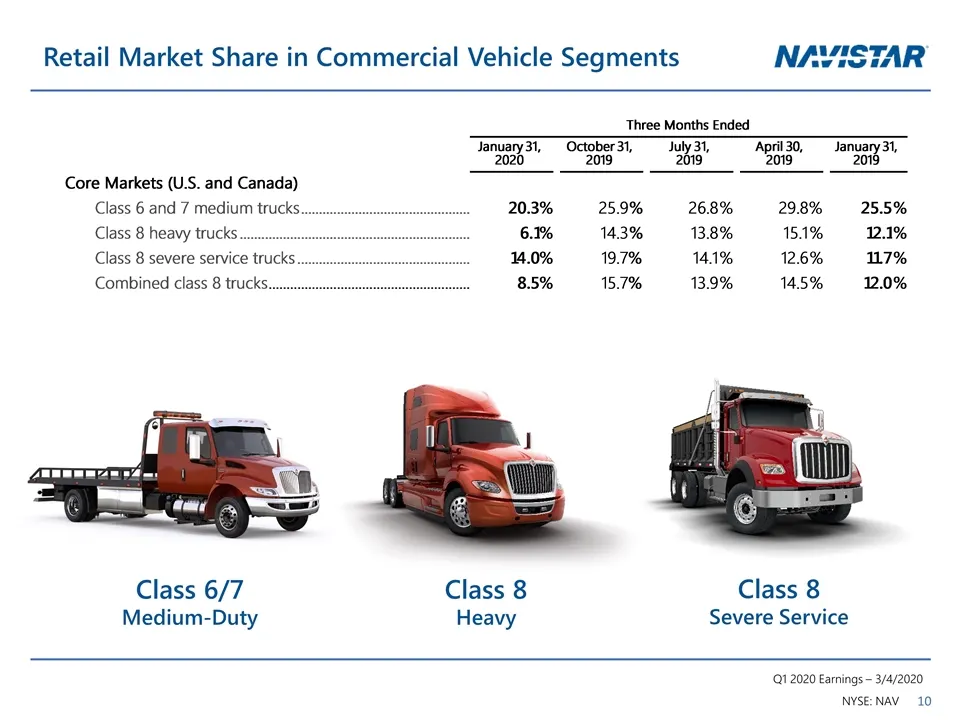
Slide 10: Retail Market Share in Commercial Vehicle Segments
Retail Market Share in Commercial Vehicle Segments Class 6/7 Medium-Duty Class 8 Severe Service Class 8 HeavyThree Months EndedJanuary 31, 2020October 31, 2019July 31, 2019April 30, 2019January 31, 2019Core Markets (U.S. and Canada)Class 6 and 7 medium trucks20.3%25.9%26.8%29.8%25.5%Class 8 heavy tr
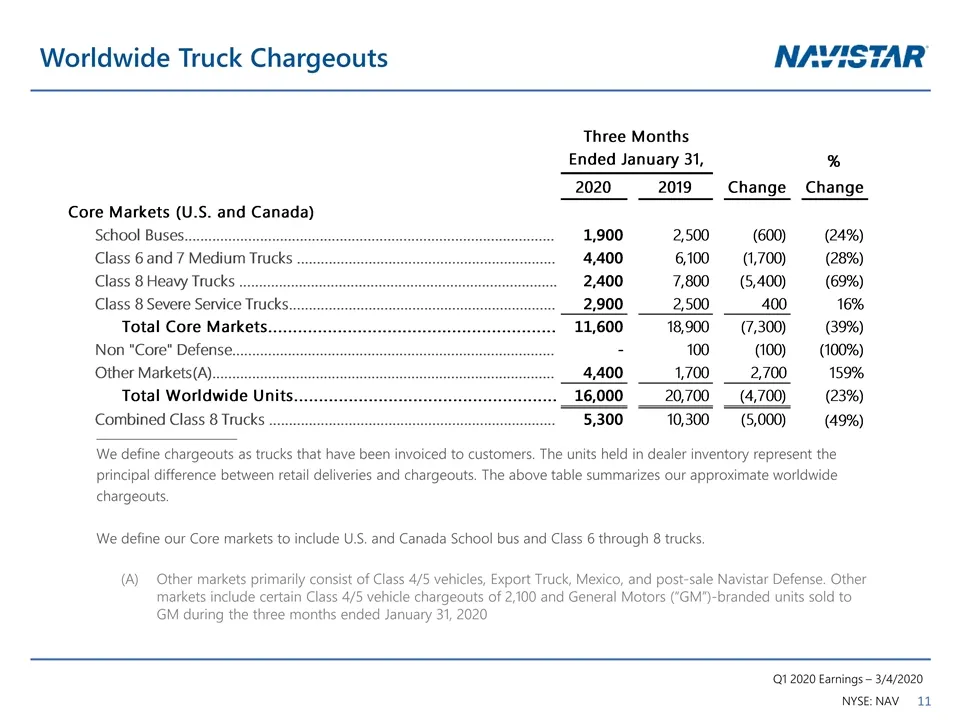
Slide 11: Worldwide Truck Chargeouts
Worldwide Truck Chargeouts _______________________ We define chargeouts as trucks that have been invoiced to customers. The units held in dealer inventory represent the principal difference between retail deliveries and chargeouts. The above table summarizes our approximate worldwide chargeouts. We
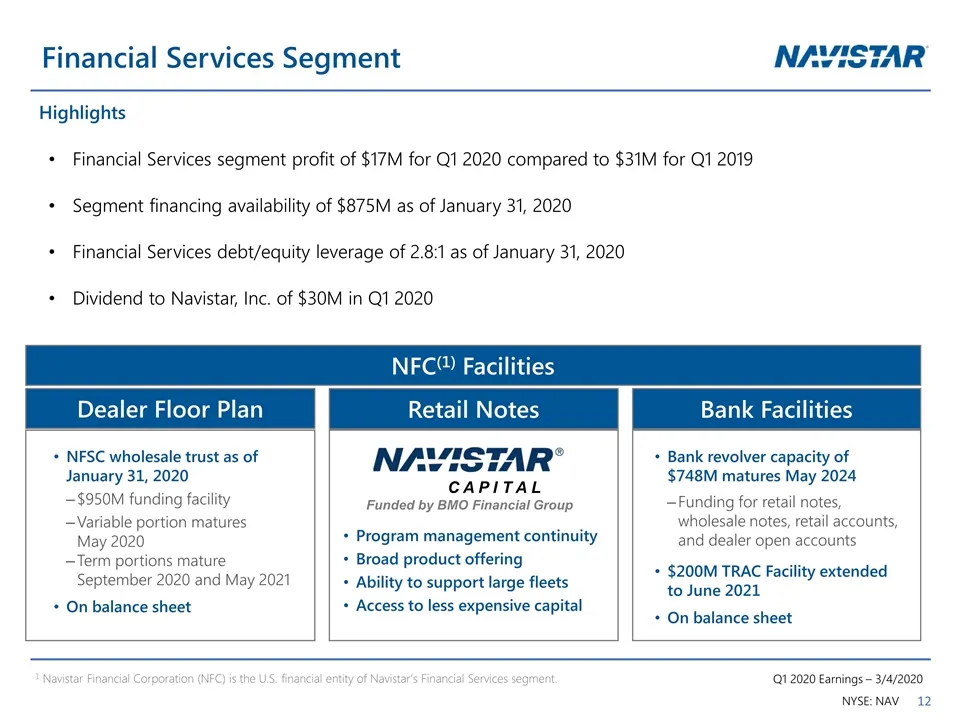
Slide 12: Financial Services Segment Highlights
Financial Services Segment Highlights Financial Services segment profit of $17M for Q1 2020 compared to $31M for Q1 2019 Segment financing availability of $875M as of January 31, 2020 Financial Services debt/equity leverage of 2.8:1 as of January 31, 2020 Dividend to Navistar, Inc. of $30M in Q1 202
Slide 13: Strong Cash Balance, No Near-Term Manufacturing Debt
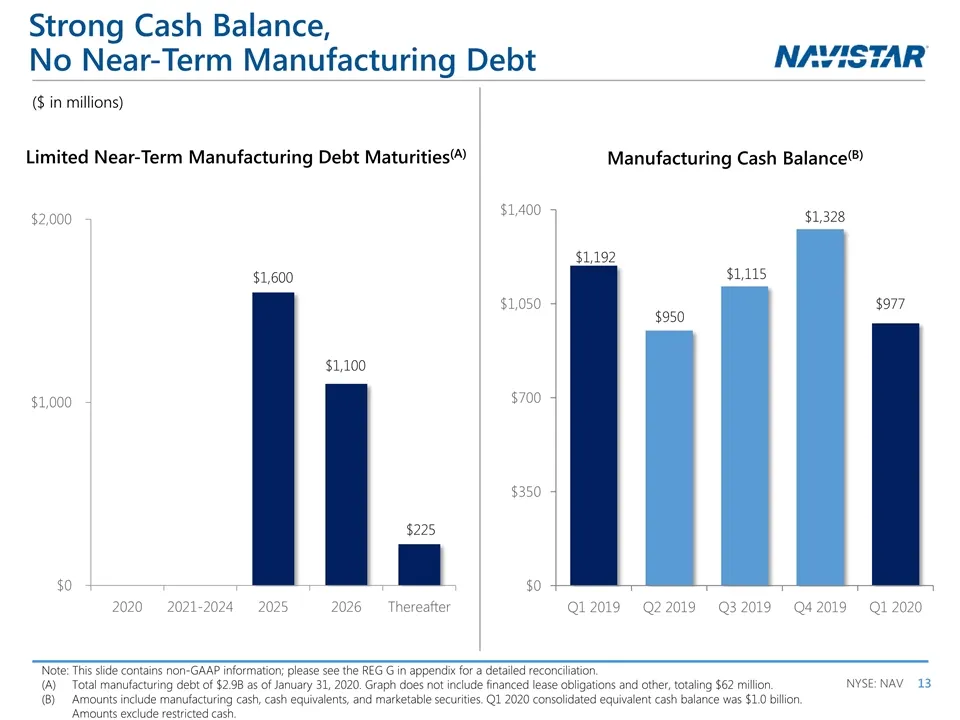
Strong Cash Balance, No Near-Term Manufacturing Debt Manufacturing Cash Balance(B) Note: This slide contains non-GAAP information; please see the REG G in appendix for a detailed reconciliation. Total manufacturing debt of $2.9B as of January 31, 2020. Graph does not include financed lease obligatio
Slide 14: Frequently Asked Questions
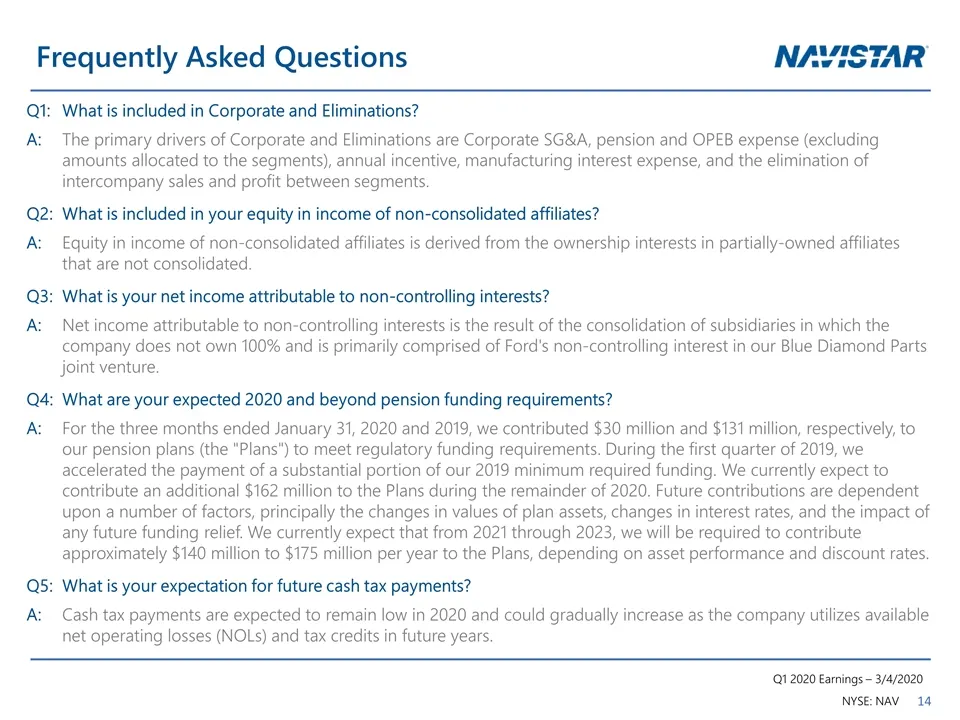
Frequently Asked Questions Q1: What is included in Corporate and Eliminations? A:The primary drivers of Corporate and Eliminations are Corporate SG&A, pension and OPEB expense (excluding amounts allocated to the segments), annual incentive, manufacturing interest expense, and the elimination of inte
Slide 15: Frequently Asked Questions
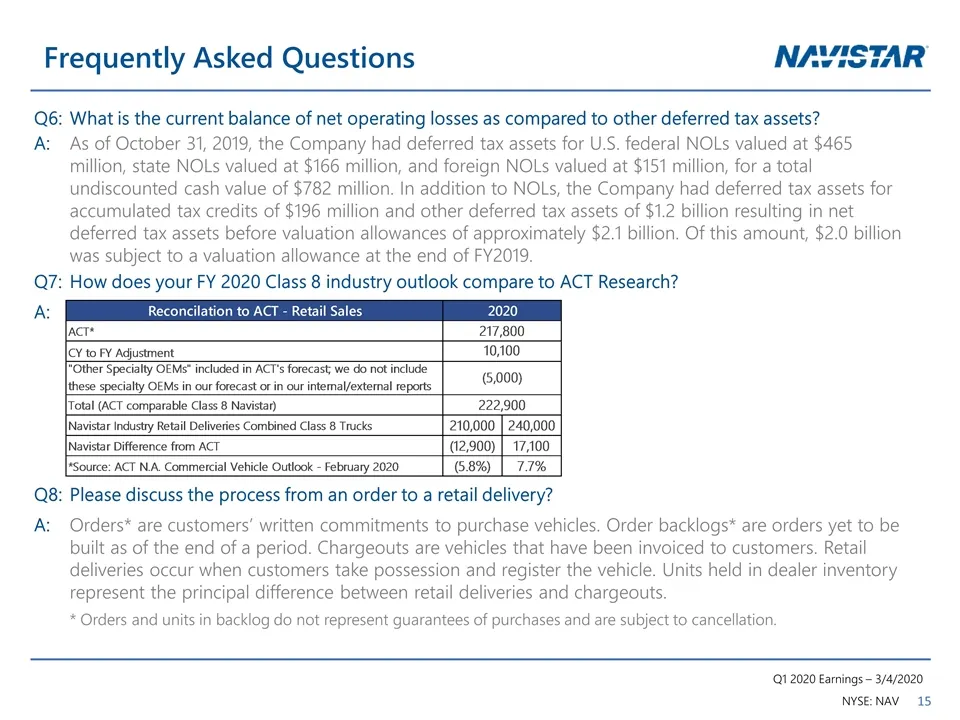
Frequently Asked Questions Q6:What is the current balance of net operating losses as compared to other deferred tax assets? A: As of October 31, 2019, the Company had deferred tax assets for U.S. federal NOLs valued at $465 million, state NOLs valued at $166 million, and foreign NOLs valued at $151
Slide 16: Frequently Asked Questions: Revenue by Product Type, Free Cash Flow
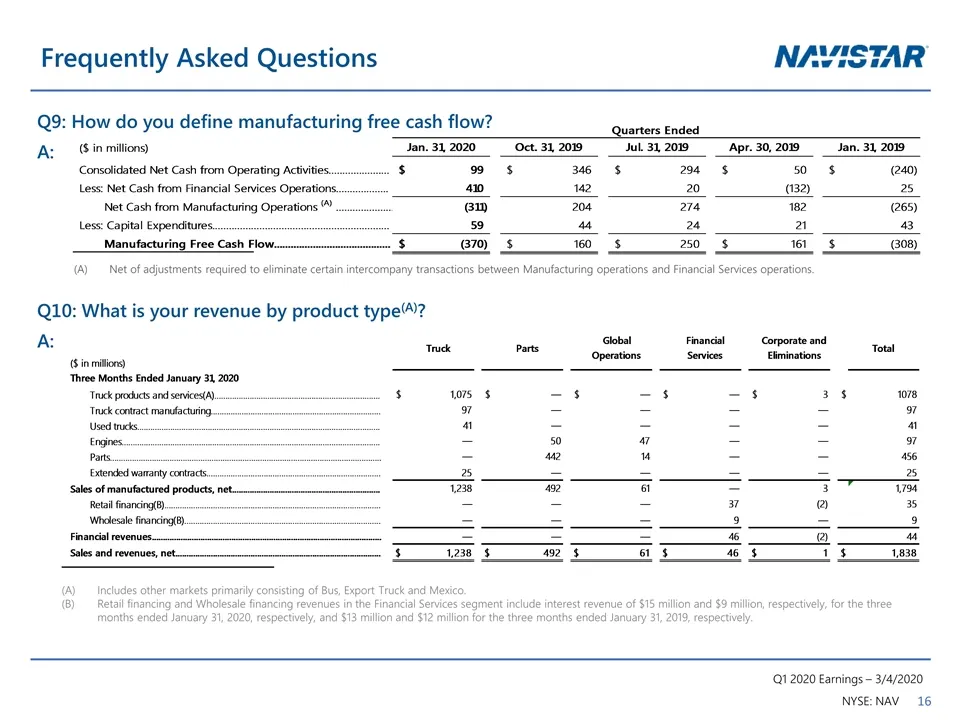
Q10: What is your revenue by product type(A)? A: ___________________________ Includes other markets primarily consisting of Bus, Export Truck and Mexico. Retail financing and Wholesale financing revenues in the Financial Services segment include interest revenue of $15 million and $9 million, respec
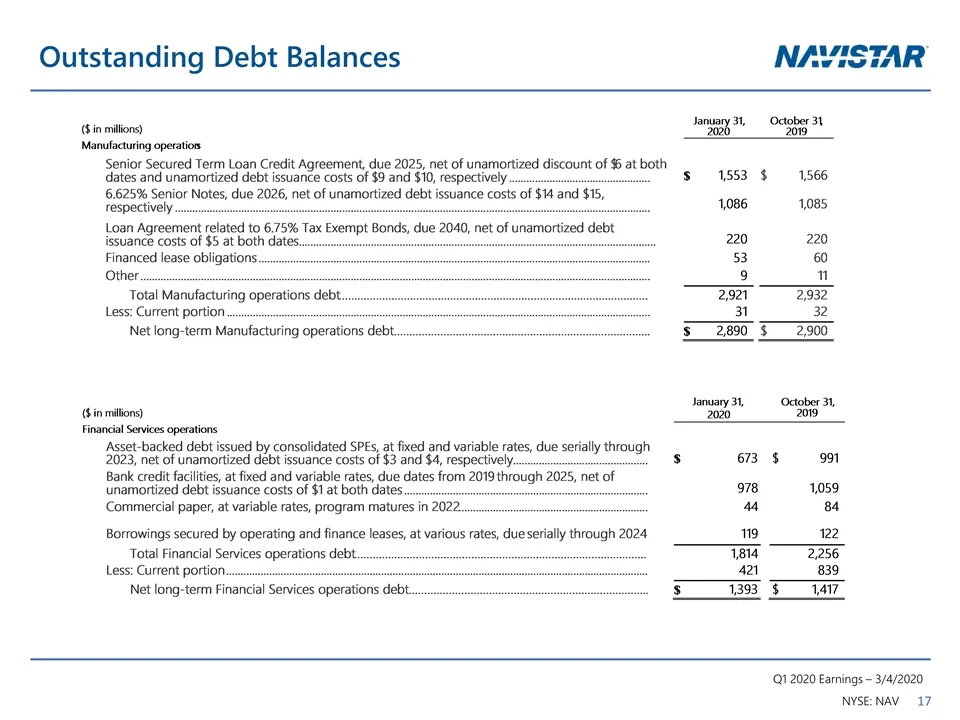
Slide 17: Outstanding Debt Balances
Outstanding Debt Balances($ in millions)January 31, 2020October 31, 2019Manufacturing operationsSenior Secured Term Loan Credit Agreement, due 2025, net of unamortized discount of $6 at both dates and unamortized debt issuance costs of $9 and $10, respectively$1,553$1,5666.625% Senior Notes, due 202
Slide 18: SEC Regulation G Non-GAAP Reconciliation
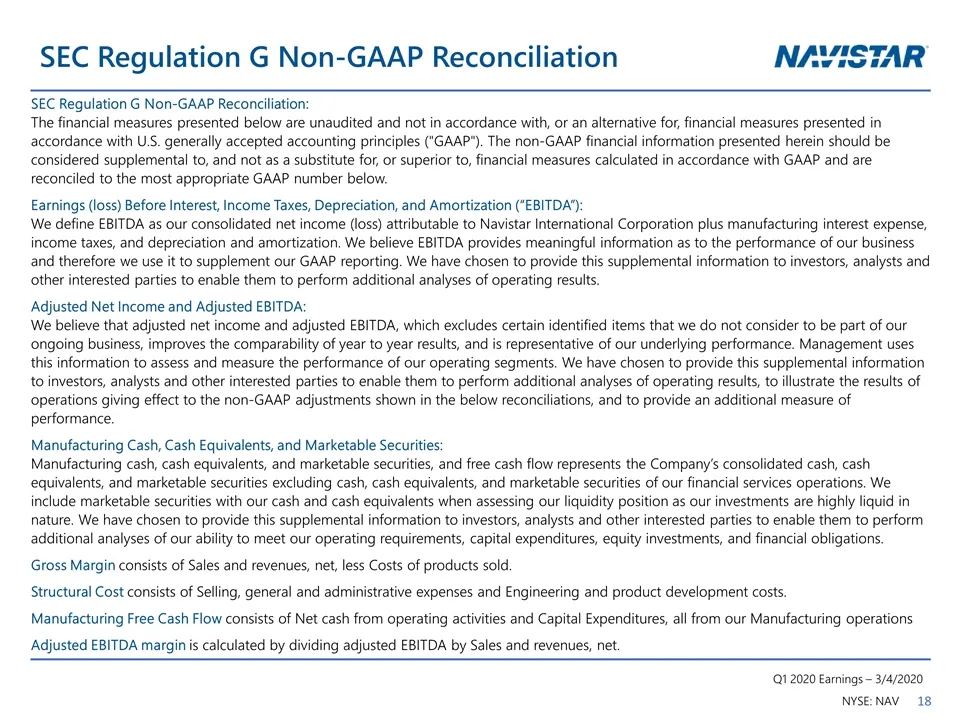
SEC Regulation G Non-GAAP Reconciliation SEC Regulation G Non-GAAP Reconciliation: The financial measures presented below are unaudited and not in accordance with, or an alternative for, financial measures presented in accordance with U.S. generally accepted accounting principles ("GAAP"). The non-G
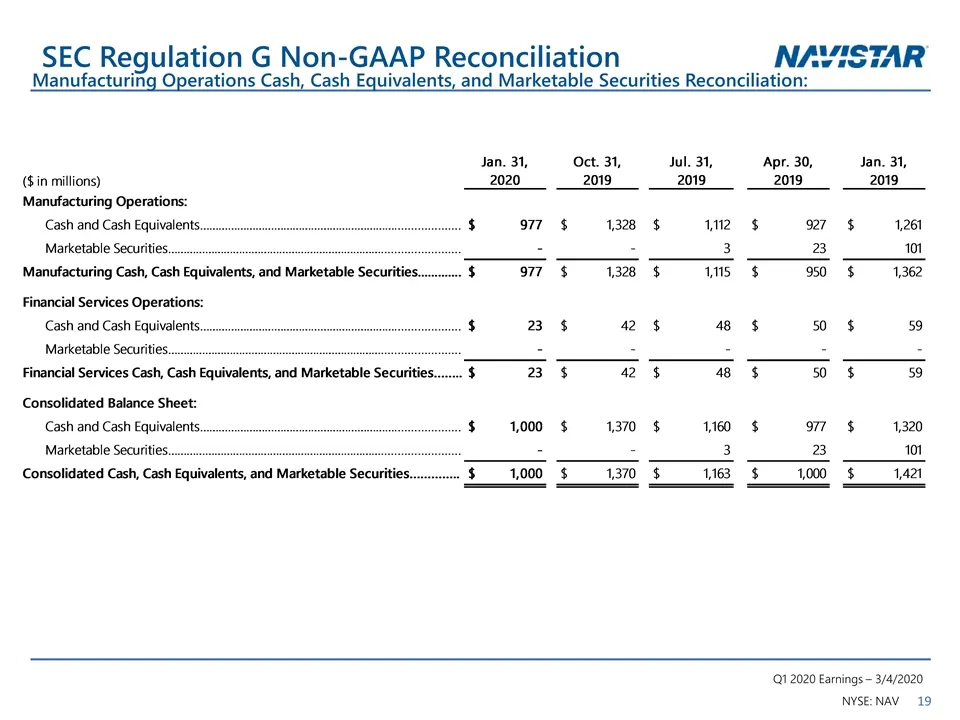
Slide 19: Manufacturing Operations Cash, Cash Equivalents, and Marketable Securities Reconciliation
SEC Regulation G Non-GAAP Reconciliation Manufacturing Operations Cash, Cash Equivalents, and Marketable Securities Reconciliation:
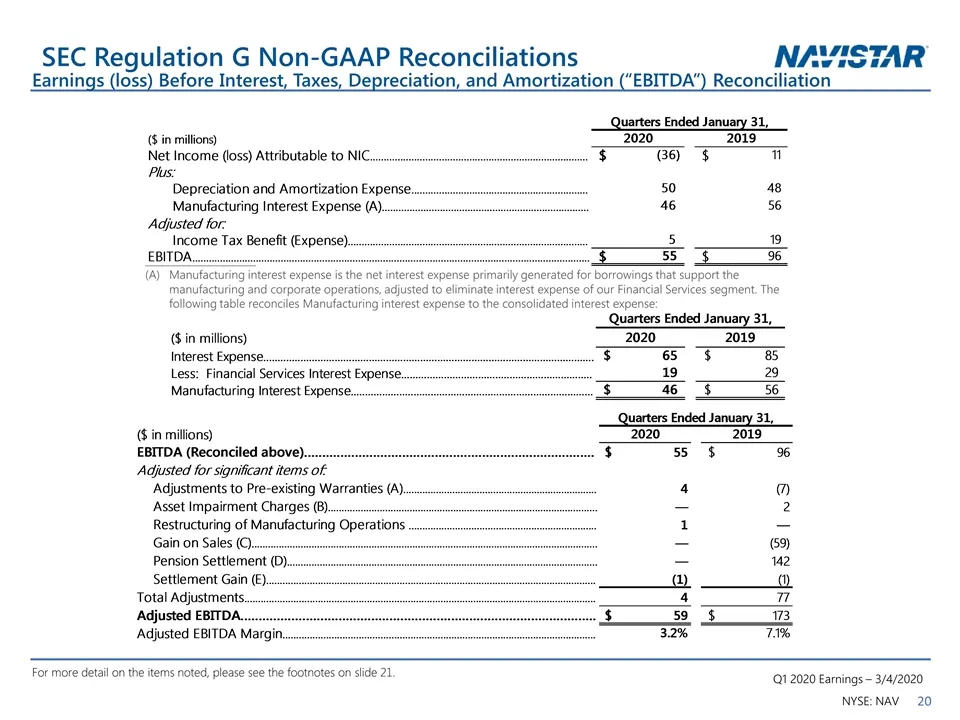
Slide 20: SEC Regulation G Non-GAAP Reconciliations: EBITDA
SEC Regulation G Non-GAAP Reconciliations Earnings (loss) Before Interest, Taxes, Depreciation, and Amortization (“EBITDA”) Reconciliation ______________________ (A) Manufacturing interest expense is the net interest expense primarily generated for borrowings that support the manufacturing and corpo
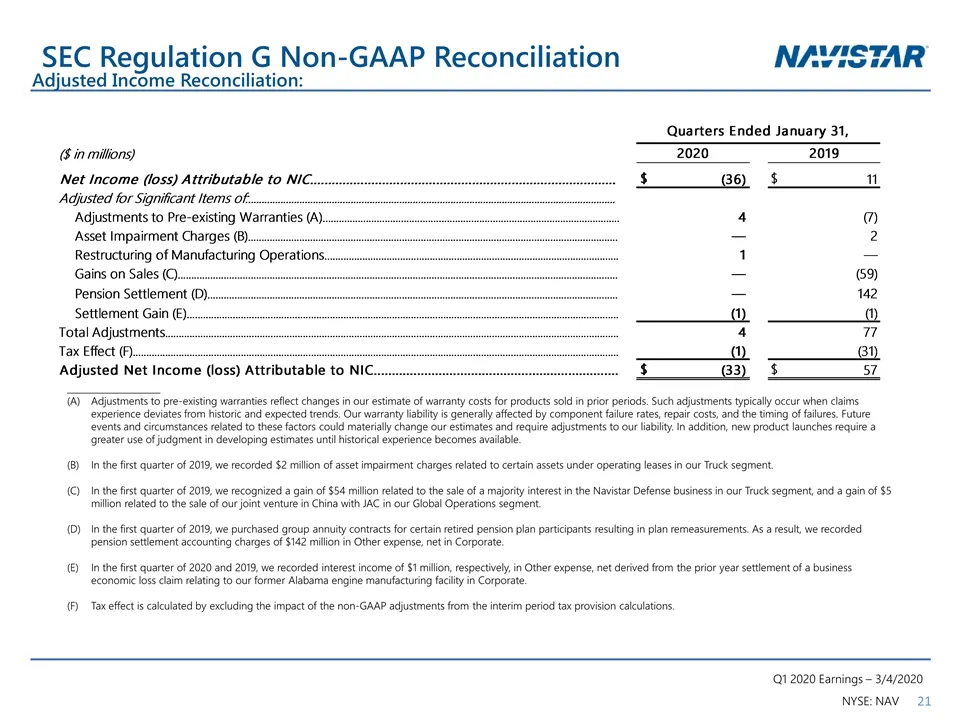
Slide 21: SEC Regulation G Non-GAAP Reconciliation: Adjusted Income
SEC Regulation G Non-GAAP Reconciliation Adjusted Income Reconciliation: _____________________ Adjustments to pre-existing warranties reflect changes in our estimate of warranty costs for products sold in prior periods. Such adjustments typically occur when claims experience deviates from historic a
Source: SEC EDGAR · 8-K filed Mar 4, 2020
More decks from Navistar International Corporation
 Q2 2021 Earnings Presentation20 slides · Jun 8, 2021
 Q1 2021 Earnings Presentation20 slides · Mar 9, 2021
 Q4 2020 Earnings Presentation22 slides · Dec 17, 2020
 Q3 2020 Earnings Presentation21 slides · Sep 9, 2020
 Q2 2020 Earnings Presentation21 slides · Jun 4, 2020
 Q4 2019 Earnings Presentation26 slides · Dec 17, 2019