Definity Financial Corp. · TSX:DFY
Definity Financial — Q3 2022 Earnings Presentation
20 slides from Definity Financial's earnings presentation, Nov 11, 2022
Slide 1: Q3-2022 Quarterly Report
Q3-2022 QUARTERLY REPORT November 11, 2022
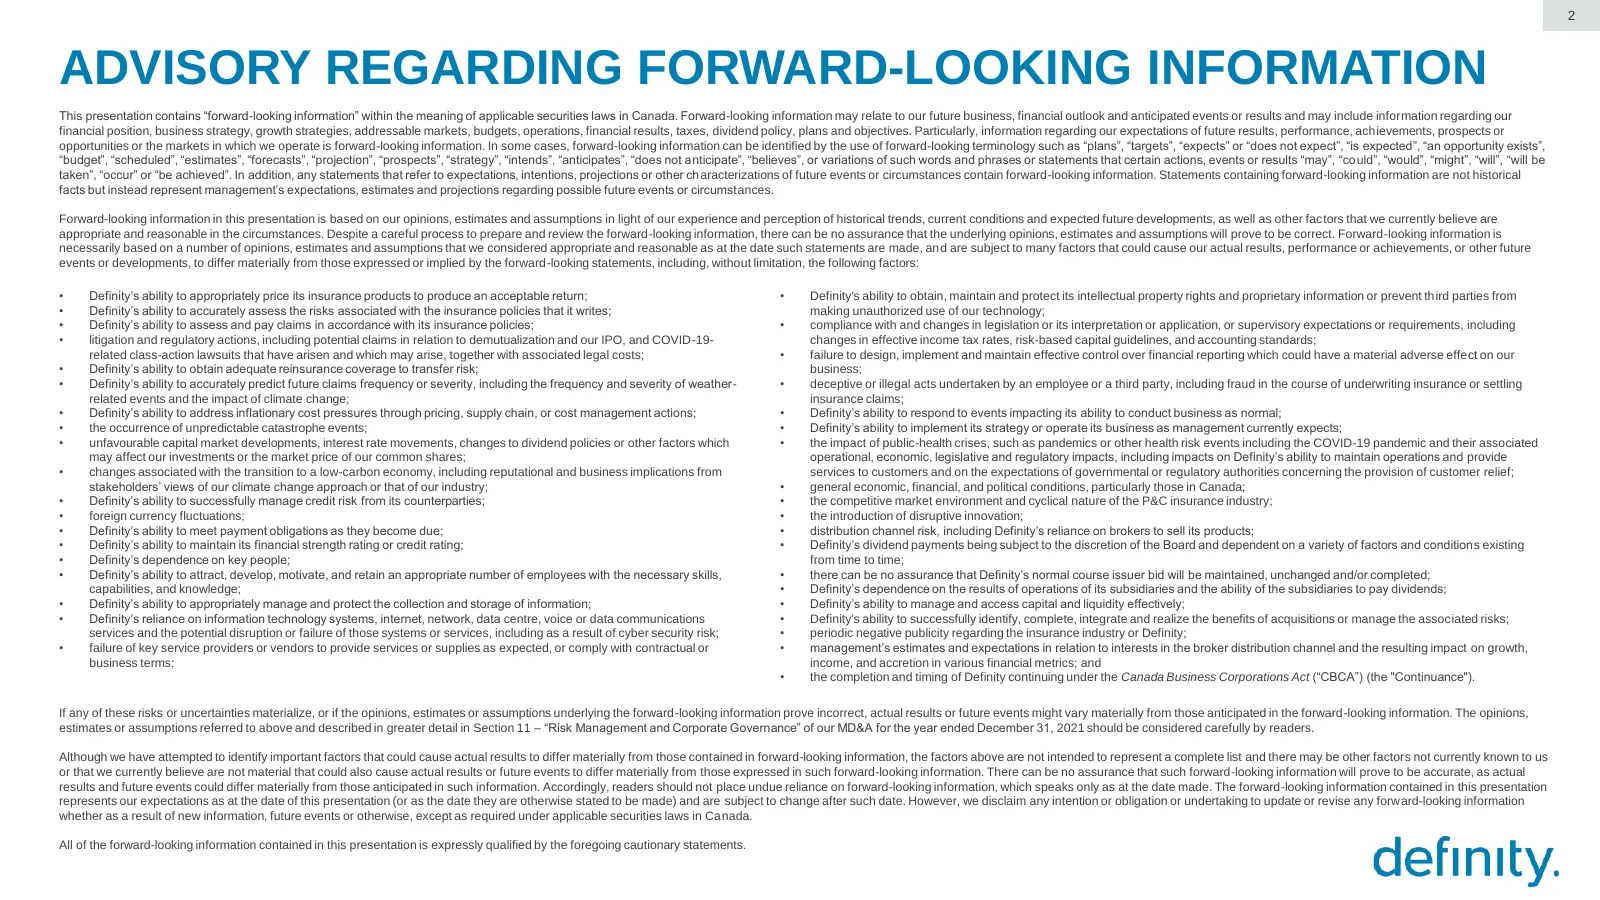
Slide 2: Advisory Regarding Forward-Looking Information
2 ADVISORY REGARDING FORWARD-LOOKING INFORMATION This presentation contains “forward-looking information” within the meaning of applicable securities laws in Canada. Forward-looking information may relate to our future business, financial outlook and anticipated events or results and may include inf
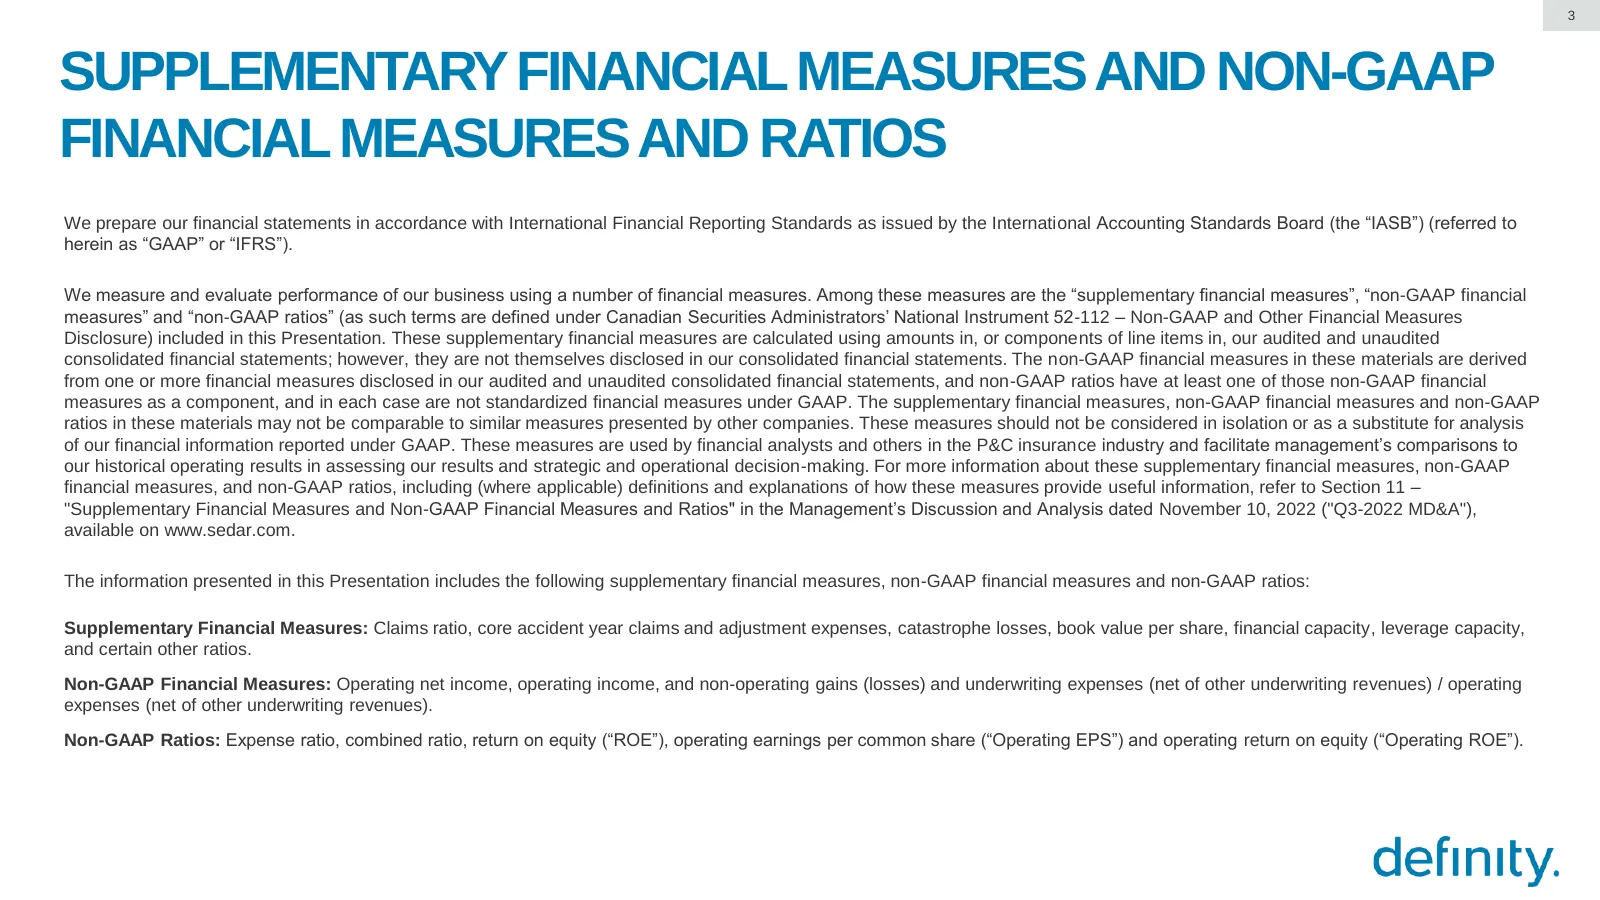
Slide 3: Supplementary Financial Measures and Non-GAAP Financial Measures and Ratios
3 SUPPLEMENTARY FINANCIAL MEASURES AND NON-GAAP FINANCIAL MEASURES AND RATIOS We prepare our financial statements in accordance with International Financial Reporting Standards as issued by the International Accounting Standards Board (the “IASB”) (referred to herein as “GAAP” or “IFRS”). We measure
Slide 4: Rowan Saunders, President & Chief Executive Officer
ROWAN SAUNDERS President & Chief Executive Officer
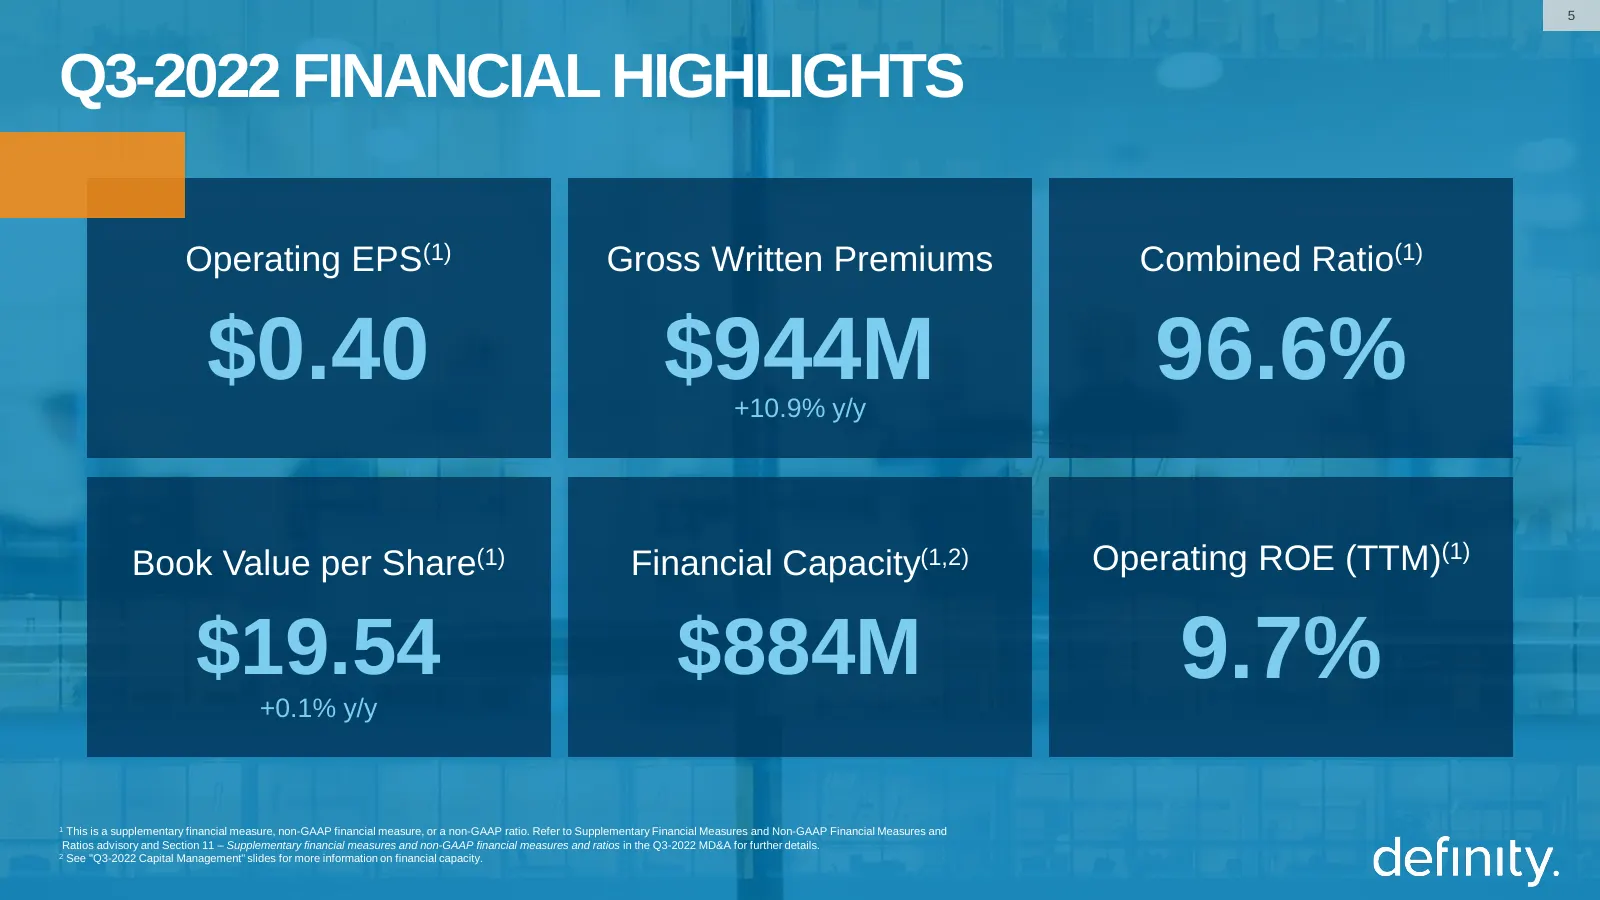
Slide 5: Q3-2022 Financial Highlights
5 Q3-2022 FINANCIAL HIGHLIGHTS Operating EPS(1) Gross Written Premiums Combined Ratio(1) $0.40 $944M +10.9% y/y 96.6% Book Value per Share(1) Financial Capacity(1,2) Operating ROE (TTM)(1) $19.54 +0.1% y/y $884M 9.7% 1 This is a supplementary financial measure, non-GAAP financial measure, or a non-G
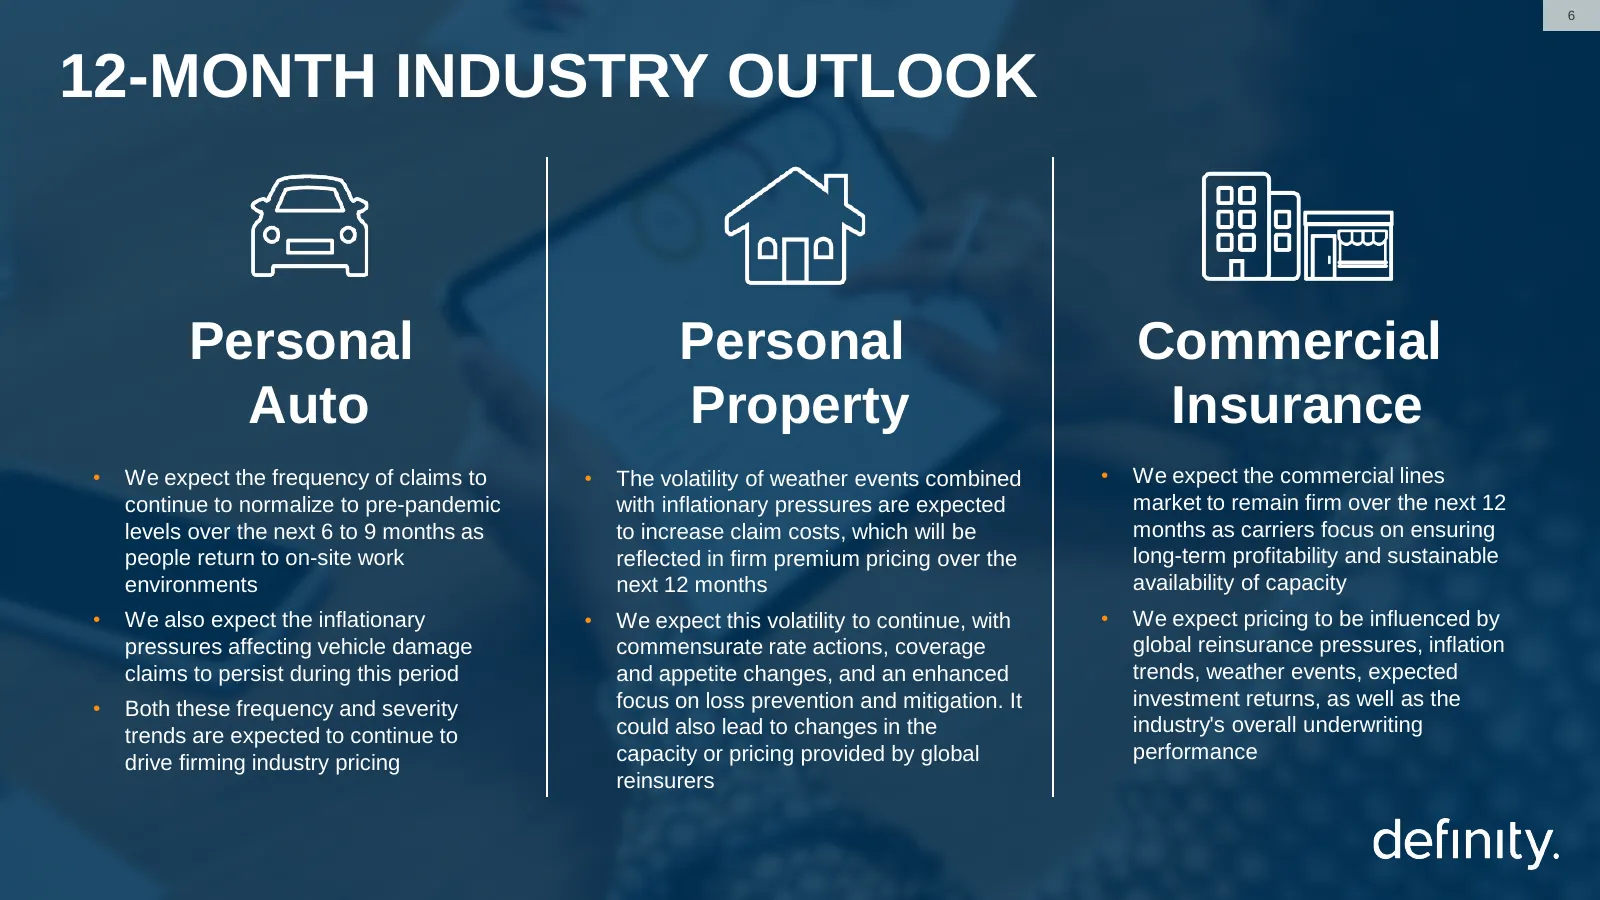
Slide 6: 12-Month Industry Outlook
6 12-MONTH INDUSTRY OUTLOOK Personal Personal Commercial Auto Property Insurance • We expect the frequency of claims to • The volatility of weather events combined • We expect the commercial lines continue to normalize to pre-pandemic with inflationary pressures are expected market to remain firm ov
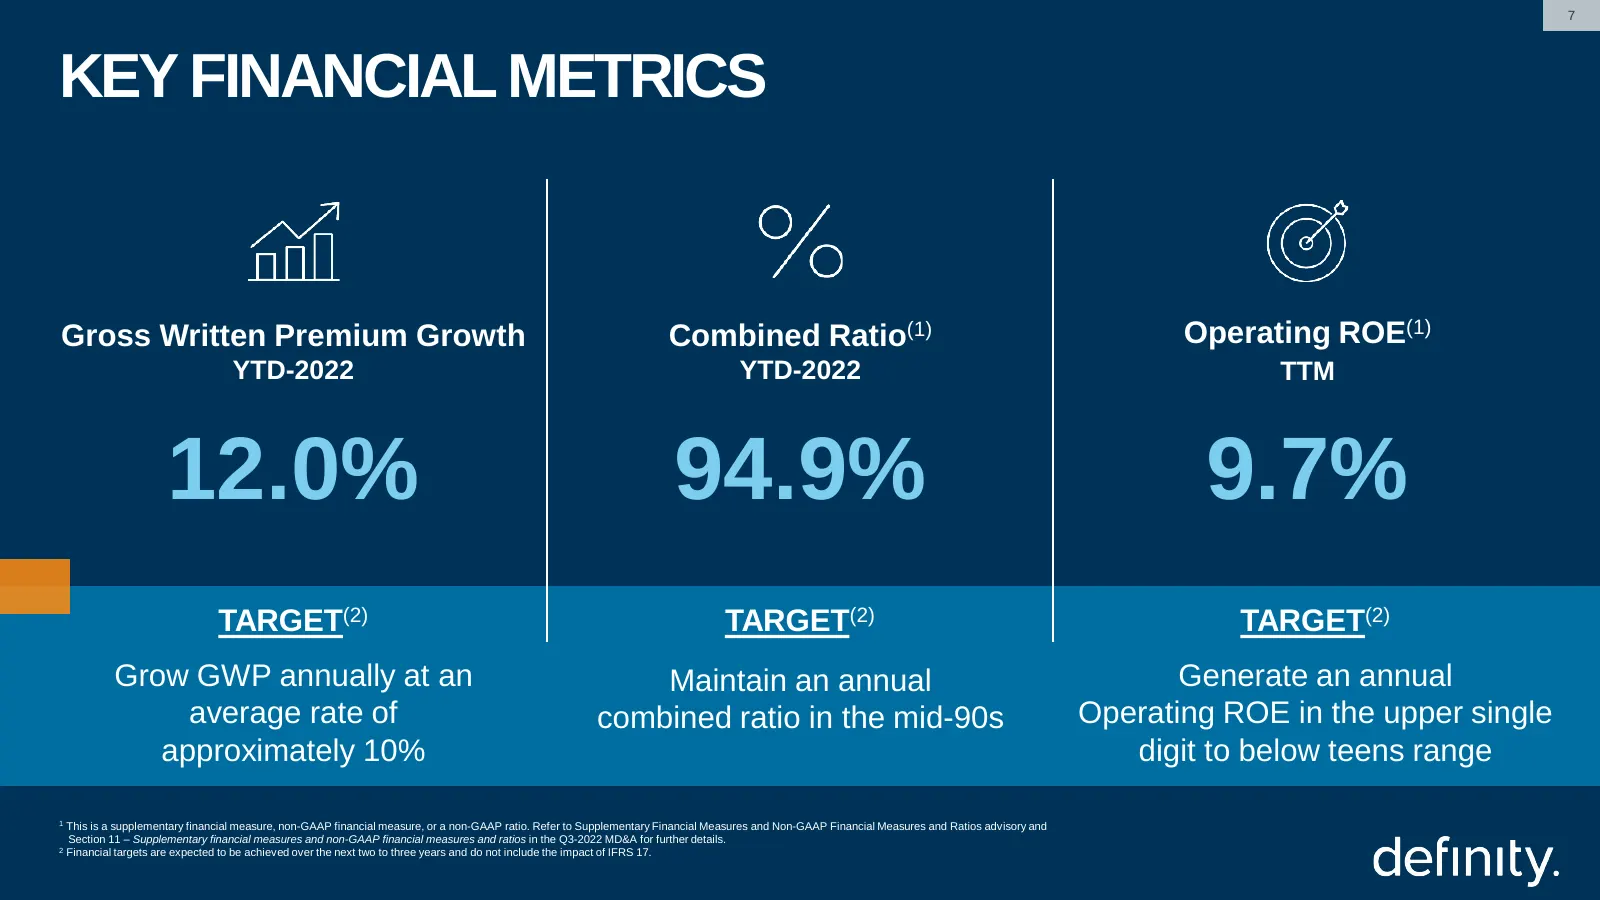
Slide 7: Key Financial Metrics
7 KEY FINANCIAL METRICS Gross Written Premium Growth Combined Ratio(1) Operating ROE(1) YTD-2022 YTD-2022 TTM 12.0% 94.9% 9.7% TARGET(2) TARGET(2) TARGET(2) Grow GWP annually at an Maintain an annual Generate an annual average rate of combined ratio in the mid-90s Operating ROE in the upper single a
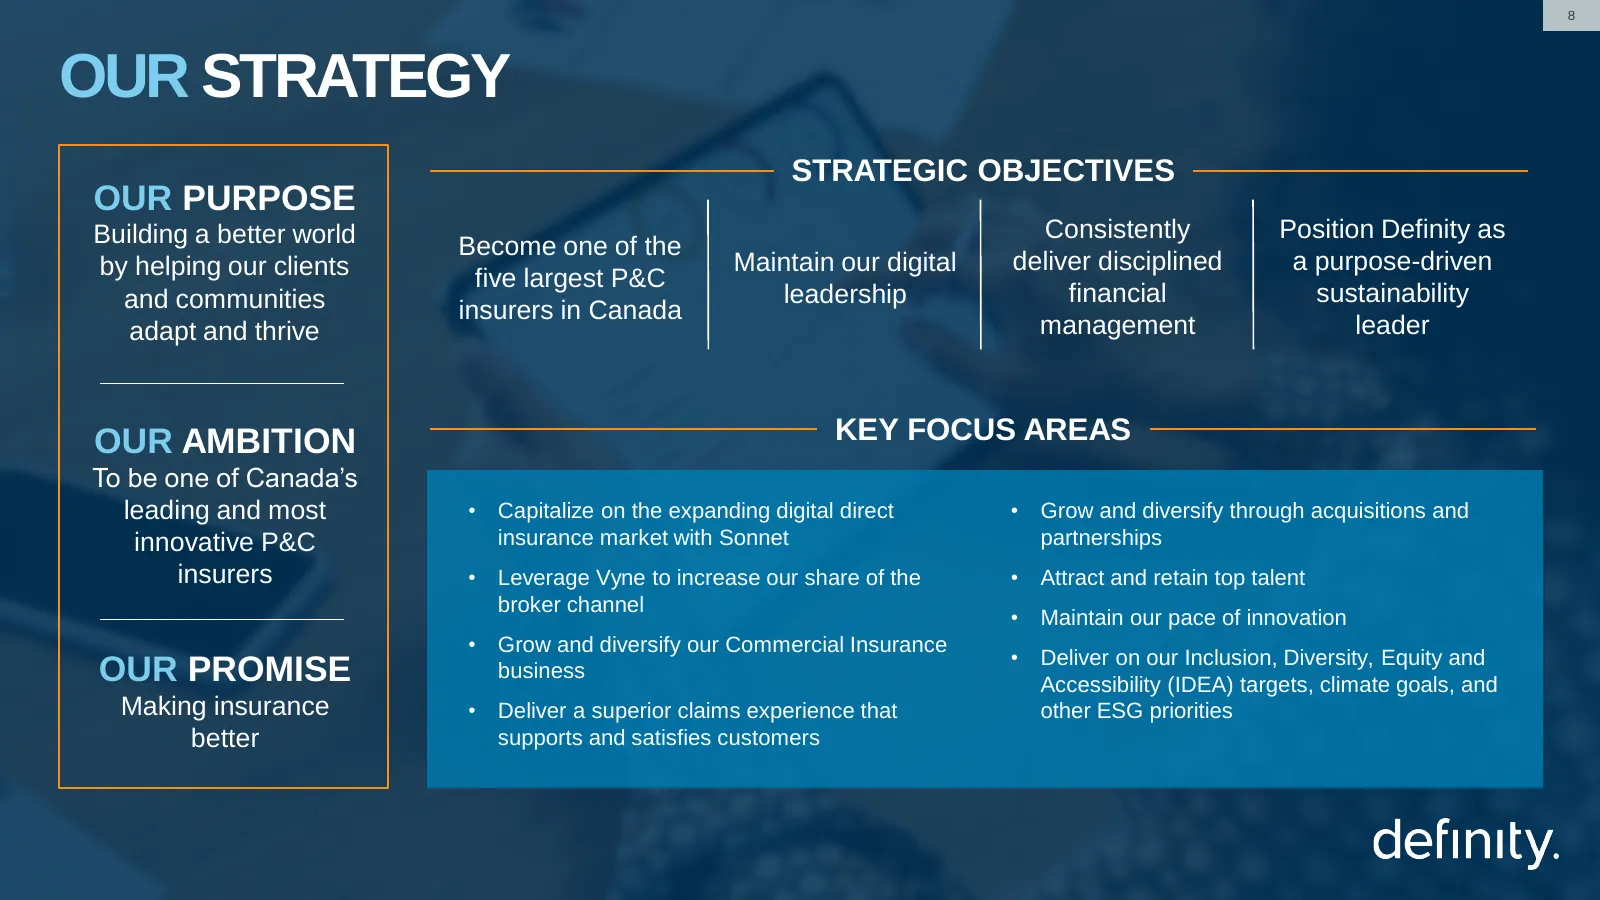
Slide 8: Our Strategy
8 OUR STRATEGY STRATEGIC OBJECTIVES OUR PURPOSE Building a better world Consistently Position Definity as Become one of the by helping our clients Maintain our digital deliver disciplined a purpose-driven five largest P&C and communities leadership financial sustainability insurers in Canada adapt a
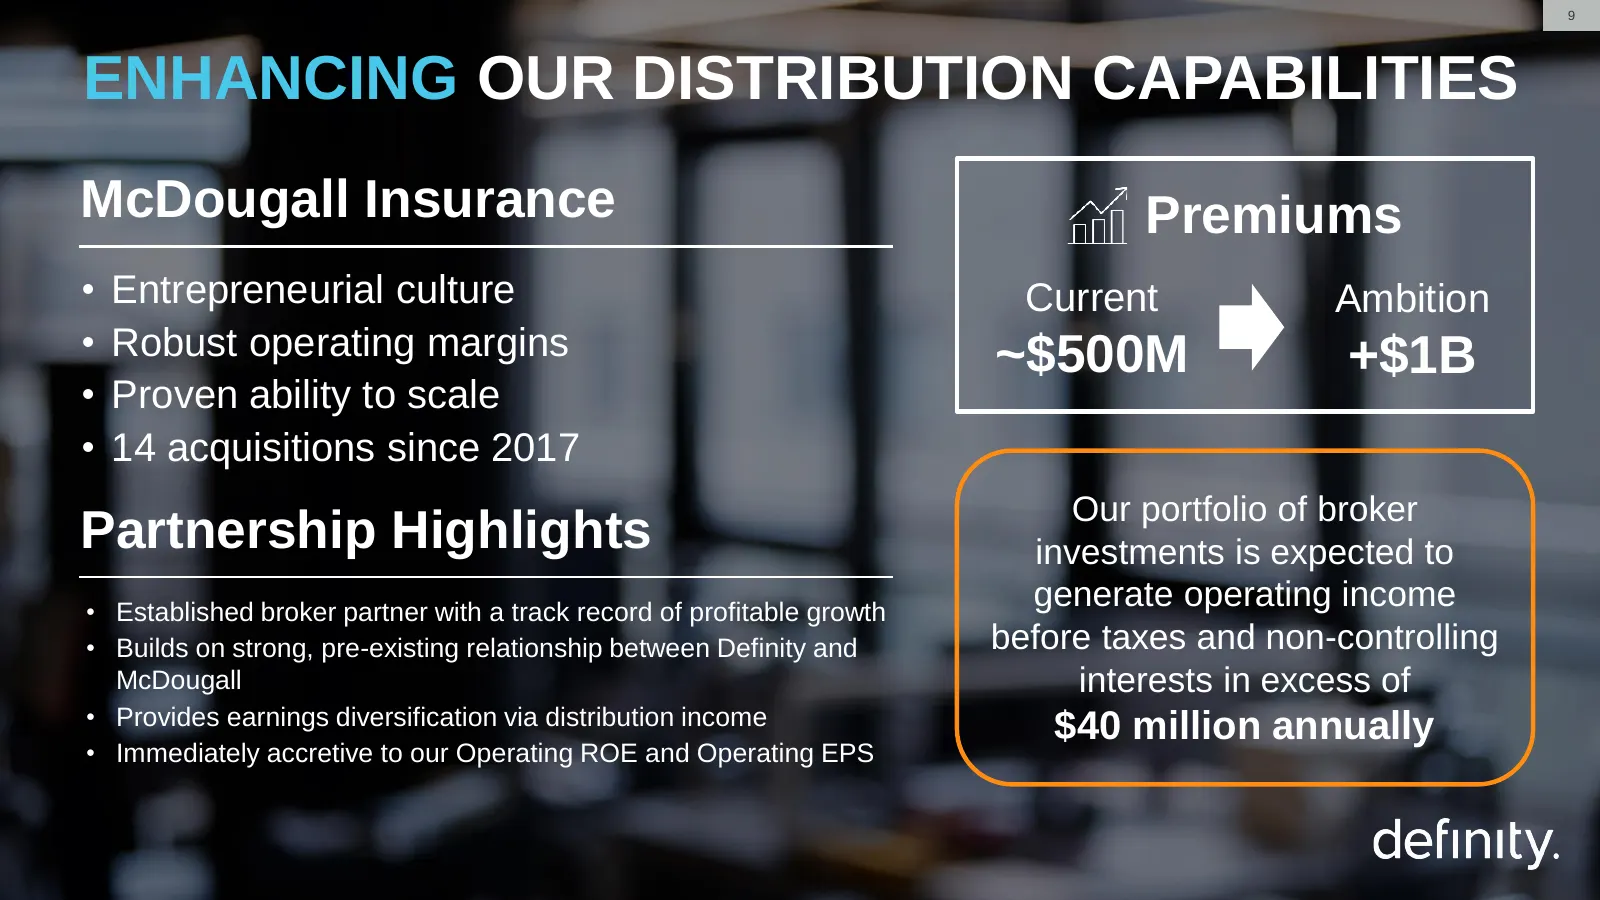
Slide 9: Enhancing Our Distribution Capabilities
9 ENHANCING OUR DISTRIBUTION CAPABILITIES McDougall Insurance Premiums • Entrepreneurial culture Current Ambition • Robust operating margins ~$500M +$1B • Proven ability to scale • 14 acquisitions since 2017 Our portfolio of broker Partnership Highlights investments is expected to • Established brok

Slide 10: Philip Mather, Executive Vice-President & Chief Financial Officer
PHILIP MATHER Executive Vice-President & Chief Financial Officer
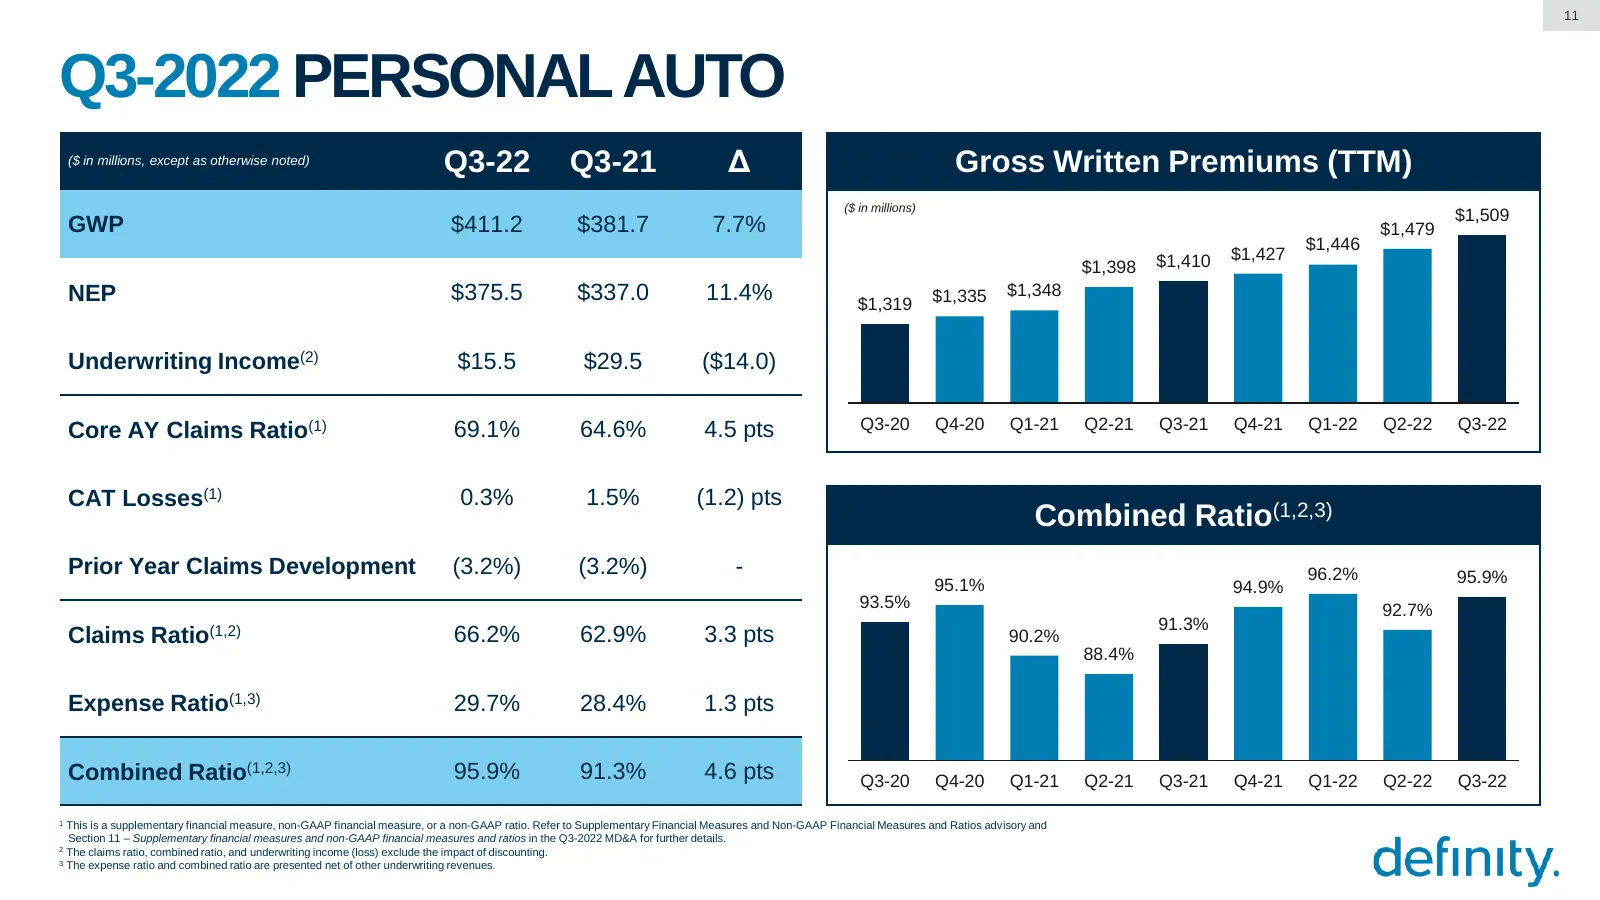
Slide 11: Q3-2022 Personal Auto
11 Q3-2022 PERSONAL AUTO ($ in millions, except as otherwise noted) Q3-22 Q3-21 Δ Gross Written Premiums (TTM) ($ in millions) $1,509 GWP $411.2 $381.7 7.7% $1,479 $1,446 $1,410 $1,427 $1,398 NEP $375.5 $337.0 11.4% $1,319 $1,335 $1,348 Underwriting Income(2) $15.5 $29.5 ($14.0) Core AY Claims Ratio
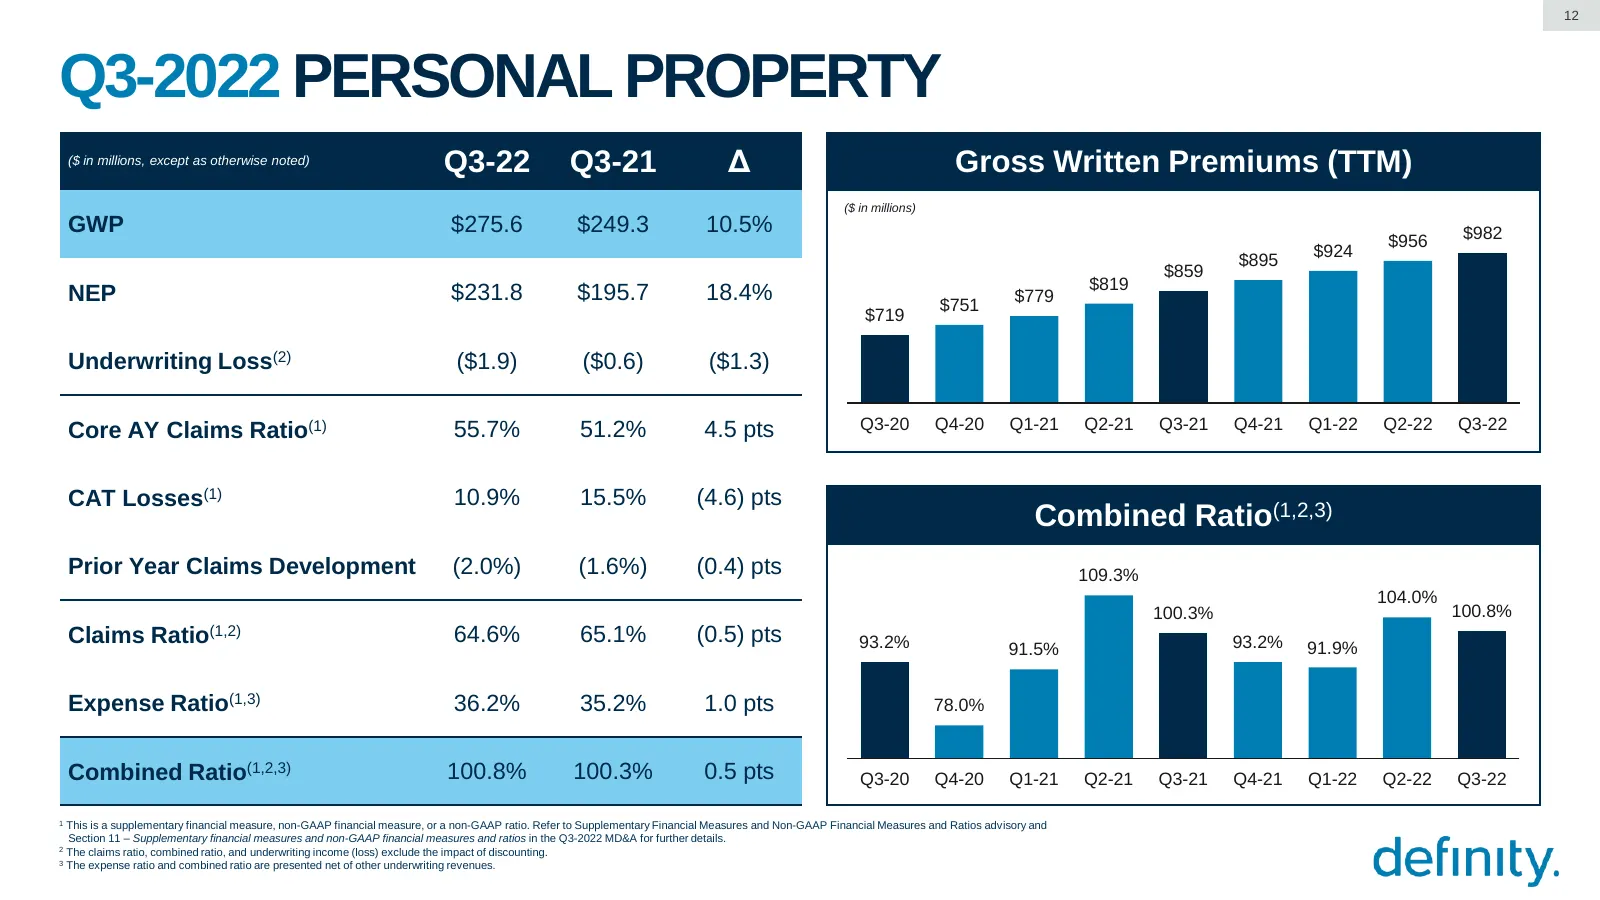
Slide 12: Q3-2022 Personal Property
12 Q3-2022 PERSONAL PROPERTY ($ in millions, except as otherwise noted) Q3-22 Q3-21 Δ Gross Written Premiums (TTM) ($ in millions) GWP $275.6 $249.3 10.5% $982 $956 $924 $895 $859 $819 NEP $231.8 $195.7 18.4% $751 $779 $719 Underwriting Loss(2) ($1.9) ($0.6) ($1.3) Core AY Claims Ratio(1) 55.7% 51.2
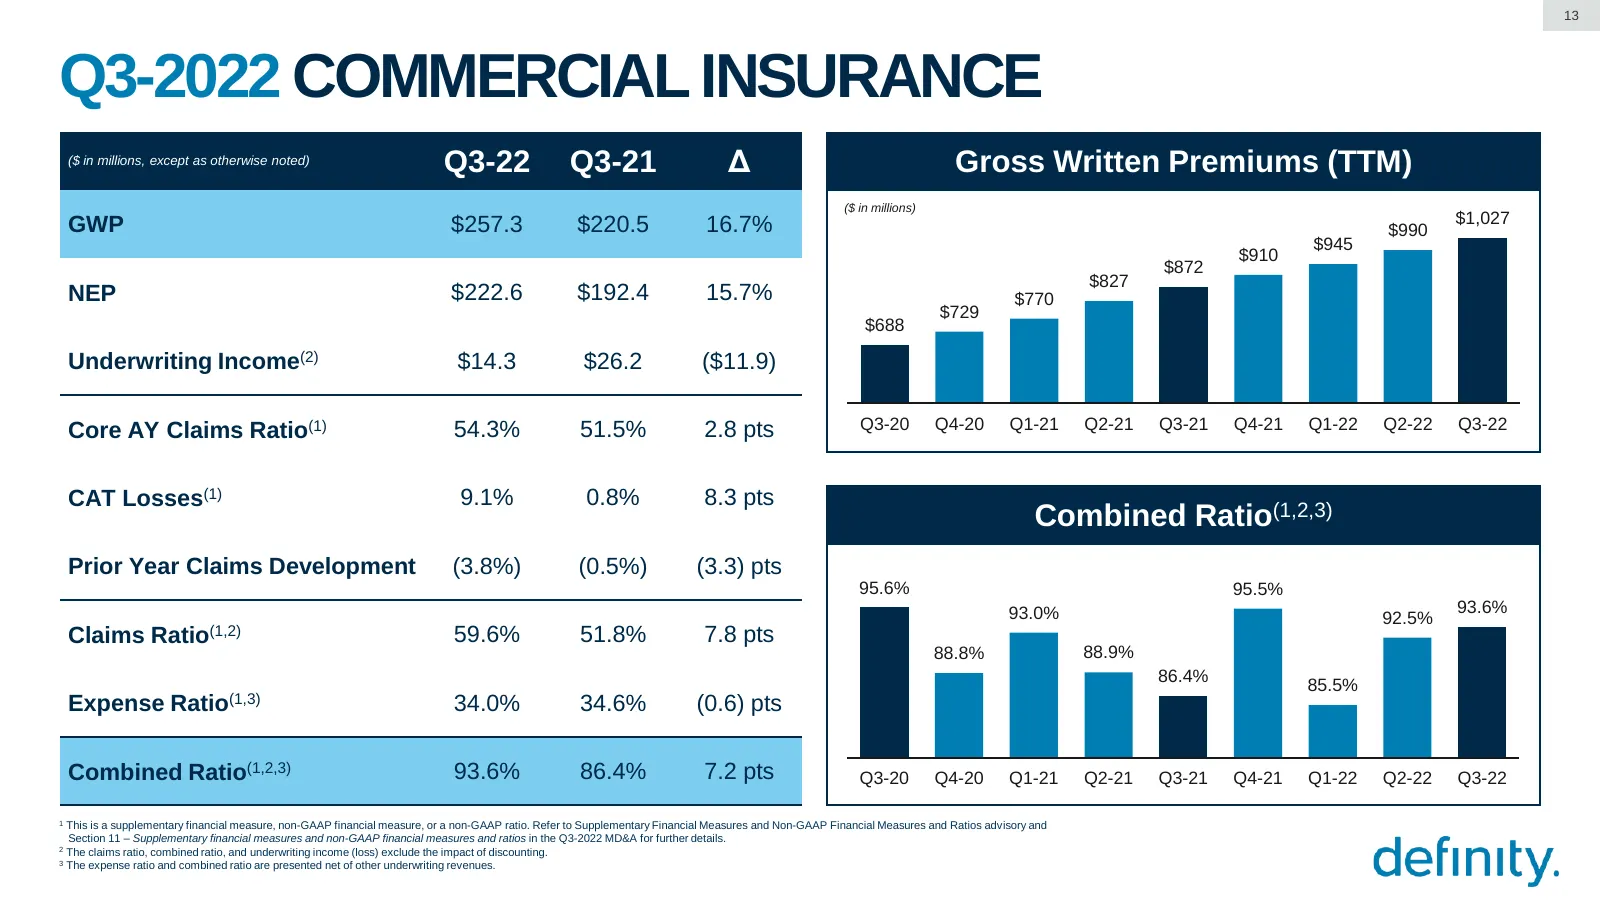
Slide 13: Q3-2022 Commercial Insurance
13 Q3-2022 COMMERCIAL INSURANCE ($ in millions, except as otherwise noted) Q3-22 Q3-21 Δ Gross Written Premiums (TTM) ($ in millions) GWP $257.3 $220.5 16.7% $1,027 $990 $945 $910 $872 $827 NEP $222.6 $192.4 15.7% $770 $729 $688 Underwriting Income(2) $14.3 $26.2 ($11.9) Core AY Claims Ratio(1) 54.3
Slide 14: Q3-2022 Consolidated Profitability
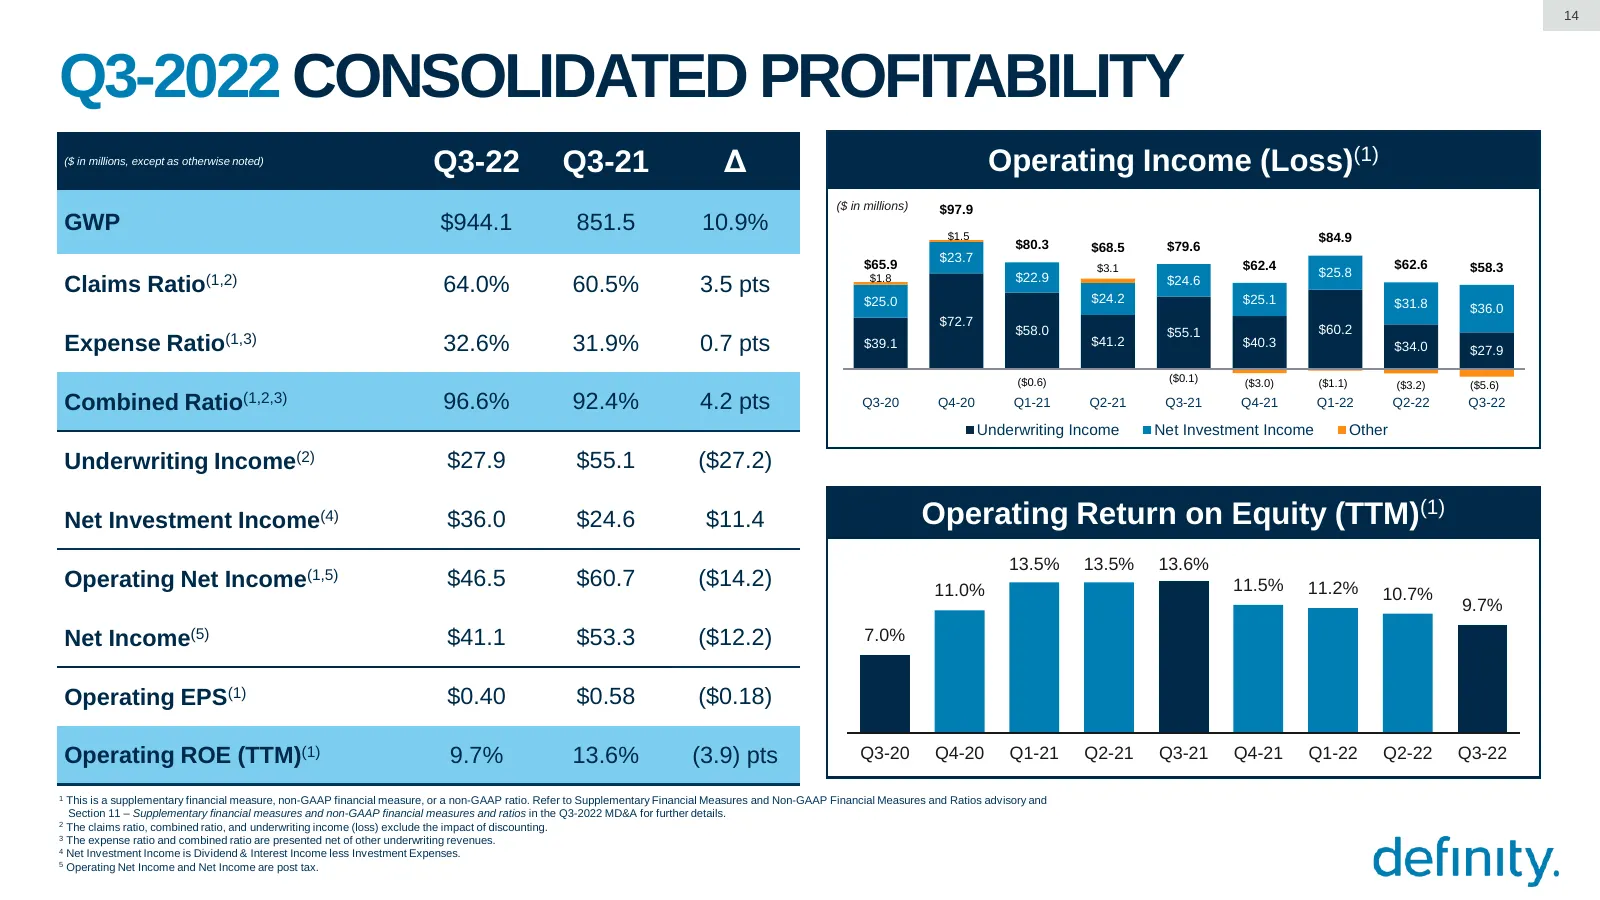
14 Q3-2022 CONSOLIDATED PROFITABILITY ($ in millions, except as otherwise noted) Q3-22 Q3-21 Δ Operating Income (Loss)(1) ($ in millions) $97.9 GWP $944.1 851.5 10.9% $1.5 $84.9 $80.3 $68.5 $79.6 $23.7 $65.9 $3.1 $62.4 $62.6 $58.3 $1.8 $22.9 $25.8 Claims Ratio(1,2) 64.0% 60.5% 3.5 pts $24.2 $24.6 $2
Slide 15: Q3-2022 Investment Portfolio
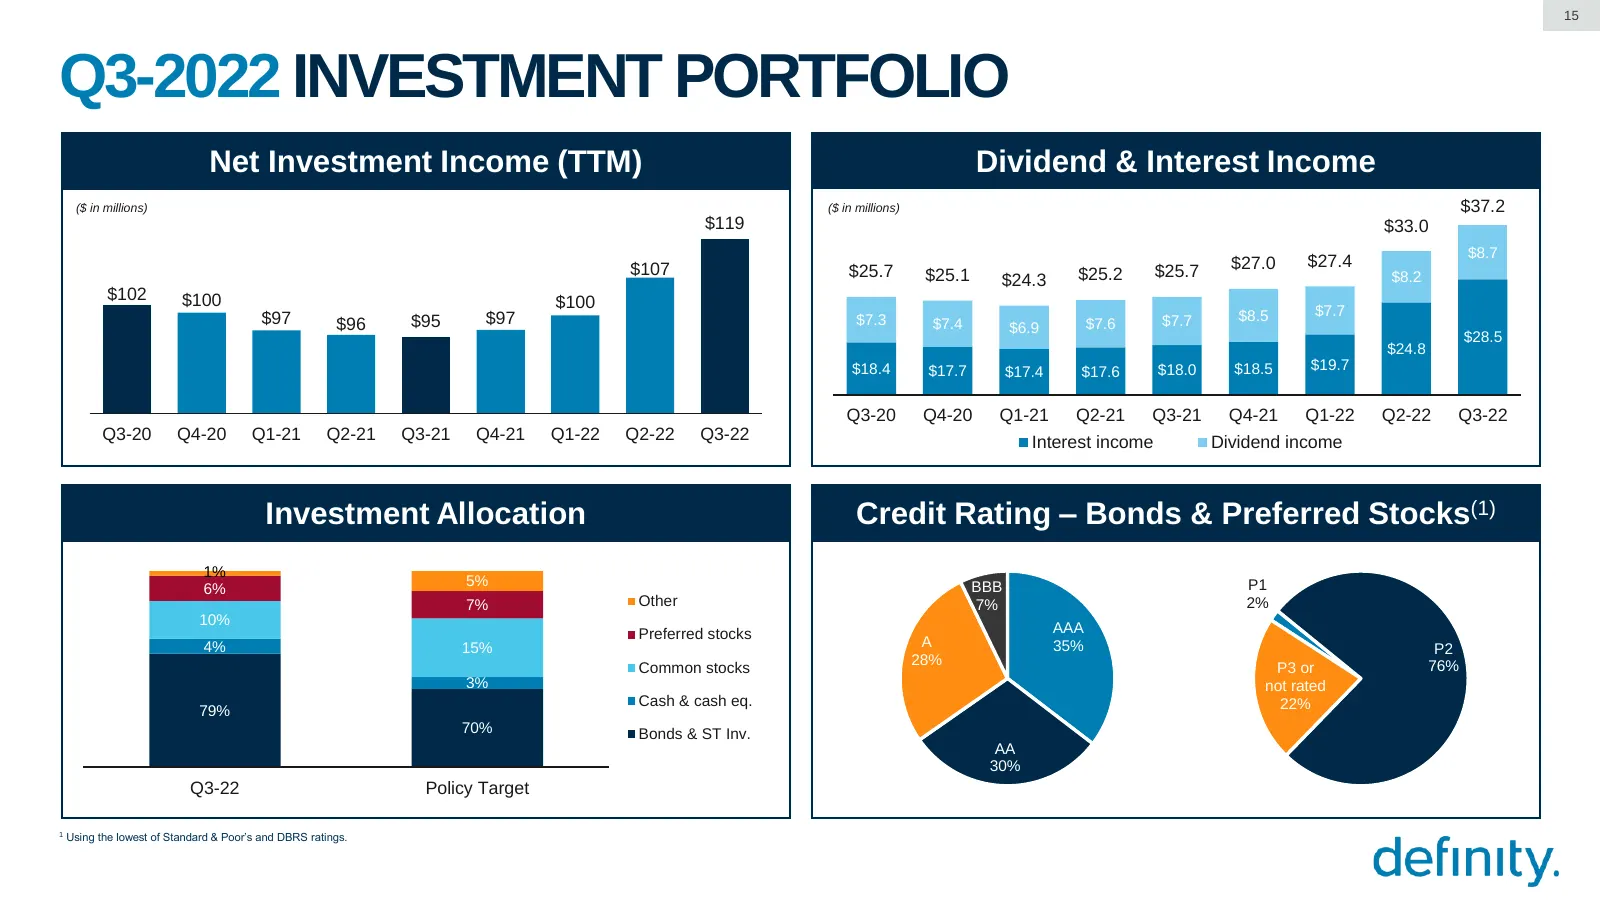
15 Q3-2022 INVESTMENT PORTFOLIO Net Investment Income (TTM) Dividend & Interest Income ($ in millions) ($ in millions) $37.2 $119 $33.0 $8.7 $107 $27.0 $27.4 $25.7 $25.1 $24.3 $25.2 $25.7 $8.2 $102 $100 $100 $8.5 $7.7 $97 $96 $95 $97 $7.3 $7.4 $6.9 $7.6 $7.7 $28.5 $24.8 $18.4 $17.7 $17.4 $17.6 $18.0
Slide 16: Q3-2022 Capital Management
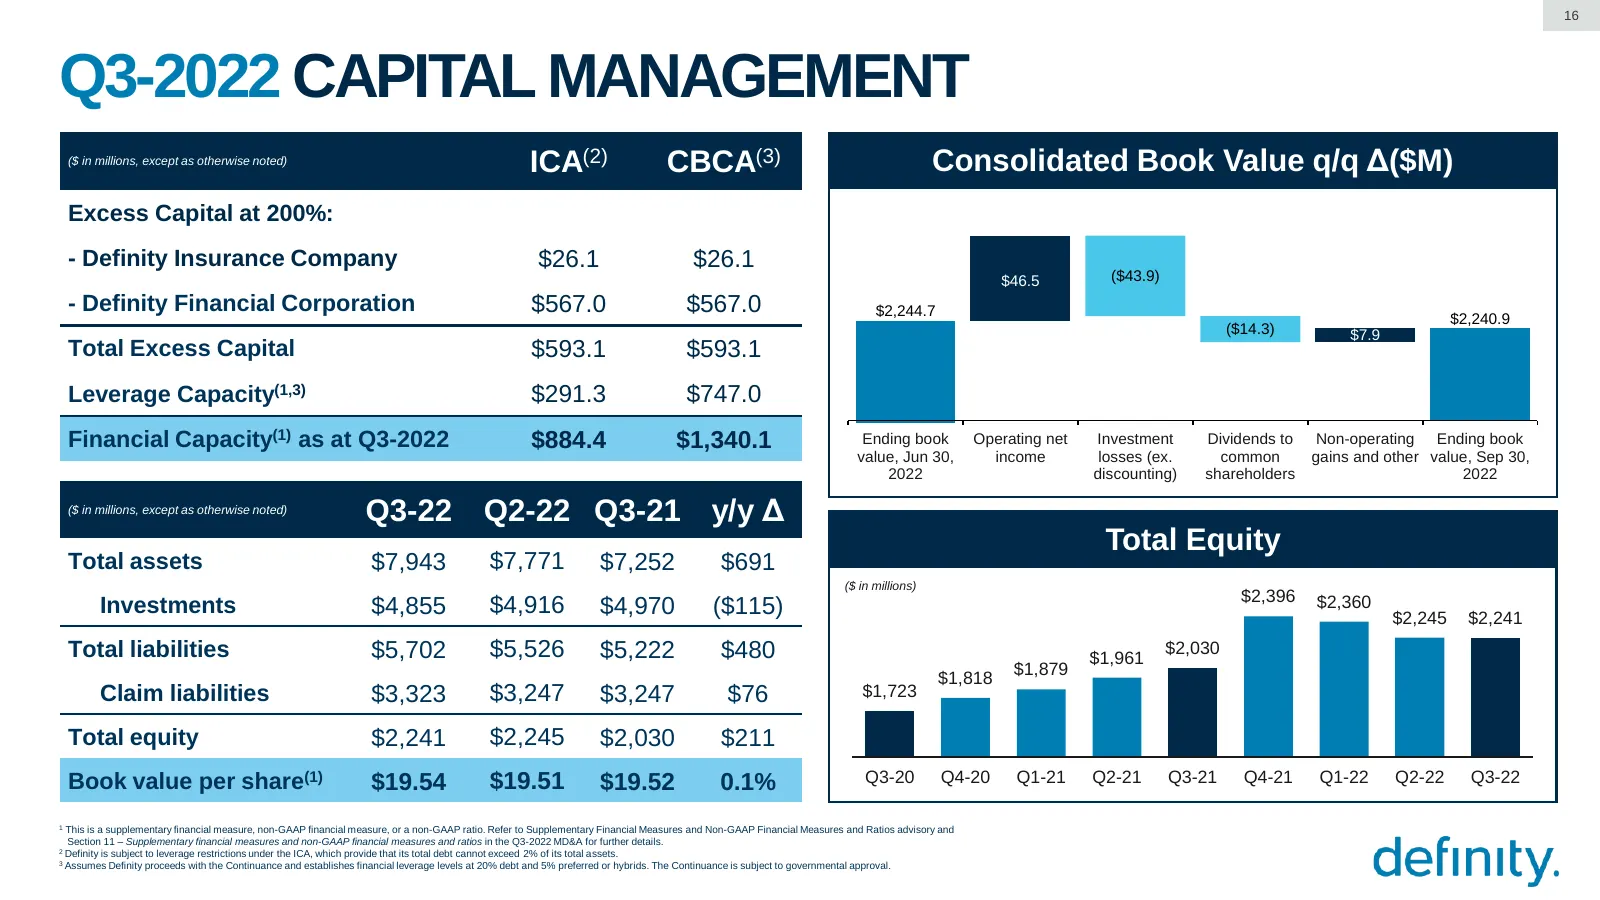
16 Q3-2022 CAPITAL MANAGEMENT ($ in millions, except as otherwise noted) ICA(2) CBCA(3) Consolidated Book Value q/q Δ($M) Excess Capital at 200%: - Definity Insurance Company $26.1 $26.1 $46.5 ($43.9) - Definity Financial Corporation $567.0 $567.0 $2,244.7 $2,240.9 ($14.3) $7.9 Total Excess Capital
Slide 17: Q3-2022 Capital Management
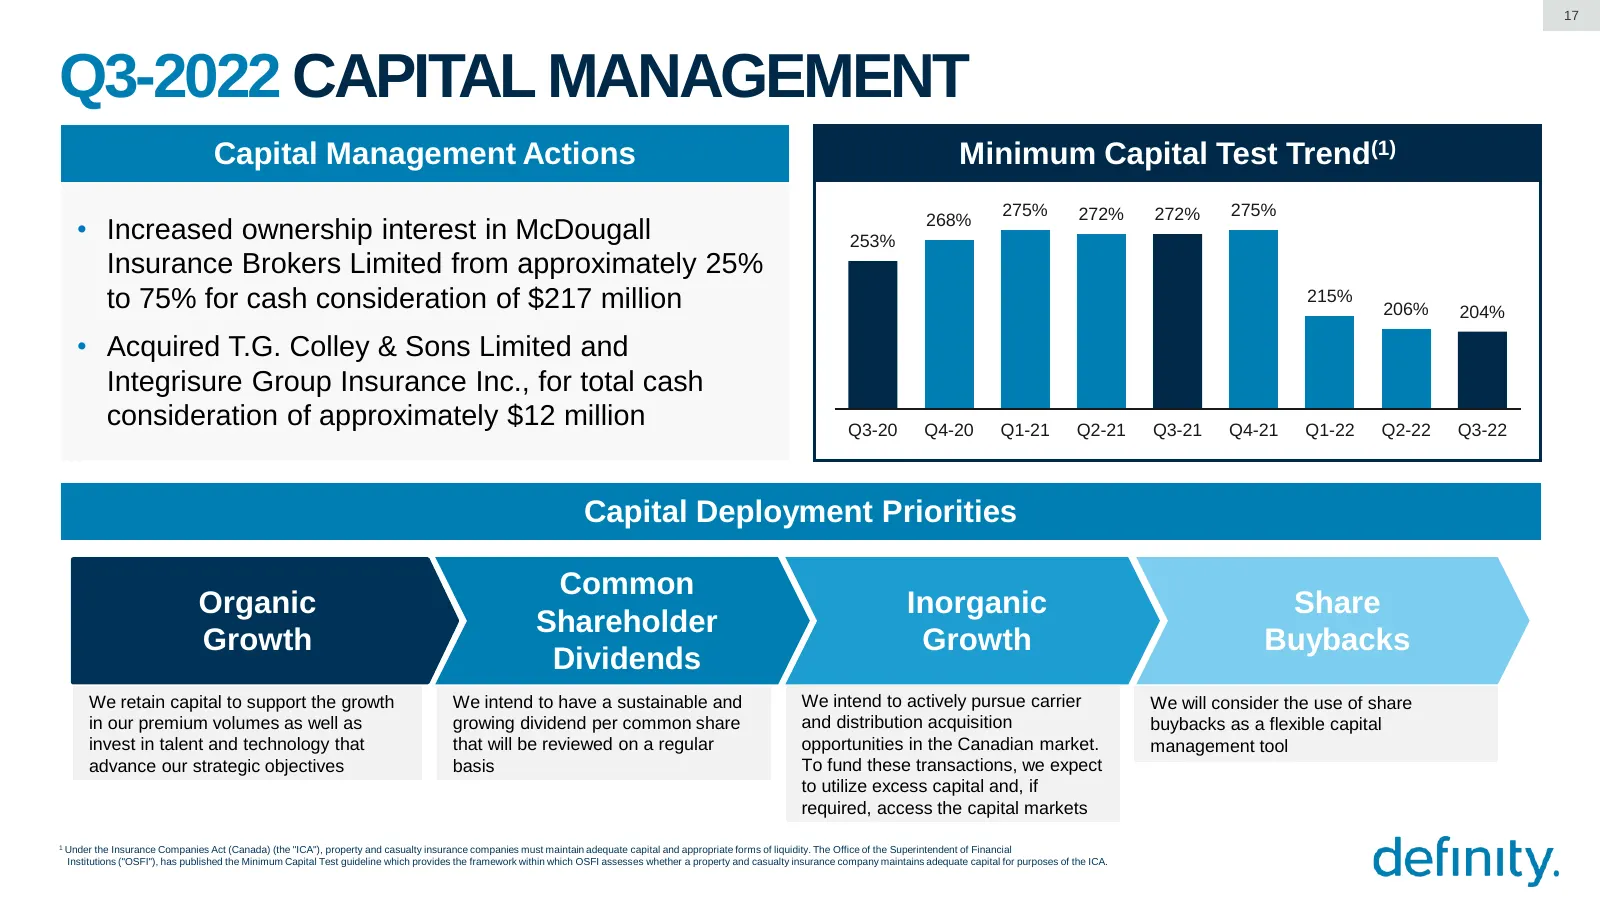
17 Q3-2022 CAPITAL MANAGEMENT Capital Management Actions Minimum Capital Test Trend(1) 275% 272% 272% 275% • Increased ownership interest in McDougall 253% 268% Insurance Brokers Limited from approximately 25% to 75% for cash consideration of $217 million 215% 206% 204% • Acquired T.G. Colley & Sons

Slide 18: Questions?
"9B, QUESTIONS? definity.
Slide 19: Contact Us
19 CONTACT US Investor Relations Corporate Communications Definity Financial Corporation Mathieu Genest Investor Relations Department Manager, Public and Media Relations 121 King St West, Suite 1400, (C) 647-224-8975 Toronto, ON M5H 3T9 mathieu.genest@definity.com (TF) 1-866-902-4724 IR@definityfc.c
Slide 20: Definity
definity. © 2022 Definity Financial Corporation. Intellectual property belongs to Definity Financial Corporation and/or its affiliates.
Source: Internet Archive copy of s28.q4cdn.com
More decks from Definity Financial Corp.
 Q3 2026 Earnings Presentation37 slides · November 2026
 Q1 2026 Earnings Presentation22 slides · May 9, 2026
 Q4 2025 Earnings Presentation36 slides · Apr 23, 2026
 Q4 2025 Earnings Presentation25 slides · Feb 13, 2026
 Q2 2026 Earnings Presentation37 slides · 2026
 Q1 2026 Earnings Presentation36 slides · 2026