Definity Financial Corp. · TSX:DFY
Definity Financial — Q4 2025 Earnings Presentation
36 slides from Definity Financial's earnings presentation, Apr 23, 2026
Slide 1: Building a Canadian Champion
Building a Canadian Champion Investor Presentation Q4-2025
Slide 2: Advisory Regarding Forward-Looking Information
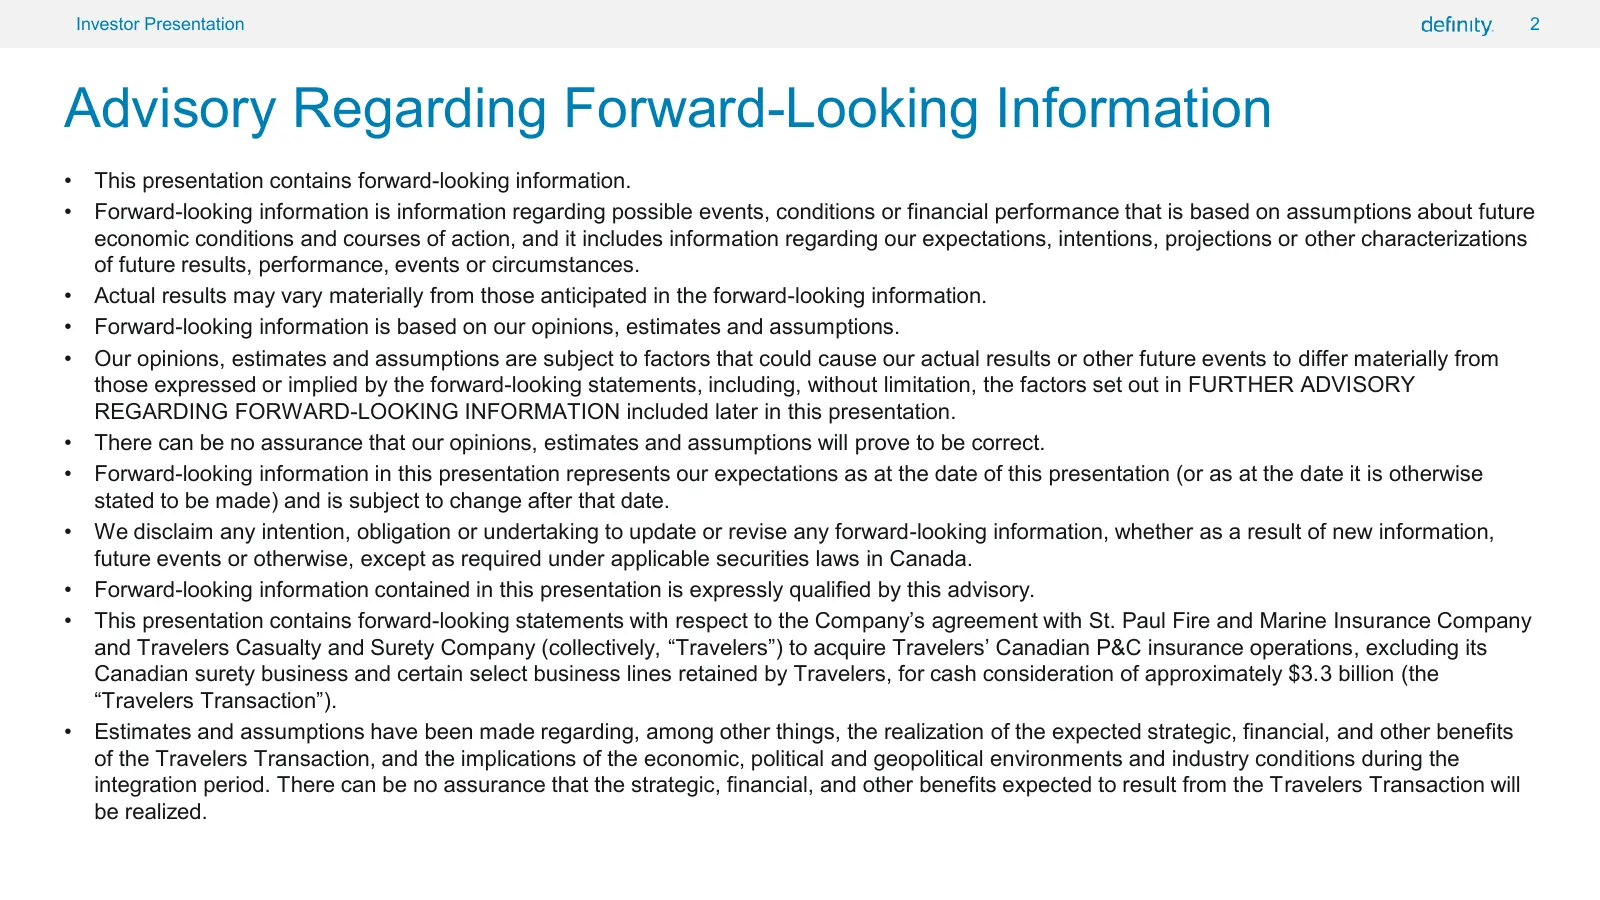
2 Investor Presentation 2 Advisory Regarding Forward-Looking Information • This presentation contains forward-looking information. • Forward-looking information is information regarding possible events, conditions or financial performance that is based on assumptions about future economic conditions
Slide 3: Supplementary Financial Measures and Non-GAAP Financial Measures and Ratios
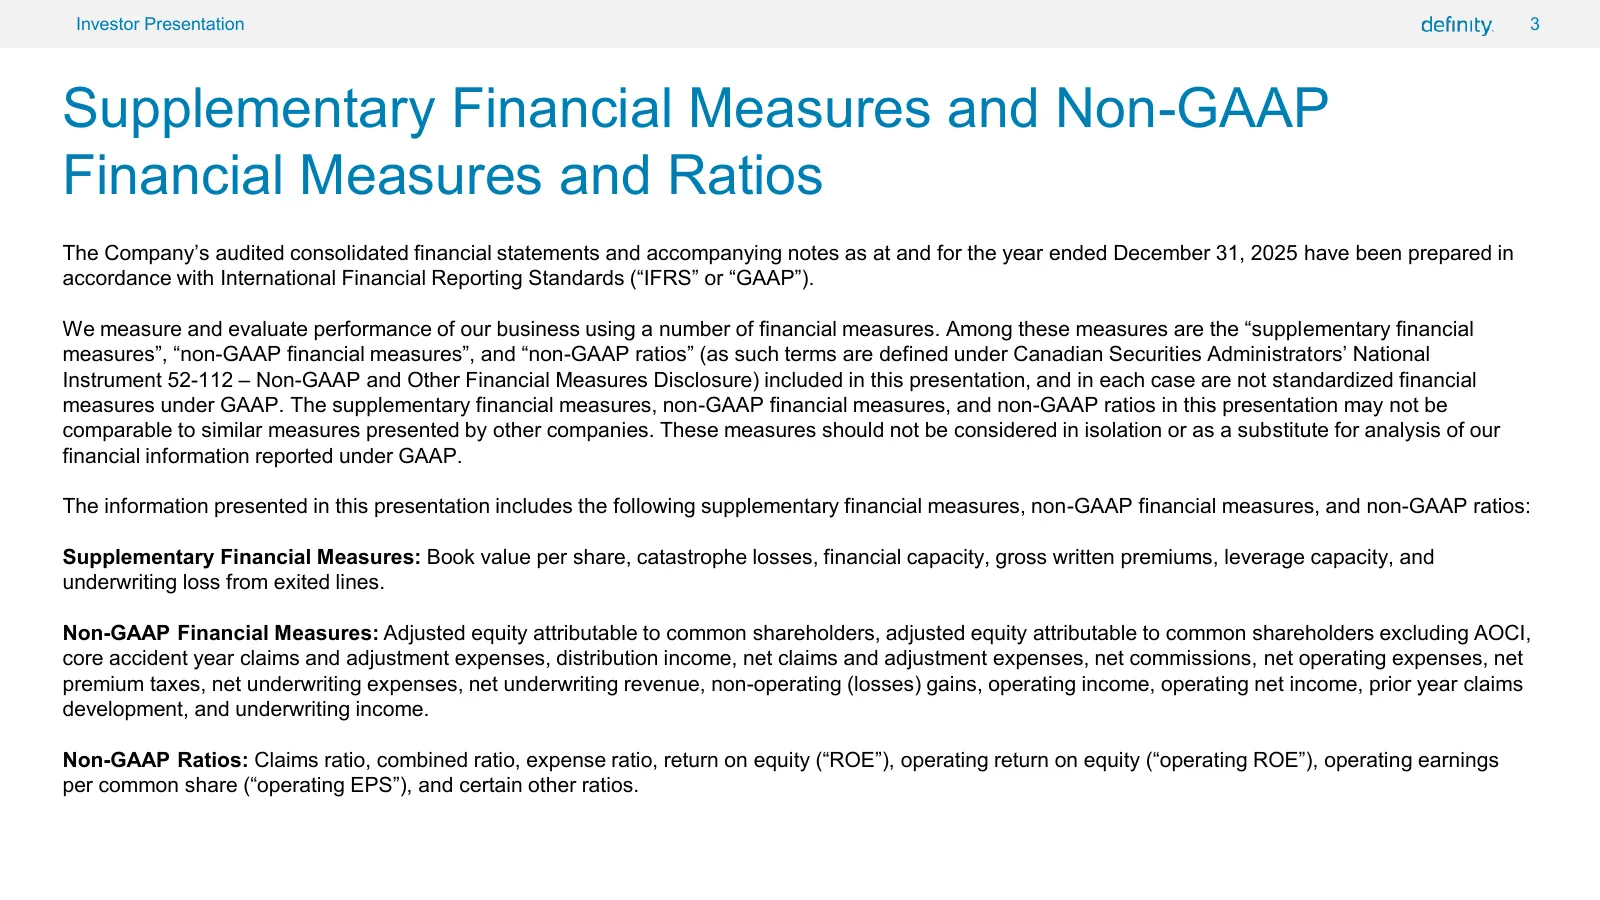
3 Investor Presentation 3 Supplementary Financial Measures and Non-GAAP Financial Measures and Ratios The Company’s audited consolidated financial statements and accompanying notes as at and for the year ended December 31, 2025 have been prepared in accordance with International Financial Reporting

Slide 4: Company Overview
Company Overview definity.
Slide 5: Company Highlights
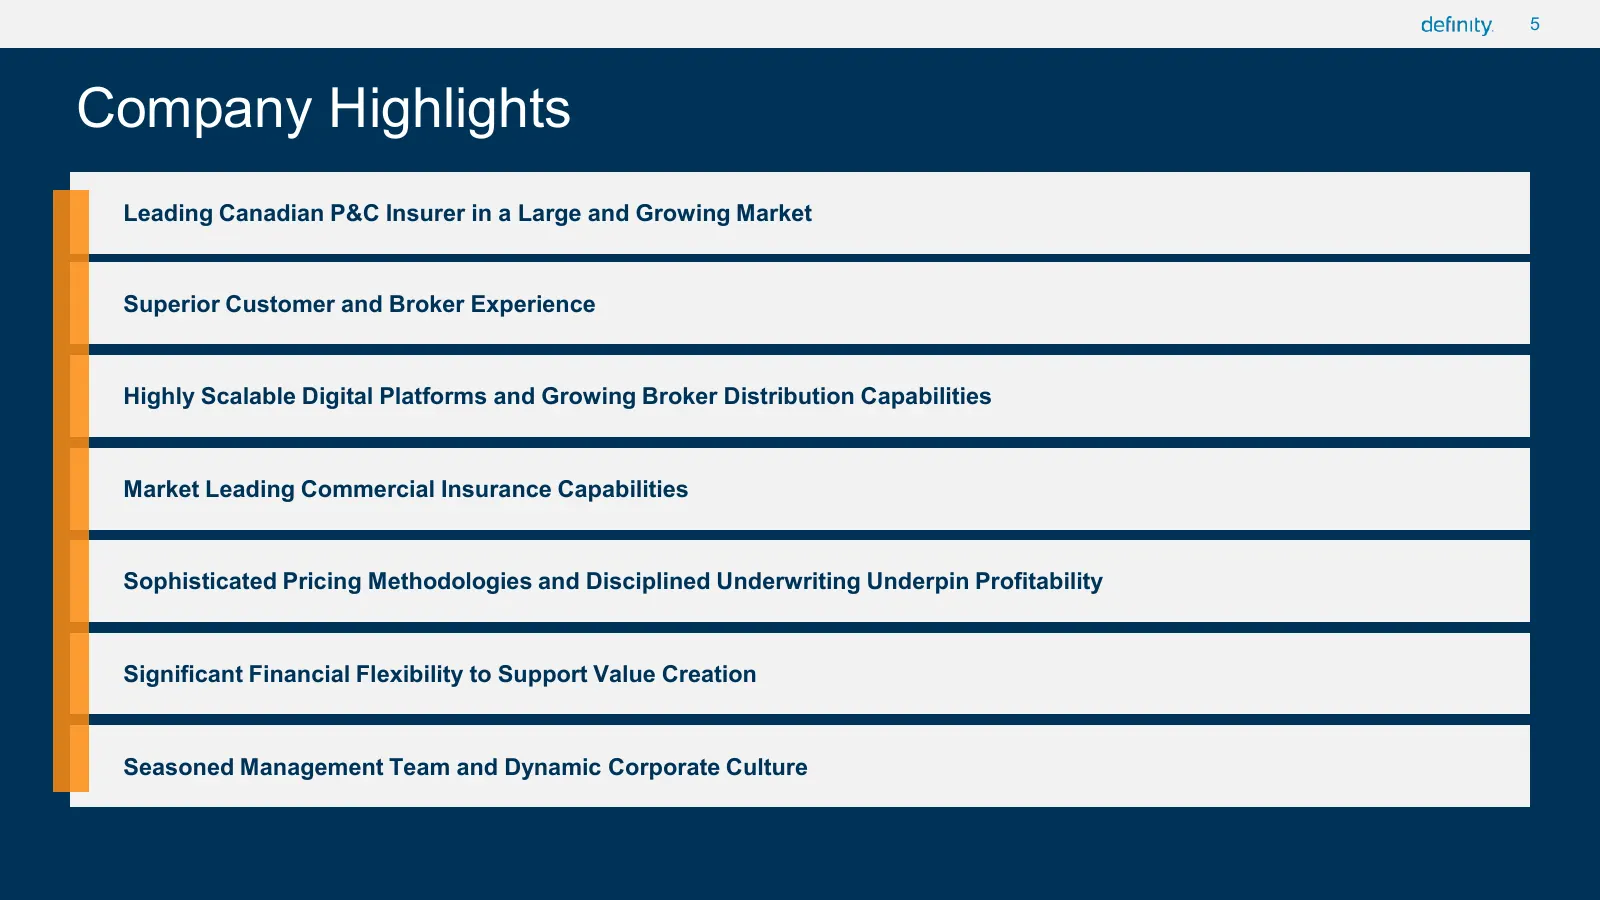
5 5 Company Highlights Leading Canadian P&C Insurer in a Large and Growing Market Superior Customer and Broker Experience Highly Scalable Digital Platforms and Growing Broker Distribution Capabilities Market Leading Commercial Insurance Capabilities Sophisticated Pricing Methodologies and Discipline
Slide 6: Definity Is a Leading Canadian P&C Insurer
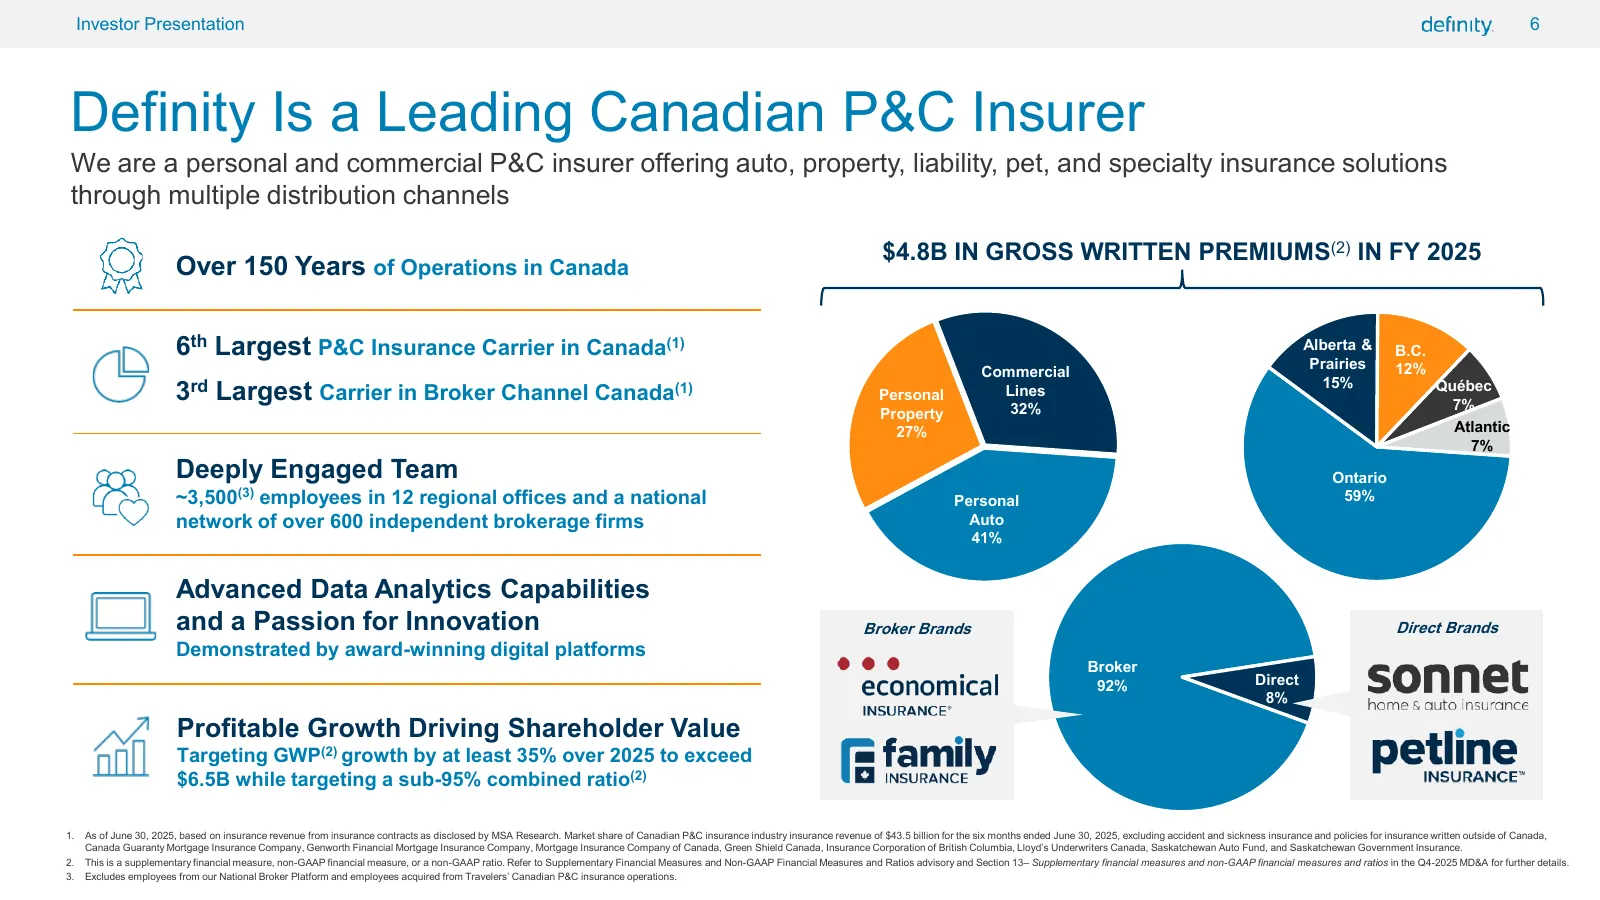
6 Investor Presentation 6 Definity Is a Leading Canadian P&C Insurer We are a personal and commercial P&C insurer offering auto, property, liability, pet, and specialty insurance solutions through multiple distribution channels $4.8B IN GROSS WRITTEN PREMIUMS(2) IN FY 2025 Over 150 Years of Operatio
Slide 7: Our Strategy
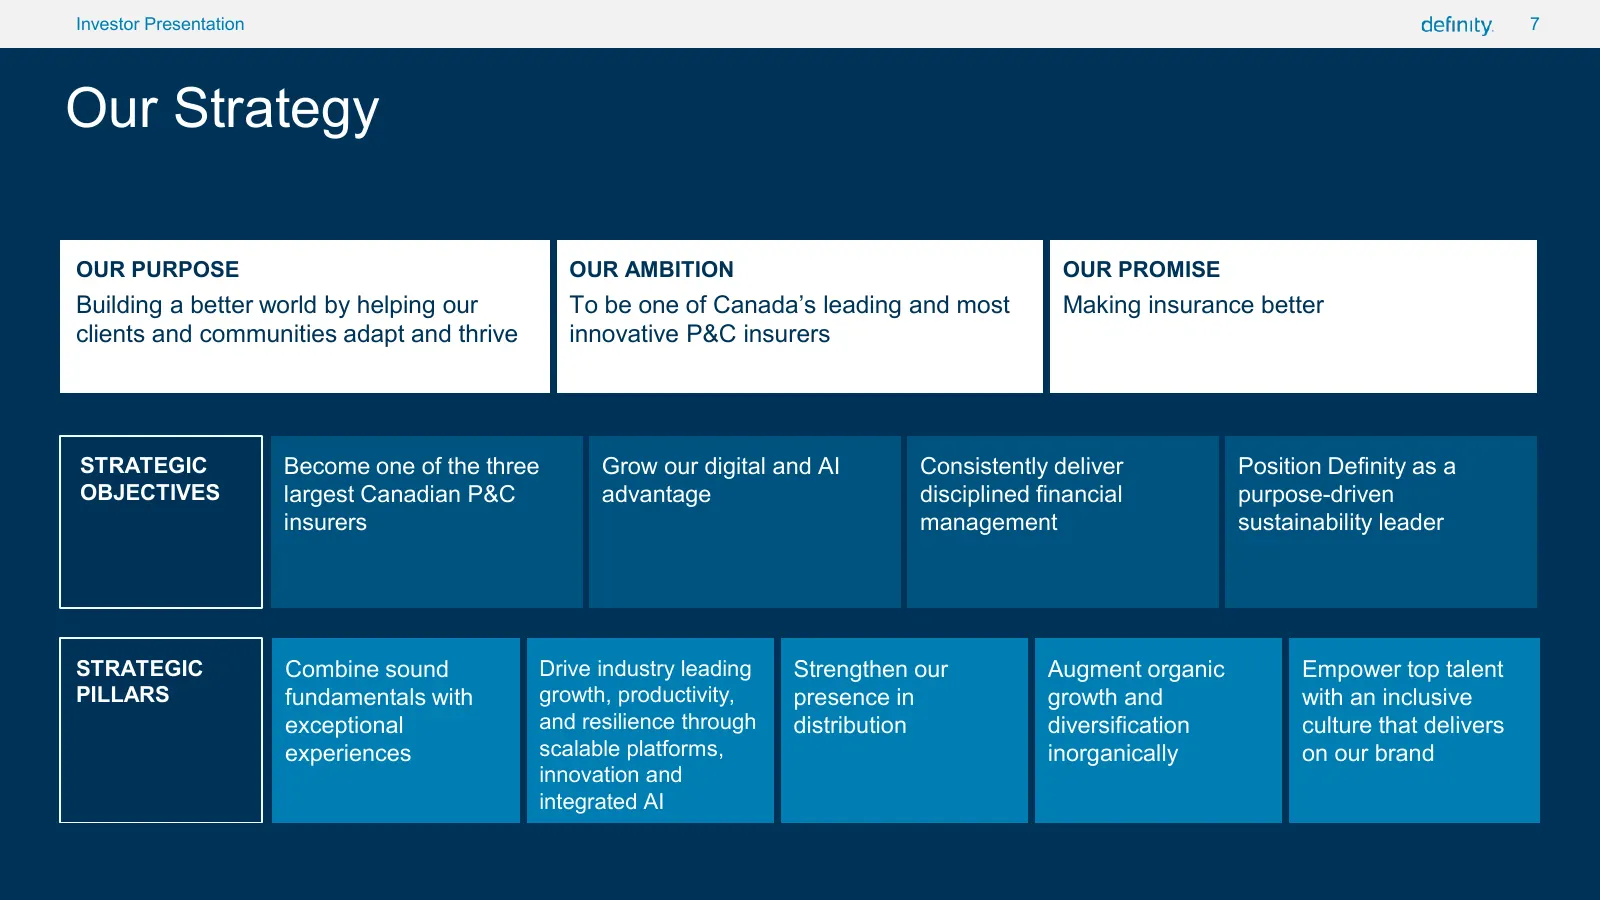
7 Investor Presentation 7 Our Strategy OUR PURPOSE OUR AMBITION OUR PROMISE Building a better world by helping our To be one of Canada’s leading and most Making insurance better clients and communities adapt and thrive innovative P&C insurers STRATEGIC Become one of the three Grow our digital and AI
Slide 8: Superior customer and broker experience
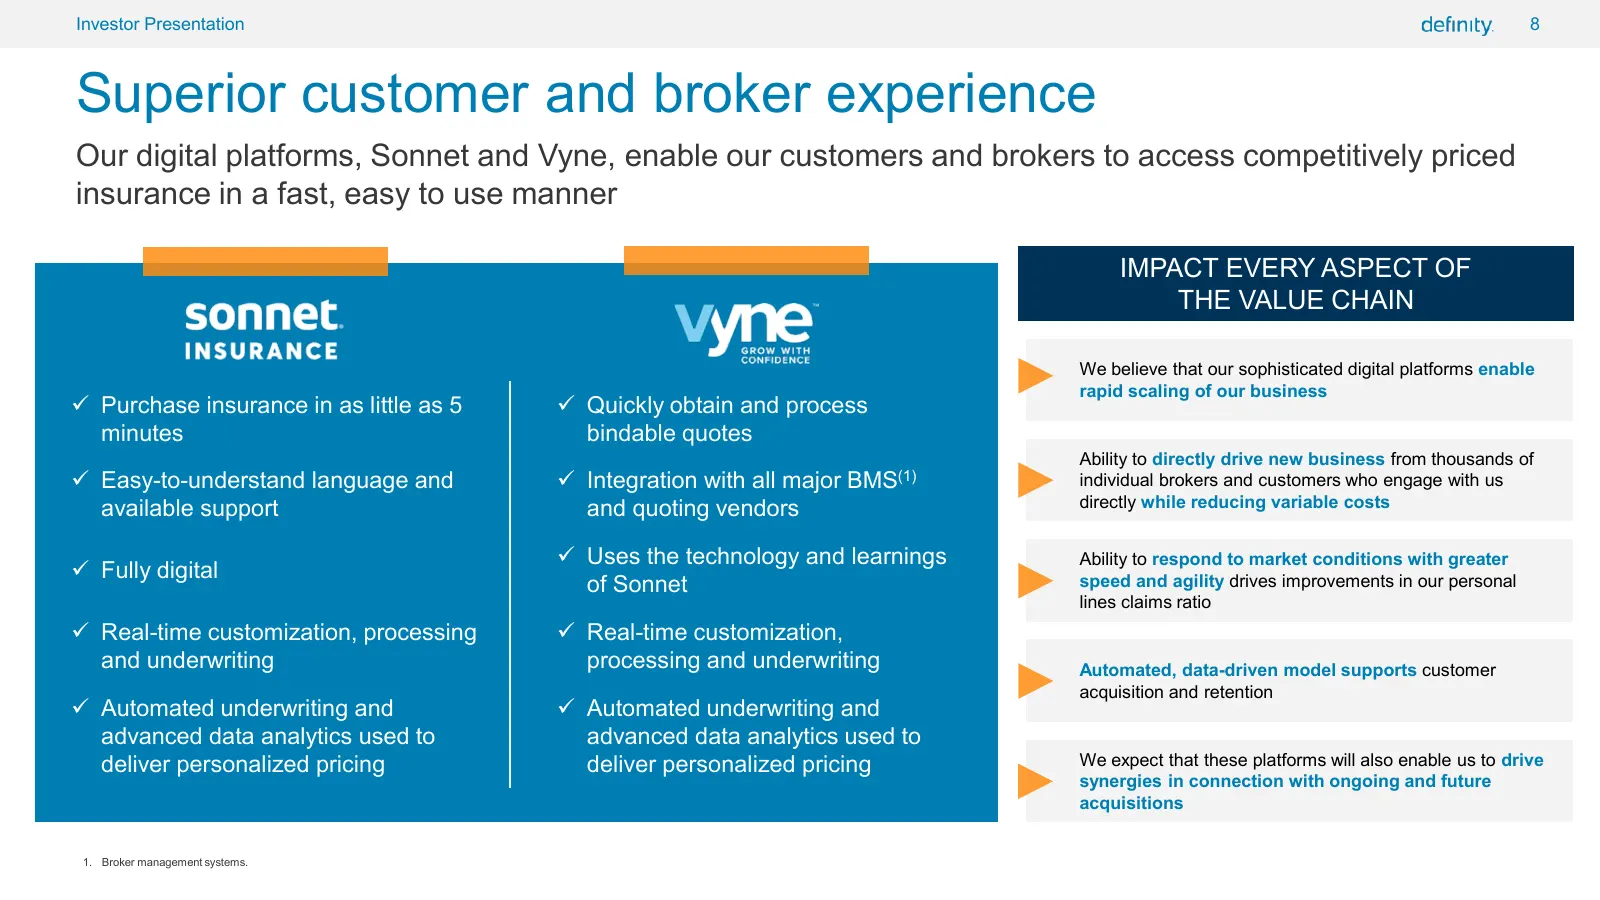
8 Investor Presentation 8 Superior customer and broker experience Our digital platforms, Sonnet and Vyne, enable our customers and brokers to access competitively priced insurance in a fast, easy to use manner IMPACT EVERY ASPECT OF THE VALUE CHAIN We believe that our sophisticated digital platforms
Slide 9: Using Analytics & AI to create business value
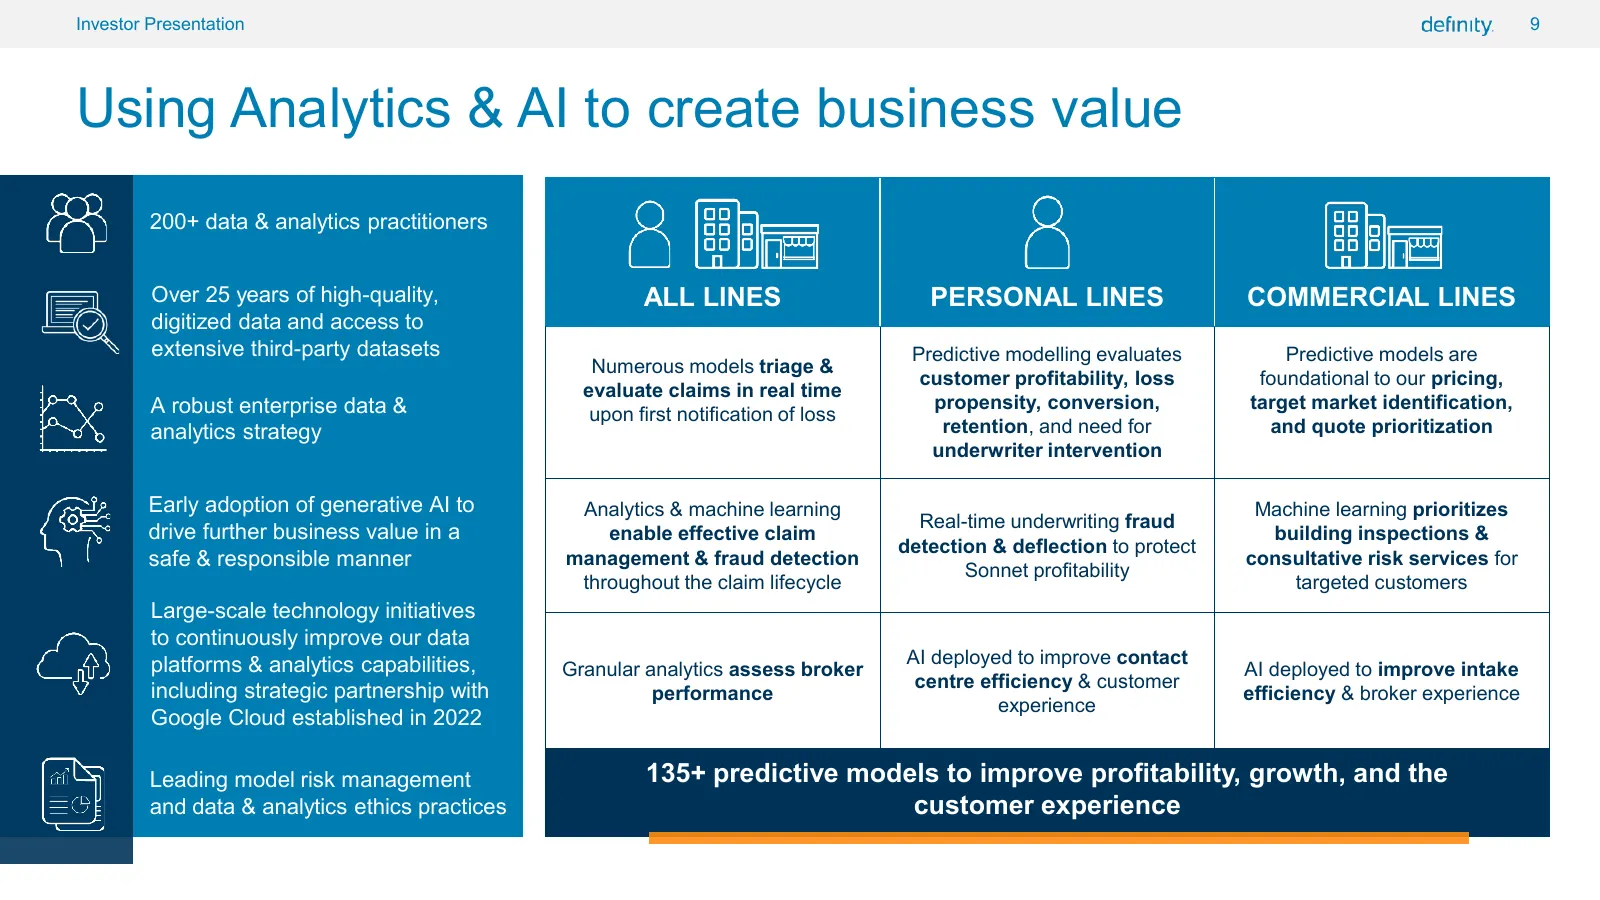
9 Investor Presentation 9 Using Analytics & AI to create business value 200+ data & analytics practitioners Over 25 years of high-quality, ALL LINES PERSONAL LINES COMMERCIAL LINES digitized data and access to extensive third-party datasets Predictive modelling evaluates Predictive models are Numero
Slide 10: Profitable growth with a diversified earnings profile
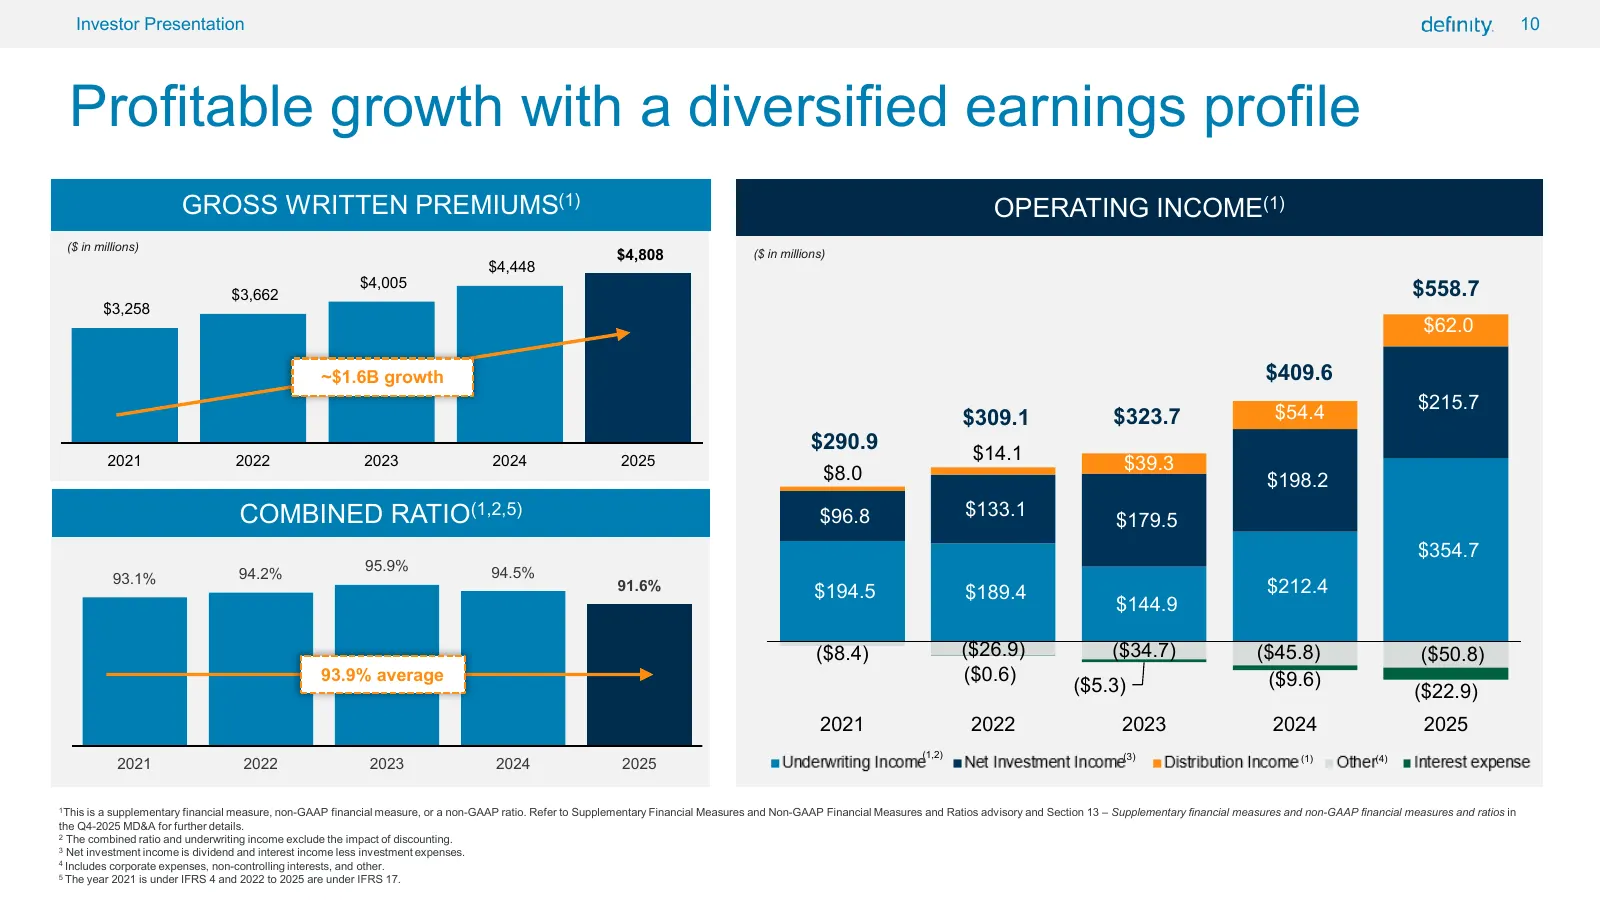
10 Investor Presentation 10 Profitable growth with a diversified earnings profile GROSS WRITTEN PREMIUMS(1) OPERATING INCOME(1) ($ in millions) $4,808 ($ in millions) $4,448 $4,005 $558.7 $3,662 $3,258 $62.0 ~$1.6B growth $409.6 $54.4 $215.7 $309.1 $323.7 $290.9 $14.1 2021 2022 2023 2024 2025 $8.0 $
Slide 11: Driving profitable growth in Personal Auto
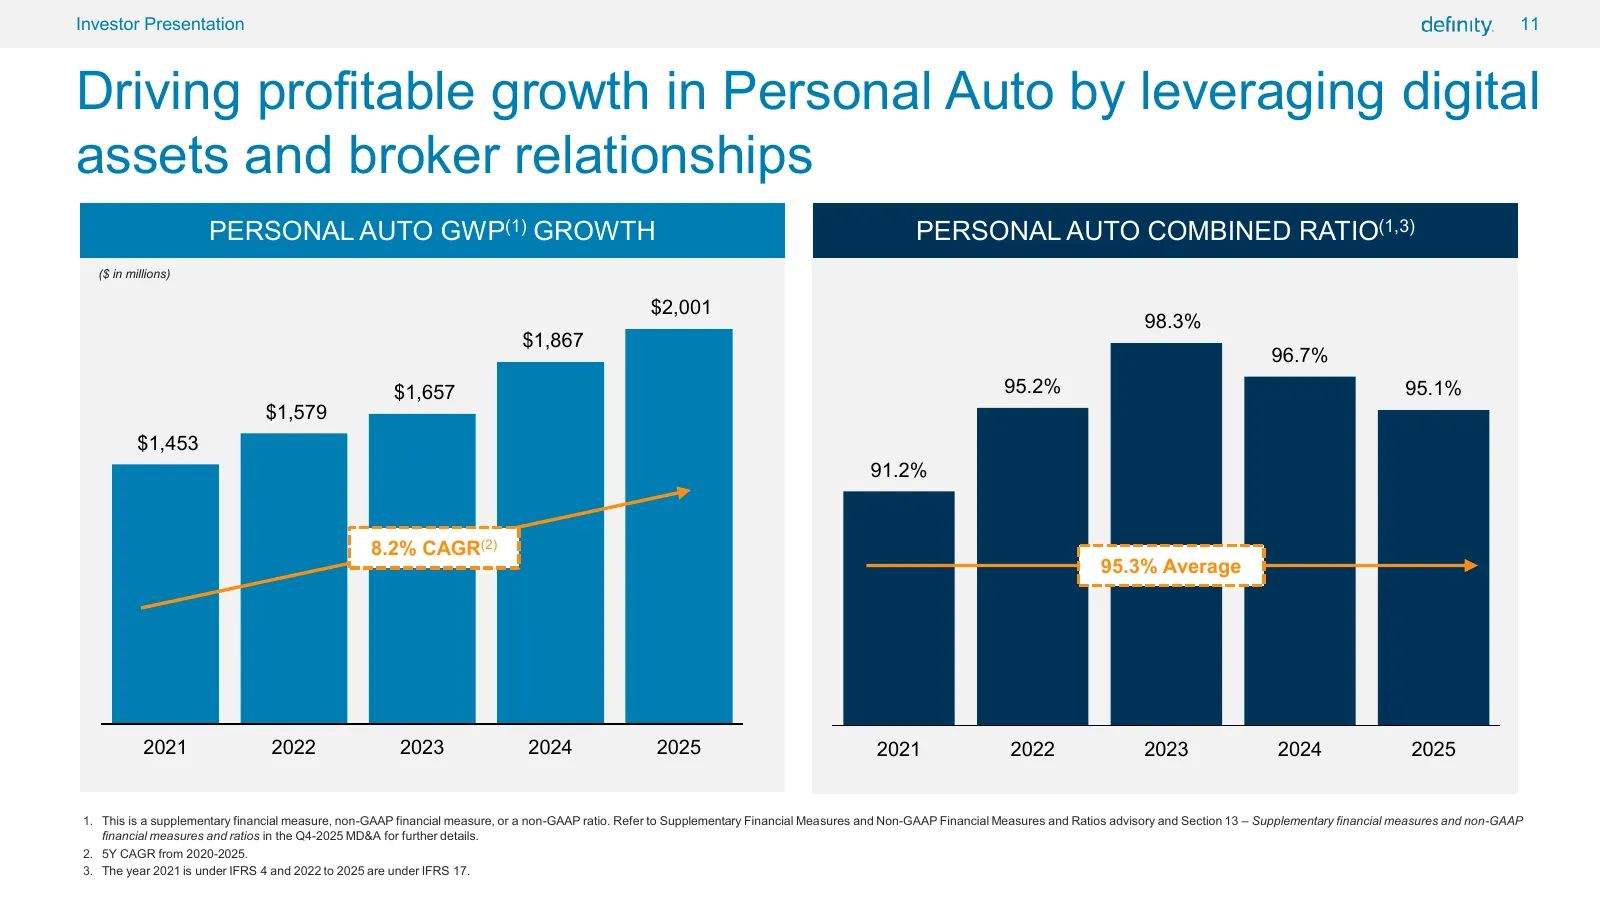
11 Investor Presentation 11 Driving profitable growth in Personal Auto by leveraging digital assets and broker relationships PERSONAL AUTO GWP(1) GROWTH PERSONAL AUTO COMBINED RATIO(1,3) ($ in millions) $2,001 98.3% $1,867 96.7% $1,657 95.2% 95.1% $1,579 $1,453 91.2% 8.2% CAGR(2) 95.3% Average 2021
Slide 12: Solid growth in Personal Property
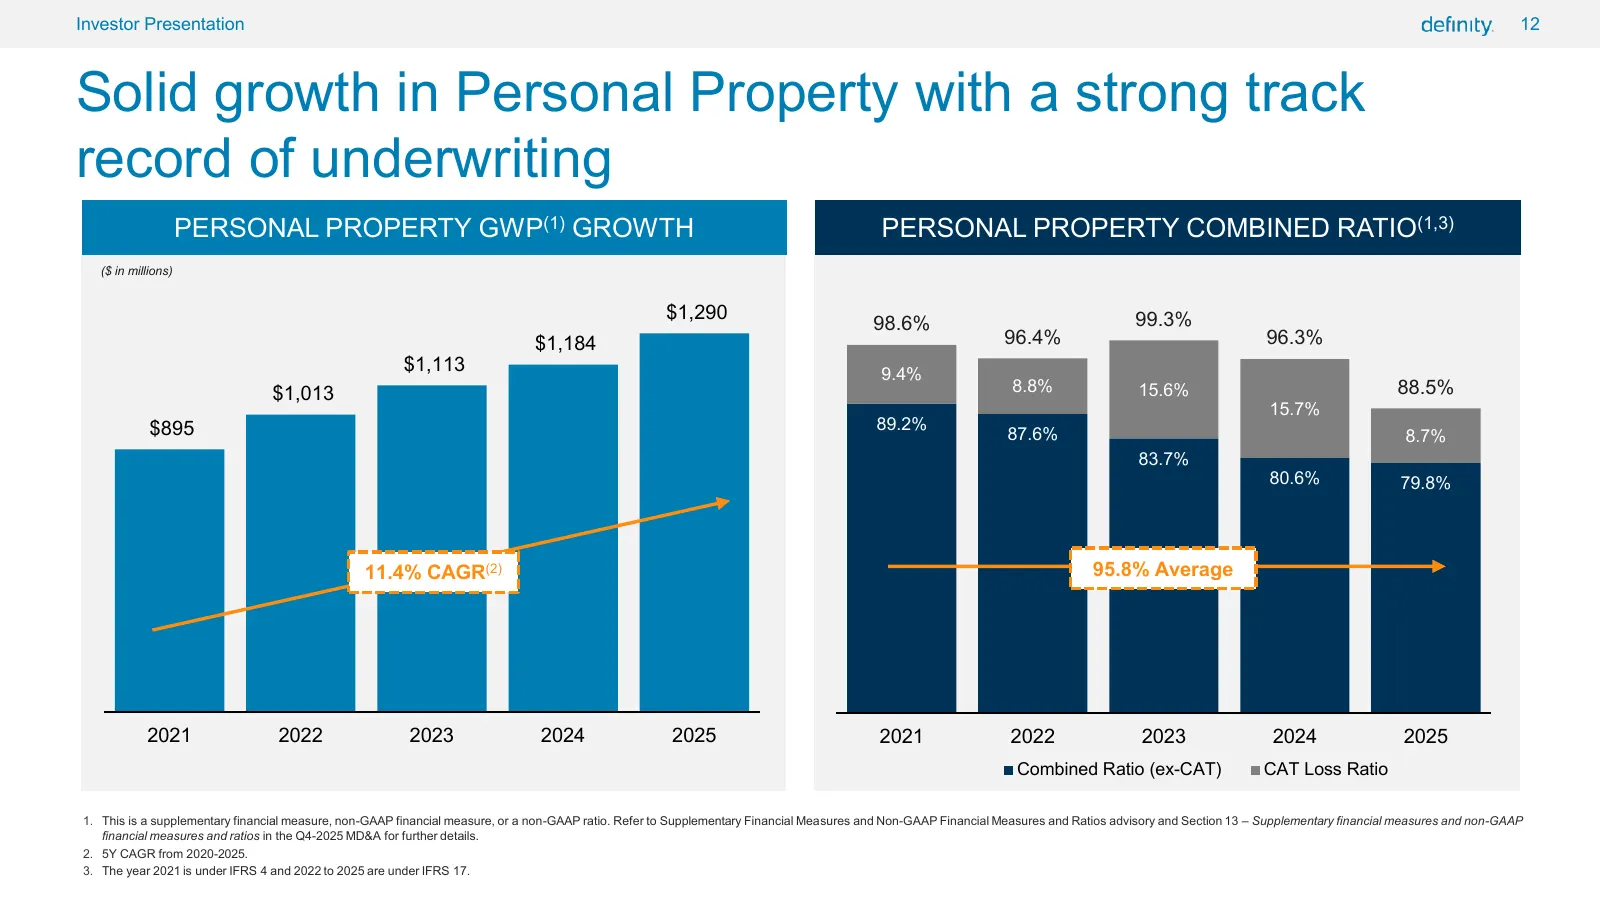
12 Investor Presentation 12 Solid growth in Personal Property with a strong track record of underwriting PERSONAL PROPERTY GWP(1) GROWTH PERSONAL PROPERTY COMBINED RATIO(1,3) ($ in millions) $1,290 99.3% 98.6% $1,184 96.4% 96.3% $1,113 9.4% $1,013 8.8% 15.6% 88.5% 15.7% $895 89.2% 87.6% 8.7% 83.7% 8
Slide 13: Growing Commercial Insurance capabilities
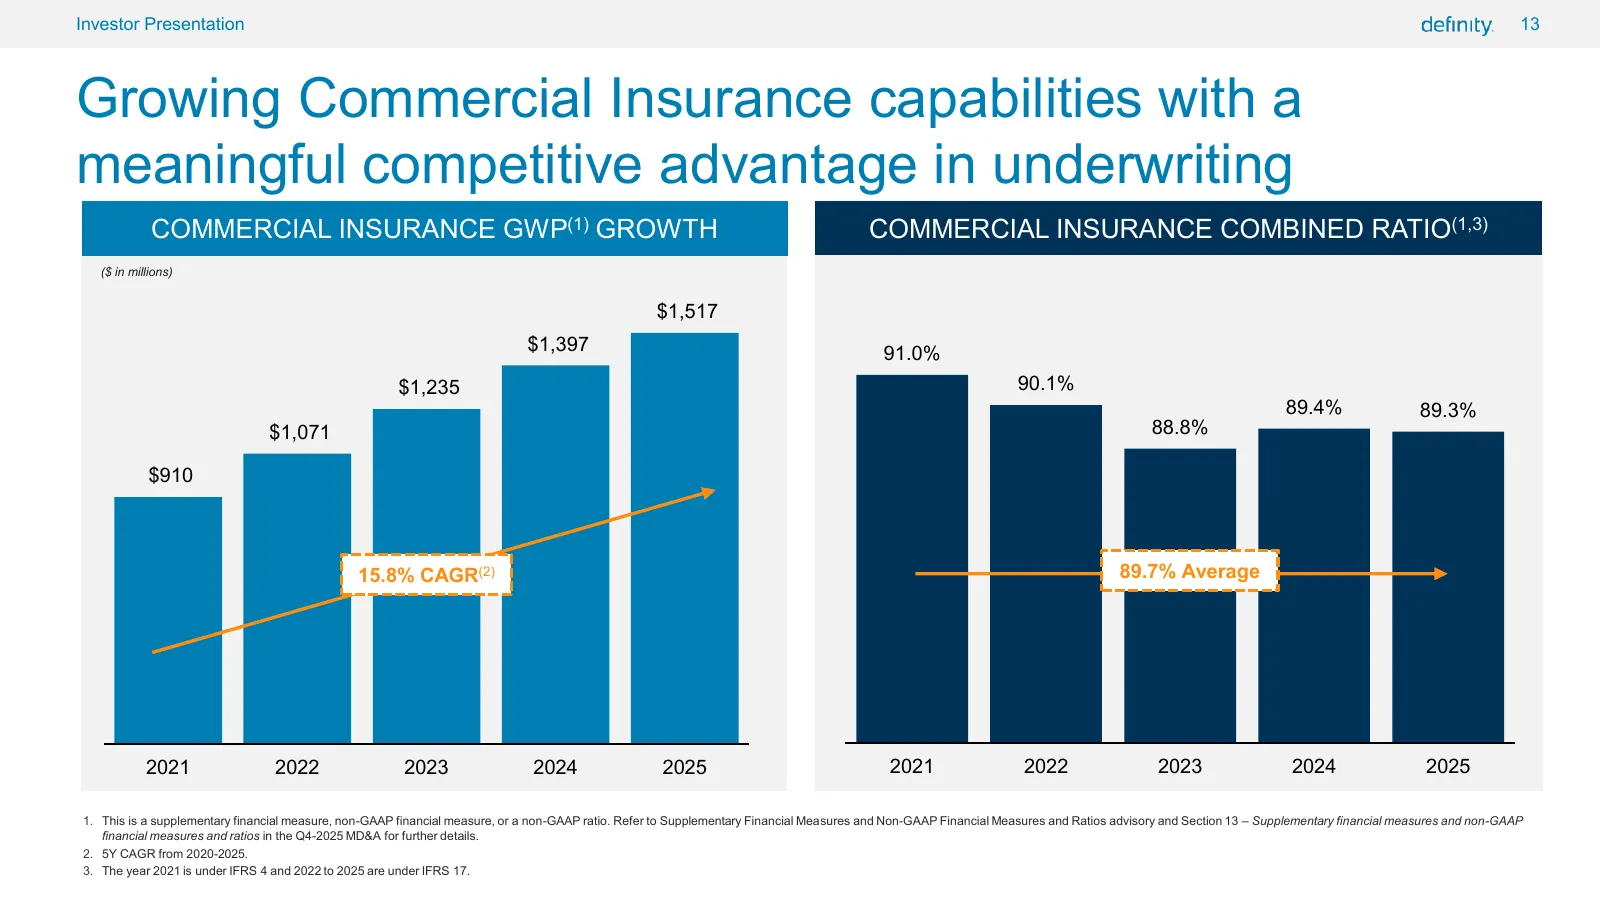
13 Investor Presentation 13 Growing Commercial Insurance capabilities with a meaningful competitive advantage in underwriting COMMERCIAL INSURANCE GWP(1) GROWTH COMMERCIAL INSURANCE COMBINED RATIO(1,3) ($ in millions) $1,517 $1,397 91.0% $1,235 90.1% 89.4% 89.3% $1,071 88.8% $910 15.8% CAGR(2) 89.7%
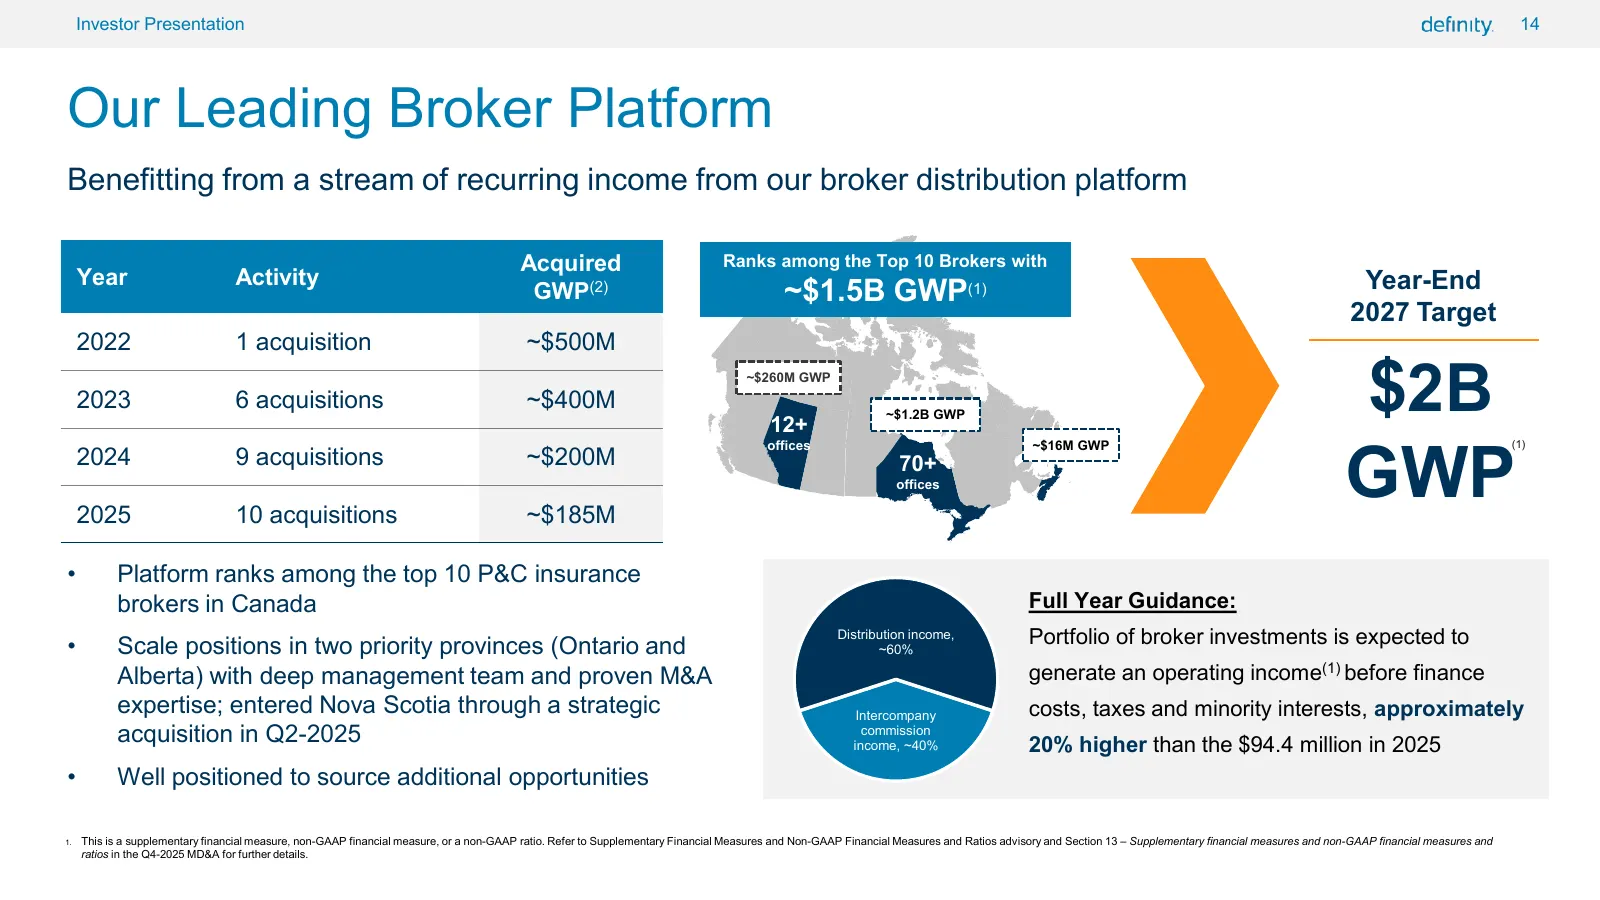
Slide 14: Our Leading Broker Platform
14 Investor Presentation 14 Our Leading Broker Platform Benefitting from a stream of recurring income from our broker distribution platform Acquired Ranks among the Top 10 Brokers with Year Activity Year-End GWP(2) ~$1.5B GWP(1) 2027 Target 2022 1 acquisition ~$500M 2023 6 acquisitions ~$400M ~$260M
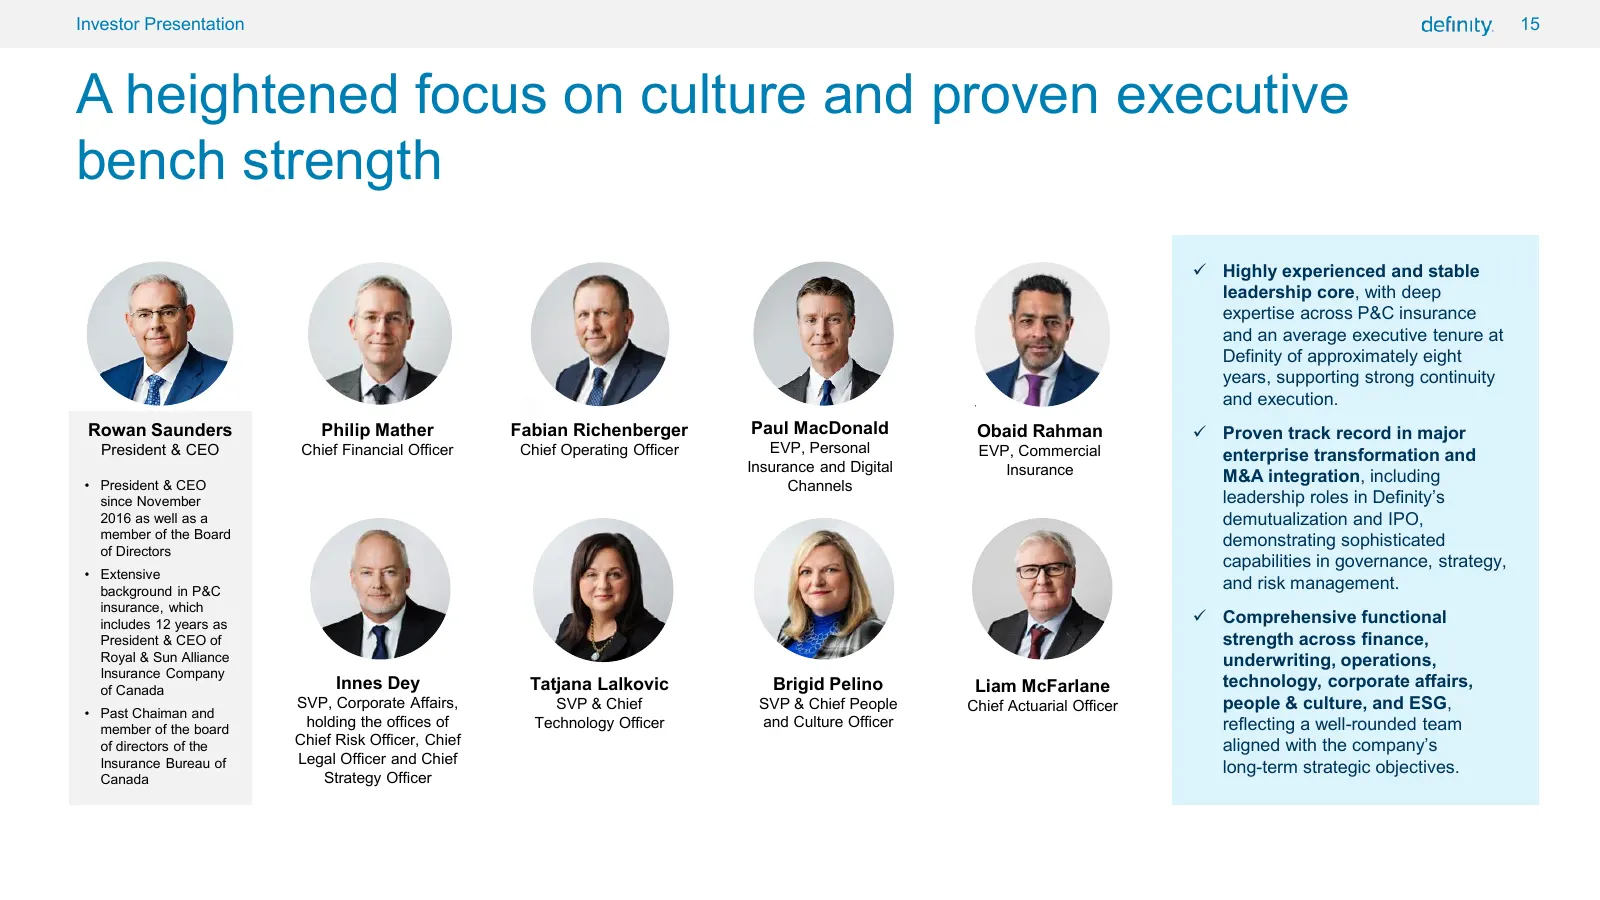
Slide 15: A heightened focus on culture and proven executive bench strength
15 Investor Presentation 15 A heightened focus on culture and proven executive bench strength ✓ Highly experienced and stable leadership core, with deep expertise across P&C insurance and an average executive tenure at Definity of approximately eight years, supporting strong continuity and execution
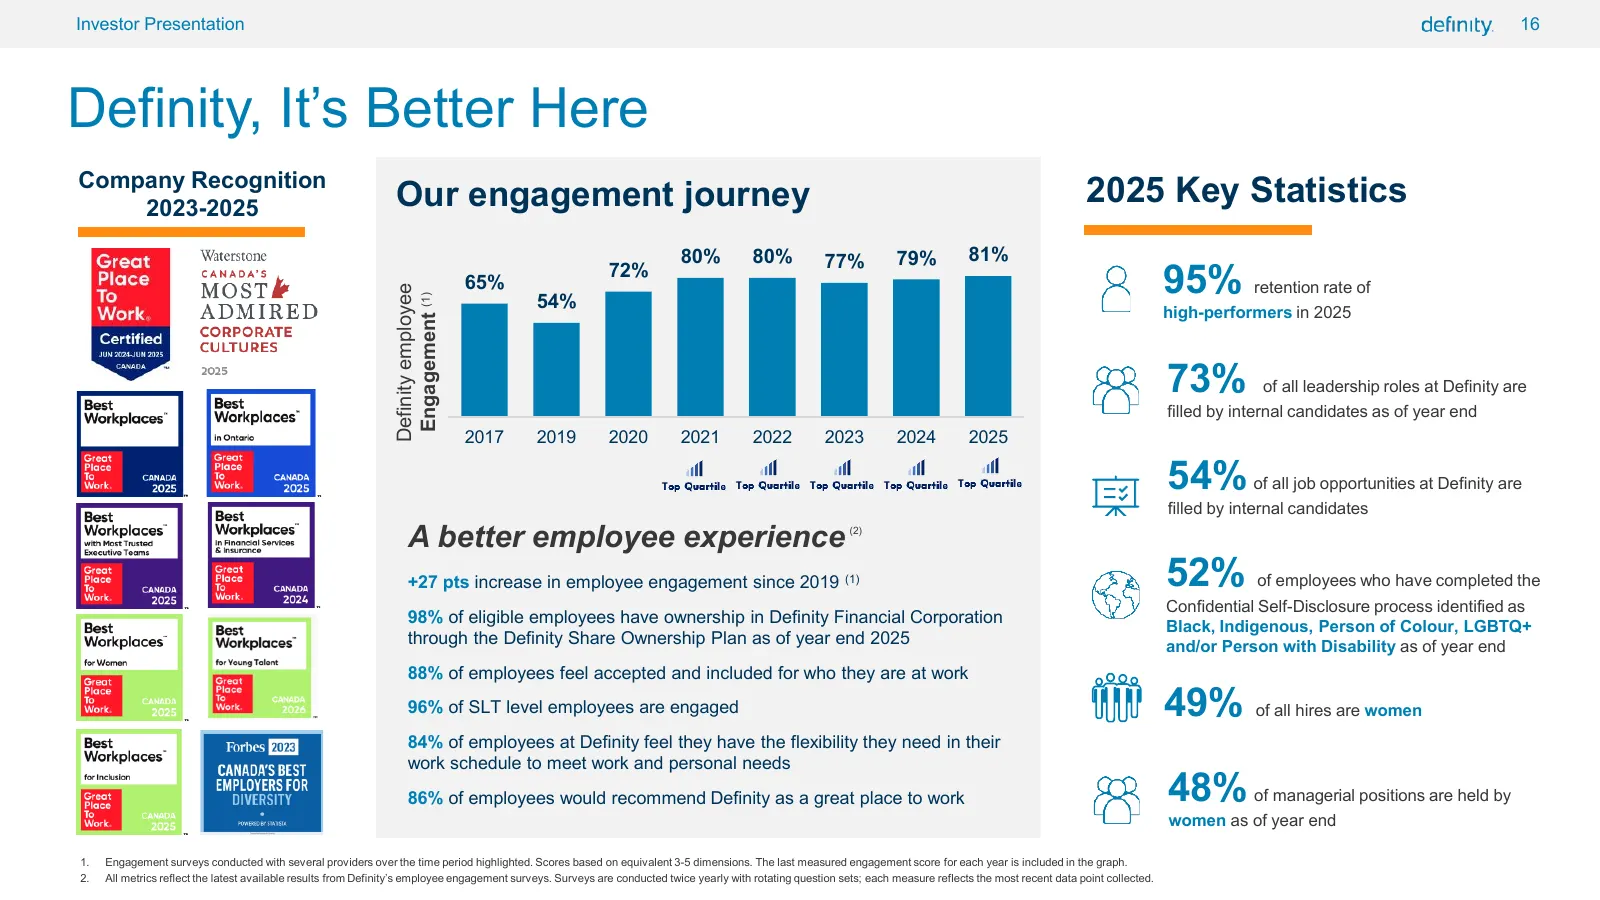
Slide 16: Definity, It's Better Here
16 Investor Presentation 16 Definity, It’s Better Here Company Recognition 2023-2025 Our engagement journey 2025 Key Statistics 80% 80% 77% 79% 81% 65% 72% 95% retention rate of Definity employee 54% Engagement (1) high-performers in 2025 73% of all leadership roles at Definity are filled by interna
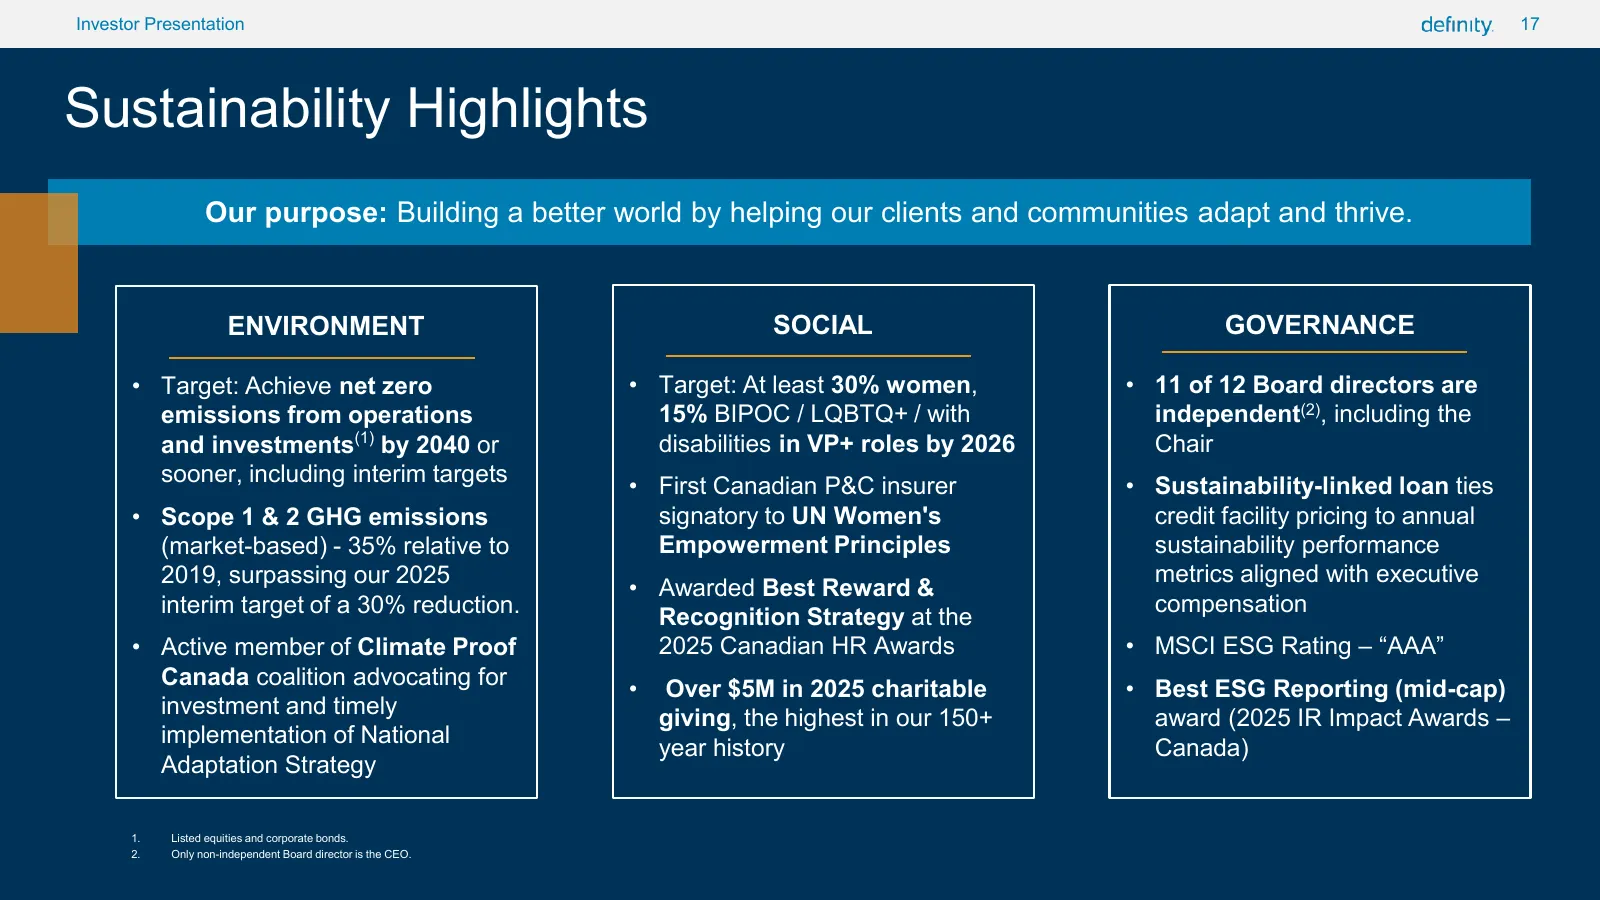
Slide 17: Sustainability Highlights
17 Investor Presentation 17 Sustainability Highlights Our purpose: Building a better world by helping our clients and communities adapt and thrive. ENVIRONMENT SOCIAL GOVERNANCE • Target: Achieve net zero • Target: At least 30% women, • 11 of 12 Board directors are emissions from operations 15% BIPO
Slide 18: Financial Performance and Analysis
Financial Performance and Analysis
Slide 19: Our Financial Targets for 2026
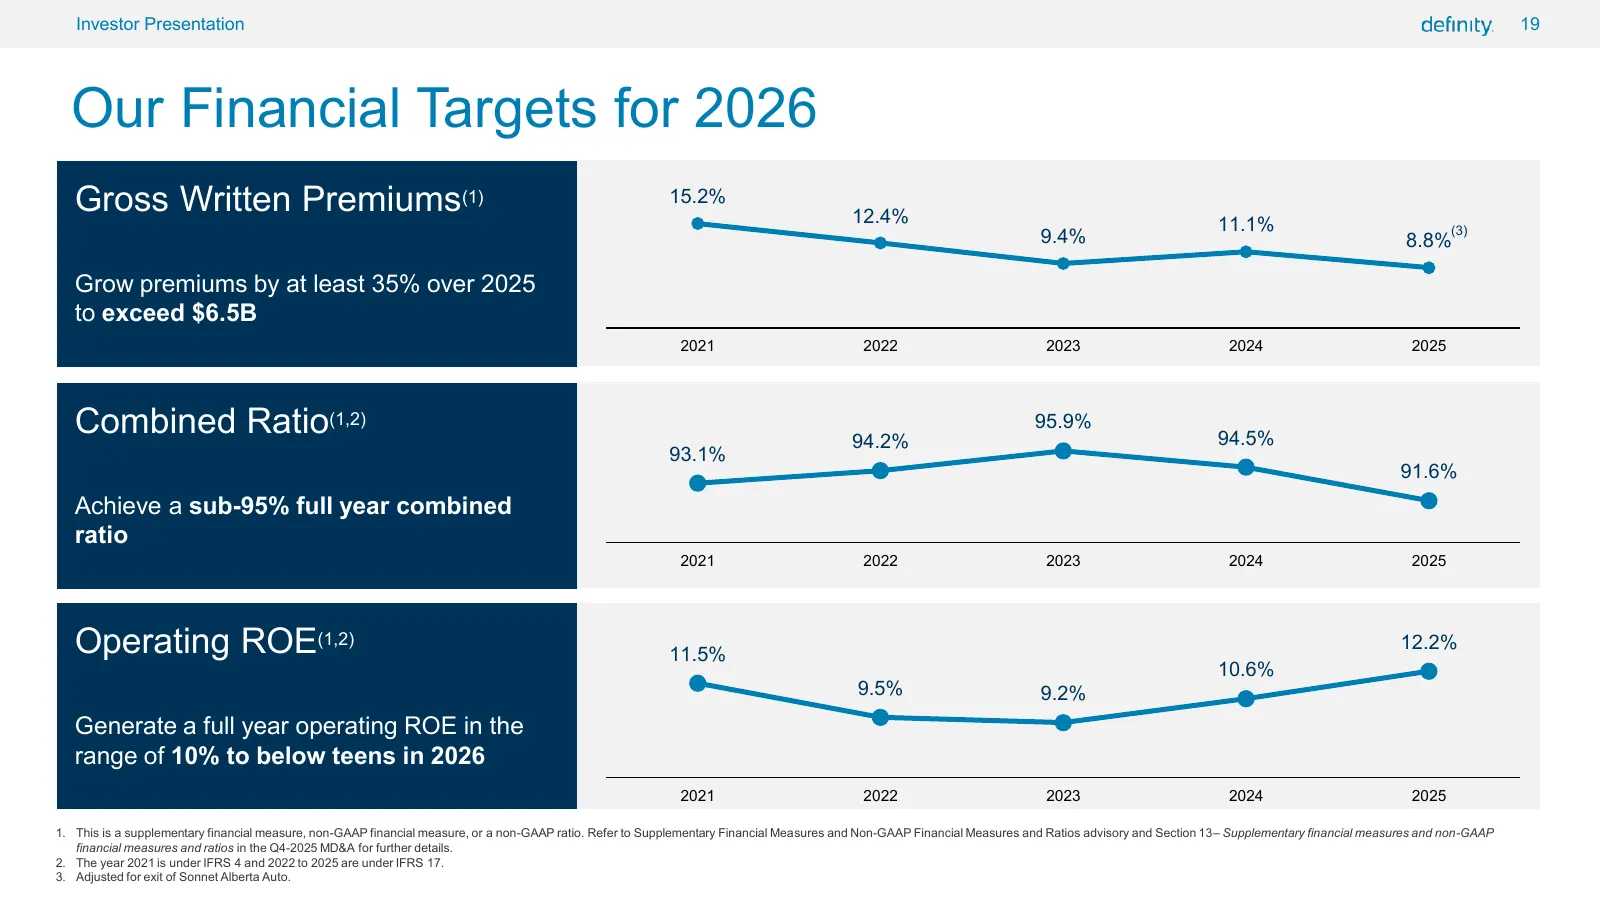
19 Investor Presentation 19 Our Financial Targets for 2026 Gross Written Premiums(1) 15.2% 12.4% 11.1% (3) 9.4% 8.8% Grow premiums by at least 35% over 2025 to exceed $6.5B 2021 2022 2023 2024 2025 Combined Ratio(1,2) 94.2% 95.9% 94.5% 93.1% 91.6% Achieve a sub-95% full year combined ratio 2021 2022
Slide 20: Balance Sheet Strength
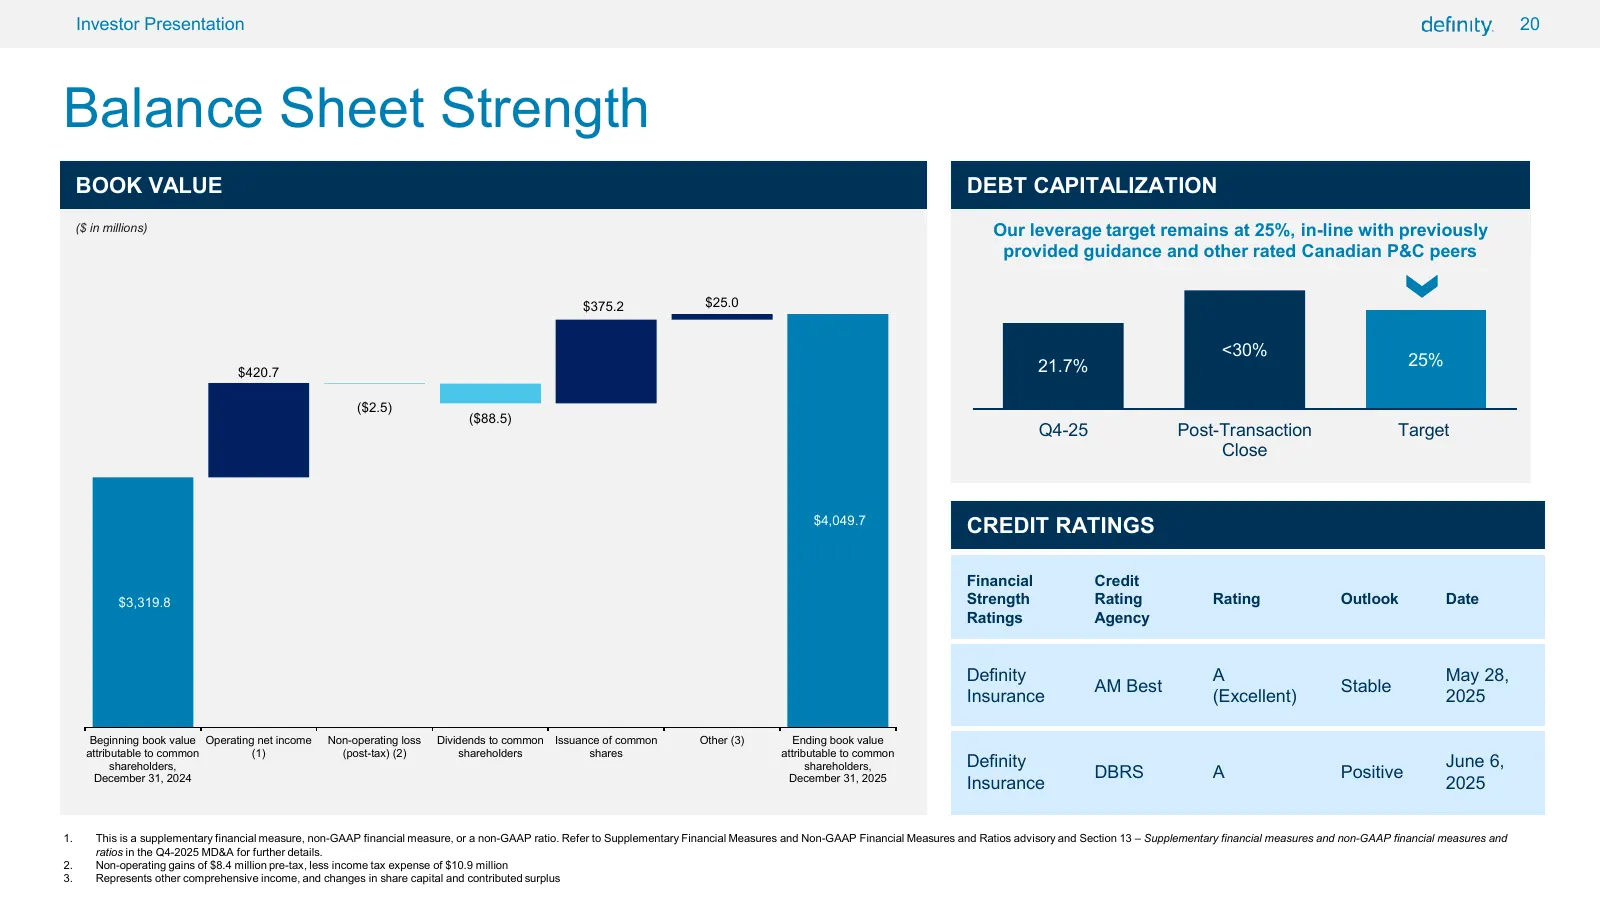
20 Investor Presentation 20 Balance Sheet Strength BOOK VALUE DEBT CAPITALIZATION ($ in millions) Our leverage target remains at 25%, in-line with previously provided guidance and other rated Canadian P&C peers $375.2 $25.0 <30% 21.7% 25% $420.7 ($2.5) ($88.5) Q4-25 Post-Transaction Target Close $4,
Slide 21: Capital Management
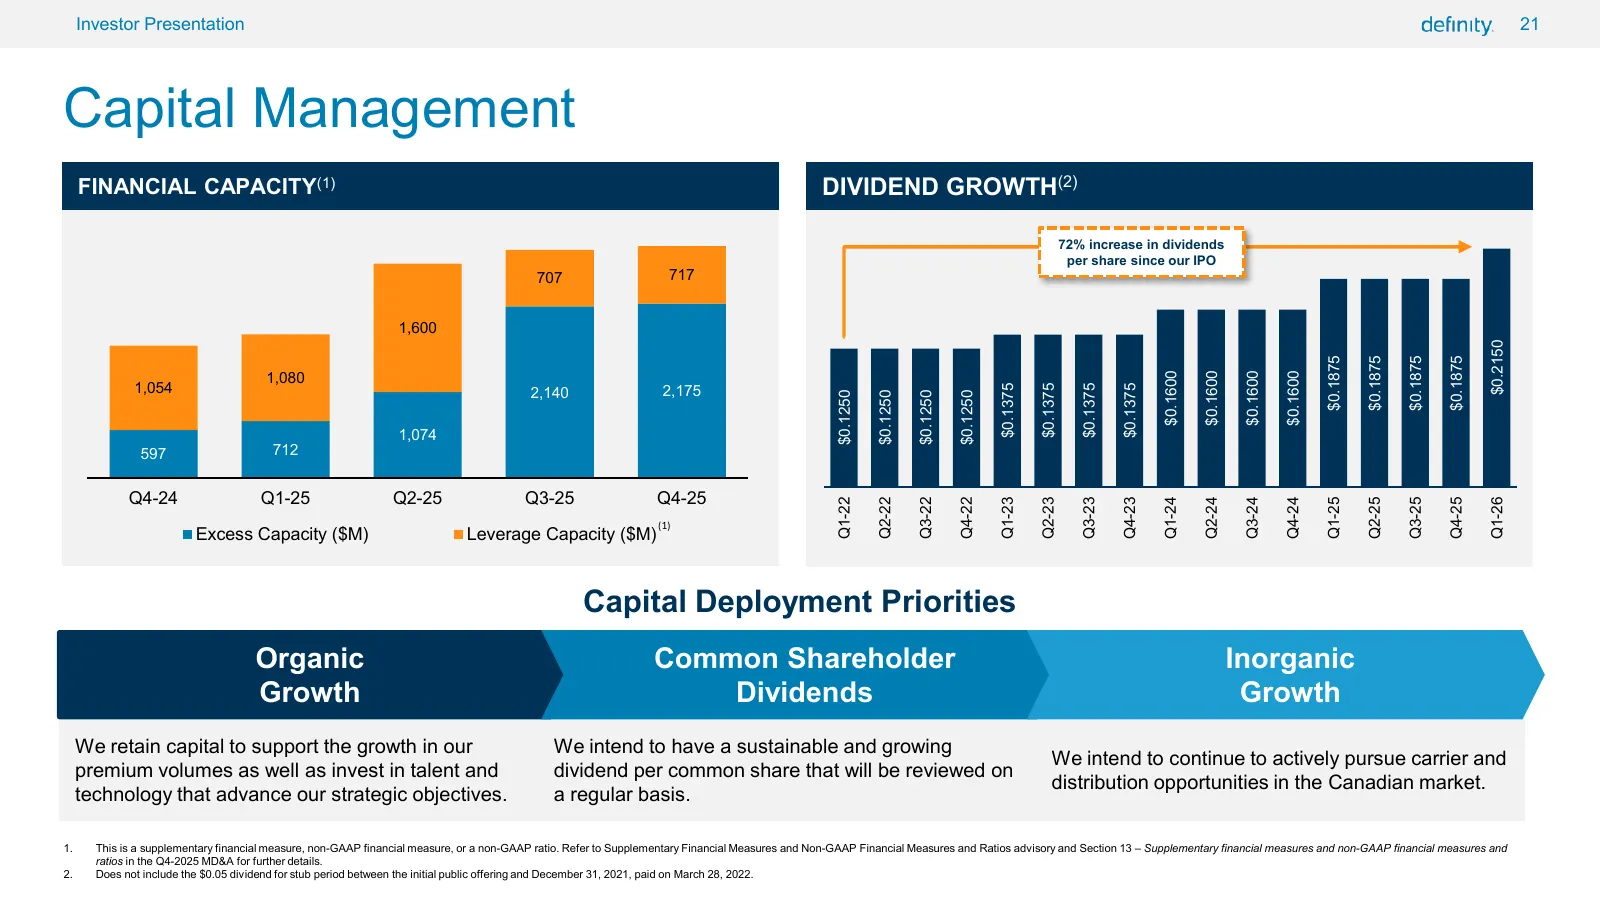
21 Investor Presentation 21 Capital Management FINANCIAL CAPACITY(1) DIVIDEND GROWTH(2) 72% increase in dividends per share since our IPO 707 717 1,600 $0.2150 $0.1875 $0.1875 $0.1875 $0.1875 1,080 $0.1600 $0.1600 $0.1600 $0.1600 1,054 2,175 $0.1375 $0.1375 $0.1375 $0.1375 2,140 $0.1250 $0.1250 $0.1
Slide 22: Prudent Approach to Reserving and Reinsurance
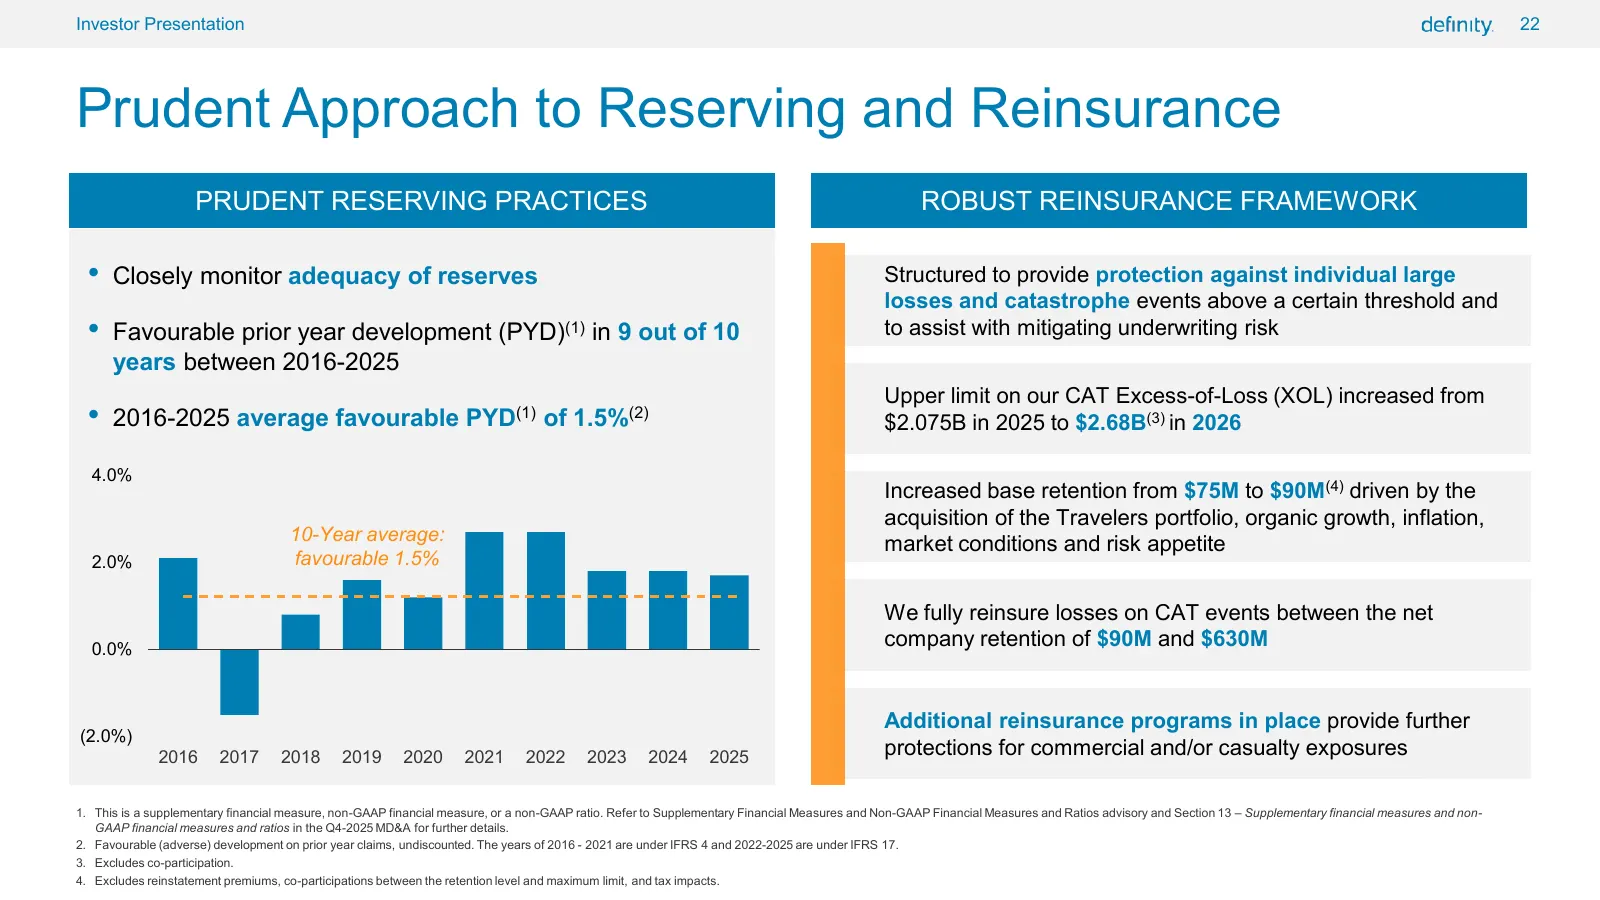
22 Investor Presentation 22 Prudent Approach to Reserving and Reinsurance PRUDENT RESERVING PRACTICES ROBUST REINSURANCE FRAMEWORK • Closely monitor adequacy of reserves Structured to provide protection against individual large losses and catastrophe events above a certain threshold and • Favourable
Slide 23: High-quality Investment Portfolio
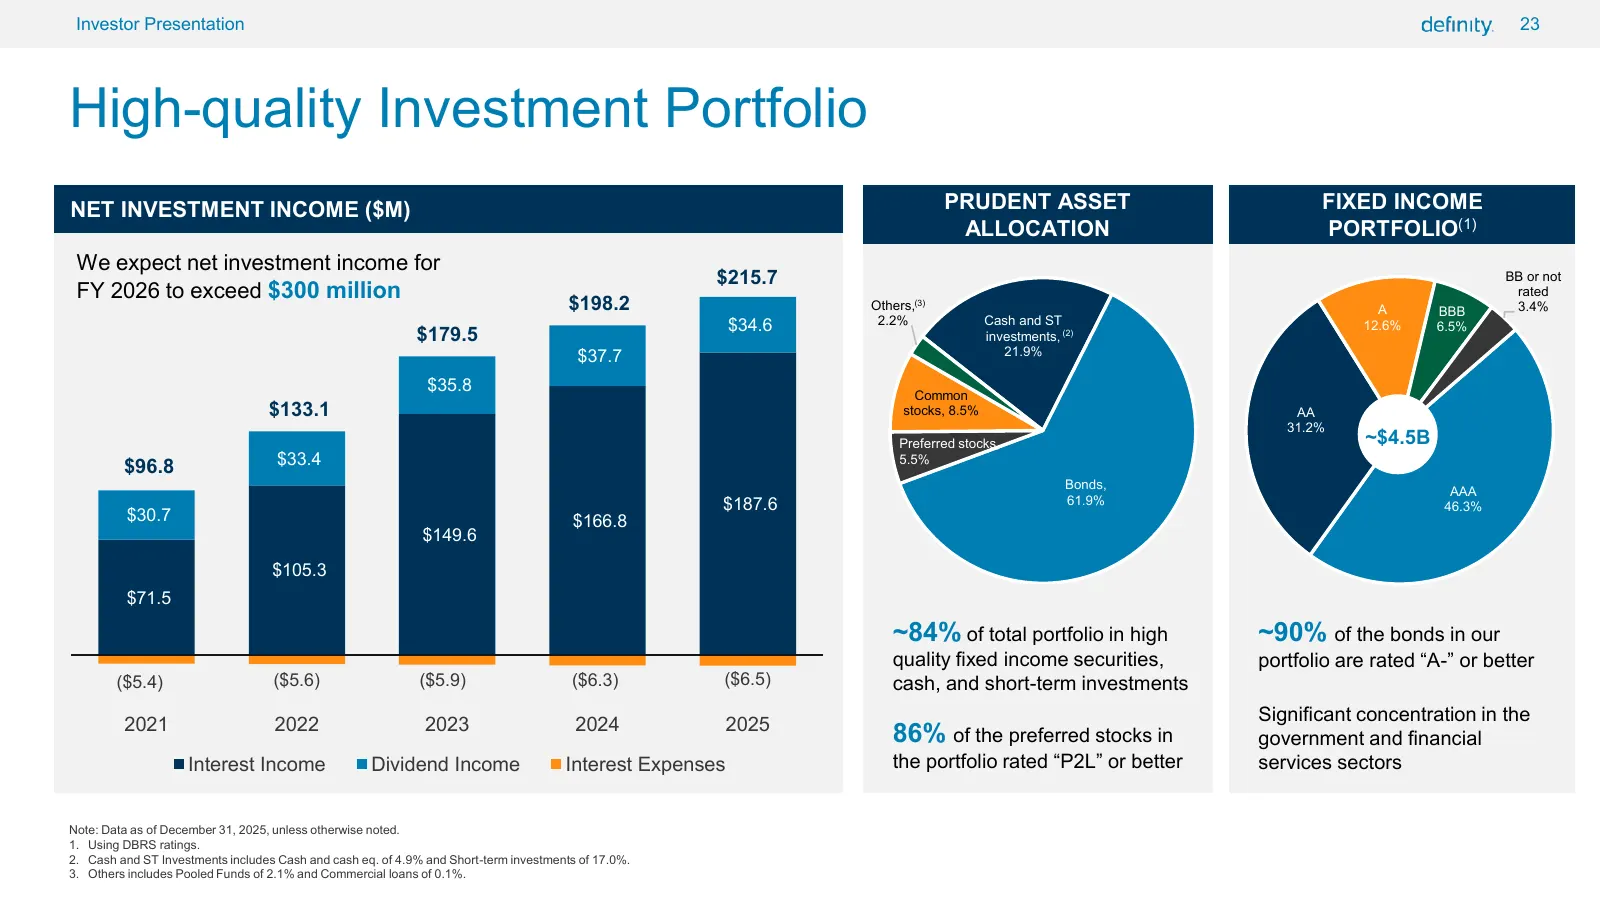
23 Investor Presentation 23 High-quality Investment Portfolio NET INVESTMENT INCOME ($M) PRUDENT ASSET FIXED INCOME ALLOCATION PORTFOLIO(1) We expect net investment income for $215.7 BB or not FY 2026 to exceed $300 million rated $198.2 Others,(3) A BBB 3.4% $34.6 2.2% Cash and ST 12.6% 6.5% $179.5

Slide 24: Travelers Transaction
Travelers Transaction definity.
Slide 25: Meaningfully Advancing our Strategy & Market Position
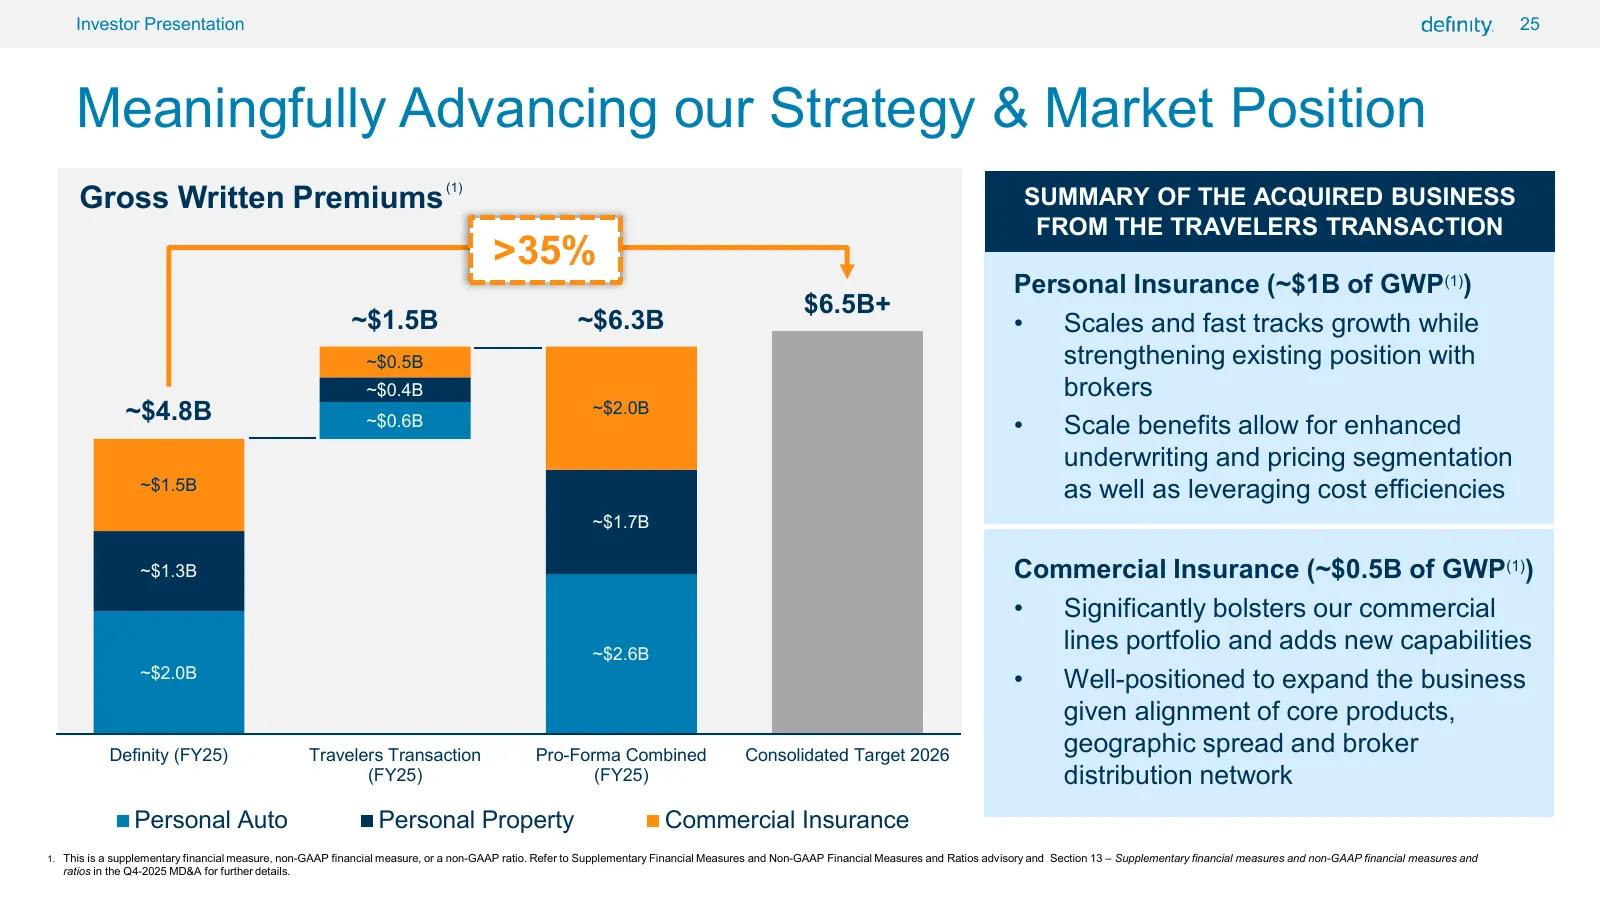
25 Investor Presentation 25 Meaningfully Advancing our Strategy & Market Position Gross Written Premiums (1) SUMMARY OF THE ACQUIRED BUSINESS FROM THE TRAVELERS TRANSACTION >35% Personal Insurance (~$1B of GWP(1)) $6.5B+ ~$1.5B ~$6.3B • Scales and fast tracks growth while ~$0.5B strengthening existi
Slide 26: Integration Timeline
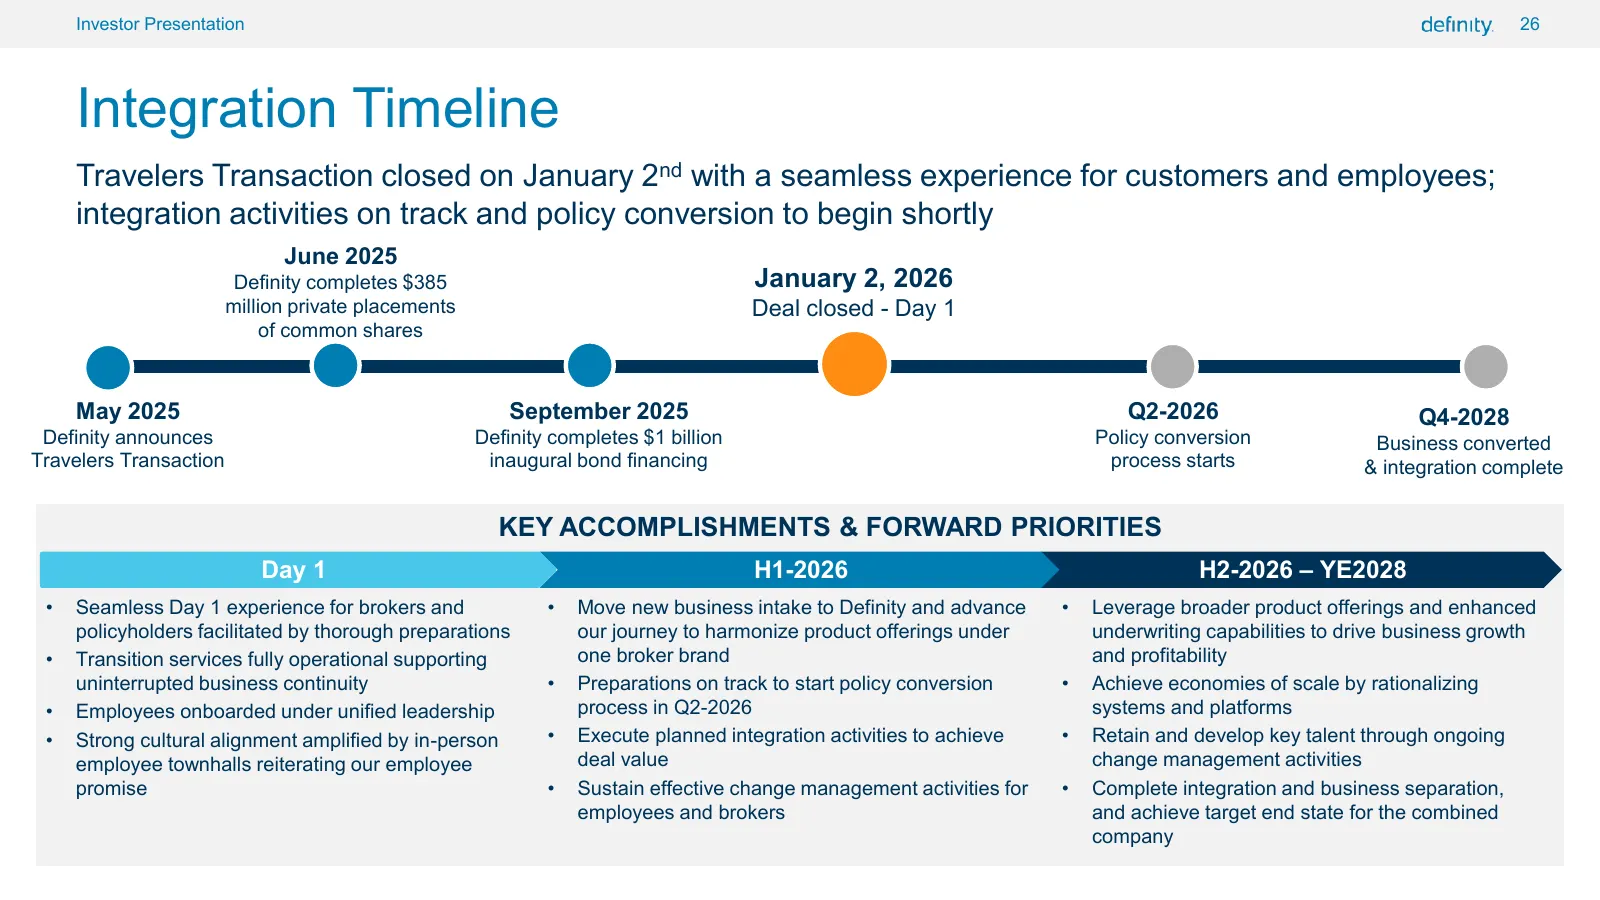
26 Investor Presentation 26 Integration Timeline Travelers Transaction closed on January 2nd with a seamless experience for customers and employees; integration activities on track and policy conversion to begin shortly June 2025 Definity completes $385 January 2, 2026 million private placements Dea
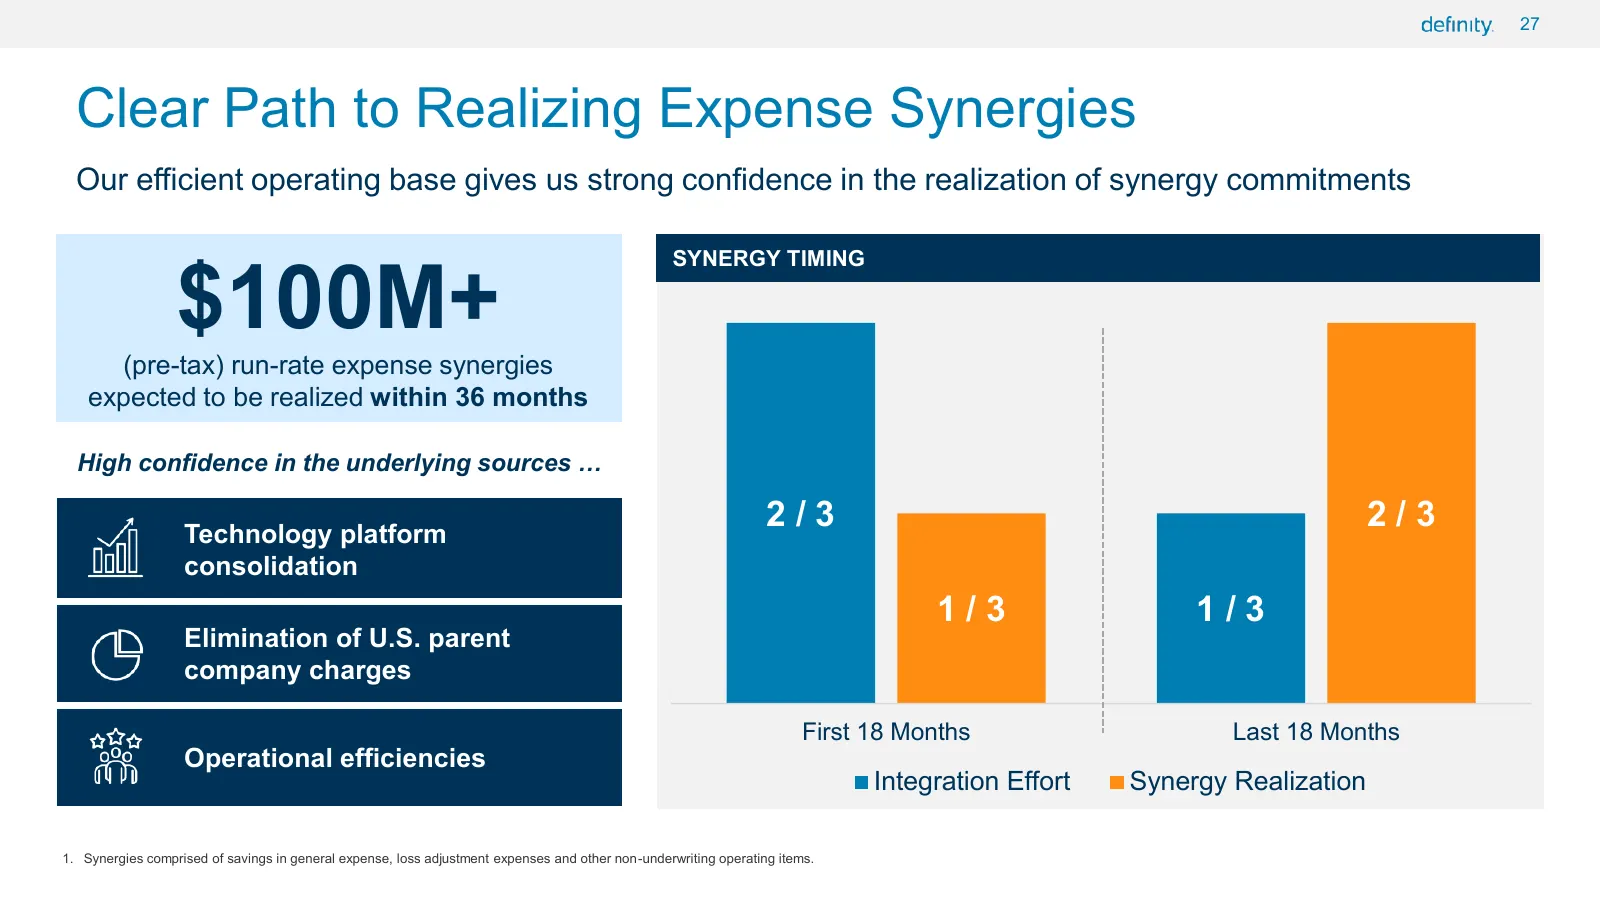
Slide 27: Clear Path to Realizing Expense Synergies
27 27 Clear Path to Realizing Expense Synergies Our efficient operating base gives us strong confidence in the realization of synergy commitments SYNERGY TIMING $100M+ (pre-tax) run-rate expense synergies expected to be realized within 36 months High confidence in the underlying sources … Technology

Slide 28: Appendix
Appendix definity.
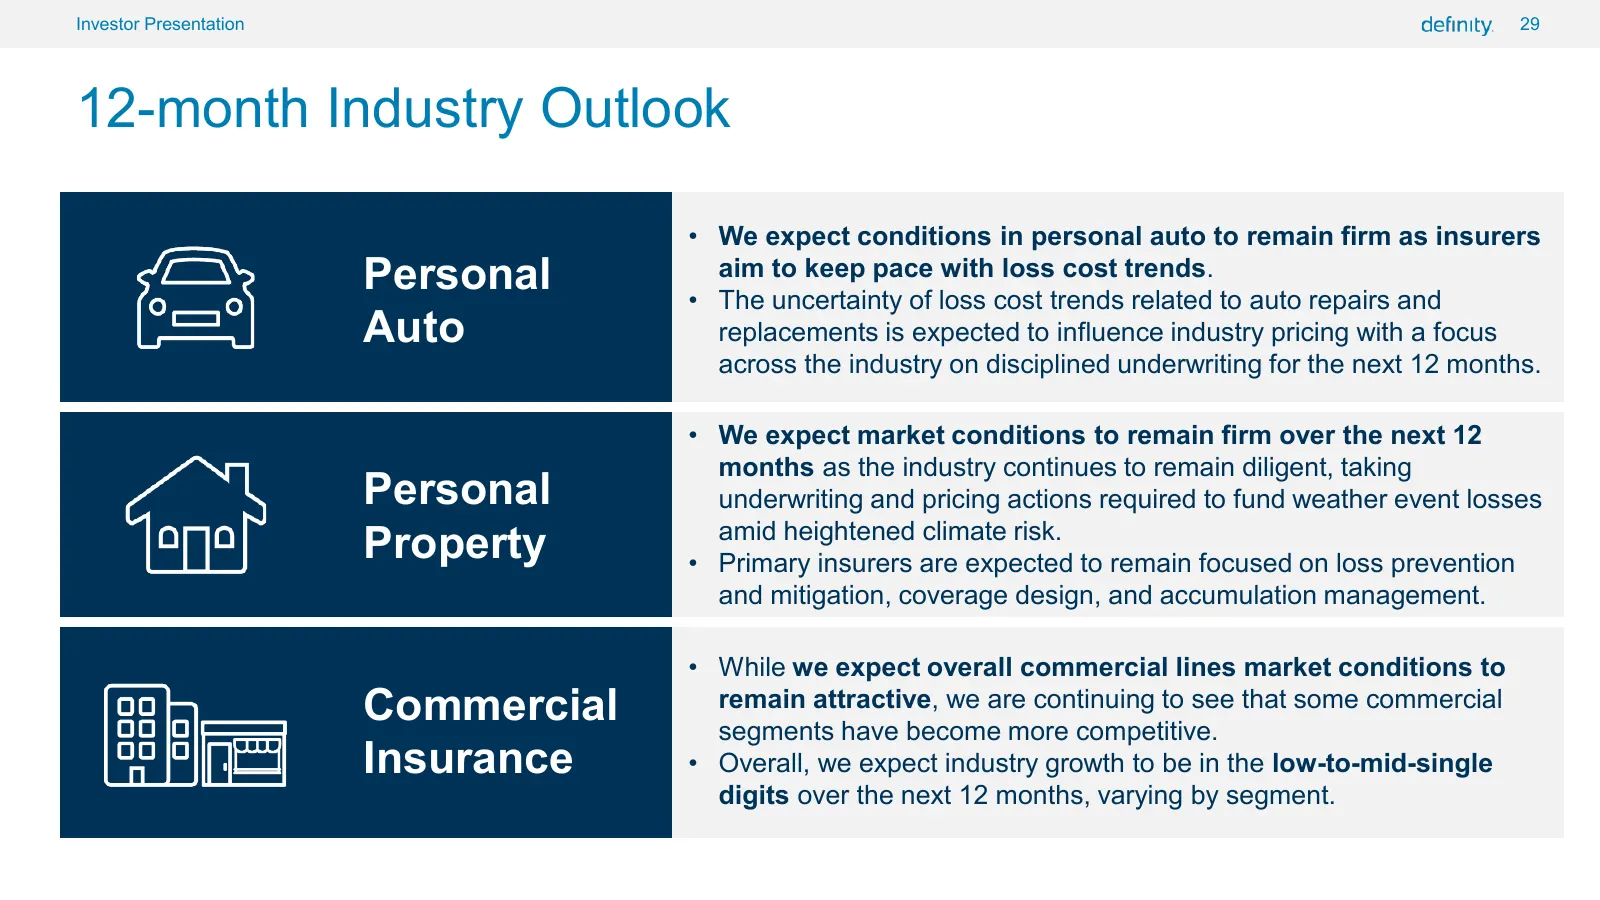
Slide 29: 12-month Industry Outlook
29 Investor Presentation 29 12-month Industry Outlook • We expect conditions in personal auto to remain firm as insurers Personal aim to keep pace with loss cost trends. • The uncertainty of loss cost trends related to auto repairs and Auto replacements is expected to influence industry pricing with
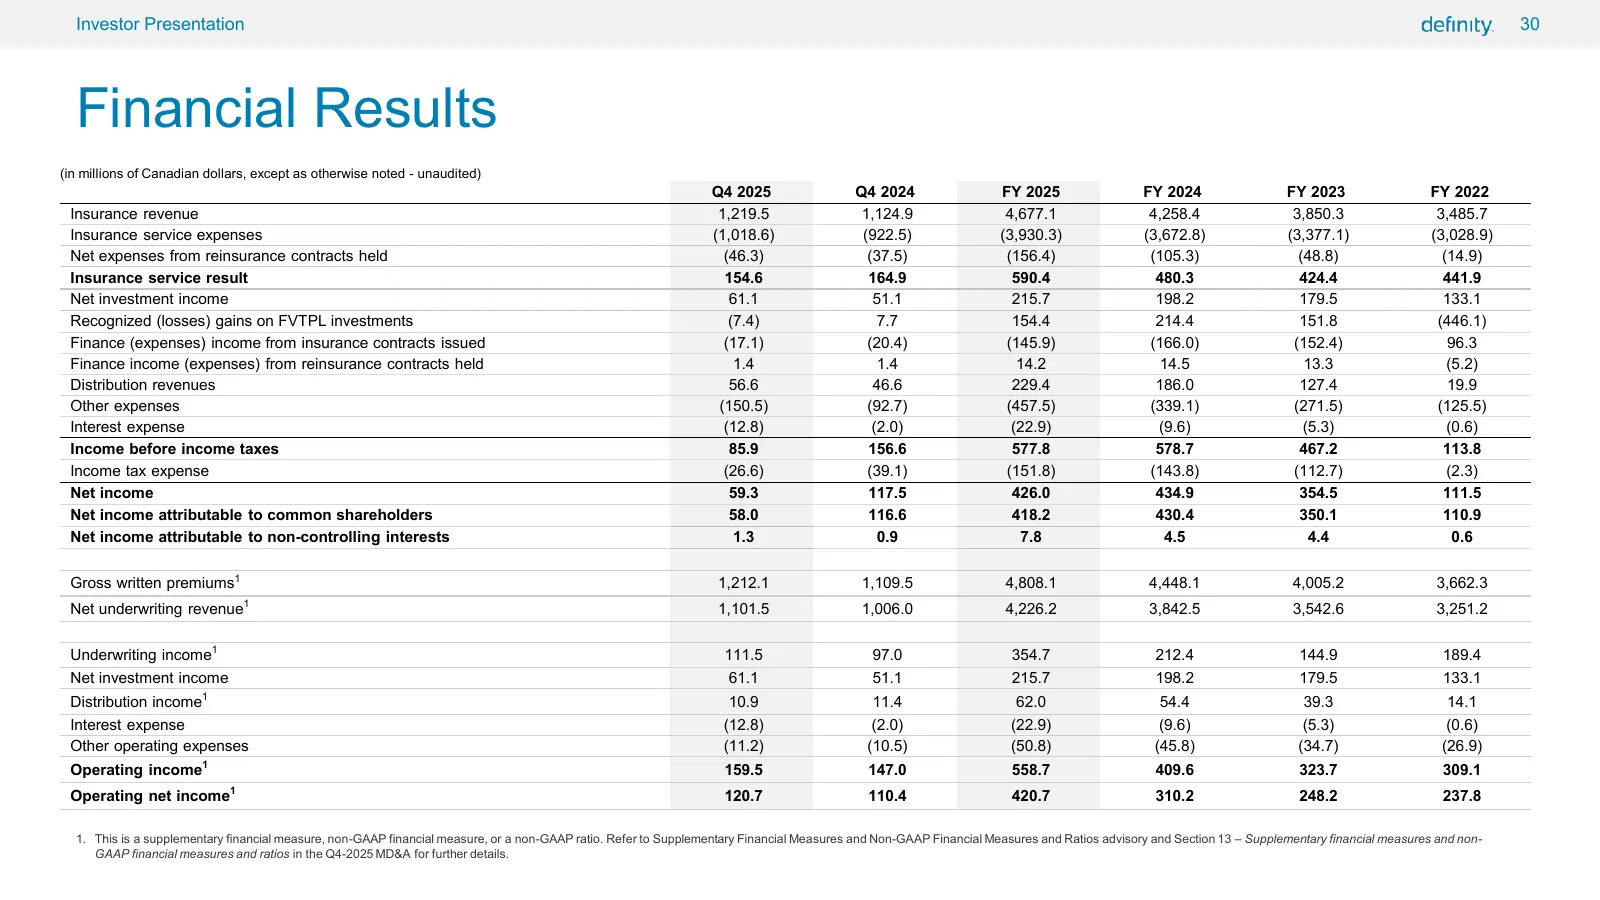
Slide 30: Financial Results
30 Investor Presentation 30 Financial Results (in millions of Canadian dollars, except as otherwise noted - unaudited) Q4 2025 Q4 2024 FY 2025 FY 2024 FY 2023 FY 2022 Insurance revenue 1,219.5 1,124.9 4,677.1 4,258.4 3,850.3 3,485.7 Insurance service expenses (1,018.6) (922.5) (3,930.3) (3,672.8) (3
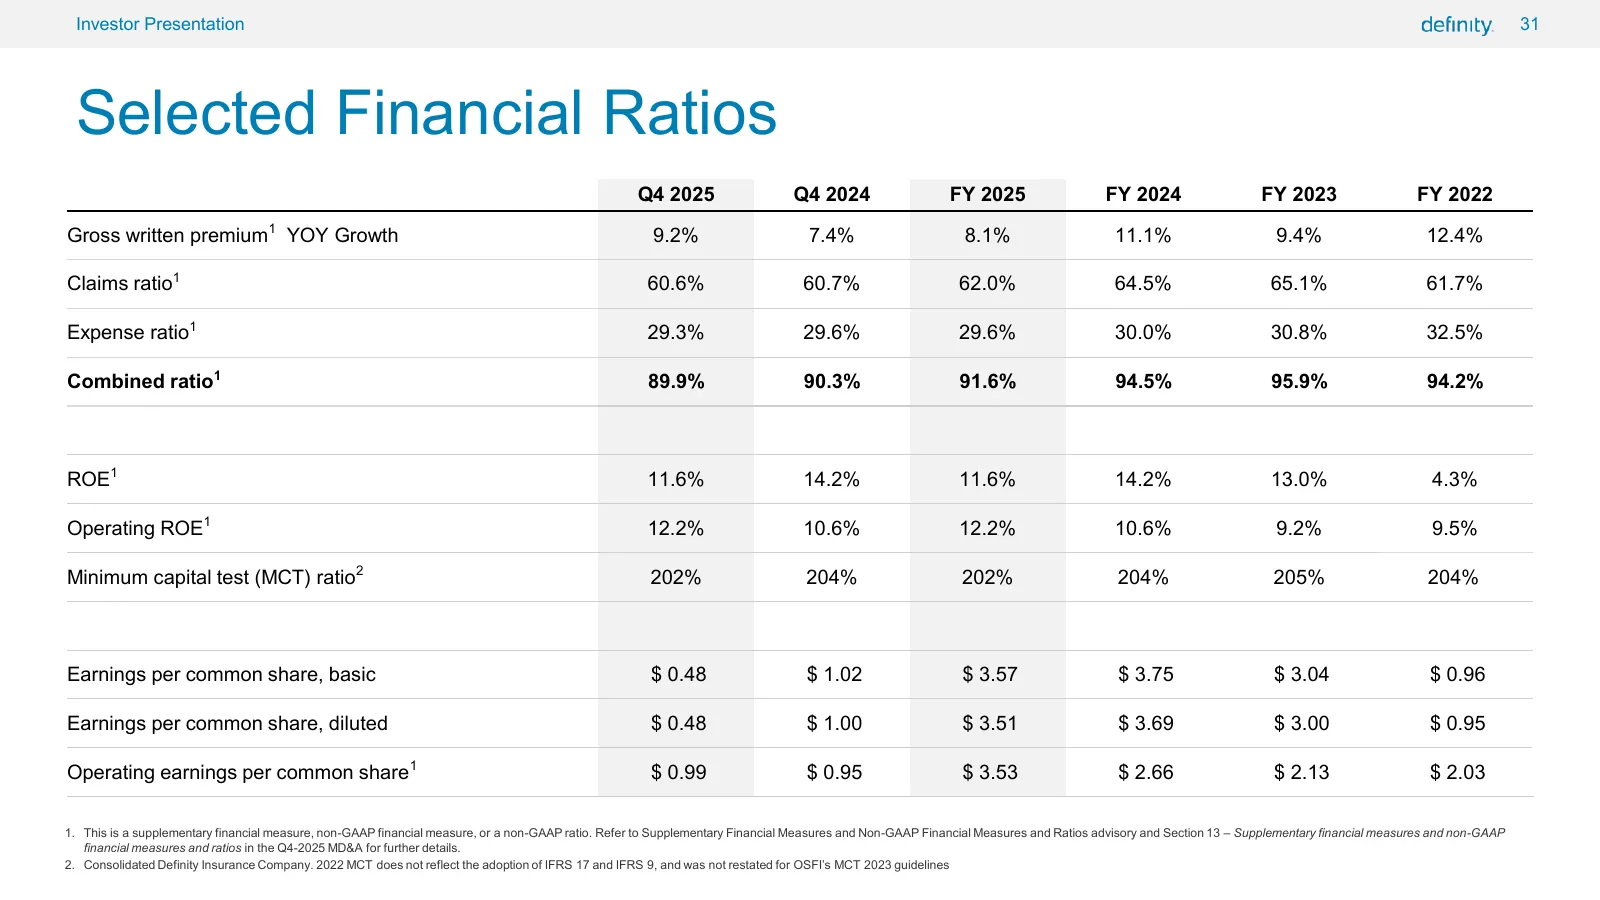
Slide 31: Selected Financial Ratios
31 Investor Presentation 31 Selected Financial Ratios Q4 2025 Q4 2024 FY 2025 FY 2024 FY 2023 FY 2022 Gross written premium1 YOY Growth 9.2% 7.4% 8.1% 11.1% 9.4% 12.4% Claims ratio1 60.6% 60.7% 62.0% 64.5% 65.1% 61.7% Expense ratio1 29.3% 29.6% 29.6% 30.0% 30.8% 32.5% Combined ratio1 89.9% 90.3% 91.
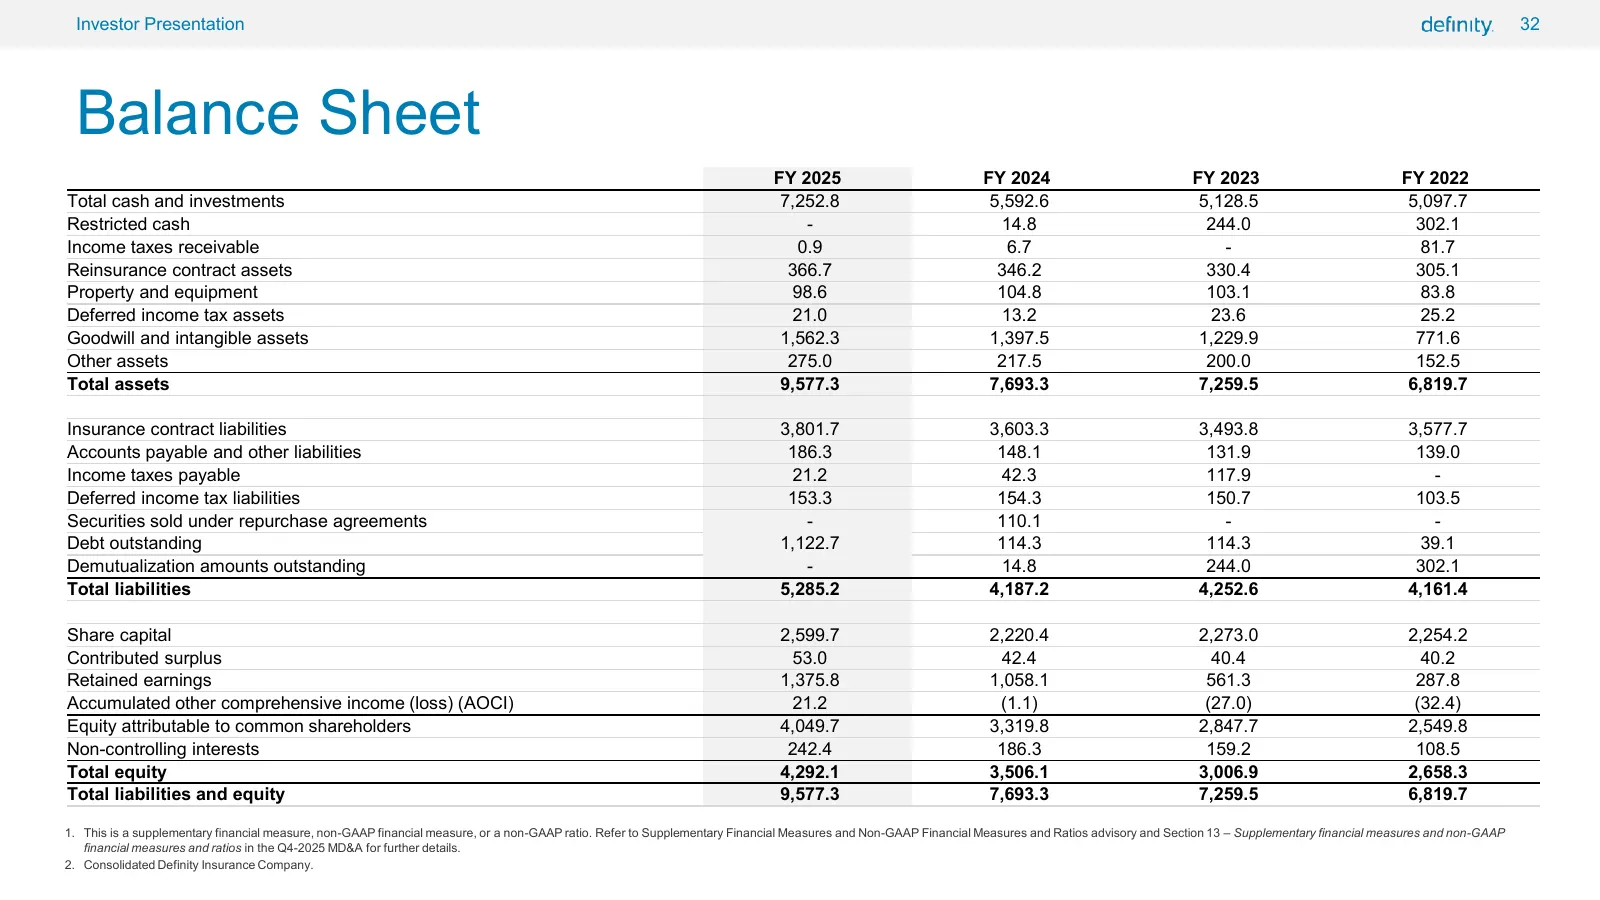
Slide 32: Balance Sheet
32 Investor Presentation 32 Balance Sheet FY 2025 FY 2024 FY 2023 FY 2022 Total cash and investments 7,252.8 5,592.6 5,128.5 5,097.7 Restricted cash - 14.8 244.0 302.1 Income taxes receivable 0.9 6.7 - 81.7 Reinsurance contract assets 366.7 346.2 330.4 305.1 Property and equipment 98.6 104.8 103.1 8
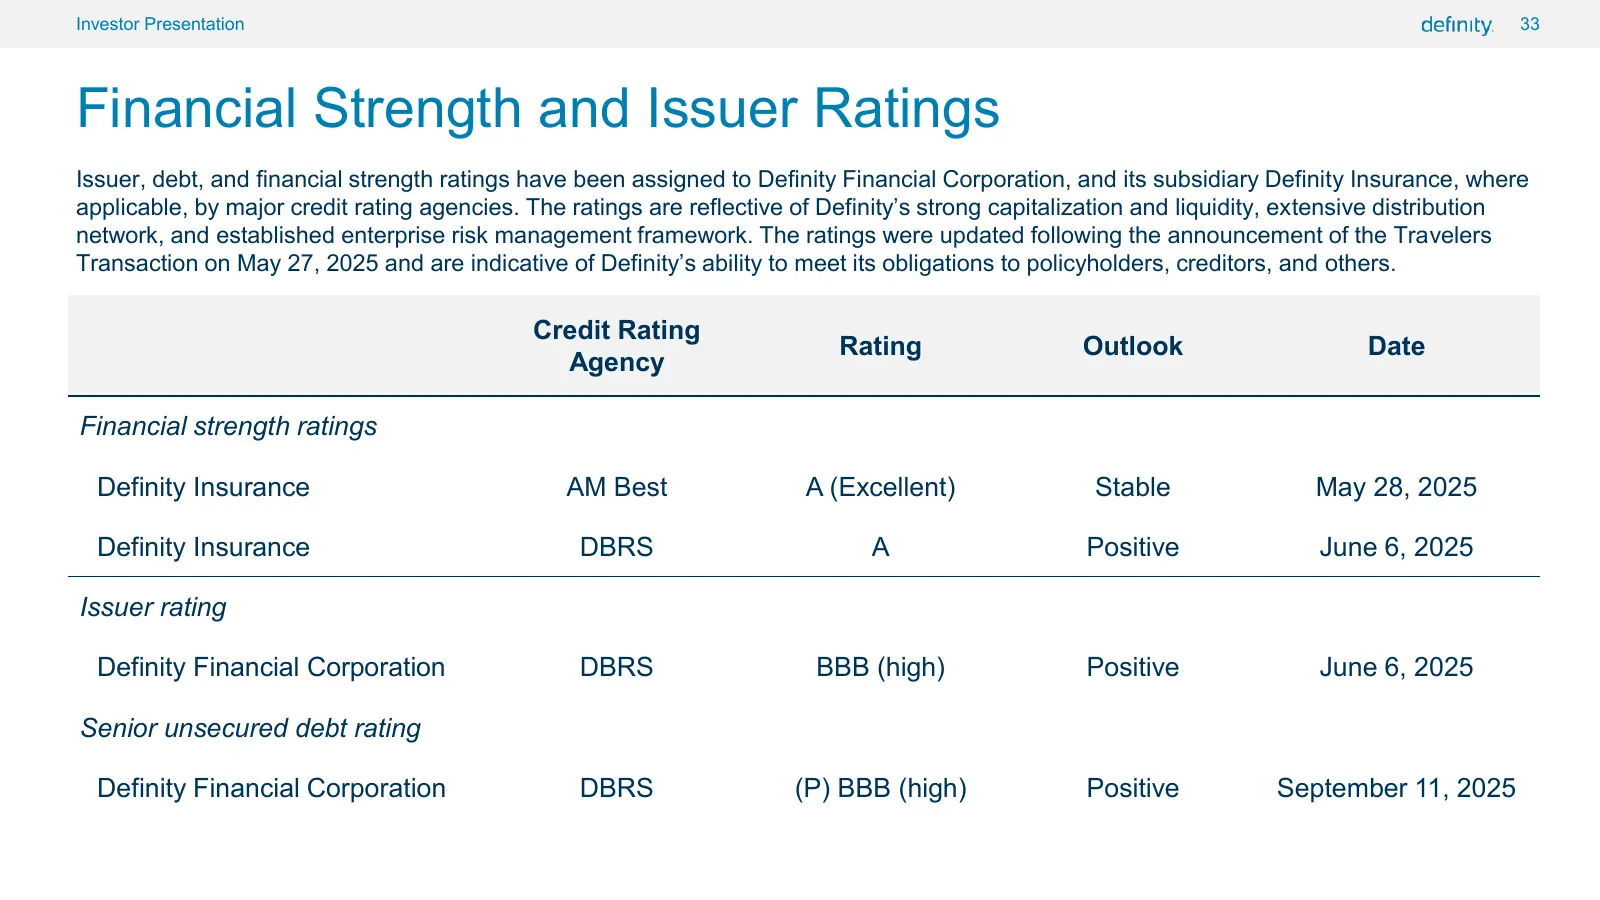
Slide 33: Financial Strength and Issuer Ratings
33 Investor Presentation 33 Financial Strength and Issuer Ratings Issuer, debt, and financial strength ratings have been assigned to Definity Financial Corporation, and its subsidiary Definity Insurance, where applicable, by major credit rating agencies. The ratings are reflective of Definity’s stro
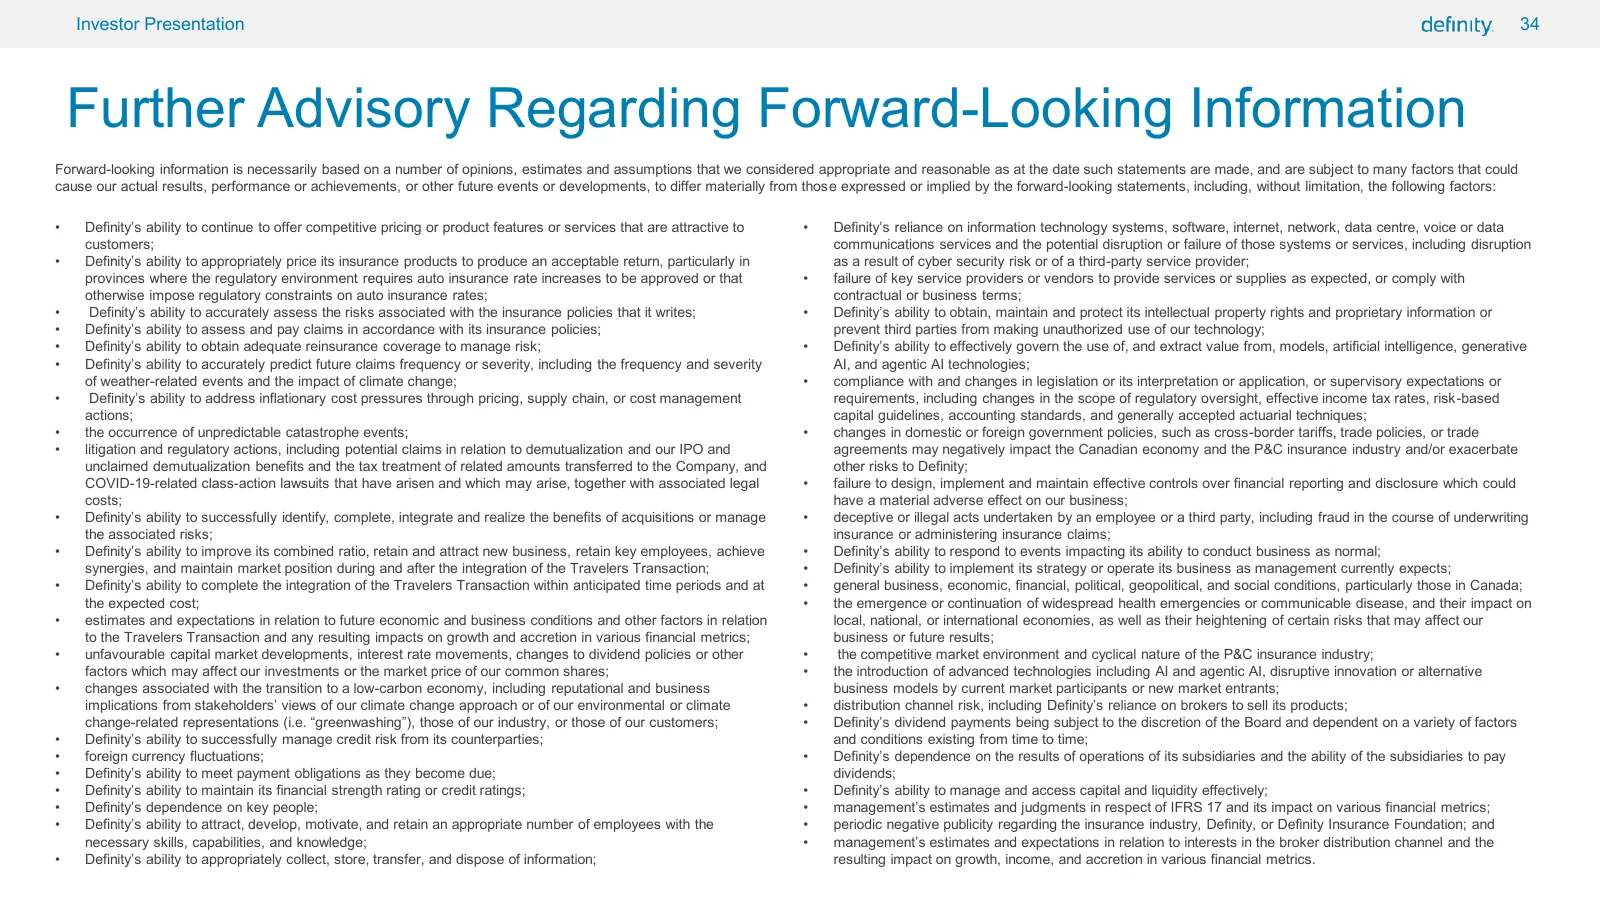
Slide 34: Further Advisory Regarding Forward-Looking Information
34 Investor Presentation 34 Further Advisory Regarding Forward-Looking Information Forward-looking information is necessarily based on a number of opinions, estimates and assumptions that we considered appropriate and reasonable as at the date such statements are made, and are subject to many factor
Slide 35: Contact Us
35 Investor Presentation 35 Contact Us INVESTOR RELATIONS Dennis Westfall General Investor Inquiries Vice President, Investor Relations TOLL-FREE: 1-866-902-4724 PHONE: 416-435-5568 EMAIL: IR@definity.com EMAIL: dennis.westfall@definity.com CORPORATE Sarah Attwells GENERAL Definity Financial Corpora

Slide 36: definity.
definity. © 2026 Definity Financial Corporation. Intellectual property belongs to Definity Financial Corporation andior its affiliates.
Source: Internet Archive copy of s28.q4cdn.com
More decks from Definity Financial Corp.
 Q3 2026 Earnings Presentation37 slides · November 2026
 Q1 2026 Earnings Presentation22 slides · May 9, 2026
 Q4 2025 Earnings Presentation25 slides · Feb 13, 2026
 Q2 2026 Earnings Presentation37 slides · 2026
 Q1 2026 Earnings Presentation36 slides · 2026
 Q3 2025 Earnings Presentation21 slides · Nov 7, 2025