Earthstone Energy — Investor Presentation (February 2023)
27 slides from Earthstone Energy's investor presentation, Feb 16, 2023
Slide 1: Investor Presentation
Investor Presentation F e b r u a r y 1 6 , 2 0 2 3 1 E x h i b i t 9 9 . 2
Slide 2: Disclaimer: Forward-Looking Statements
Disclaimer Forward-Looking Statements This presentation contains forward-looking statements within the meaning of Section 27A of the Securities Act of 1933, as amended (the “Securities Act”), and Section 21E of the Securities Exchange Act of 1934, as amended (the “Exchange Act”). Statements that are
Slide 3: The New Earthstone: Significantly Larger Scale, Same Core Values
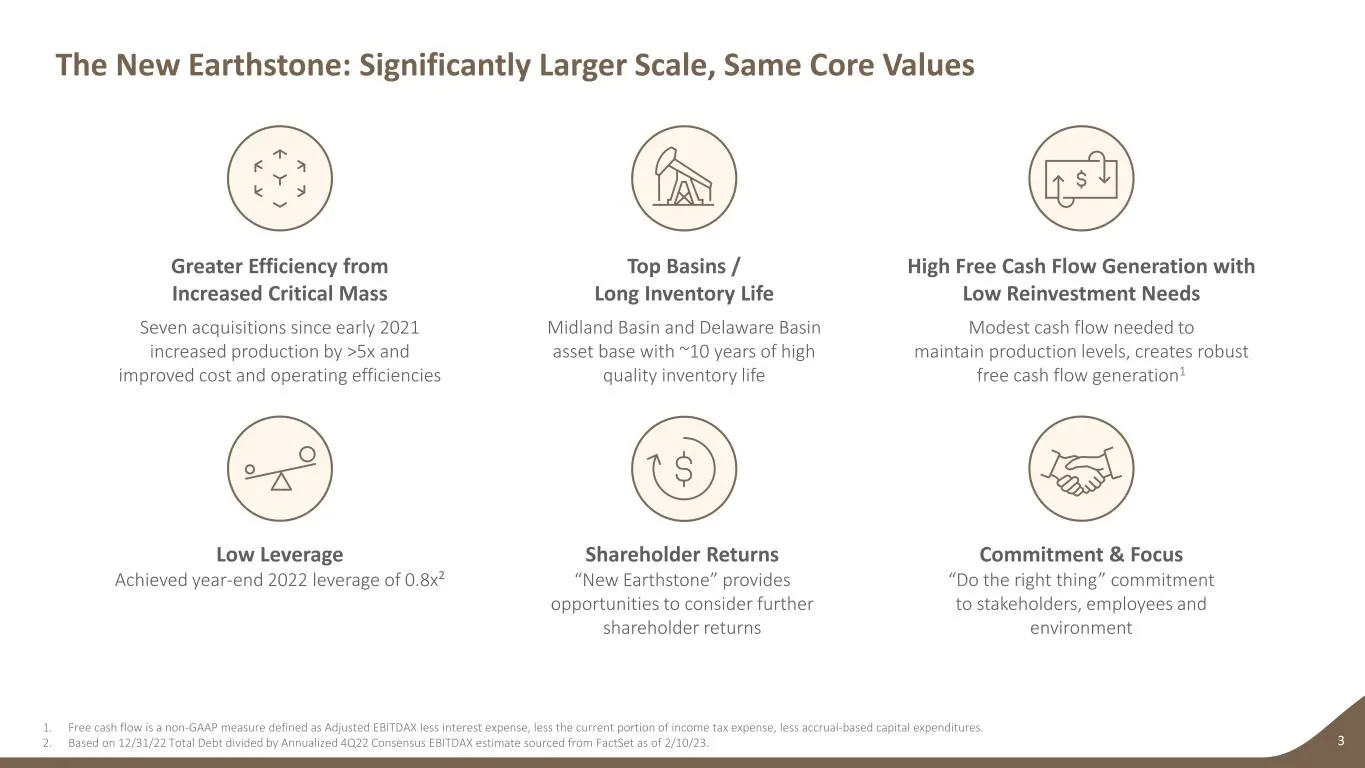
High Free Cash Flow Generation with Low Reinvestment Needs Modest cash flow needed to maintain production levels, creates robust free cash flow generation1 Top Basins / Long Inventory Life Midland Basin and Delaware Basin asset base with ~10 years of high quality inventory life The New Earthstone: S
Slide 4: A Much Larger Earthstone: Corporate Snapshot
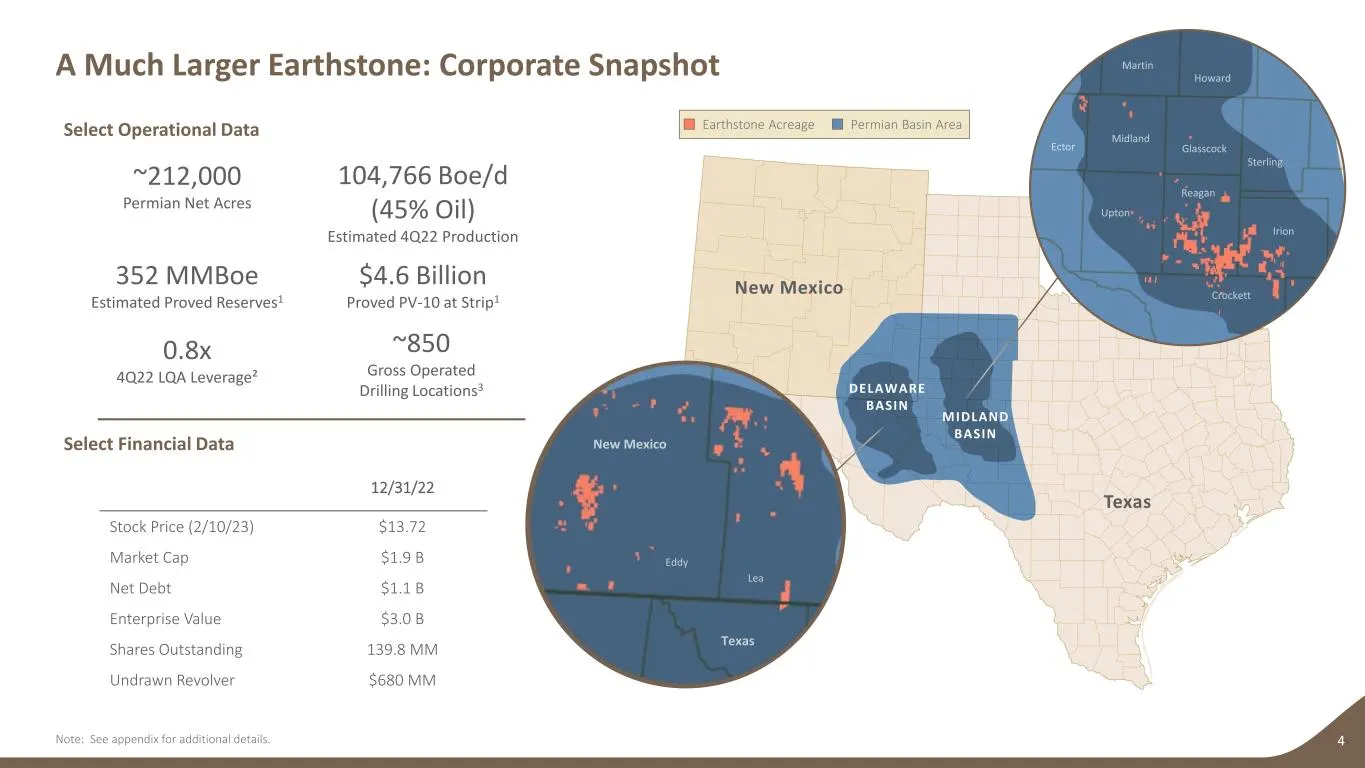
Texas New Mexico A Much Larger Earthstone: Corporate Snapshot 4Note: See appendix for additional details. Earthstone Acreage Permian Basin Area MIDLAND BASIN DELAWARE BASIN Select Operational Data 352 MMBoe Estimated Proved Reserves1 $4.6 Billion Proved PV-10 at Strip1 104,766 Boe/d (45% Oil) Estima
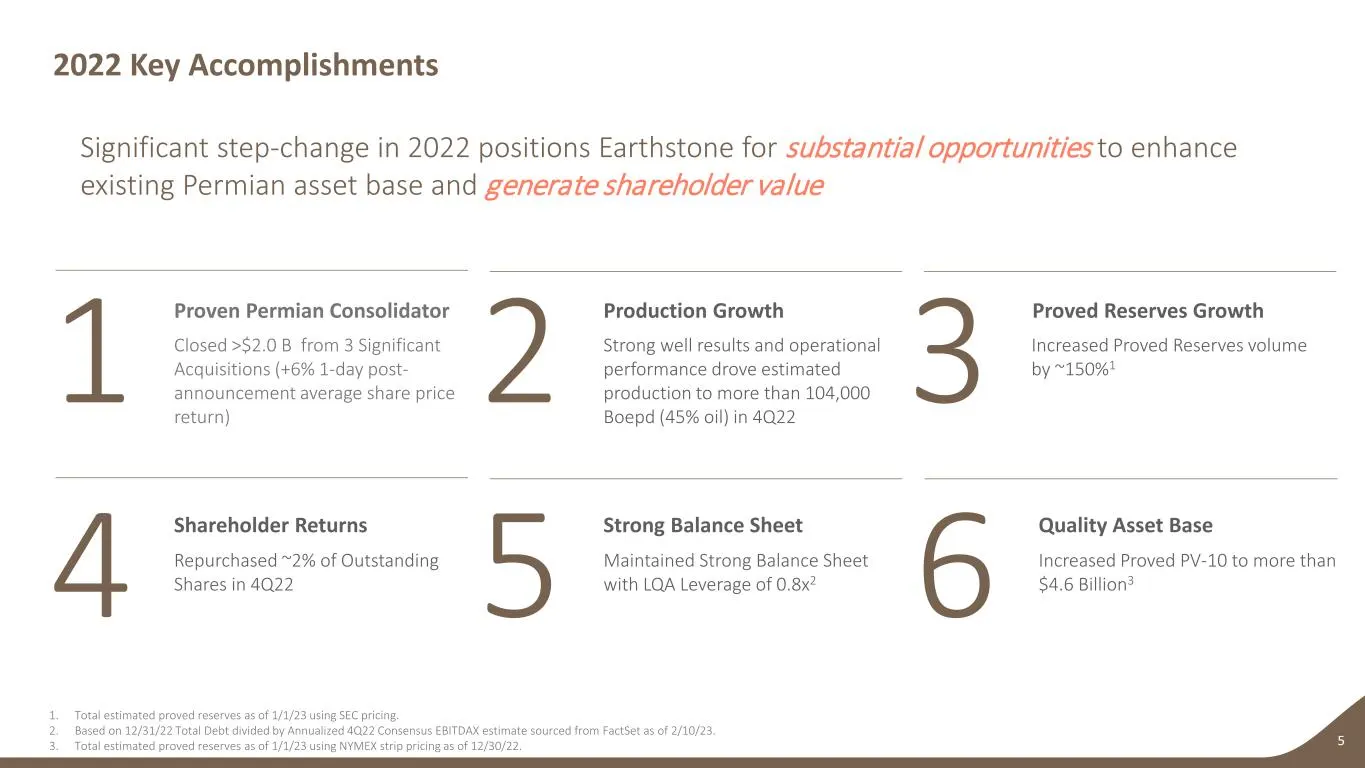
Slide 5: 2022 Key Accomplishments
1 Proven Permian Consolidator Closed >$2.0 B from 3 Significant Acquisitions (+6% 1-day post- announcement average share price return) 2 Production Growth Strong well results and operational performance drove estimated production to more than 104,000 Boepd (45% oil) in 4Q22 3 Proved Reserves Growth
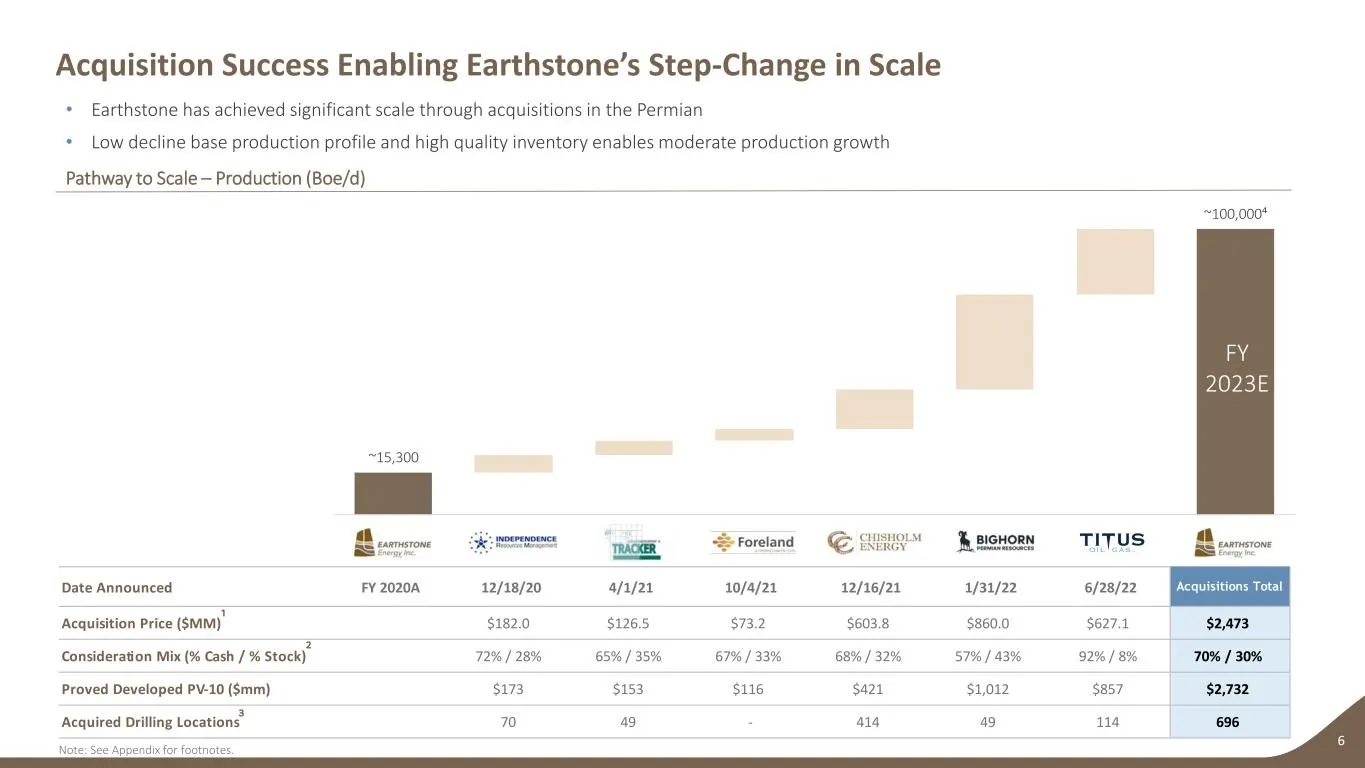
Slide 6: Acquisition Success Enabling Earthstone's Step-Change in Scale
Date Announced FY 2020A 12/18/20 4/1/21 10/4/21 12/16/21 1/31/22 6/28/22 Acquisitions Total Acquisition Price ($MM)(1) $182.0 $126.5 $73.2 $603.8 $860.0 $627.1 $2,473 Consideration Mix (% Cash / % Stock) 72% / 28% 65% / 35% 67% / 33% 68% / 32% 57% / 43% 92% / 8% 70% / 30% Proved Developed PV-10 ($mm
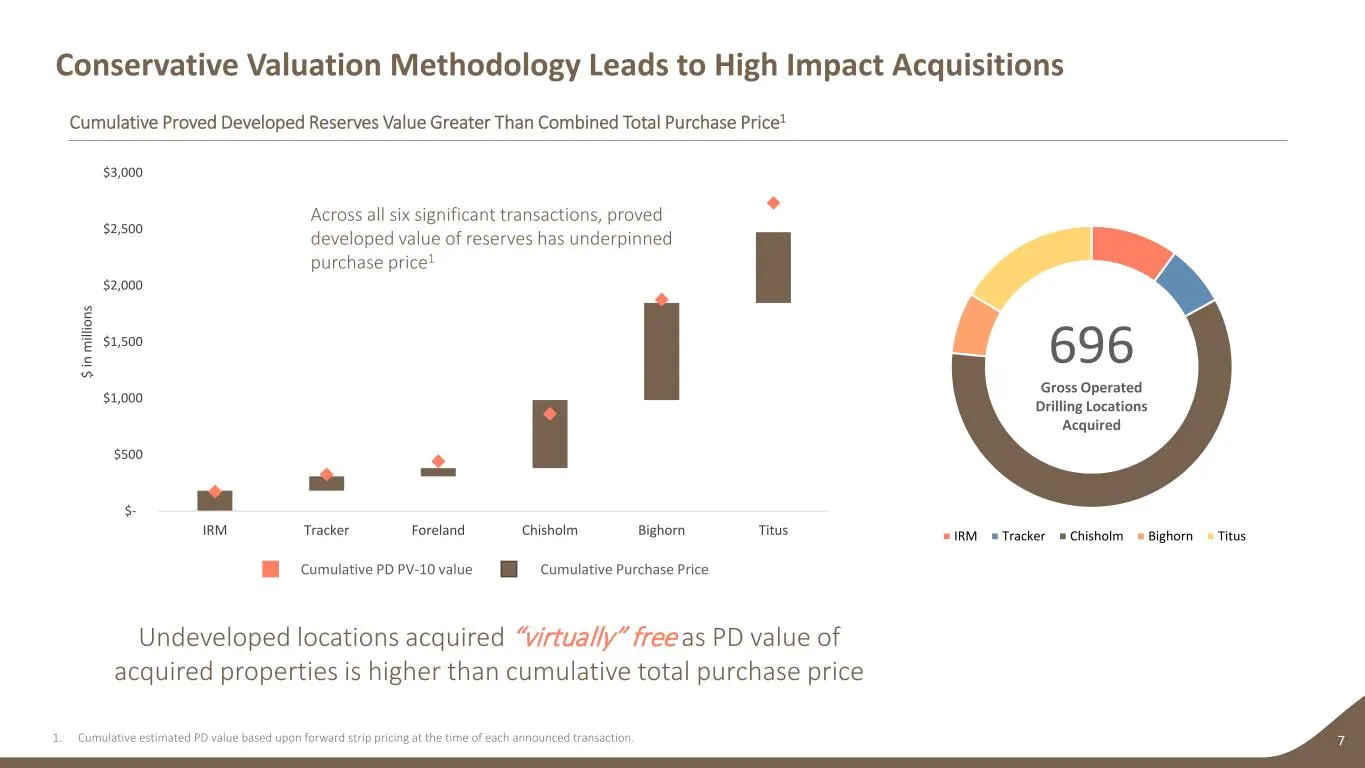
Slide 7: Conservative Valuation Methodology Leads to High Impact Acquisitions
$- $500 $1,000 $1,500 $2,000 $2,500 $3,000 IRM Tracker Foreland Chisholm Bighorn Titus $ in m ill io ns Conservative Valuation Methodology Leads to High Impact Acquisitions 7 Cumulative Proved Developed Reserves Value Greater Than Combined Total Purchase Price1 1. Cumulative estimated PD value based
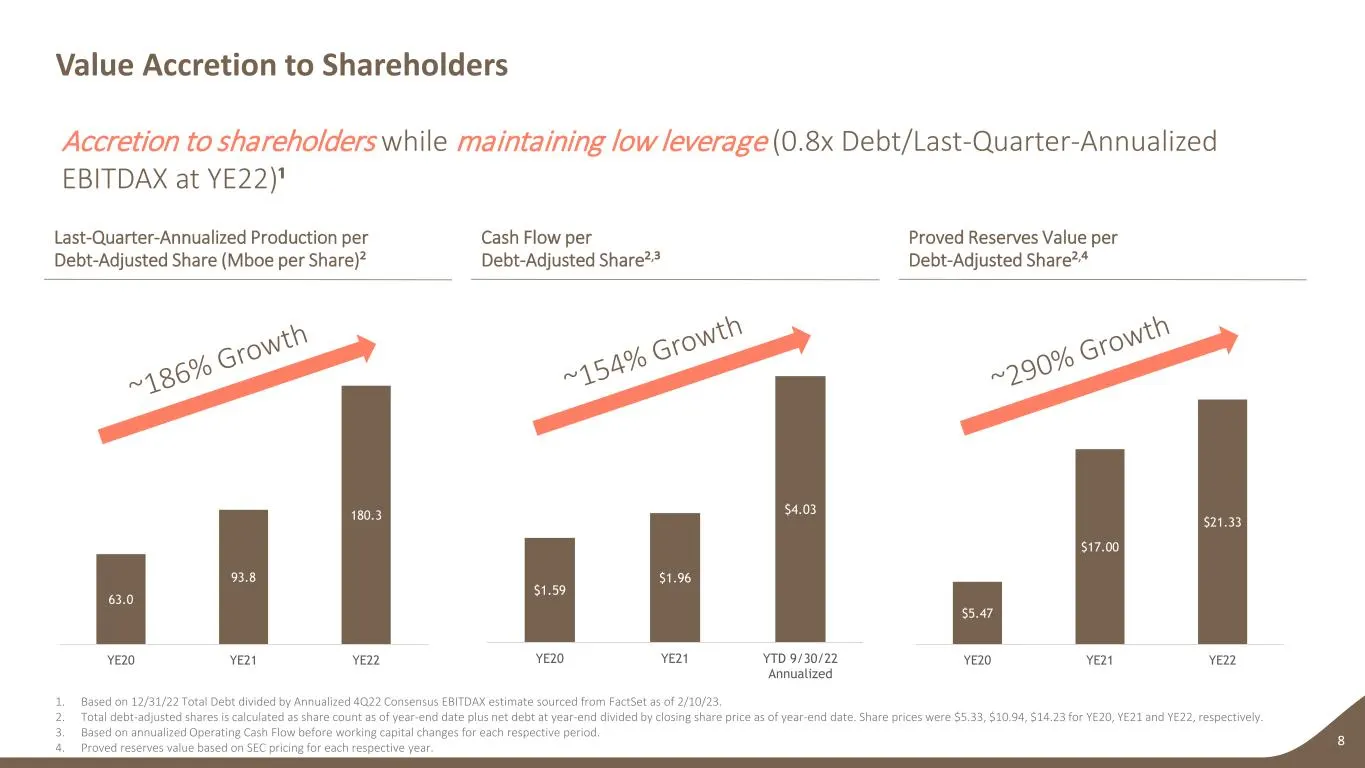
Slide 8: Value Accretion to Shareholders
$1.59 $1.96 $4.03 YE20 YE21 YTD 9/30/22 Annualized Value Accretion to Shareholders 8 1. Based on 12/31/22 Total Debt divided by Annualized 4Q22 Consensus EBITDAX estimate sourced from FactSet as of 2/10/23. 2. Total debt-adjusted shares is calculated as share count as of year-end date plus net debt
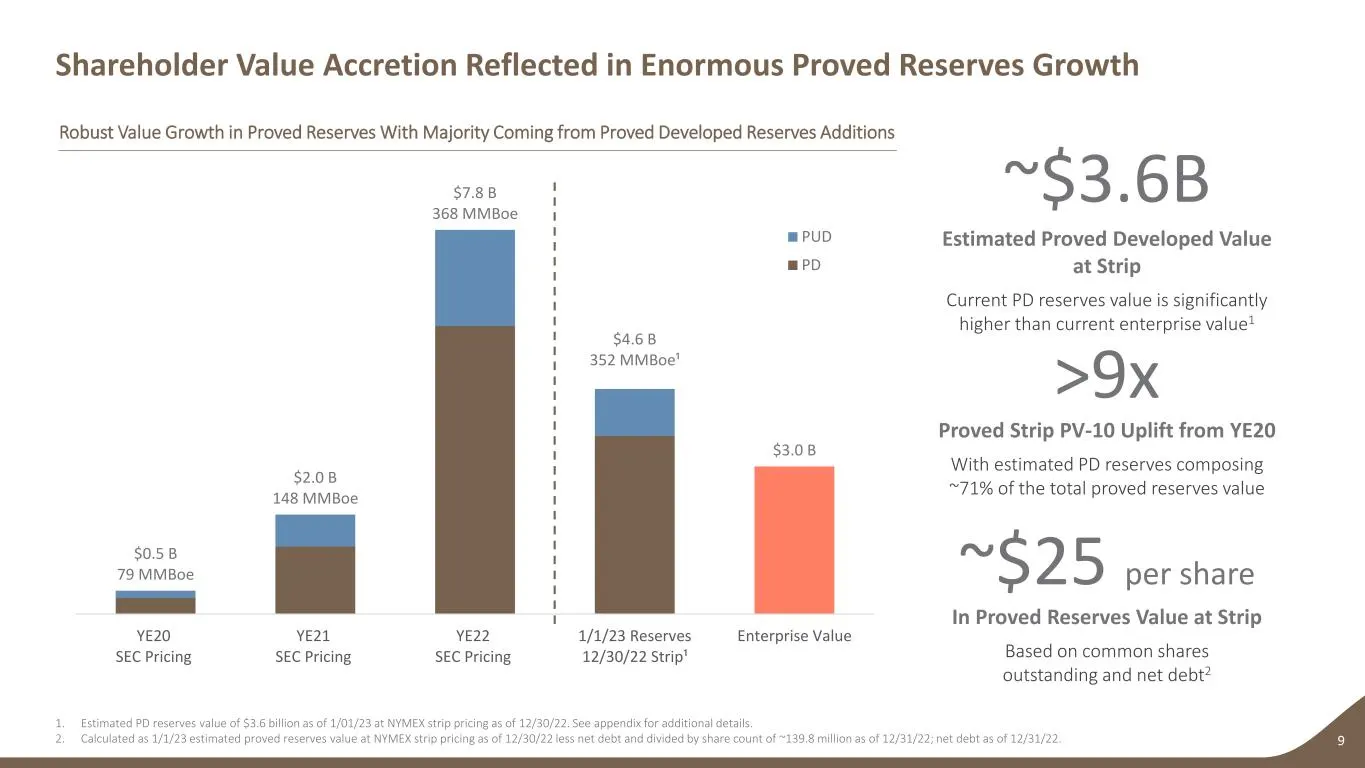
Slide 9: Robust Value Growth in Proved Reserves
$0.5 B 79 MMBoe $2.0 B 148 MMBoe $7.8 B 368 MMBoe $4.6 B 352 MMBoe¹ $3.0 B YE20 SEC Pricing YE21 SEC Pricing YE22 SEC Pricing 1/1/23 Reserves 12/30/22 Strip¹ Enterprise Value PUD PD Shareholder Value Accretion Reflected in Enormous Proved Reserves Growth 9 Proved Strip PV-10 Uplift from YE20 With es
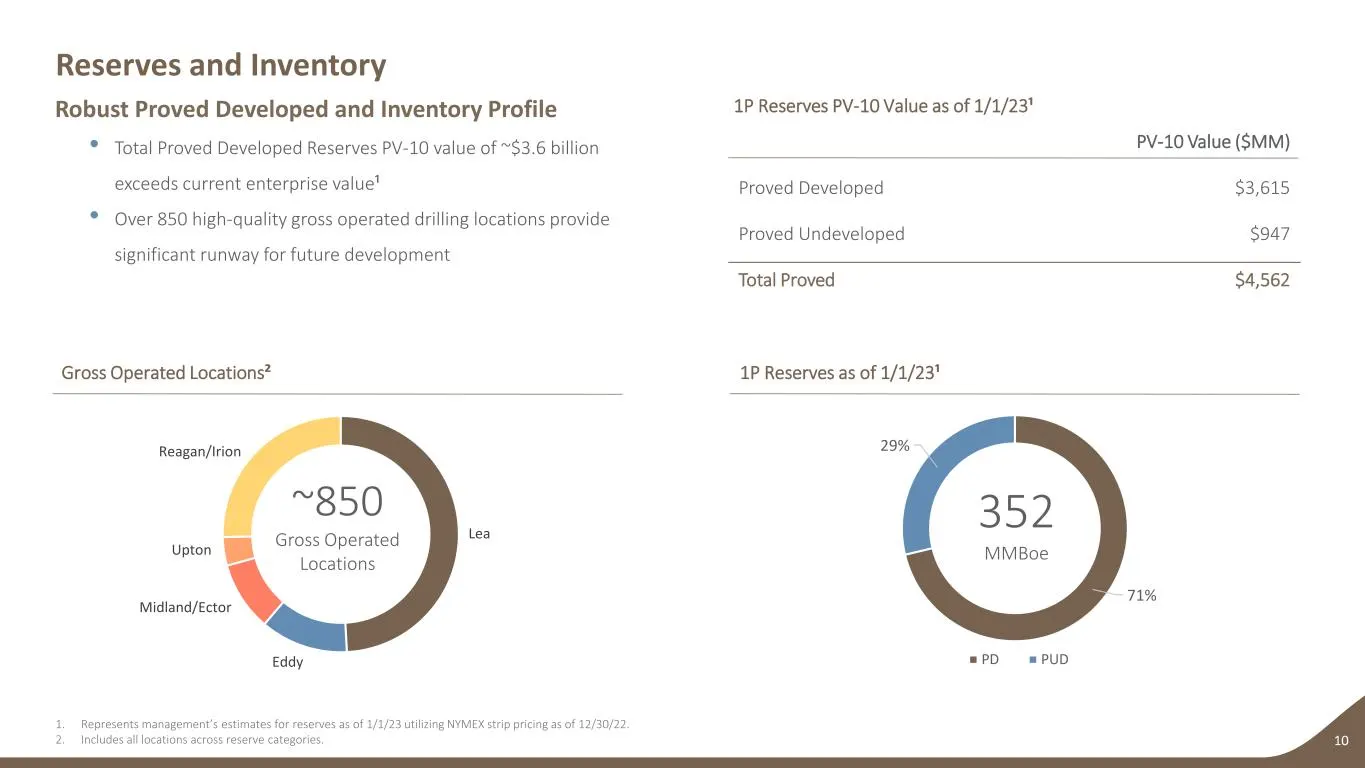
Slide 10: Robust Proved Developed and Inventory Profile
Robust Proved Developed and Inventory Profile 1P Reserves PV-10 Value as of 1/1/23¹ PV-10 Value ($MM) Proved Developed $3,615 Proved Undeveloped $947 Total Proved $4,562 • Total Proved Developed Reserves PV-10 value of ~$3.6 billion exceeds current enterprise value¹ • Over 850 high-quality gross ope
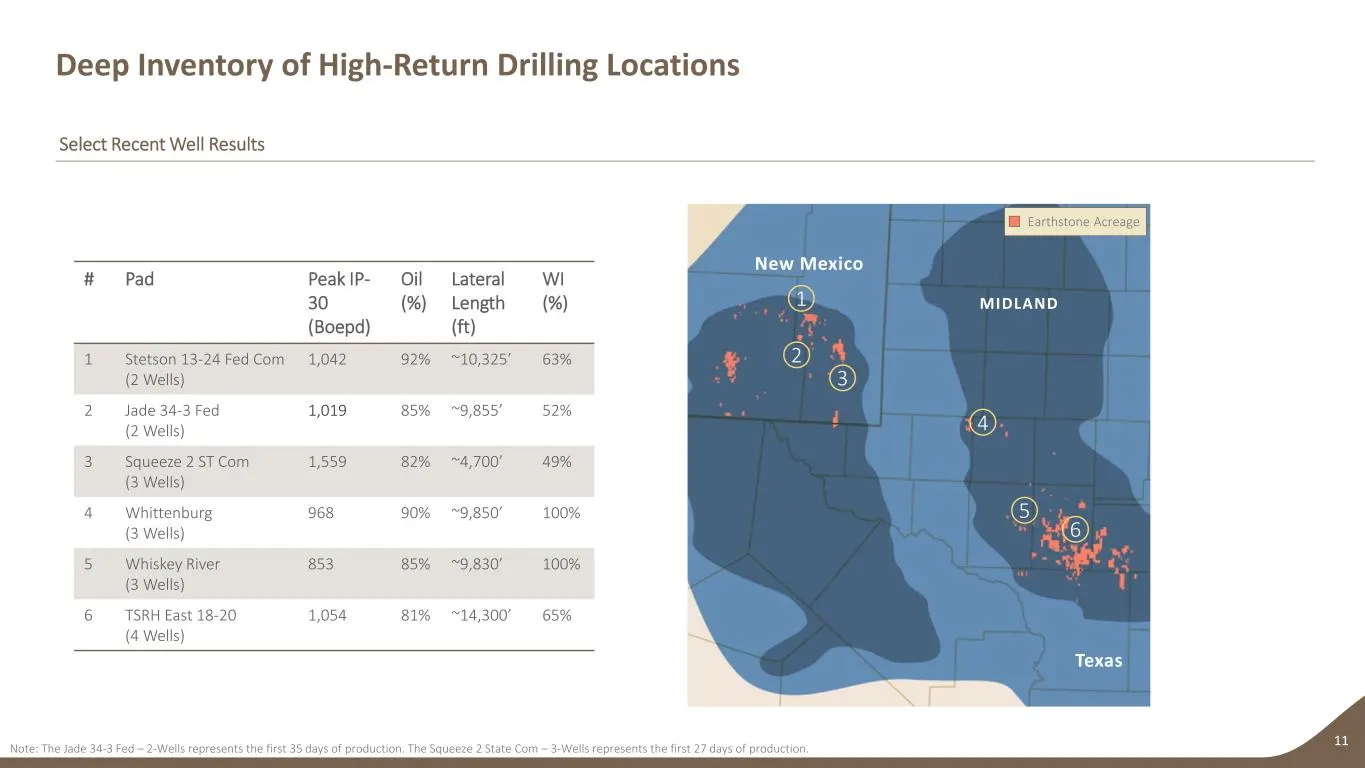
Slide 11: Deep Inventory of High-Return Drilling Locations
MIDLAND New Mexico Earthstone Acreage Texas Deep Inventory of High-Return Drilling Locations 11 Select Recent Well Results # Pad Peak IP- 30 (Boepd) Oil (%) Lateral Length (ft) WI (%) 1 Stetson 13-24 Fed Com (2 Wells) 1,042 92% ~10,325’ 63% 2 Jade 34-3 Fed (2 Wells) 1,019 85% ~9,855’ 52% 3 Squeeze 2
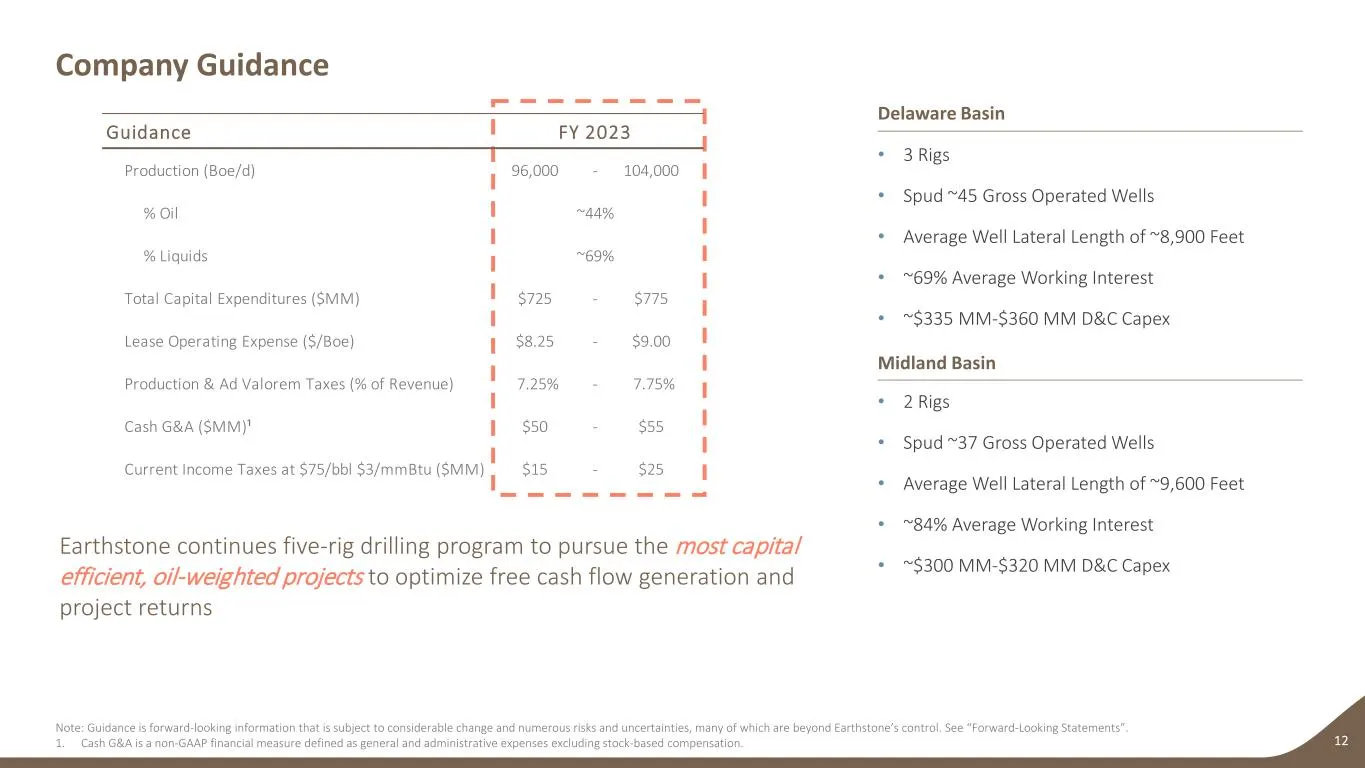
Slide 12: Company Guidance
Company Guidance 12 Note: Guidance is forward-looking information that is subject to considerable change and numerous risks and uncertainties, many of which are beyond Earthstone’s control. See “Forward-Looking Statements”. 1. Cash G&A is a non-GAAP financial measure defined as general and administr
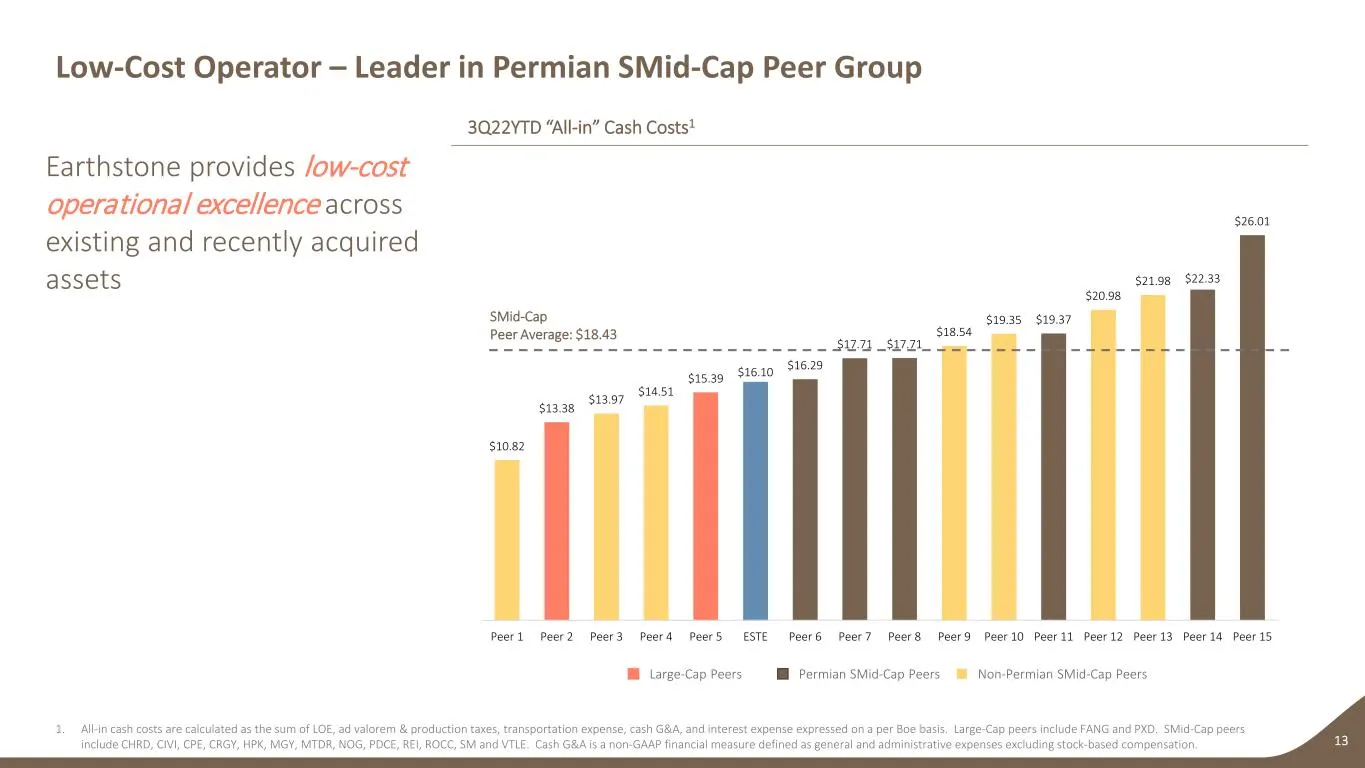
Slide 13: Low-Cost Operator – Leader in Permian SMid-Cap Peer Group
$10.82 $13.38 $13.97 $14.51 $15.39 $16.10 $16.29 $17.71 $17.71 $18.54 $19.35 $19.37 $20.98 $21.98 $22.33 $26.01 Peer 1 Peer 2 Peer 3 Peer 4 Peer 5 ESTE Peer 6 Peer 7 Peer 8 Peer 9 Peer 10 Peer 11 Peer 12 Peer 13 Peer 14 Peer 15 Low-Cost Operator – Leader in Permian SMid-Cap Peer Group 13 SMid-Cap Pe
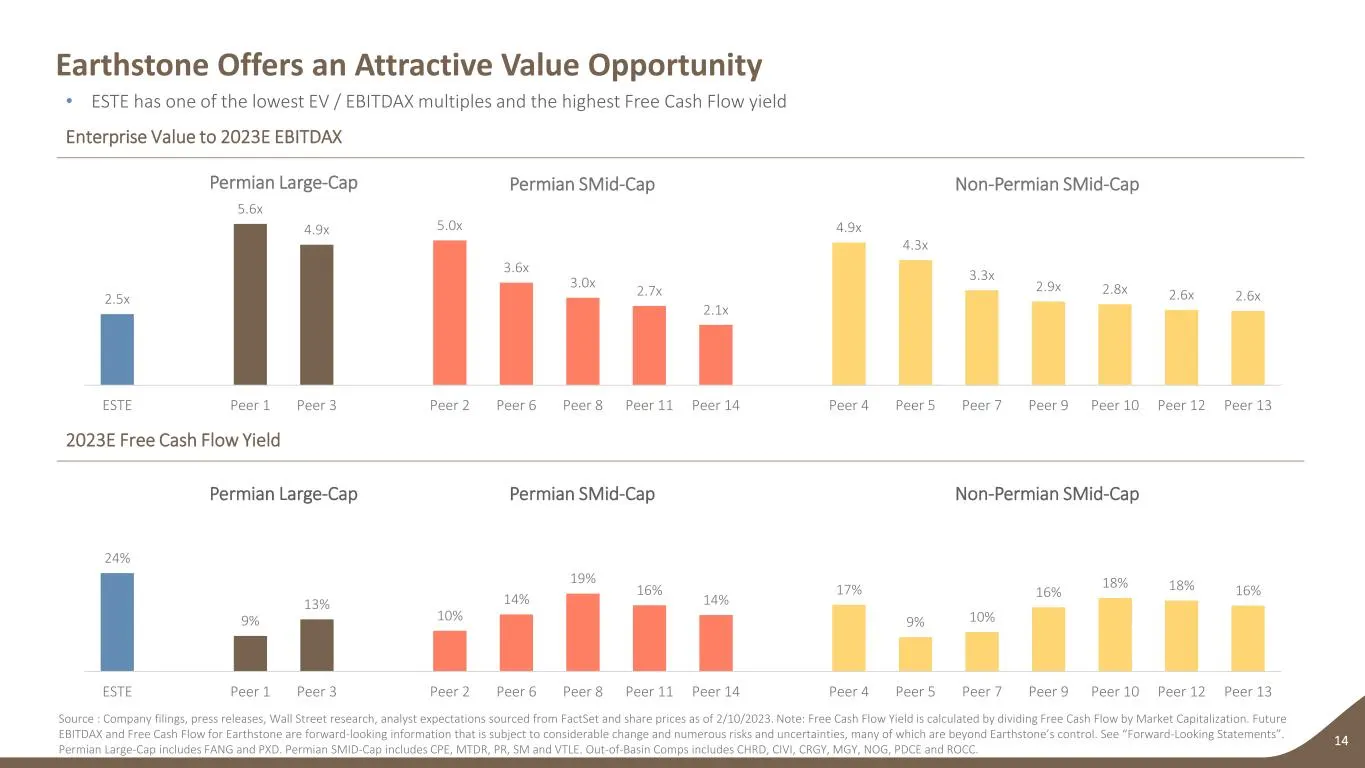
Slide 14: Earthstone Offers an Attractive Value Opportunity
2.5x 5.6x 4.9x 5.0x 3.6x 3.0x 2.7x 2.1x 4.9x 4.3x 3.3x 2.9x 2.8x 2.6x 2.6x ESTE Peer 1 Peer 3 Peer 2 Peer 6 Peer 8 Peer 11 Peer 14 Peer 4 Peer 5 Peer 7 Peer 9 Peer 10 Peer 12 Peer 13 24% 9% 13% 10% 14% 19% 16% 14% 17% 9% 10% 16% 18% 18% 16% ESTE Peer 1 Peer 3 Peer 2 Peer 6 Peer 8 Peer 11 Peer 14 Pee
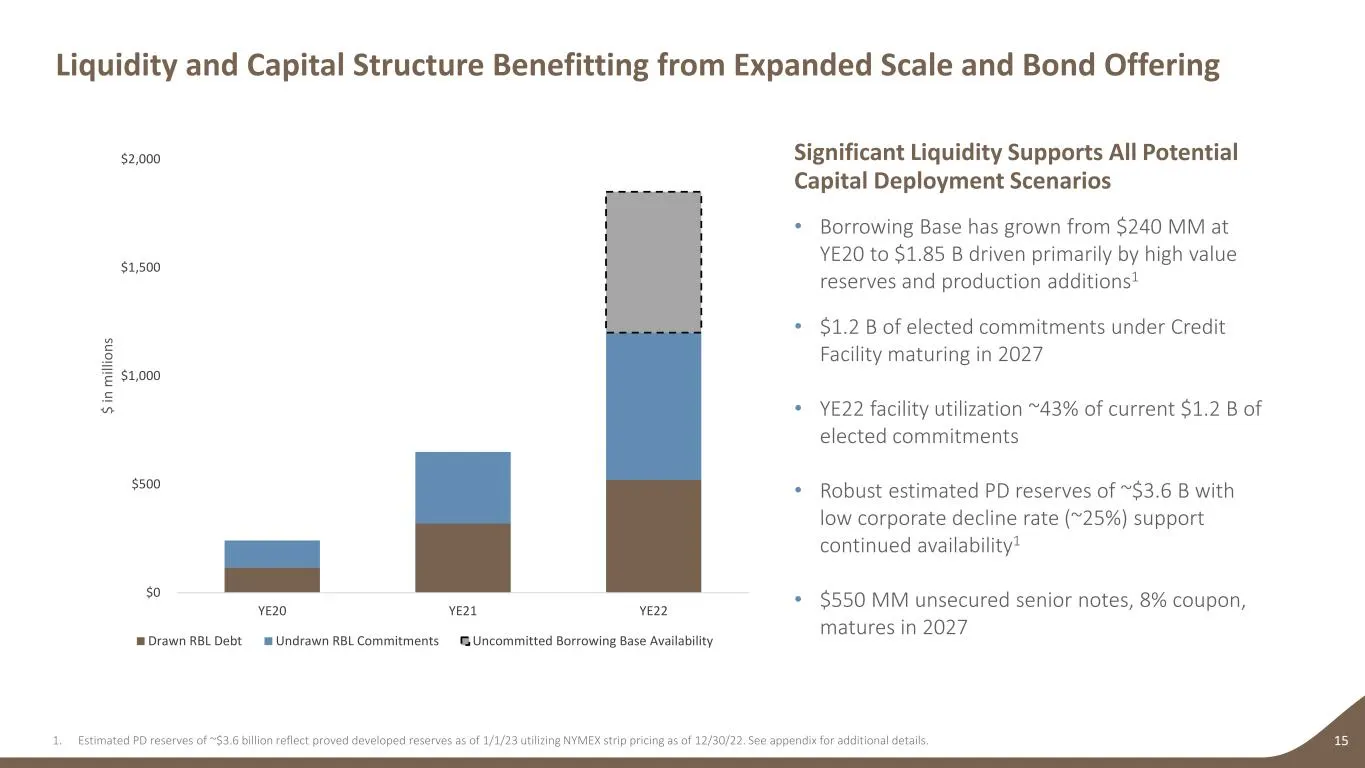
Slide 15: Liquidity and Capital Structure Benefitting from Expanded Scale and Bond Offering
Liquidity and Capital Structure Benefitting from Expanded Scale and Bond Offering 15 Significant Liquidity Supports All Potential Capital Deployment Scenarios • Borrowing Base has grown from $240 MM at YE20 to $1.85 B driven primarily by high value reserves and production additions1 • $1.2 B of elec
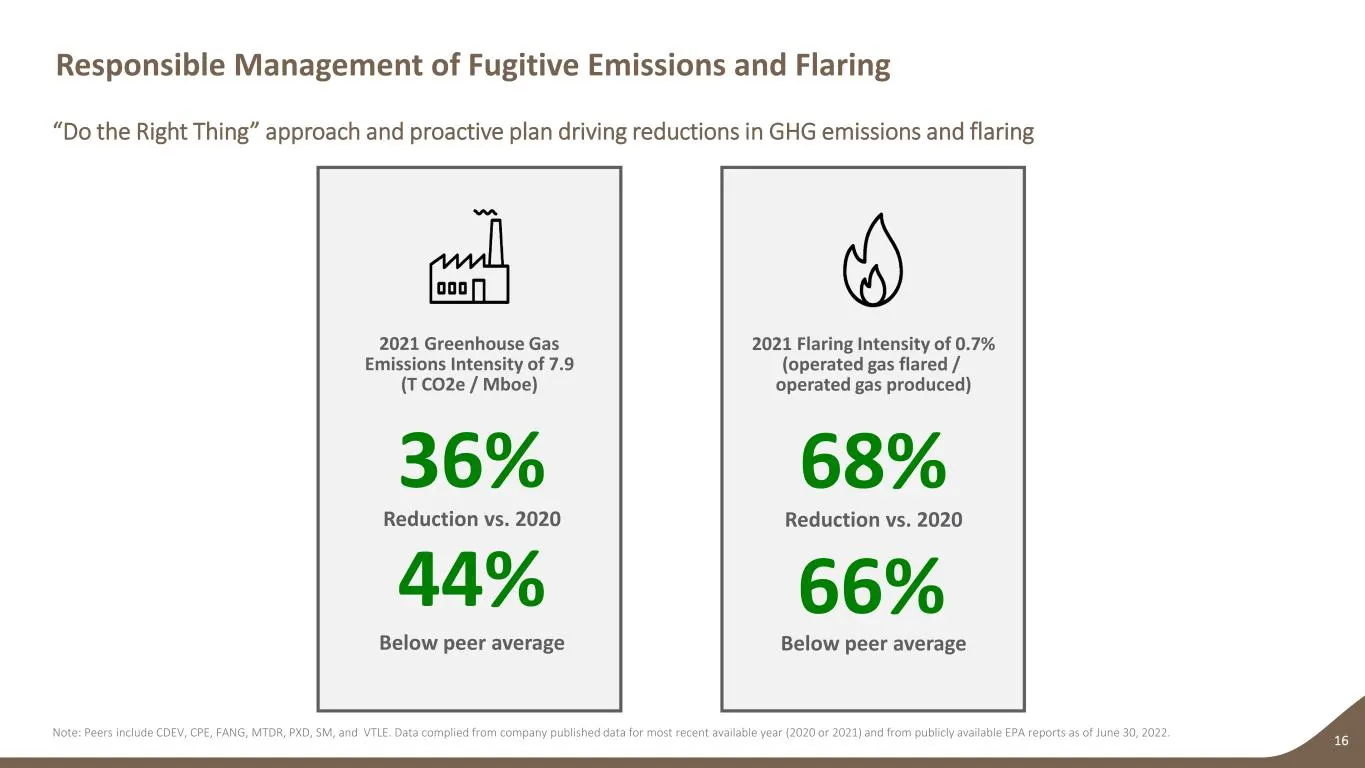
Slide 16: Responsible Management of Fugitive Emissions and Flaring
Responsible Management of Fugitive Emissions and Flaring 16 “Do the Right Thing” approach and proactive plan driving reductions in GHG emissions and flaring 68% Reduction vs. 2020 Below peer average 2021 Flaring Intensity of 0.7% (operated gas flared / operated gas produced) 66% Note: Peers include
Slide 17: Progressing Our Sustainability Initiatives While Leading the Pack
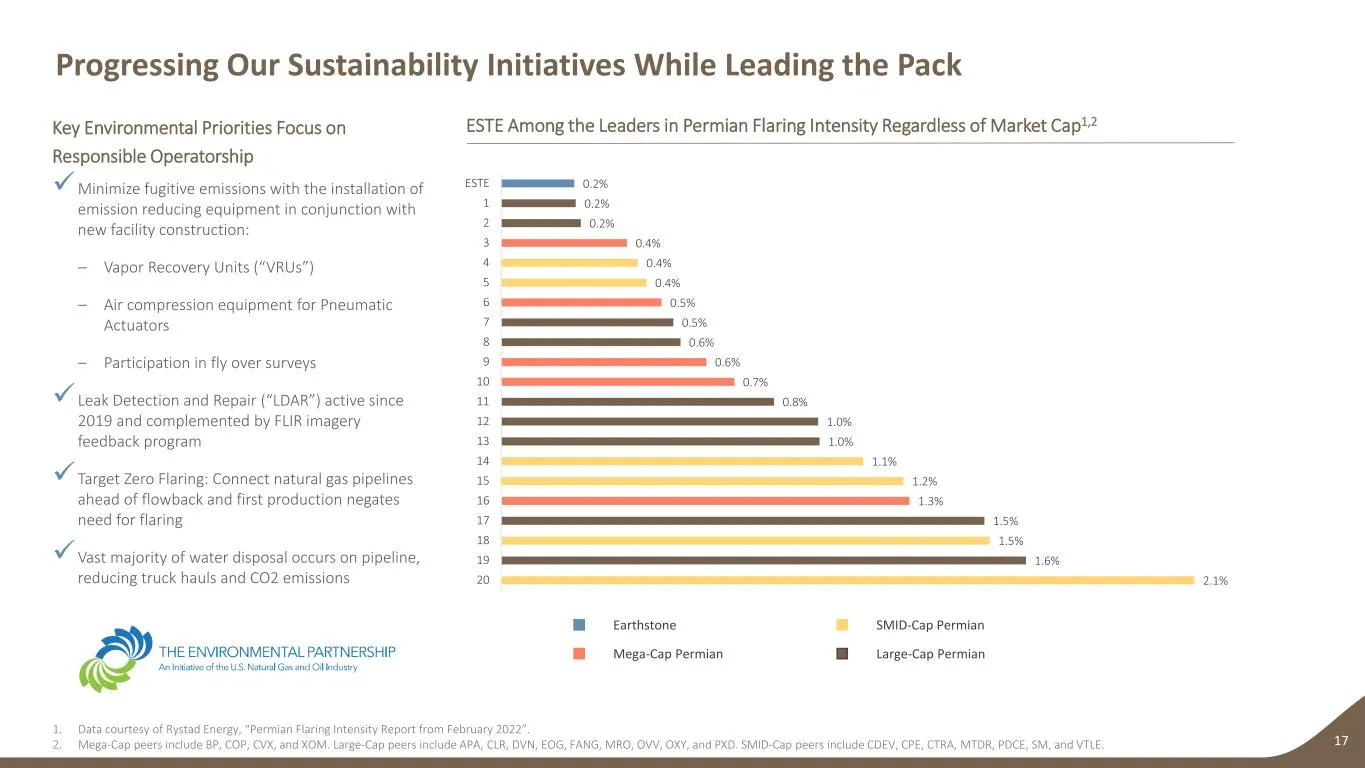
Progressing Our Sustainability Initiatives While Leading the Pack 17 Key Environmental Priorities Focus on Responsible Operatorship Minimize fugitive emissions with the installation of emission reducing equipment in conjunction with new facility construction: – Vapor Recovery Units (“VRUs”) – Air c
Slide 18: Transformed Earthstone Provides Significant Shareholder Value Creation Opportunity
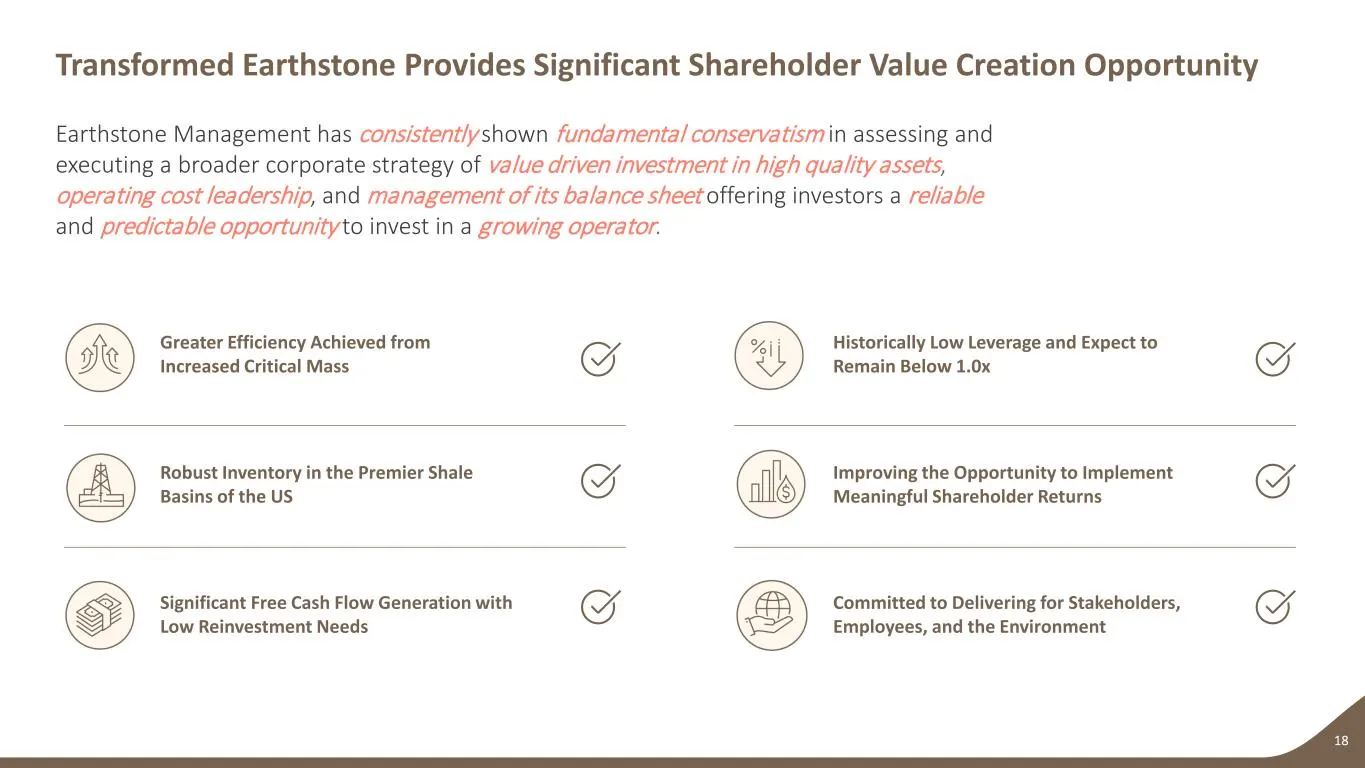
Transformed Earthstone Provides Significant Shareholder Value Creation Opportunity 18 Earthstone Management has consistently shown fundamental conservatism in assessing and executing a broader corporate strategy of value driven investment in high quality assets, operating cost leadership, and manage

Slide 19: Appendix
Appendix 19
Slide 20: Development Optionality Across A Larger Footprint
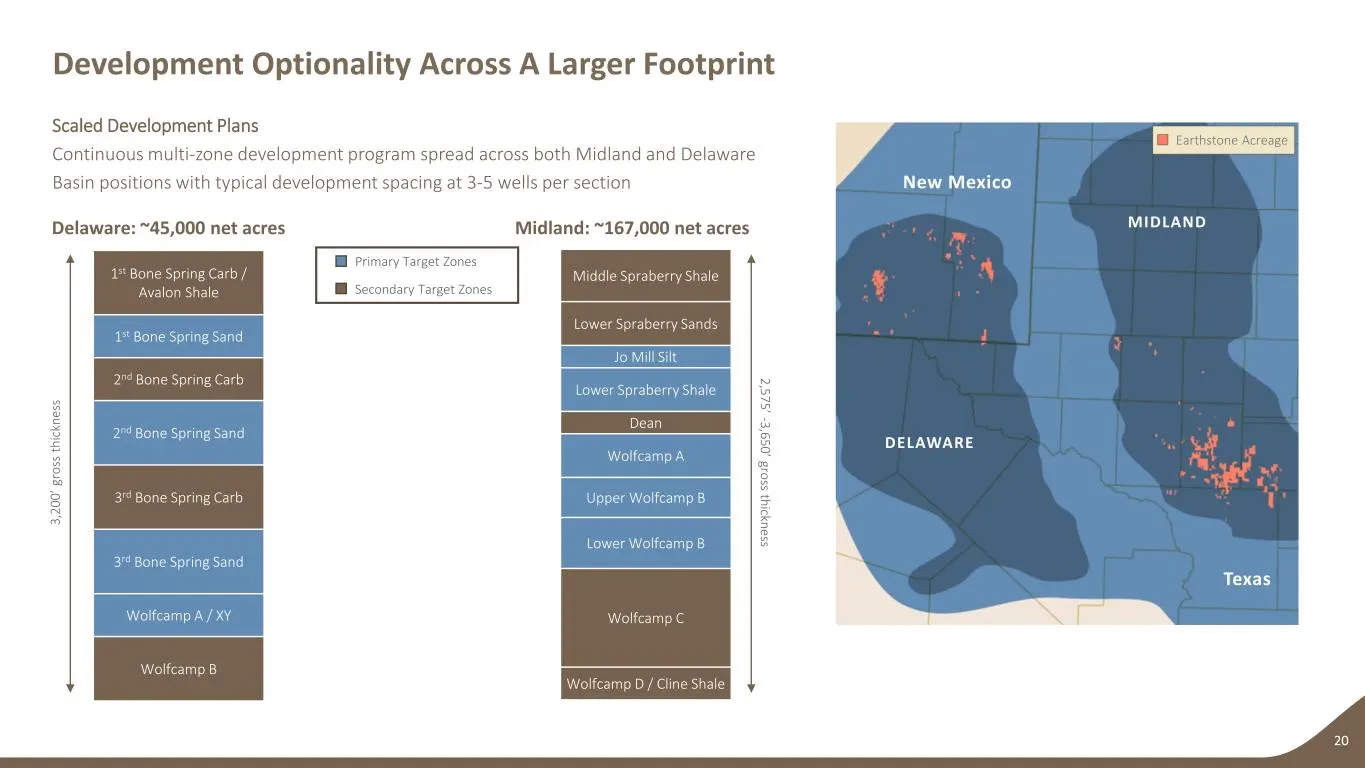
Development Optionality Across A Larger Footprint 20 Scaled Development Plans Continuous multi-zone development program spread across both Midland and Delaware Basin positions with typical development spacing at 3-5 wells per section Delaware: ~45,000 net acres Midland: ~167,000 net acres 1st Bone S
Slide 21: Oil and Gas Hedge Summary
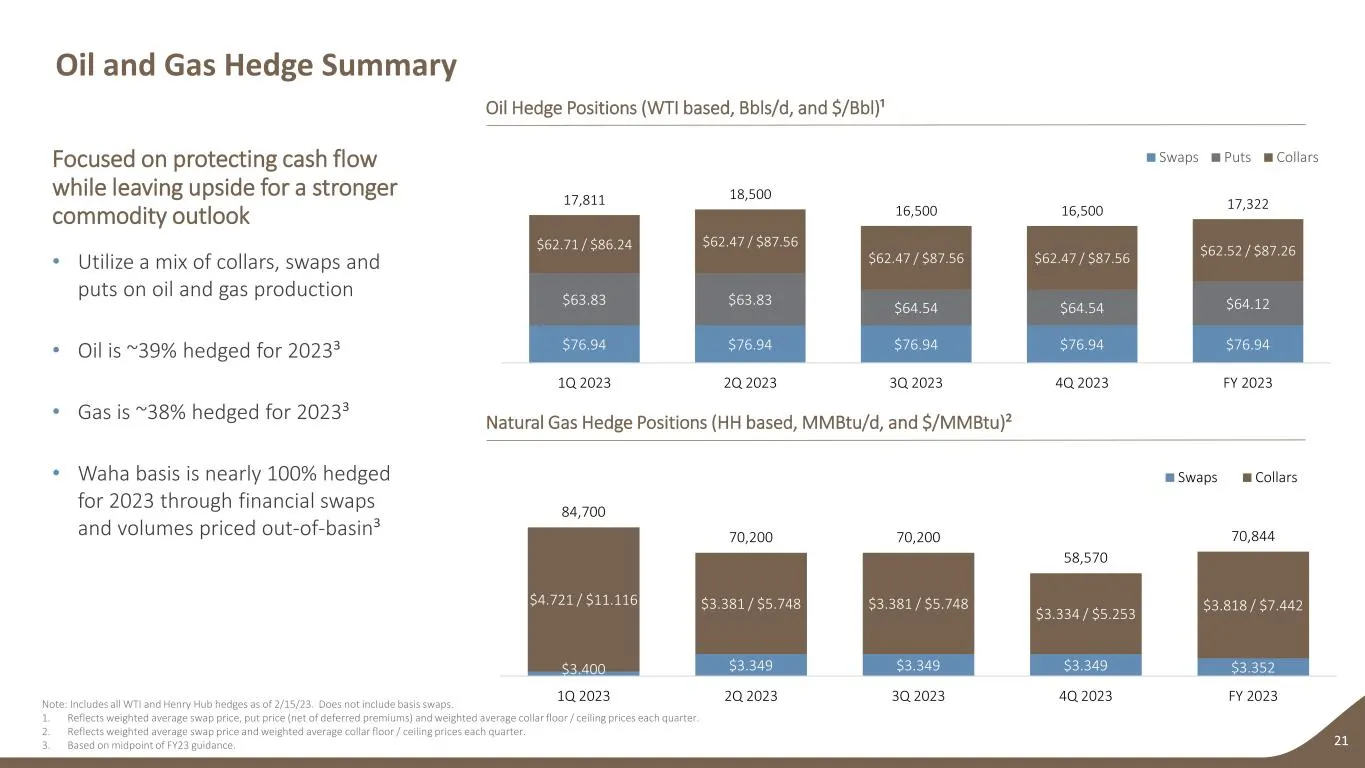
Oil and Gas Hedge Summary 21 Oil Hedge Positions (WTI based, Bbls/d, and $/Bbl)¹ Natural Gas Hedge Positions (HH based, MMBtu/d, and $/MMBtu)² Focused on protecting cash flow while leaving upside for a stronger commodity outlook • Utilize a mix of collars, swaps and puts on oil and gas production •
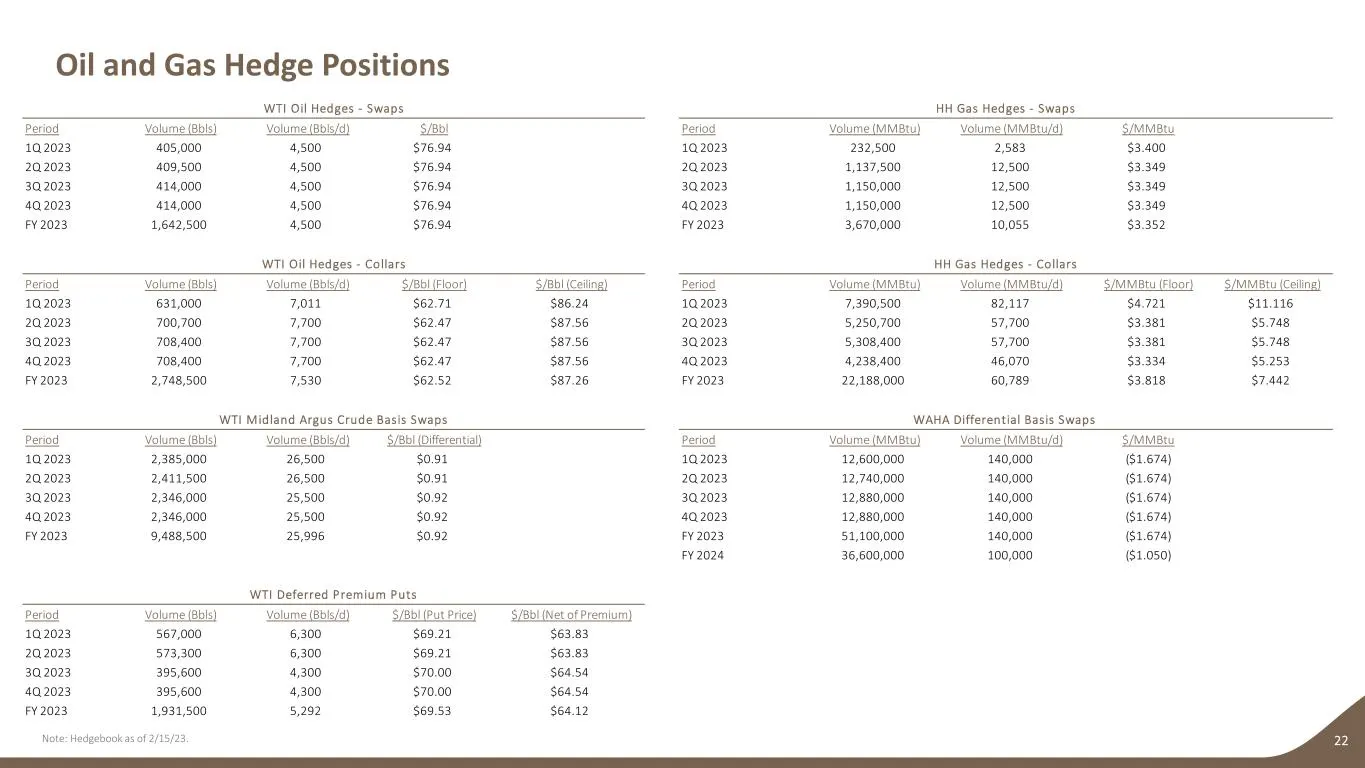
Slide 22: WTI Oil Hedges and HH Gas Hedges
WTI Oil Hedges - Swaps HH Gas Hedges - Swaps Period Volume (Bbls) Volume (Bbls/d) $/Bbl Period Volume (MMBtu) Volume (MMBtu/d) $/MMBtu 1Q 2023 405,000 4,500 $76.94 1Q 2023 232,500 2,583 $3.400 2Q 2023 409,500 4,500 $76.94 2Q 2023 1,137,500 12,500 $3.349 3Q 2023 414,000 4,500 $76.94 3Q 2023 1,150,000
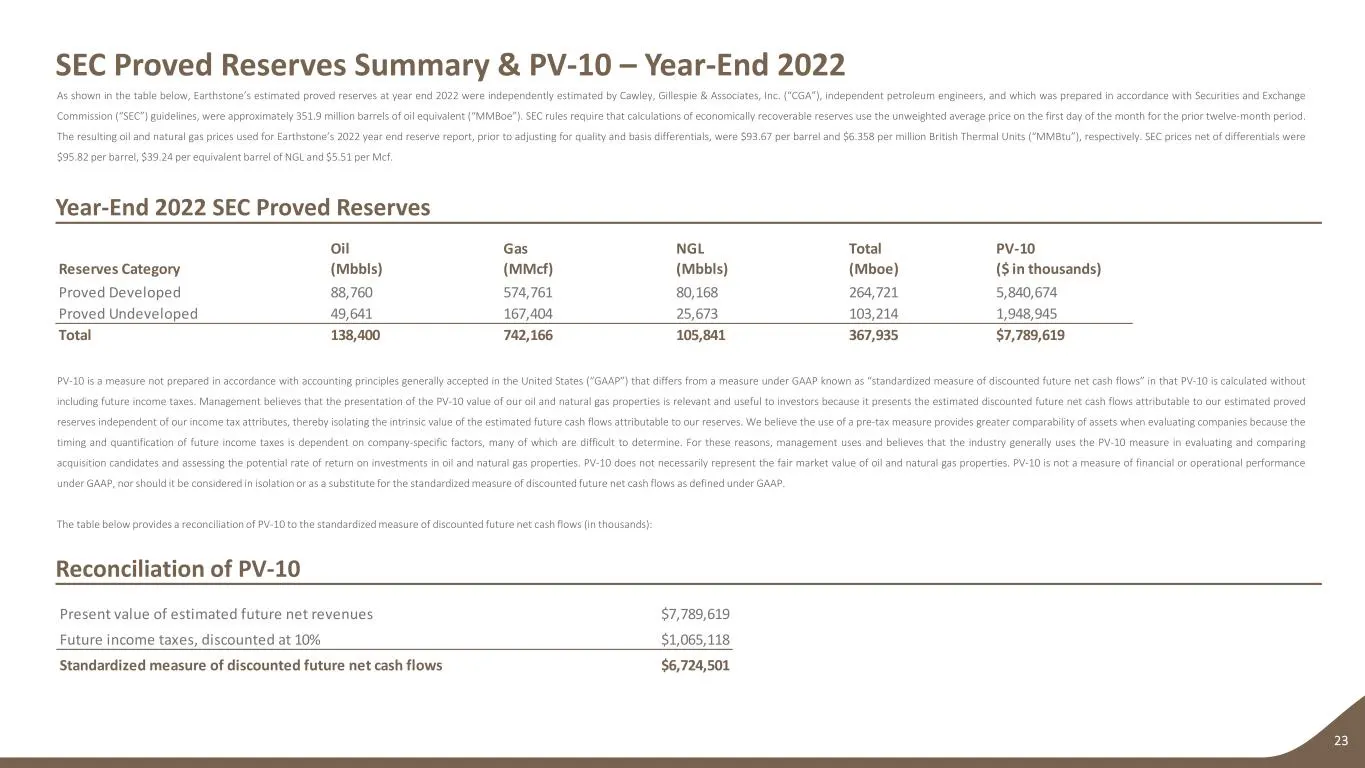
Slide 23: SEC Proved Reserves Summary & PV-10 – Year-End 2022
SEC Proved Reserves Summary & PV-10 – Year-End 2022 23 Year-End 2022 SEC Proved Reserves Reconciliation of PV-10 As shown in the table below, Earthstone’s estimated proved reserves at year end 2022 were independently estimated by Cawley, Gillespie & Associates, Inc. (“CGA”), independent petroleum en
Slide 24: Definition of Non-GAAP Financial Measure – Adjusted EBITDAX
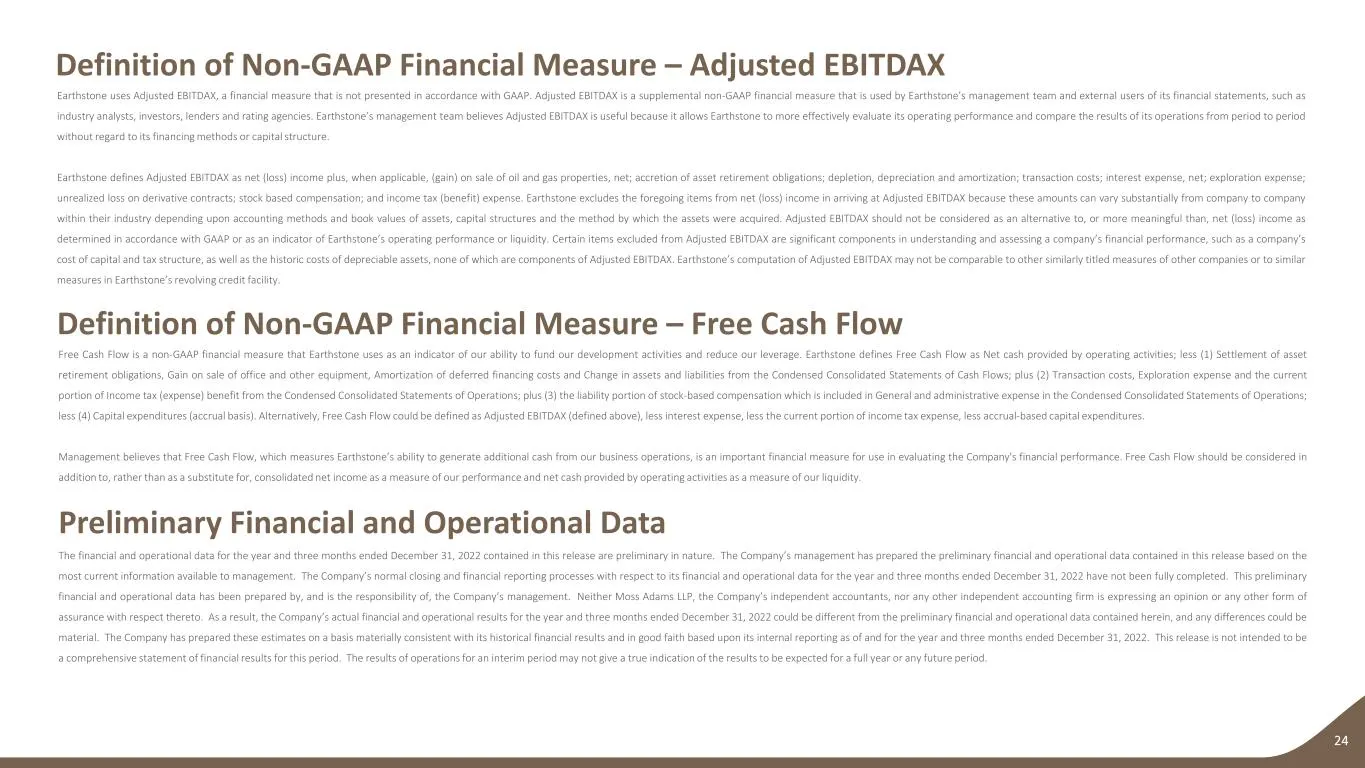
Definition of Non-GAAP Financial Measure – Adjusted EBITDAX 24 Earthstone uses Adjusted EBITDAX, a financial measure that is not presented in accordance with GAAP. Adjusted EBITDAX is a supplemental non-GAAP financial measure that is used by Earthstone’s management team and external users of its fin
Slide 25: Estimated Proved Reserves Summary at NYMEX Strip Pricing
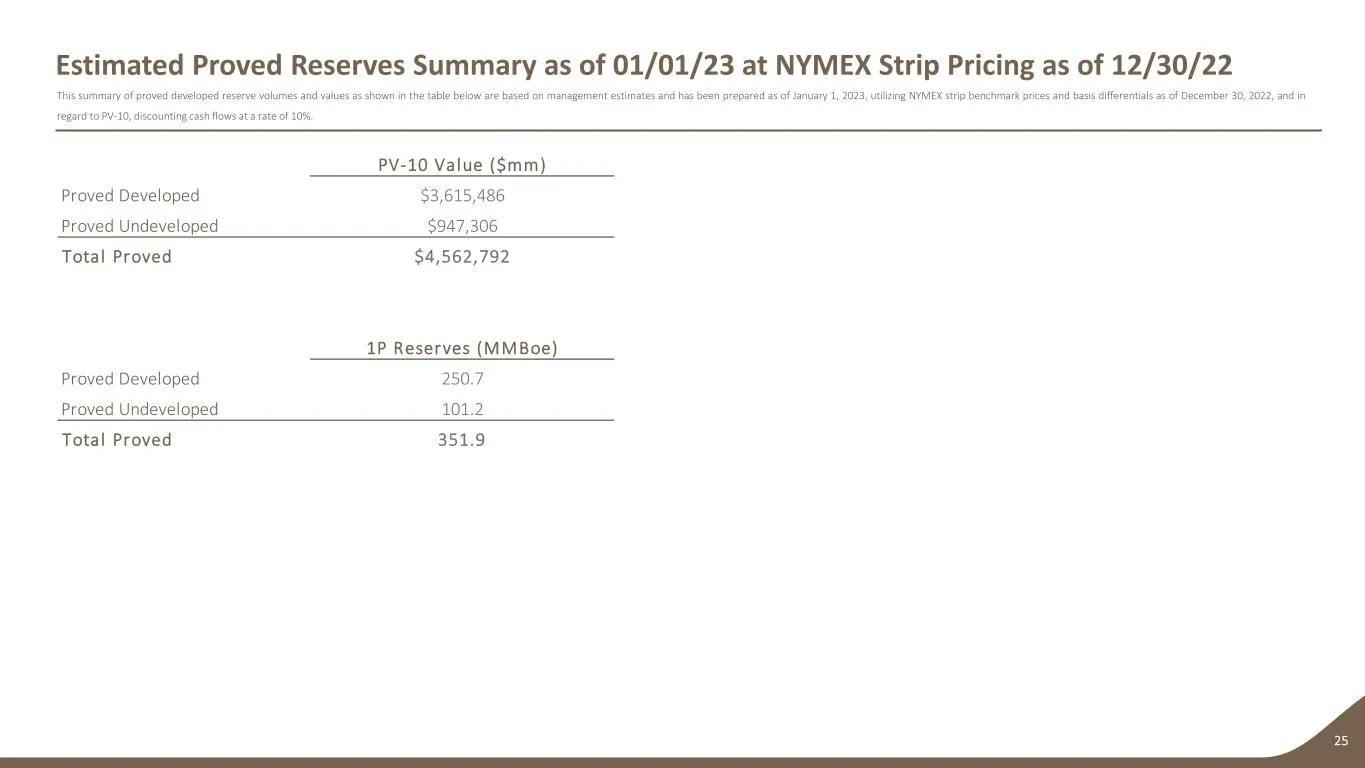
Estimated Proved Reserves Summary as of 01/01/23 at NYMEX Strip Pricing as of 12/30/22 25 This summary of proved developed reserve volumes and values as shown in the table below are based on management estimates and has been prepared as of January 1, 2023, utilizing NYMEX strip benchmark prices and
Slide 26: Market Capitalization Table
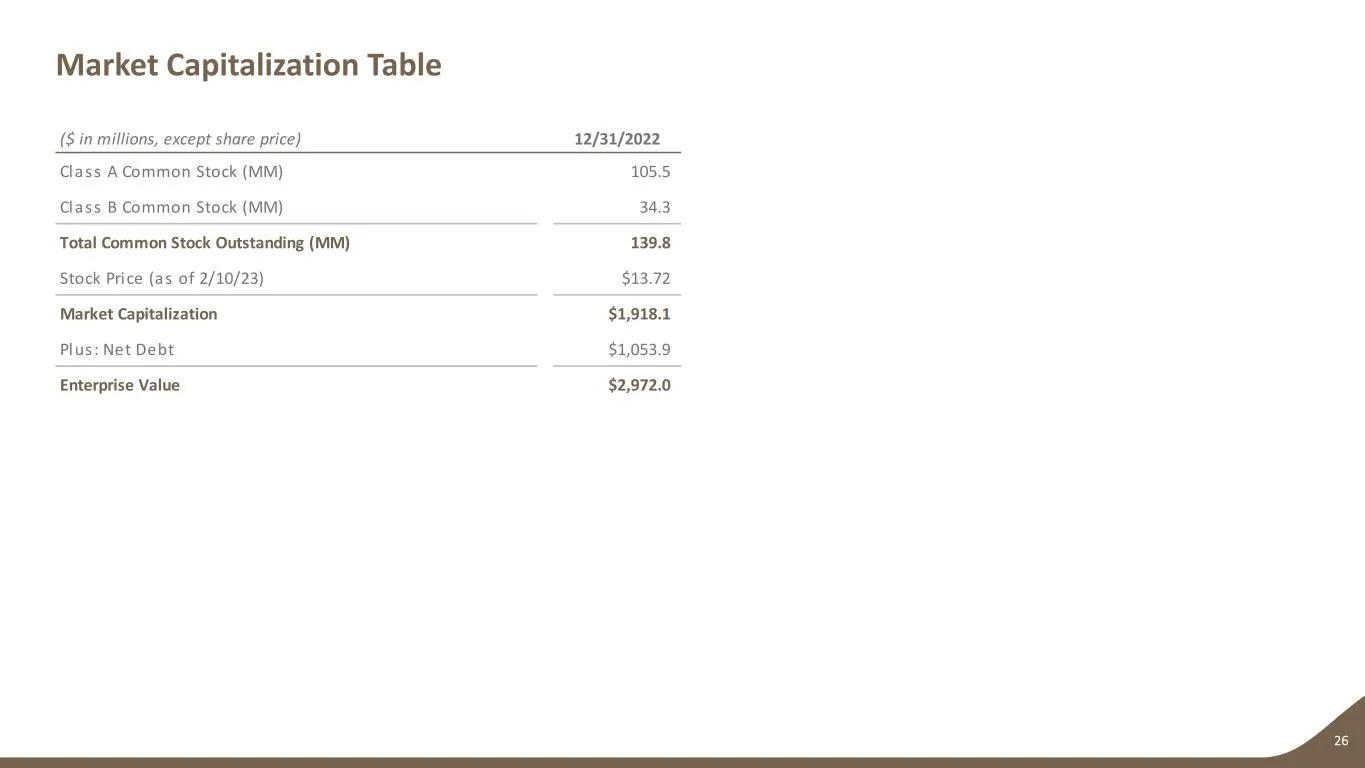
Market Capitalization Table 26 ($ in millions, except share price) 12/31/2022 Class A Common Stock (MM) 105.5 Class B Common Stock (MM) 34.3 Total Common Stock Outstanding (MM) 139.8 Stock Price (as of 2/10/23) $13.72 Market Capitalization $1,918.1 Plus : Net Debt $1,053.9 Enterprise Value $2,972.0
Slide 27: Notes and Supplemental Information
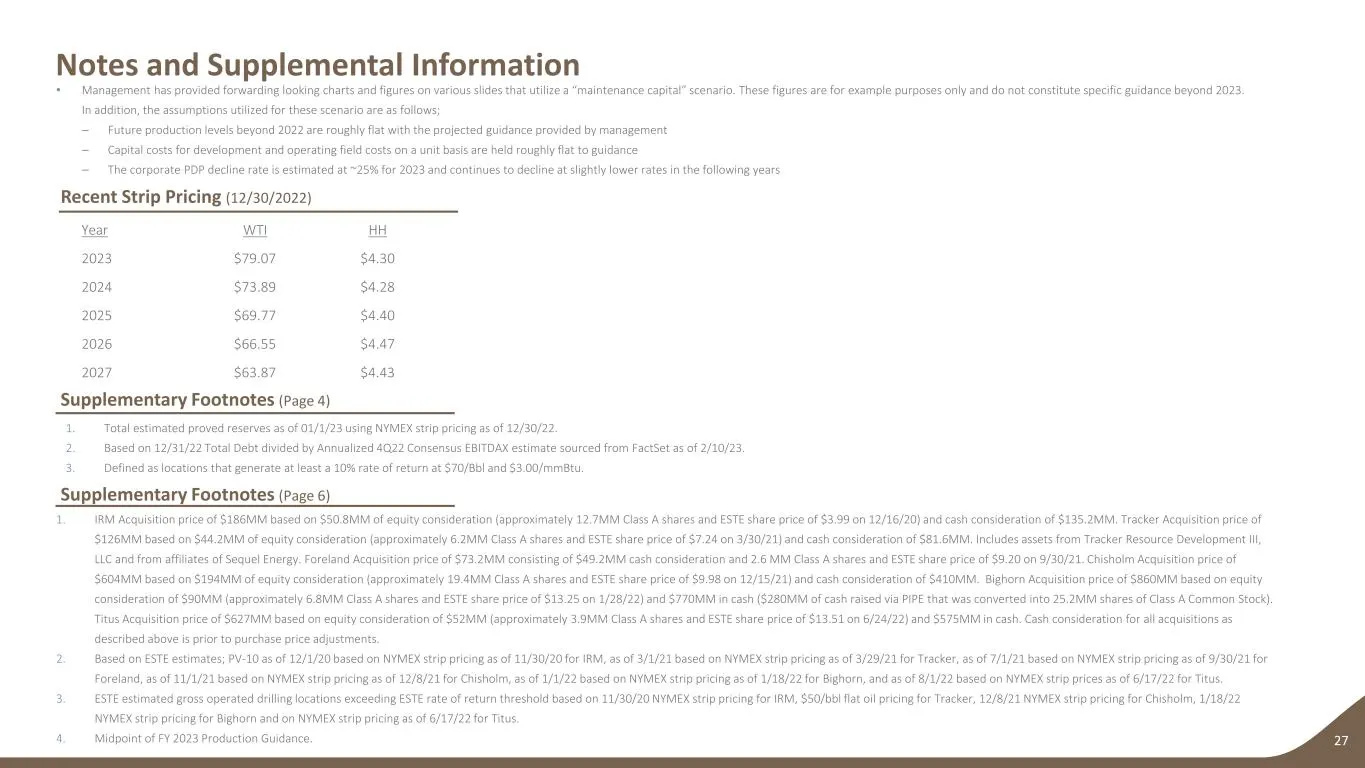
1. Total estimated proved reserves as of 01/1/23 using NYMEX strip pricing as of 12/30/22. 2. Based on 12/31/22 Total Debt divided by Annualized 4Q22 Consensus EBITDAX estimate sourced from FactSet as of 2/10/23. 3. Defined as locations that generate at least a 10% rate of return at $70/Bbl and $3.0
Source: SEC EDGAR · 8-K filed Feb 16, 2023
More decks from Earthstone Energy Inc
 Merger or Acquisition (August 2023)20 slides · Aug 23, 2023
 EnerCom Denver 202332 slides · Aug 14, 2023
 Q2 2023 Earnings Presentation25 slides · Aug 2, 2023
 Investor Presentation (June 2023)29 slides · Jun 20, 2023
 Merger or Acquisition (June 2023)16 slides · Jun 16, 2023
 Q1 2023 Earnings Presentation33 slides · May 3, 2023