Billerud AB · OMXSTO:BILL
Billerud AB — Carnegie Nordic Small & Midcap Seminar 2002
24 slides from Billerud AB's conference presentation, Oct 7, 2002
Slide 1: Billerud – Carnegie Nordic Small & Midcap Seminar 2002
Billerud Carnegie Nordic Small & Midcap Seminar 2002 7 October, 2002 Bert Östlund, CEO Sid 1
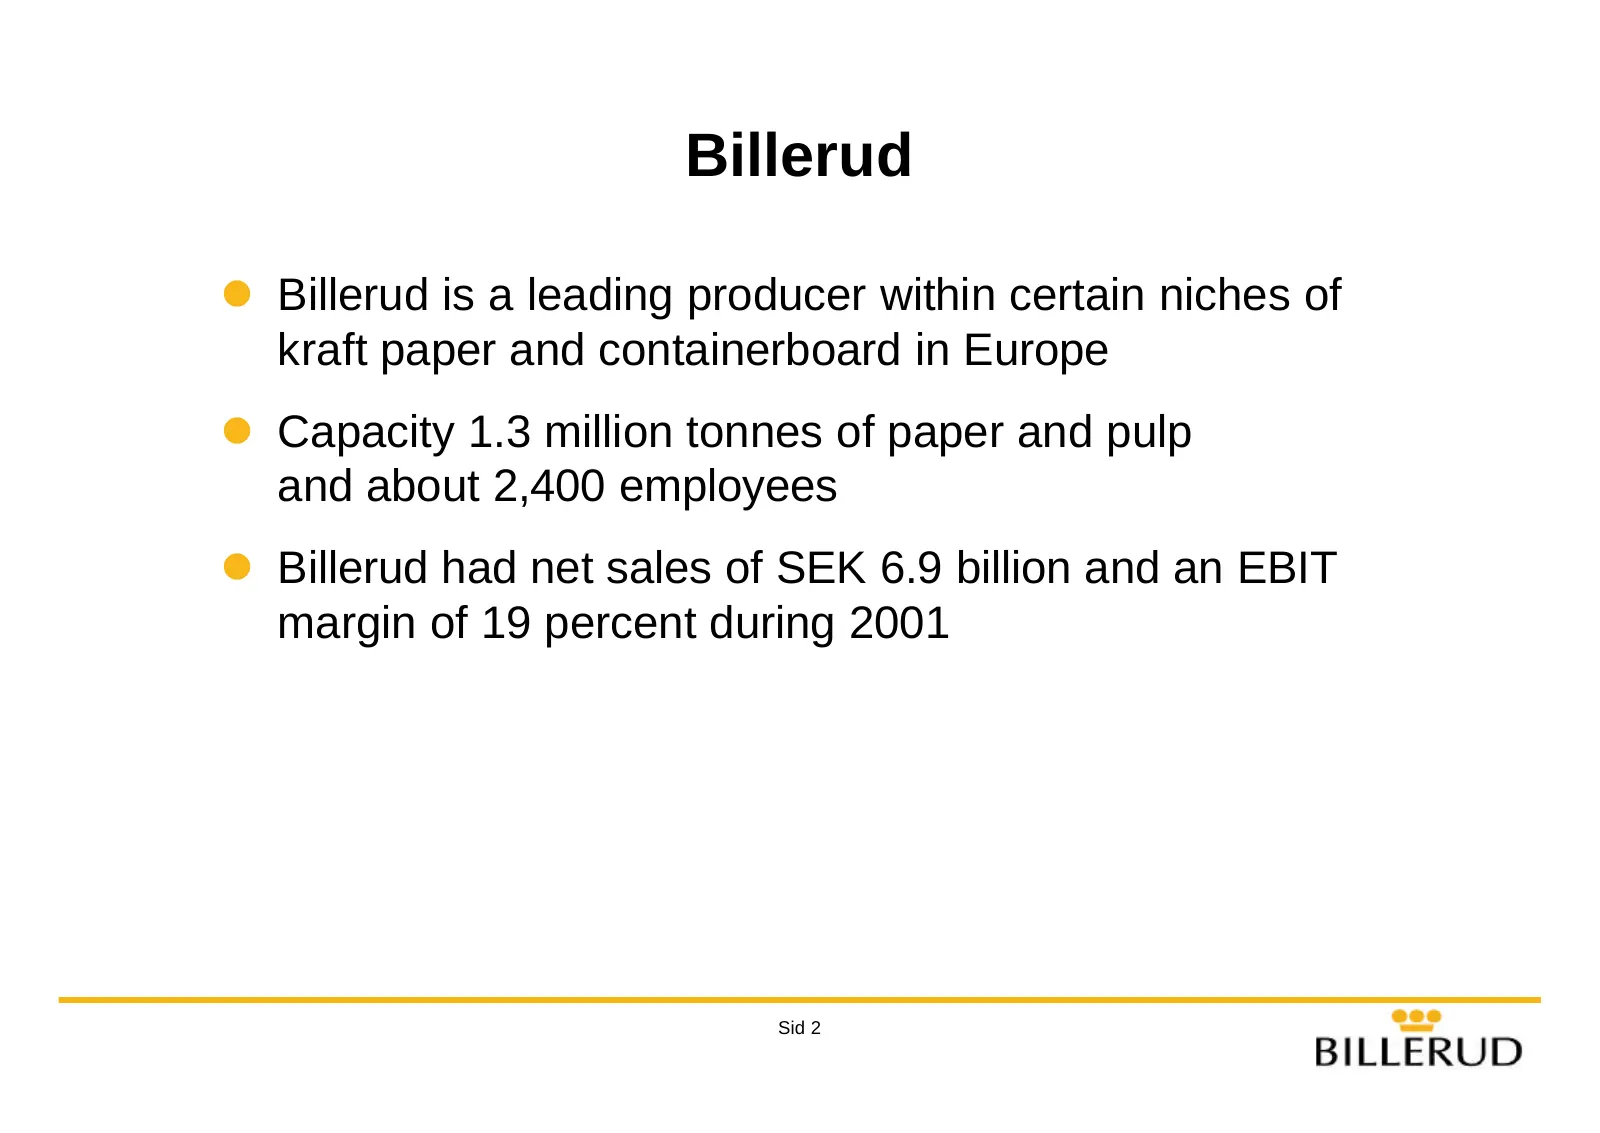
Slide 2: Billerud
Billerud l Billerud is a leading producer within certain niches of kraft paper and containerboard in Europe l Capacity 1.3 million tonnes of paper and pulp and about 2,400 employees l Billerud had net sales of SEK 6.9 billion and an EBIT margin of 19 percent during 2001 Sid 2
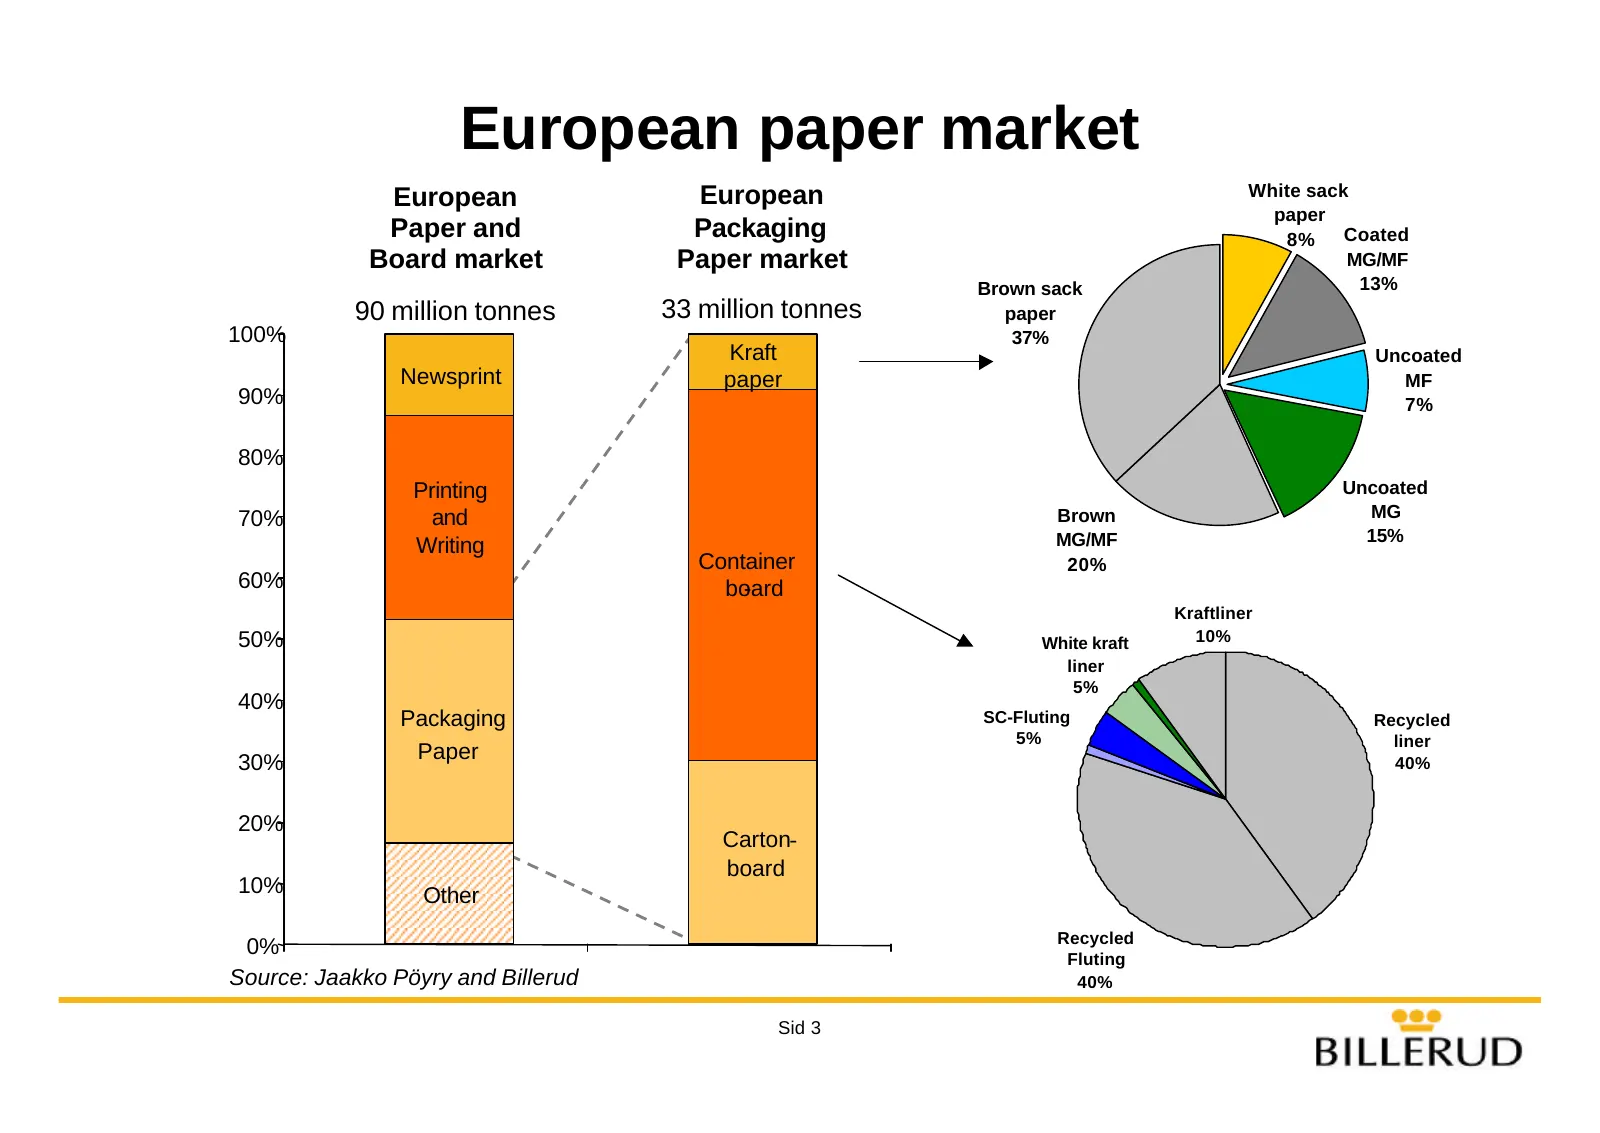
Slide 3: European paper market
European paper market European European White sack paper Paper and Packaging 8% Coated Board market Paper market MG/MF Brown sack 13% 90 million tonnes 33 million tonnes paper 100% 37% Kraft Uncoated Newsprint paper MF 90% 7% 80% Printing Uncoated 70% and Brown MG MG/MF 15% Writing Container 20% 60%
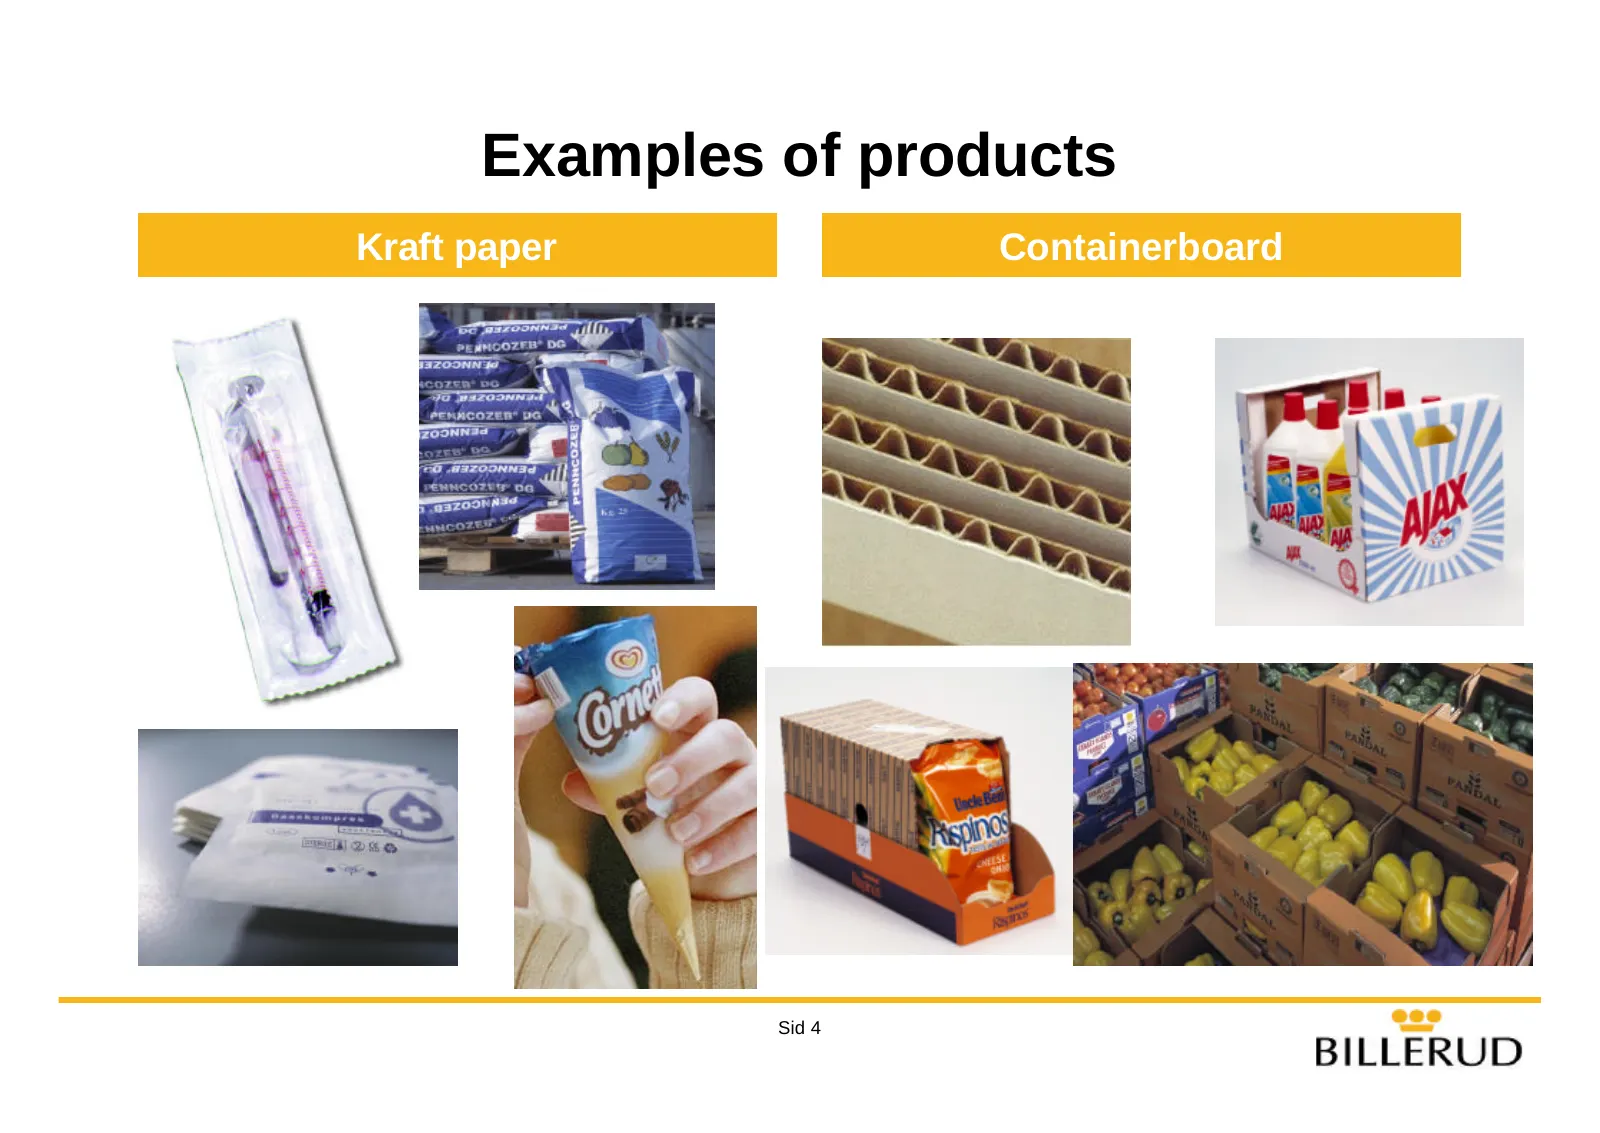
Slide 4: Examples of products
Examples of products Kraft paper Containerboard Sid 4
Slide 5: Billerud – investment considerations
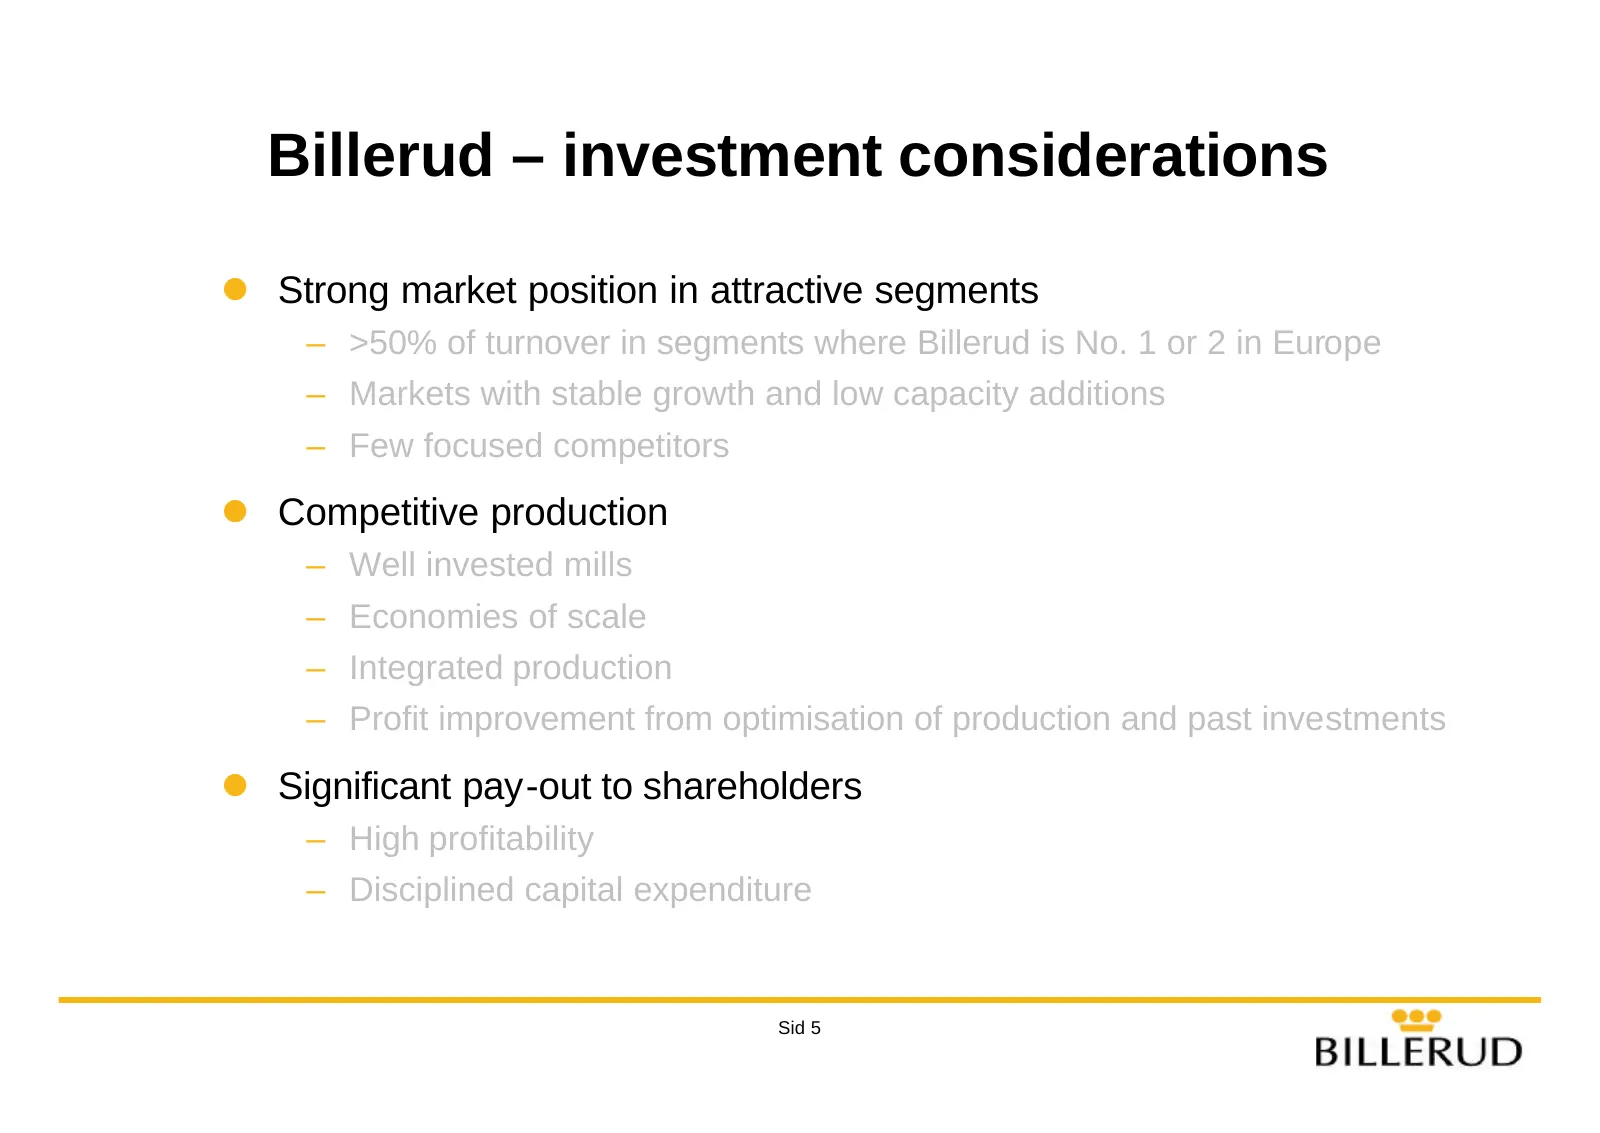
Billerud – investment considerations l Strong market position in attractive segments – >50% of turnover in segments where Billerud is No. 1 or 2 in Europe – Markets with stable growth and low capacity additions – Few focused competitors l Competitive production – Well invested mills – Economies of s
Slide 6: Product positioning
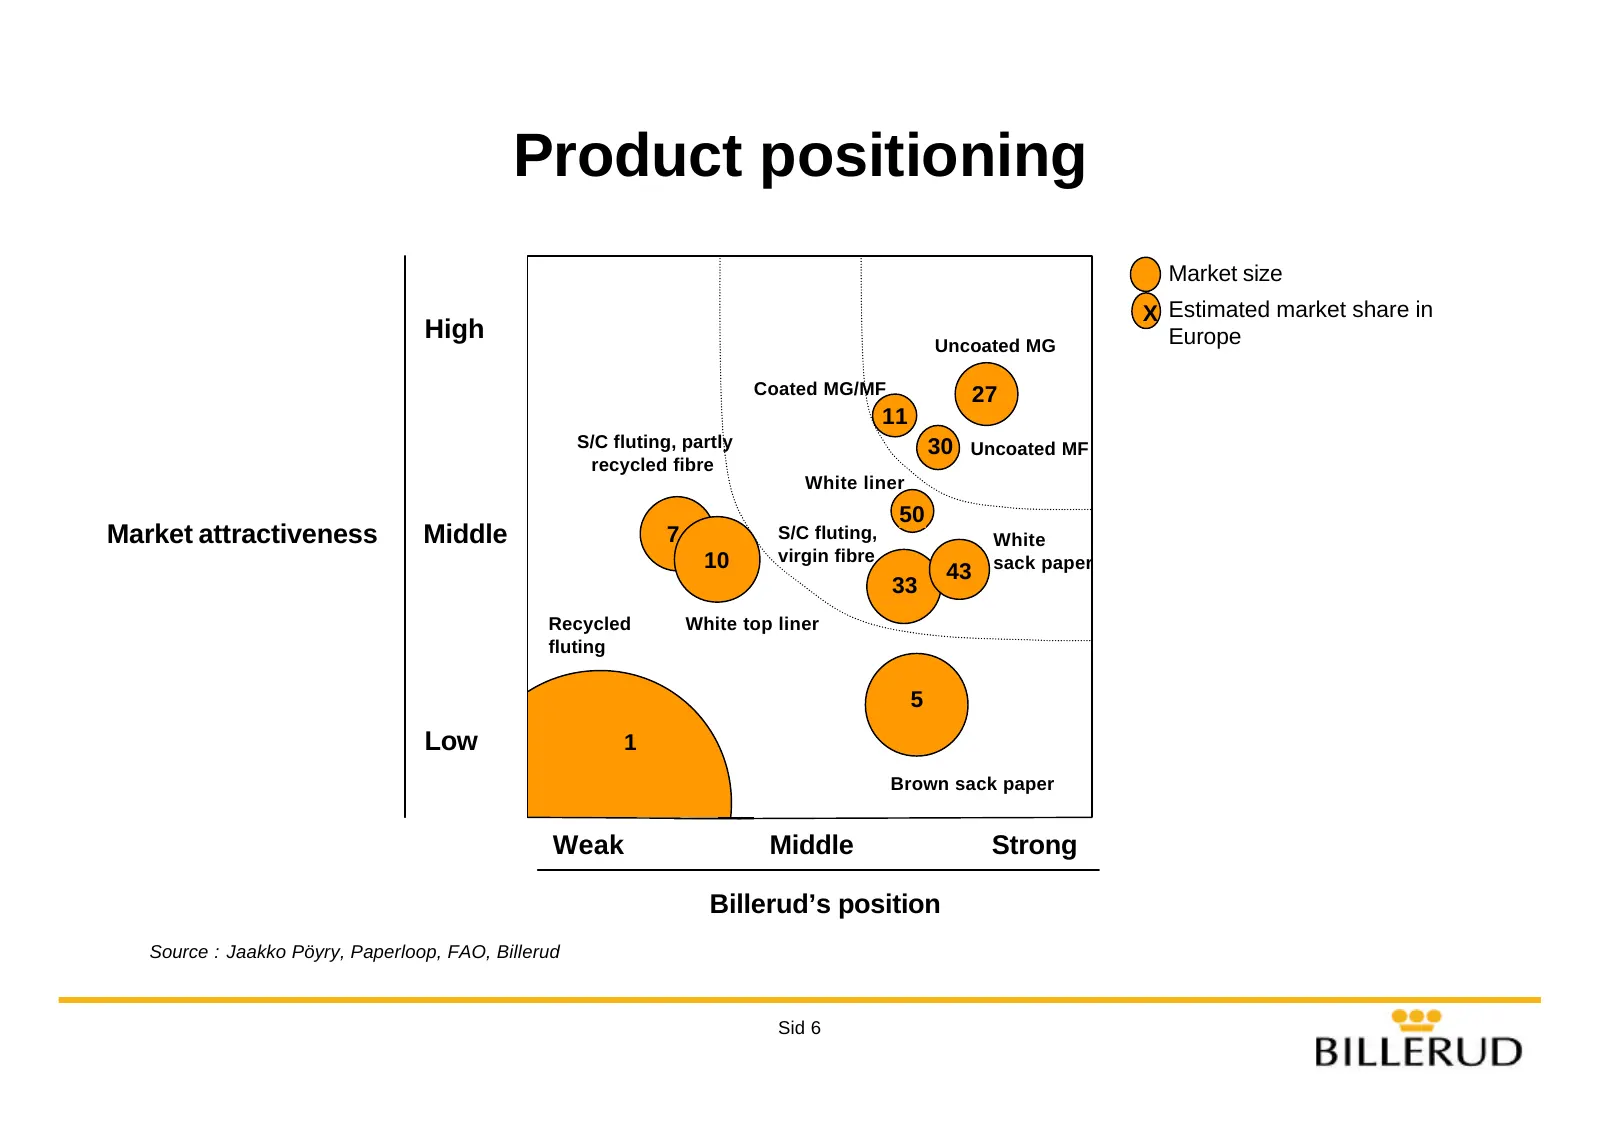
Product positioning Market size X Estimated market share in High Europe Uncoated MG Coated MG/MF 27 11 S/C fluting, partly 30 Uncoated MF recycled fibre White liner 50 Market attractiveness Middle 7 S/C fluting, White 10 virgin fibre sack paper 43 33 Recycled White top liner fluting 5 Low 1 Brown sa
Slide 7: Product strategy
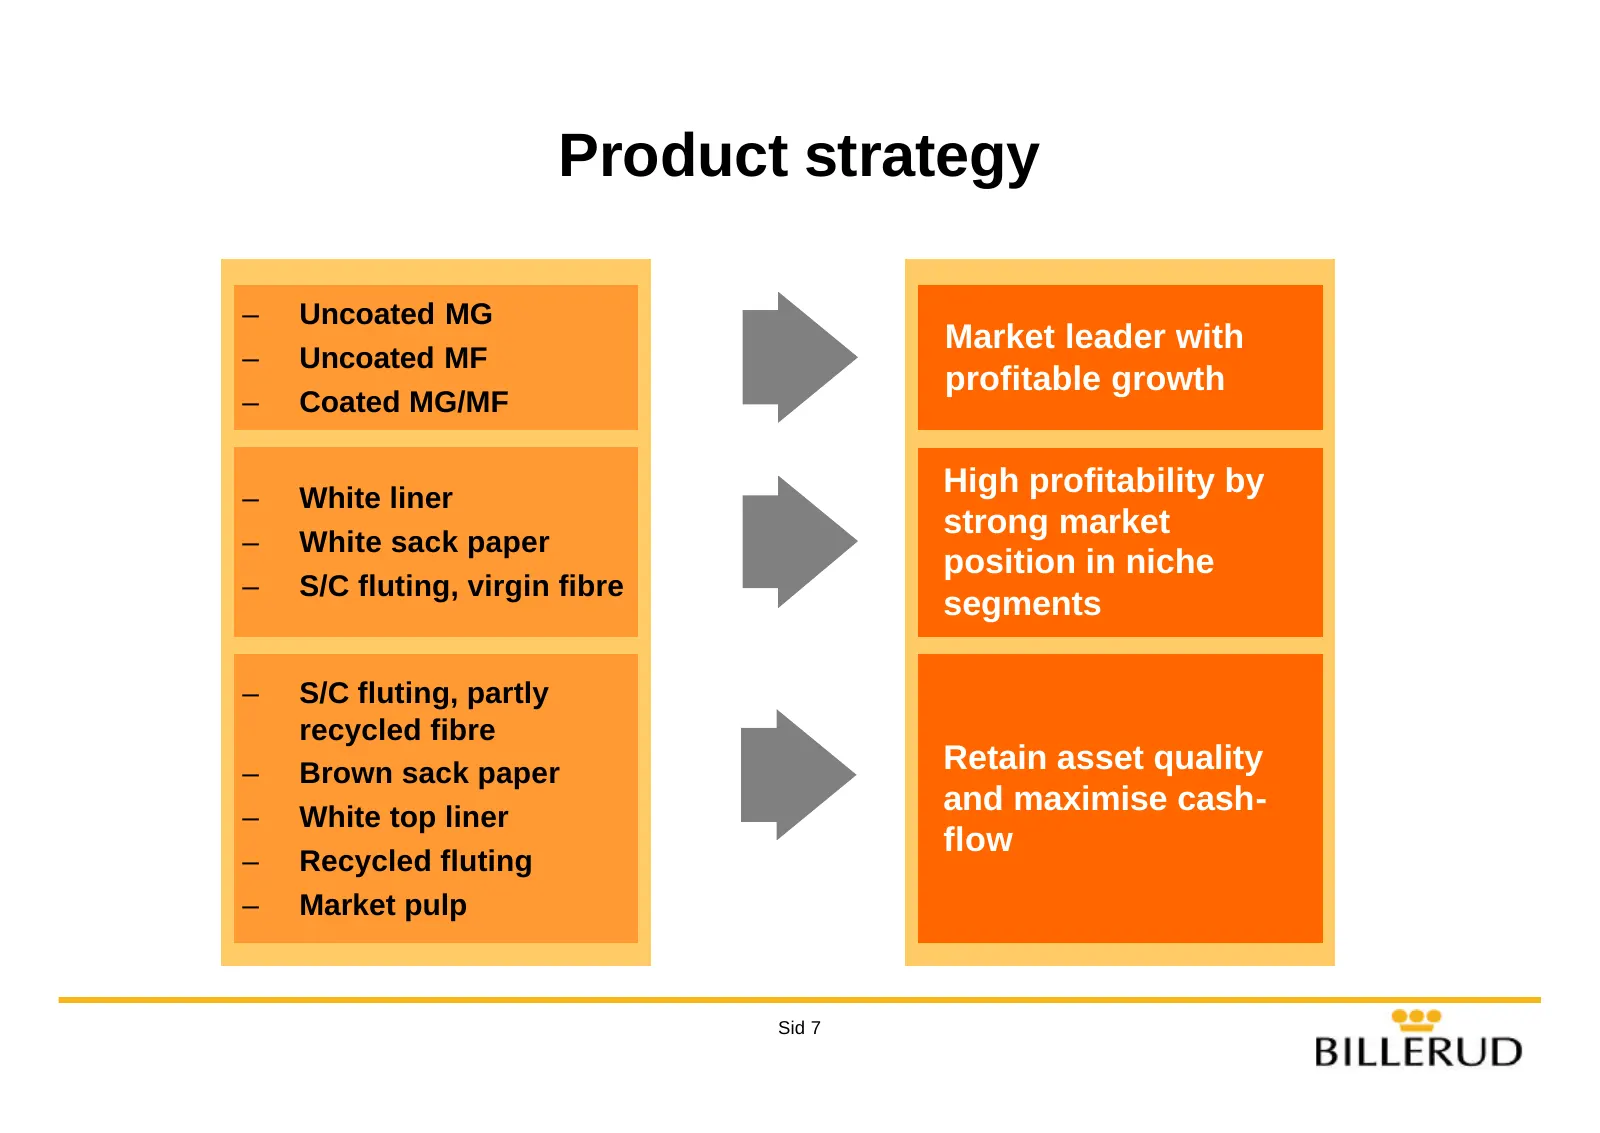
Product strategy – Uncoated MG Market leader with – Uncoated MF profitable growth – Coated MG/MF – White liner High profitability by strong market – White sack paper position in niche – S/C fluting, virgin fibre segments – S/C fluting, partly recycled fibre – Brown sack paper Retain asset quality an
Slide 8: Core areas in Kraft Paper
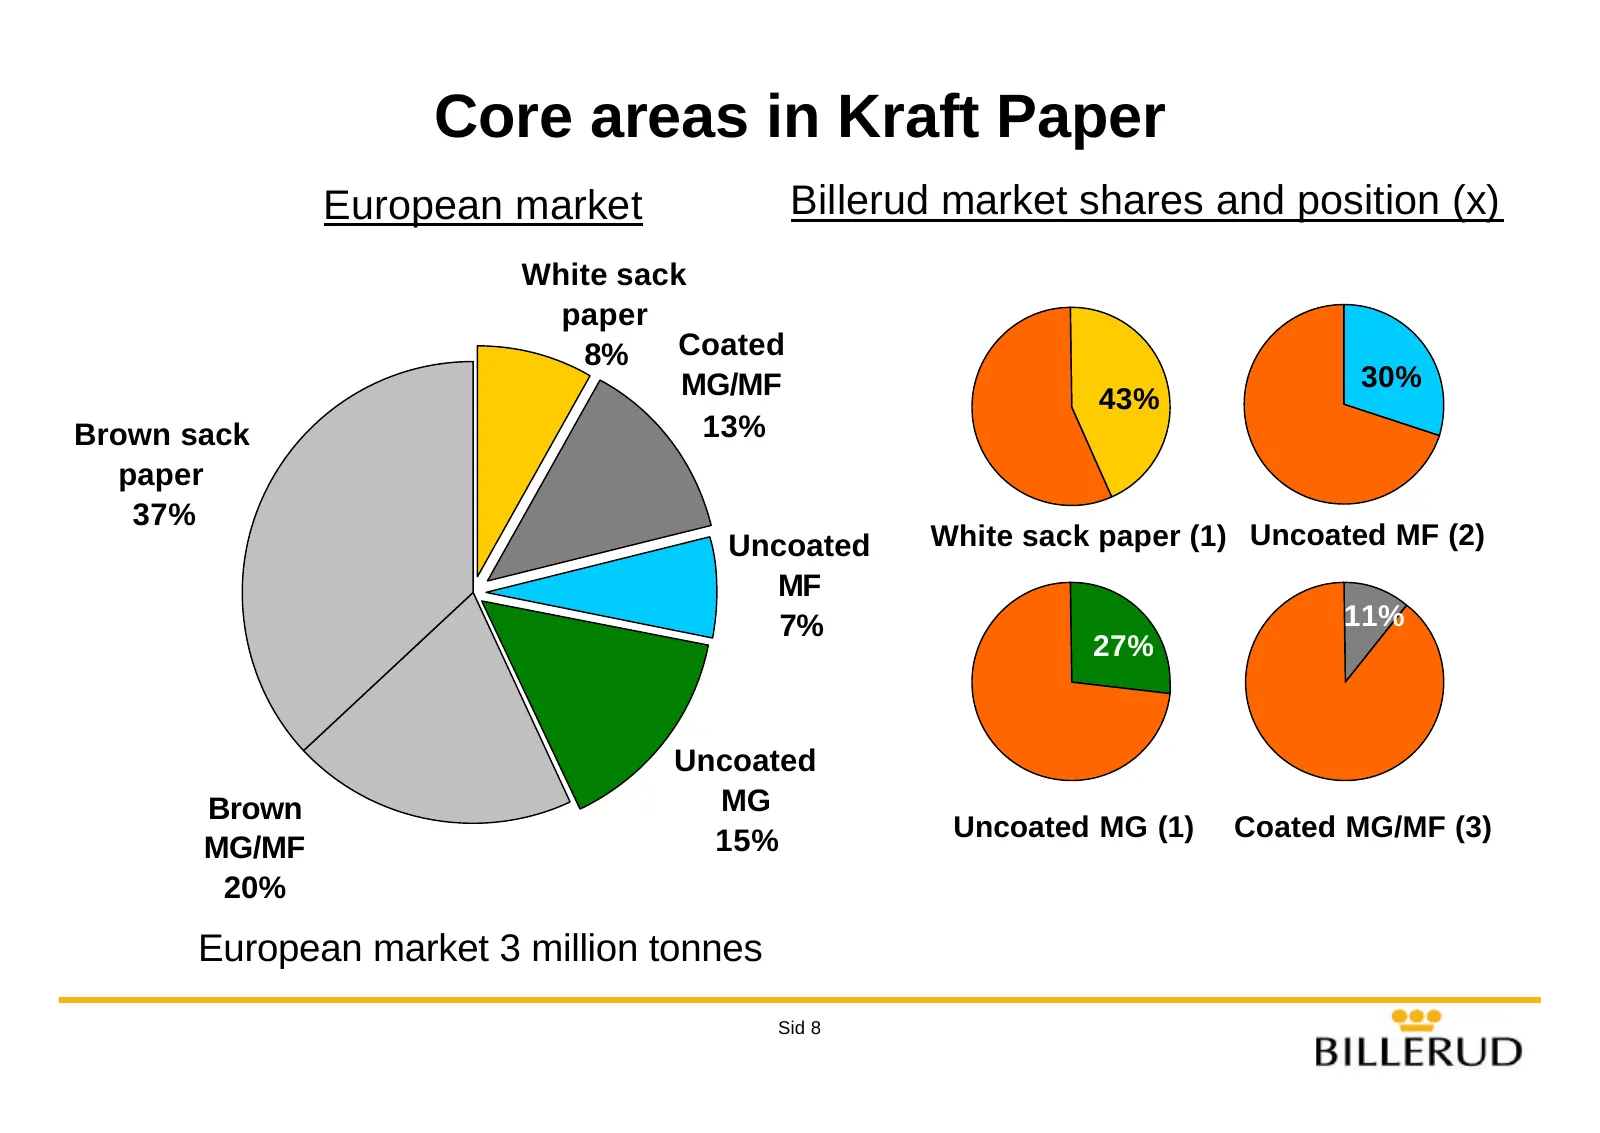
Core areas in Kraft Paper European market Billerud market shares and position (x) White sack paper 8% Coated MG/MF 30% 43% Brown sack 13% paper 37% Uncoated White sack paper (1) Uncoated MF (2) MF 7% 11% 27% Uncoated Brown MG 15% Uncoated MG (1) Coated MG/MF (3) MG/MF 20% European market 3 million t
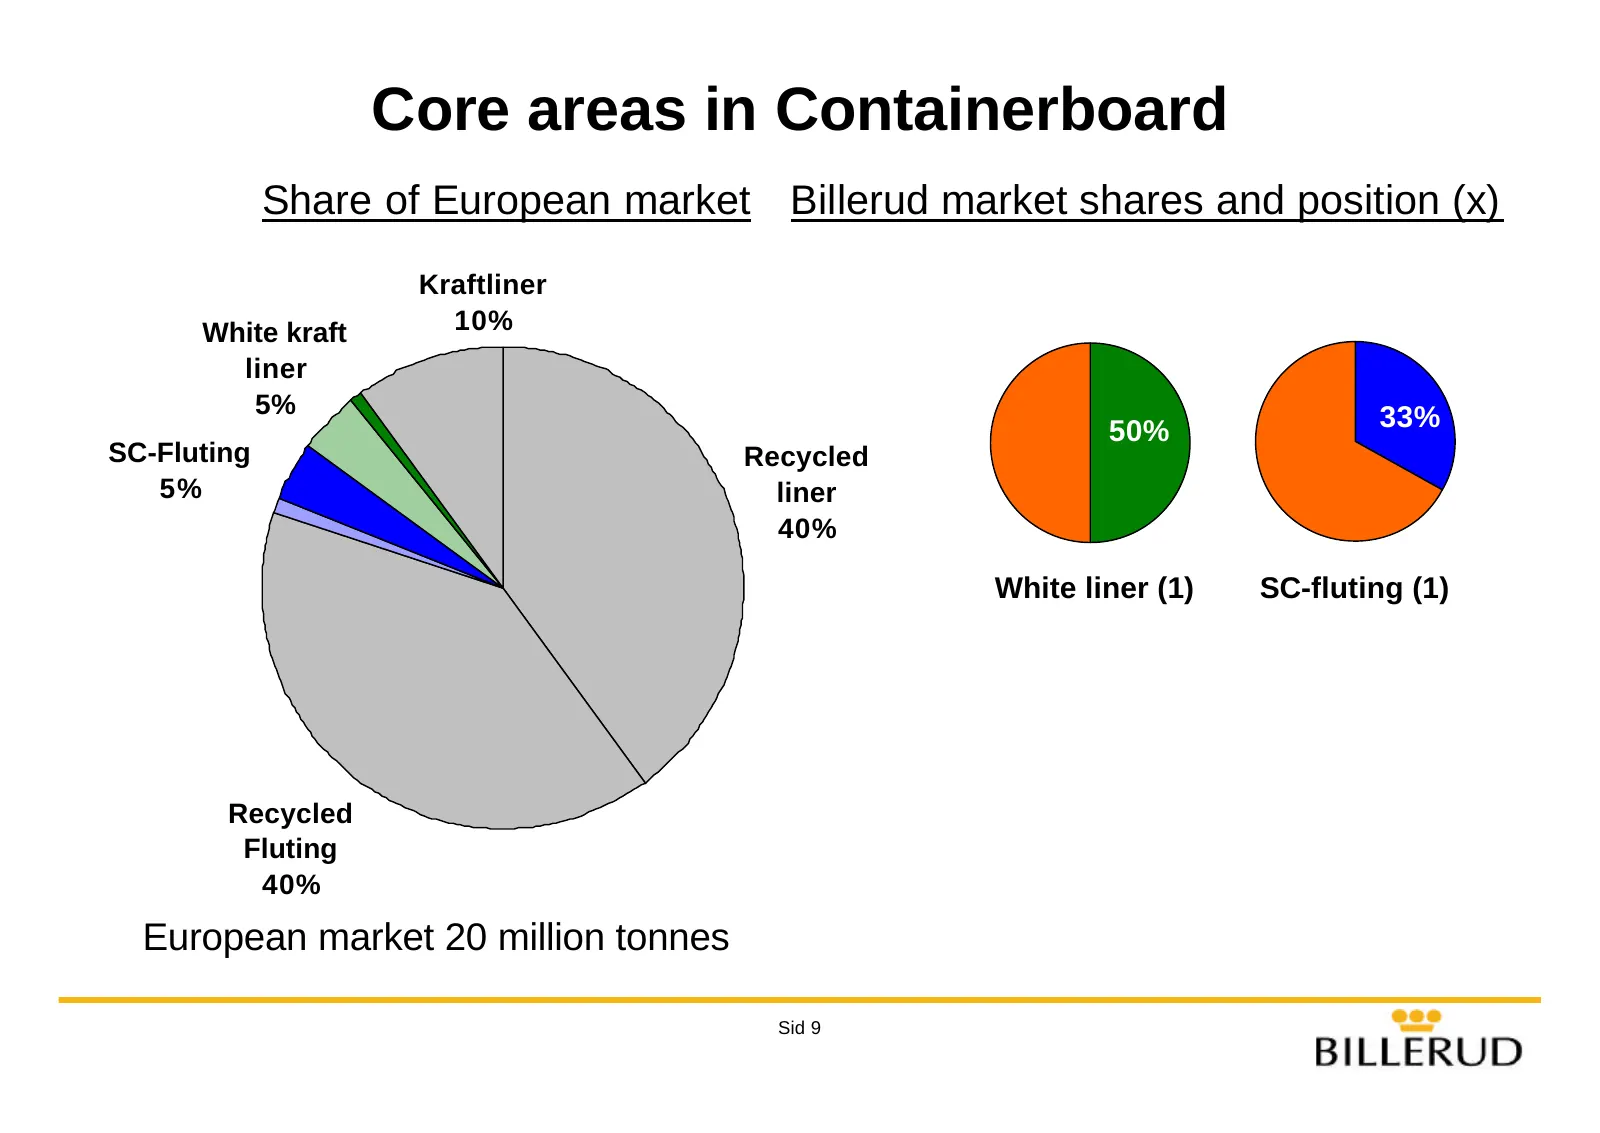
Slide 9: Core areas in Containerboard
Core areas in Containerboard Share of European market Billerud market shares and position (x) Kraftliner White kraft 10% liner 5% 33% 50% SC-Fluting Recycled 5% liner 40% White liner (1) SC-fluting (1) Recycled Fluting 40% European market 20 million tonnes Sid 9
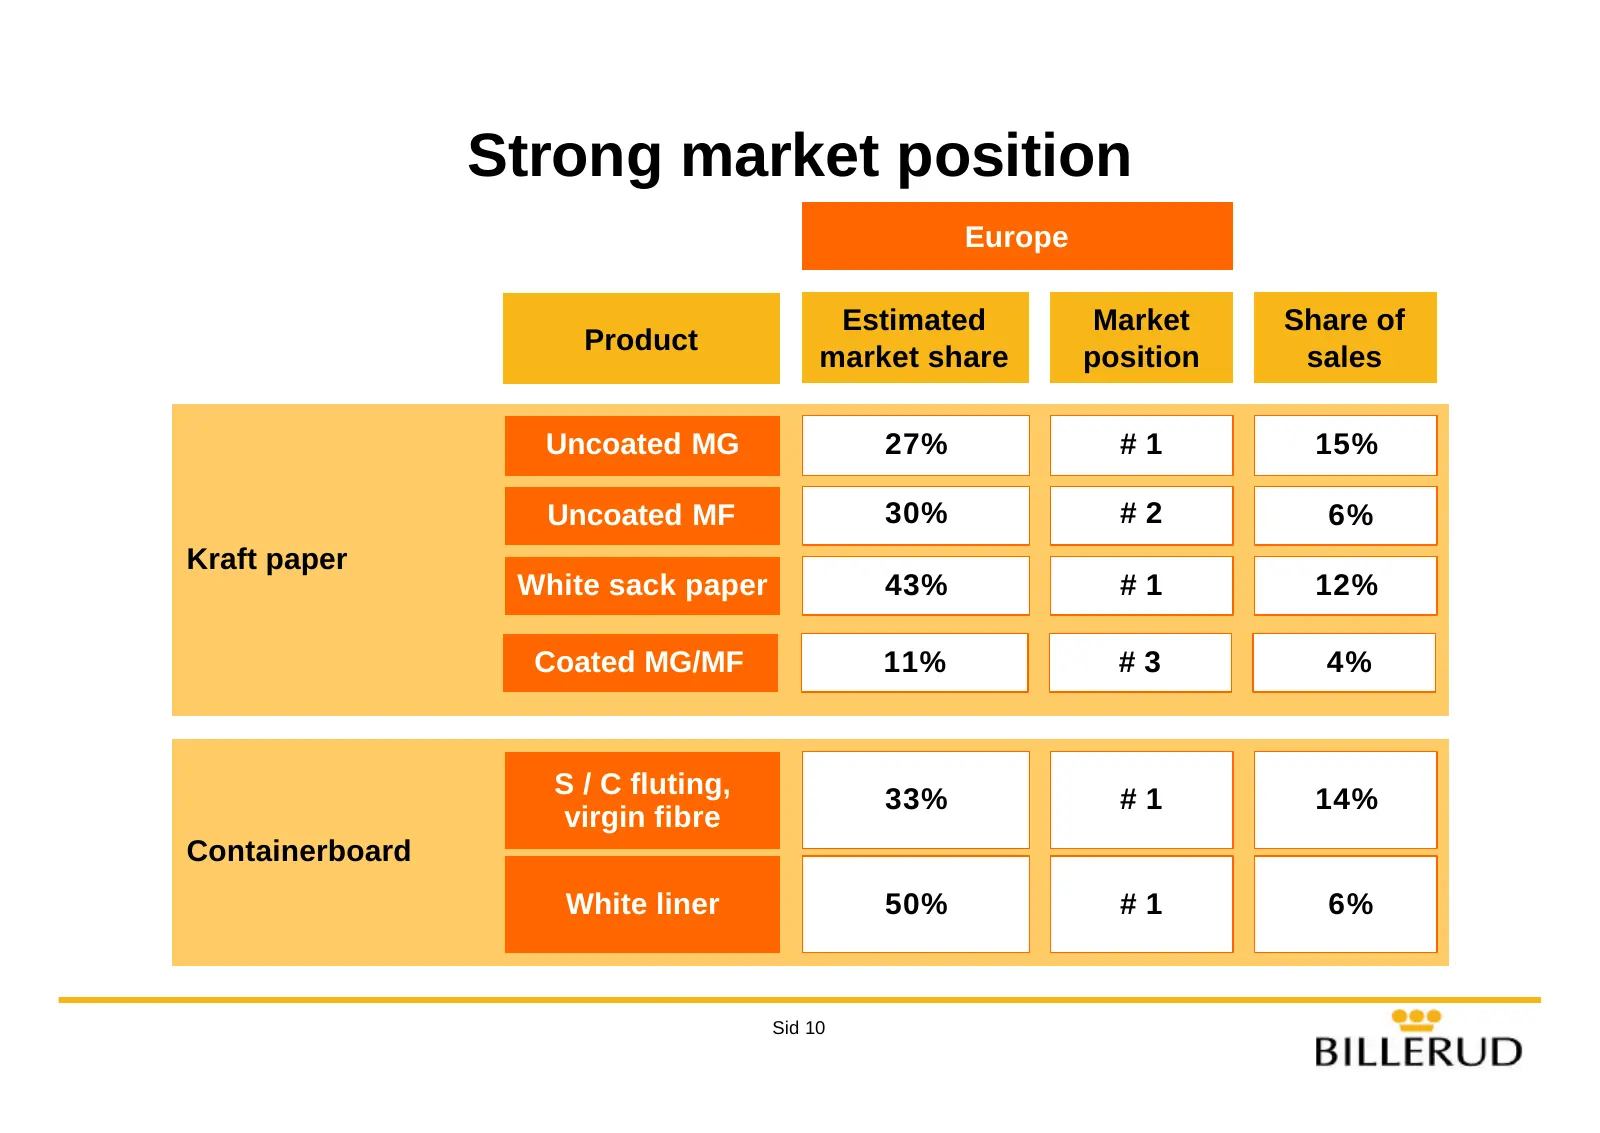
Slide 10: Strong market position
Strong market position Europe Estimated Market Share of Product market share position sales Uncoated MG 27% #1 15% Uncoated MF 30% #2 6% Kraft paper White sack paper 43% #1 12% Coated MG/MF 11% #3 4% S / C fluting, 33% #1 14% virgin fibre Containerboard White liner 50% #1 6% Sid 10
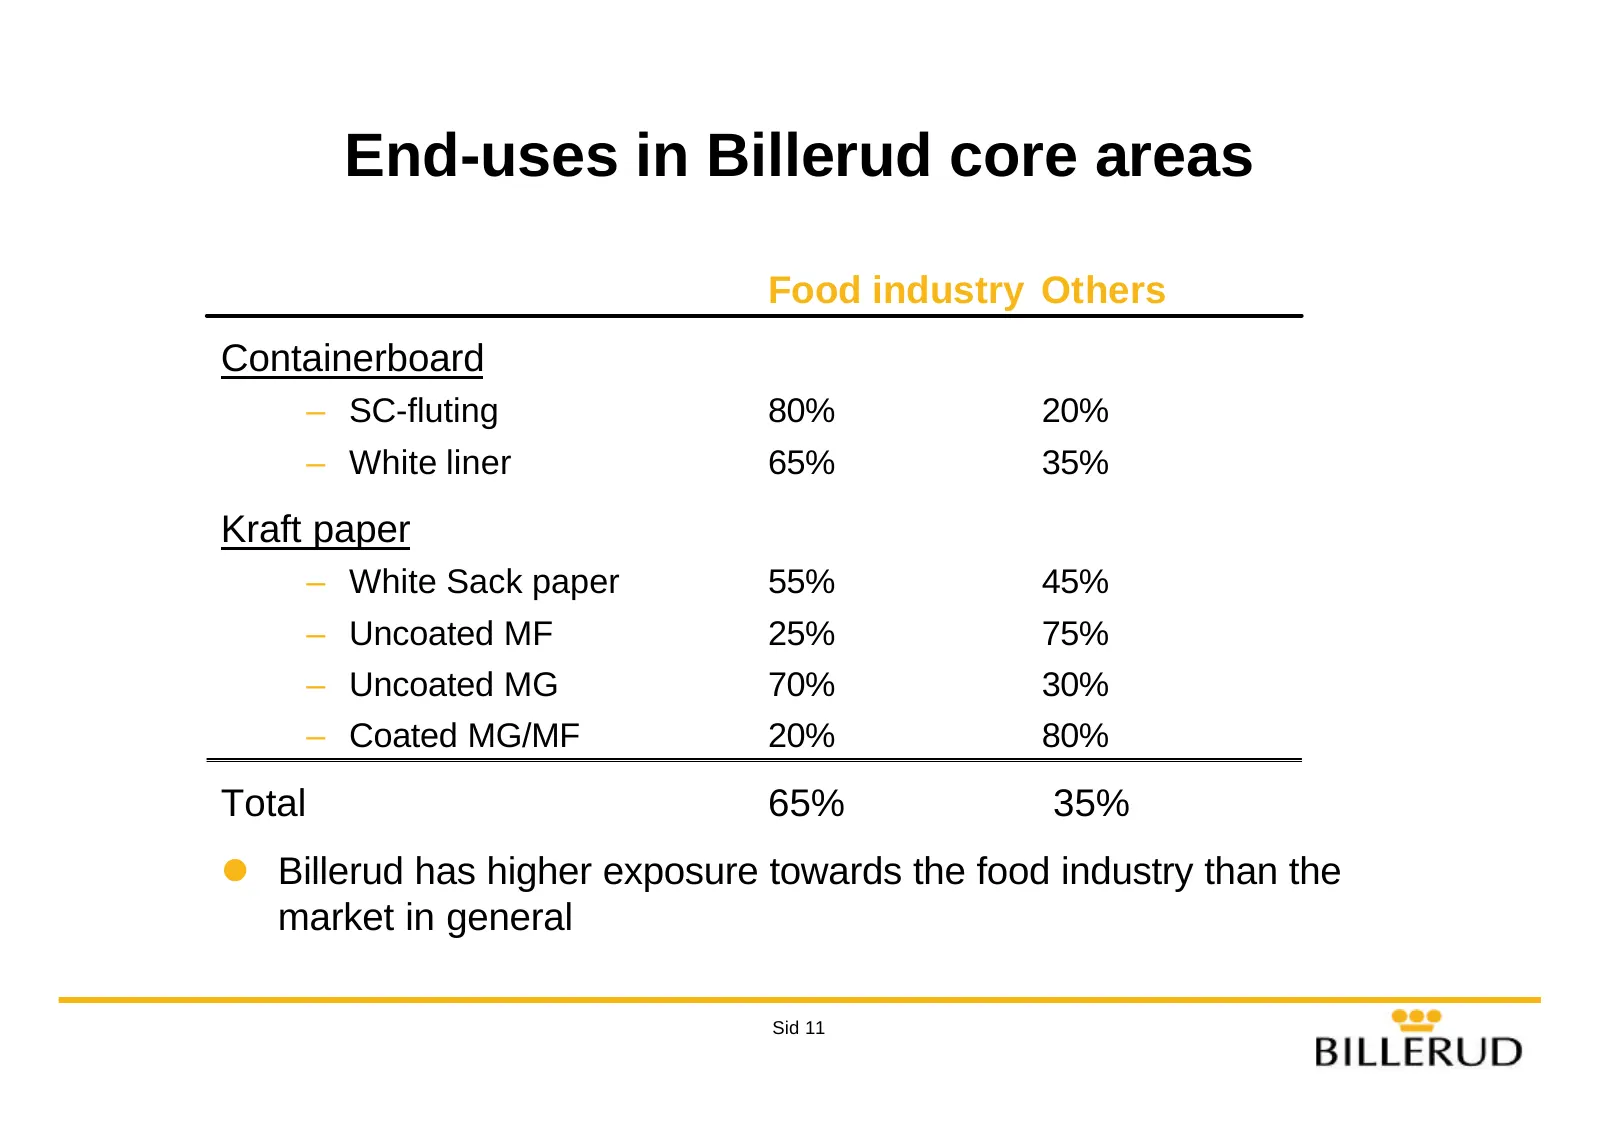
Slide 11: End-uses in Billerud core areas
End-uses in Billerud core areas Food industry Others Containerboard – SC-fluting 80% 20% – White liner 65% 35% Kraft paper – White Sack paper 55% 45% – Uncoated MF 25% 75% – Uncoated MG 70% 30% – Coated MG/MF 20% 80% Total 65% 35% l Billerud has higher exposure towards the food industry than the mar
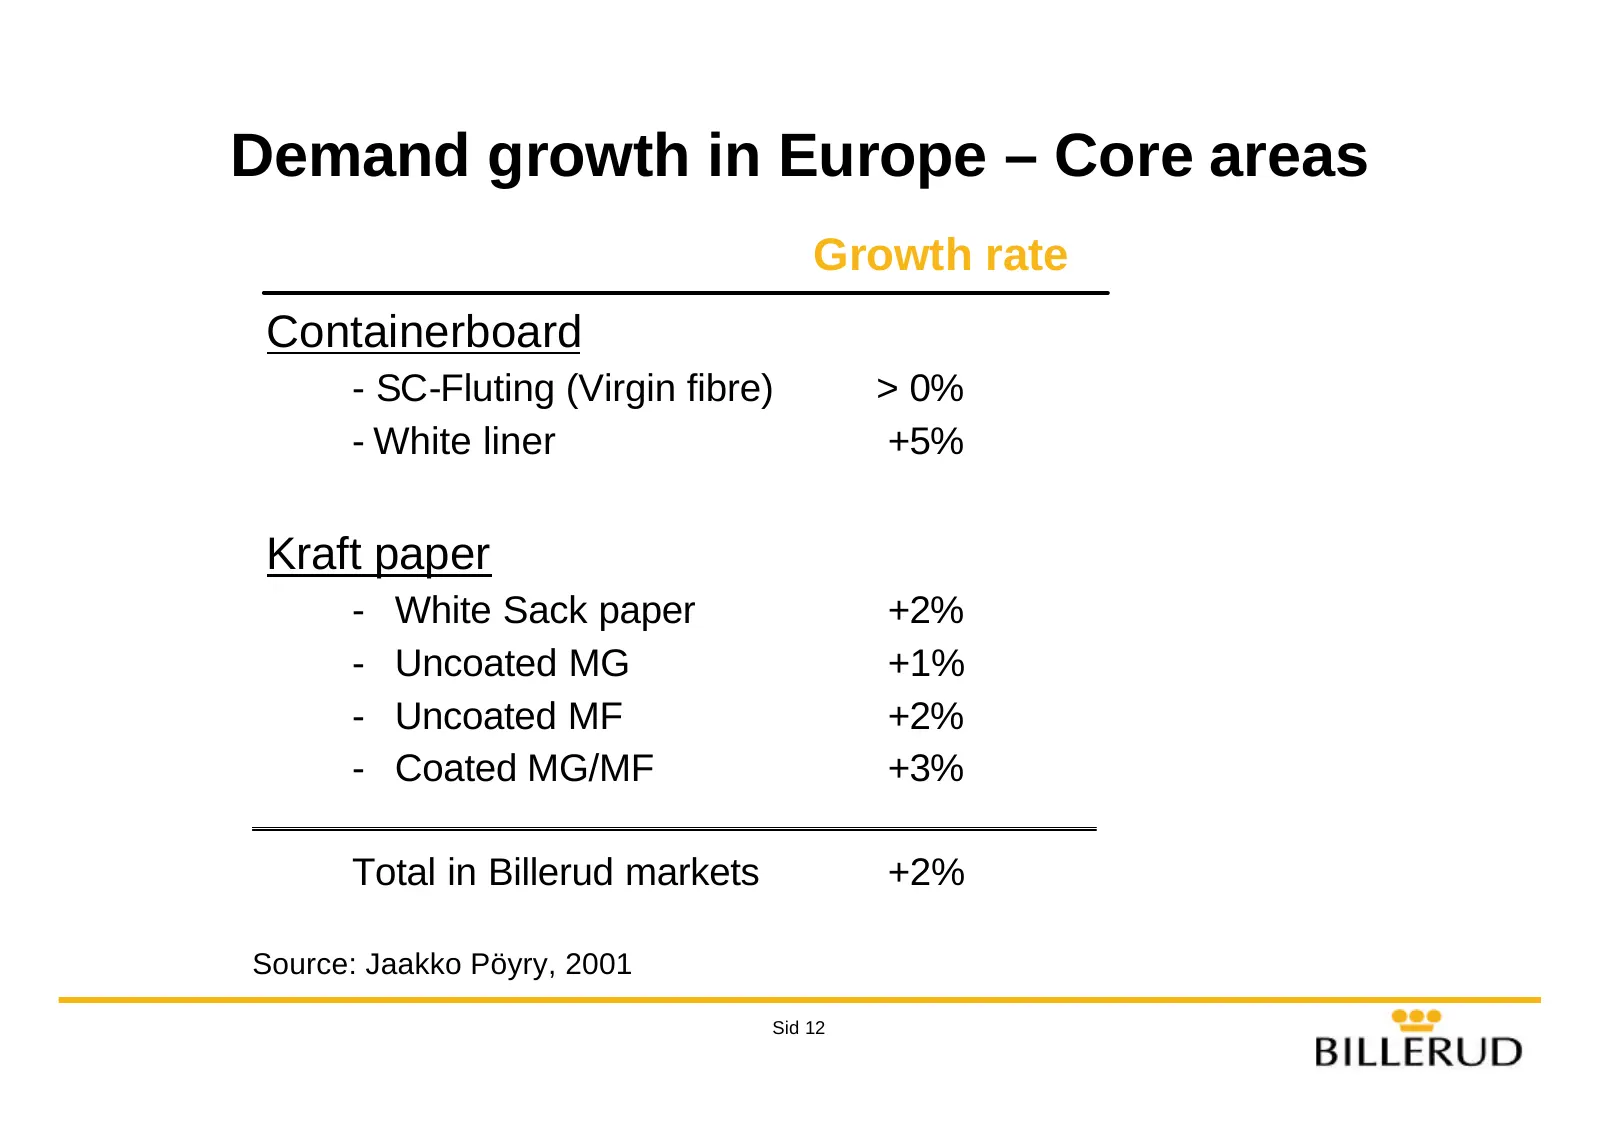
Slide 12: Demand growth in Europe – Core areas
Demand growth in Europe – Core areas Growth rate Containerboard - SC-Fluting (Virgin fibre) > 0% - White liner +5% Kraft paper - White Sack paper +2% - Uncoated MG +1% - Uncoated MF +2% - Coated MG/MF +3% Total in Billerud markets +2% Source: Jaakko Pöyry, 2001 Sid 12
Slide 13: Competitive landscape - Kraft paper
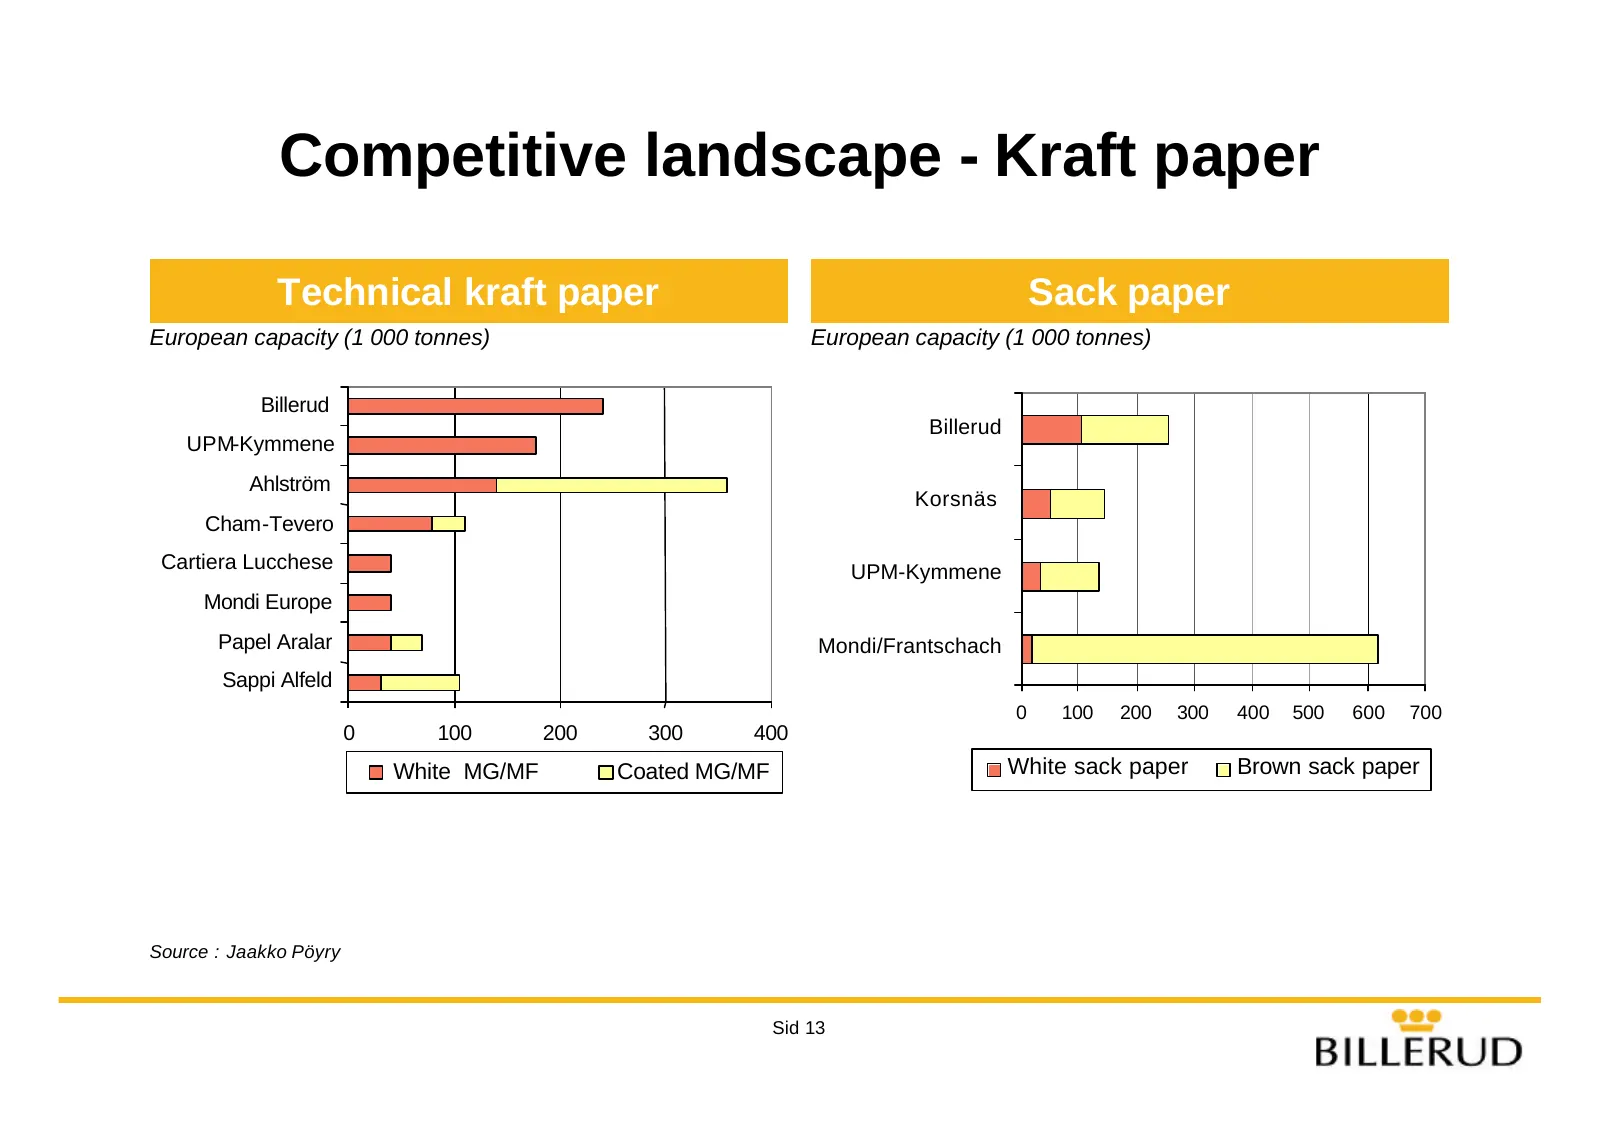
Competitive landscape - Kraft paper Technical kraft paper Sack paper European capacity (1 000 tonnes) European capacity (1 000 tonnes) Billerud Billerud UPM-Kymmene Ahlström Korsnäs Cham-Tevero Cartiera Lucchese UPM-Kymmene Mondi Europe Papel Aralar Mondi/Frantschach Sappi Alfeld 0 100 200 300 400 5
Slide 14: Competitive landscape - Containerboard
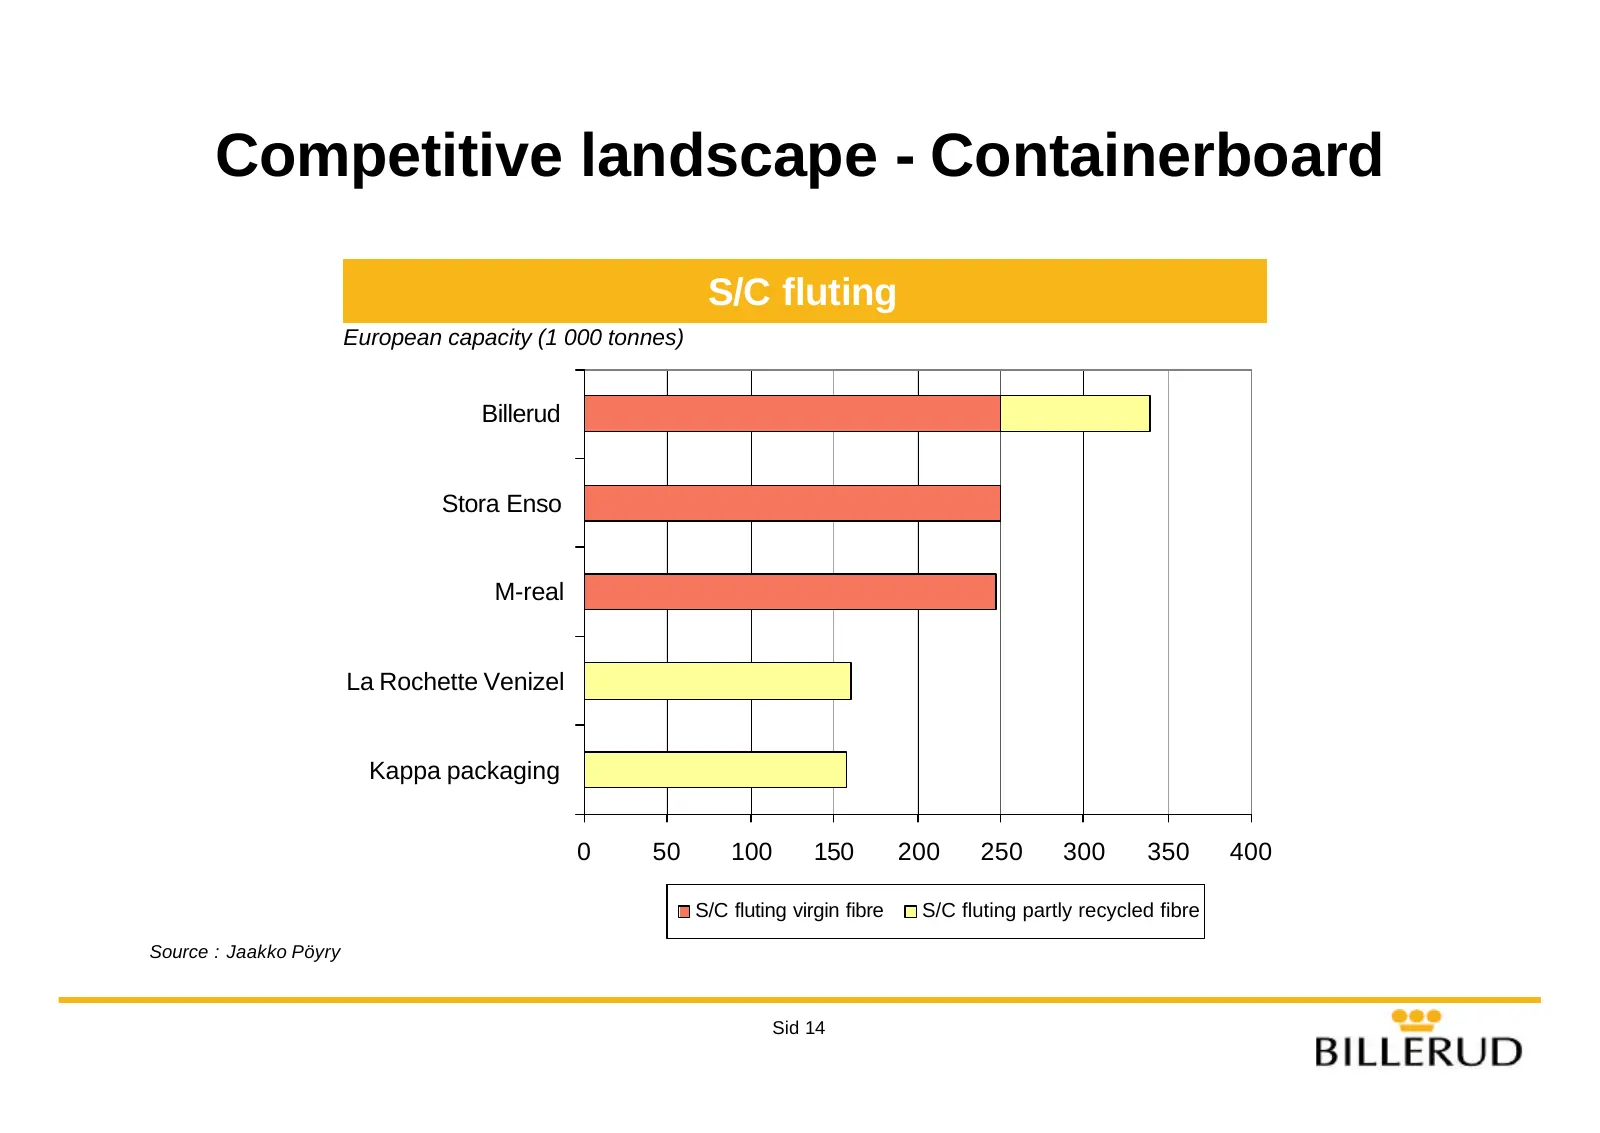
Competitive landscape - Containerboard S/C fluting European capacity (1 000 tonnes) Billerud Stora Enso M-real La Rochette Venizel Kappa packaging 0 50 100 150 200 250 300 350 400 S/C fluting virgin fibre S/C fluting partly recycled fibre Source : Jaakko Pöyry Sid 14
Slide 15: Capacity additions
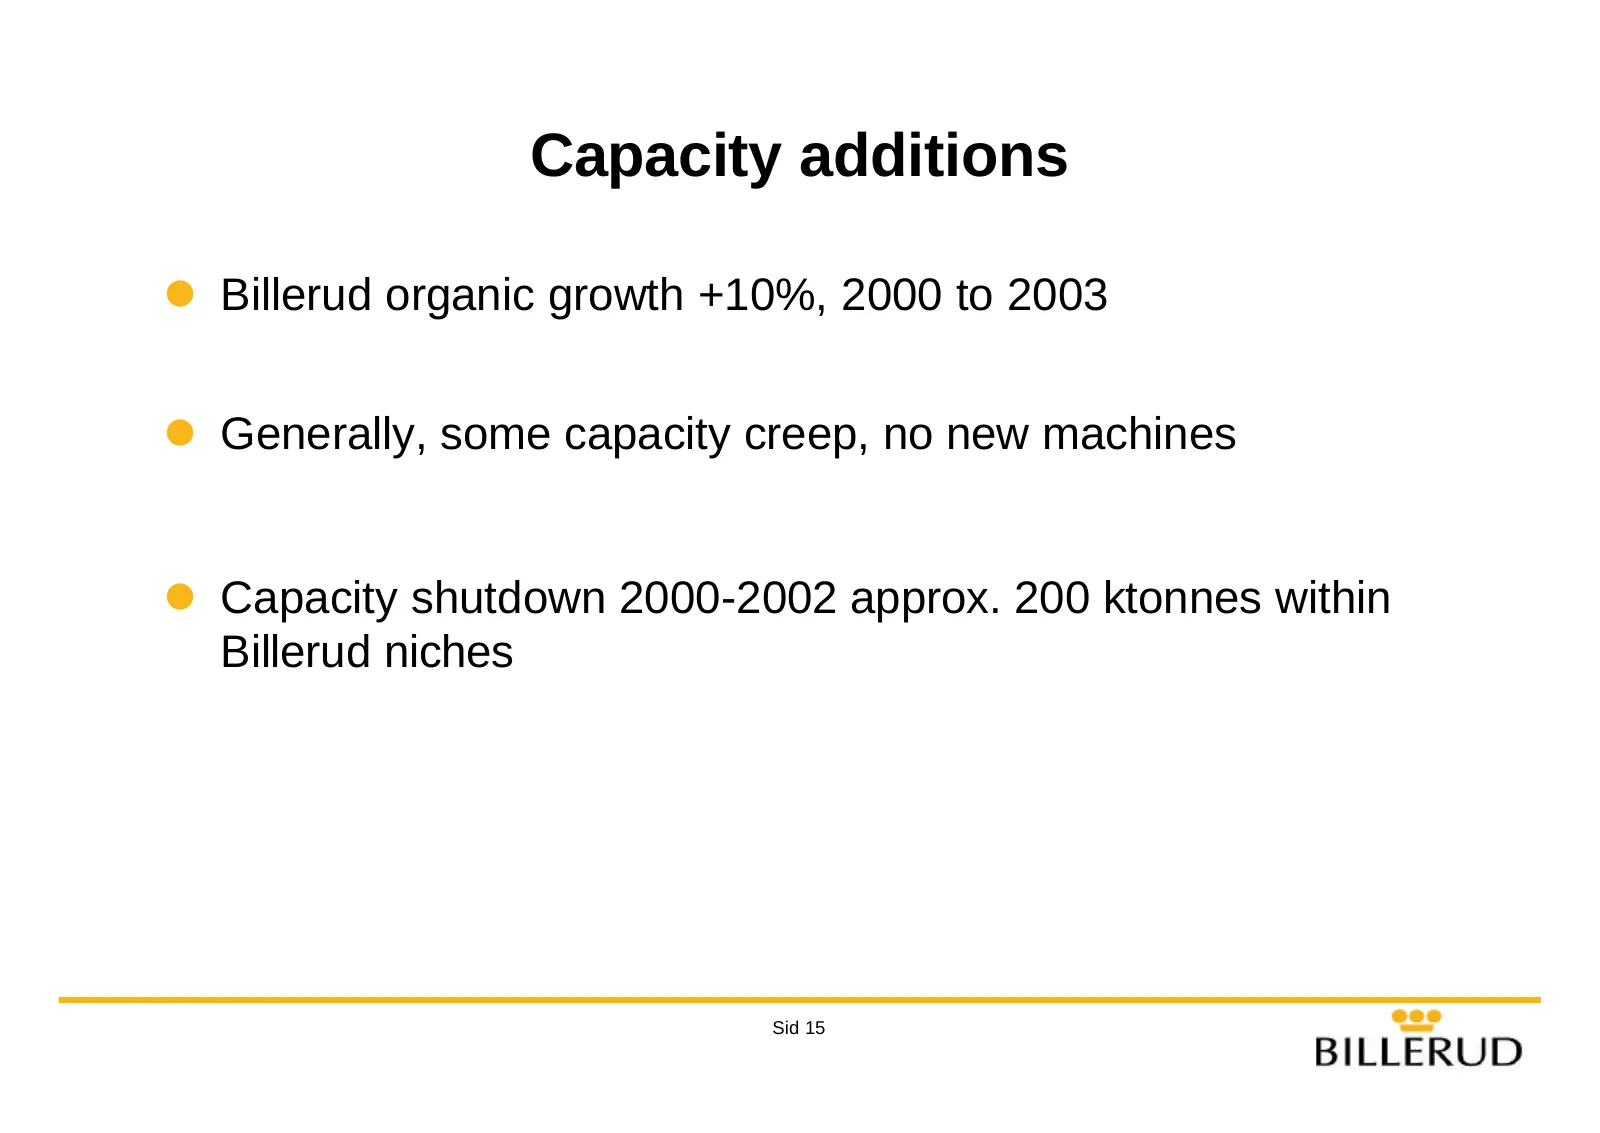
Capacity additions l Billerud organic growth +10%, 2000 to 2003 l Generally, some capacity creep, no new machines l Capacity shutdown 2000-2002 approx. 200 ktonnes within Billerud niches Sid 15
Slide 16: Competitive production
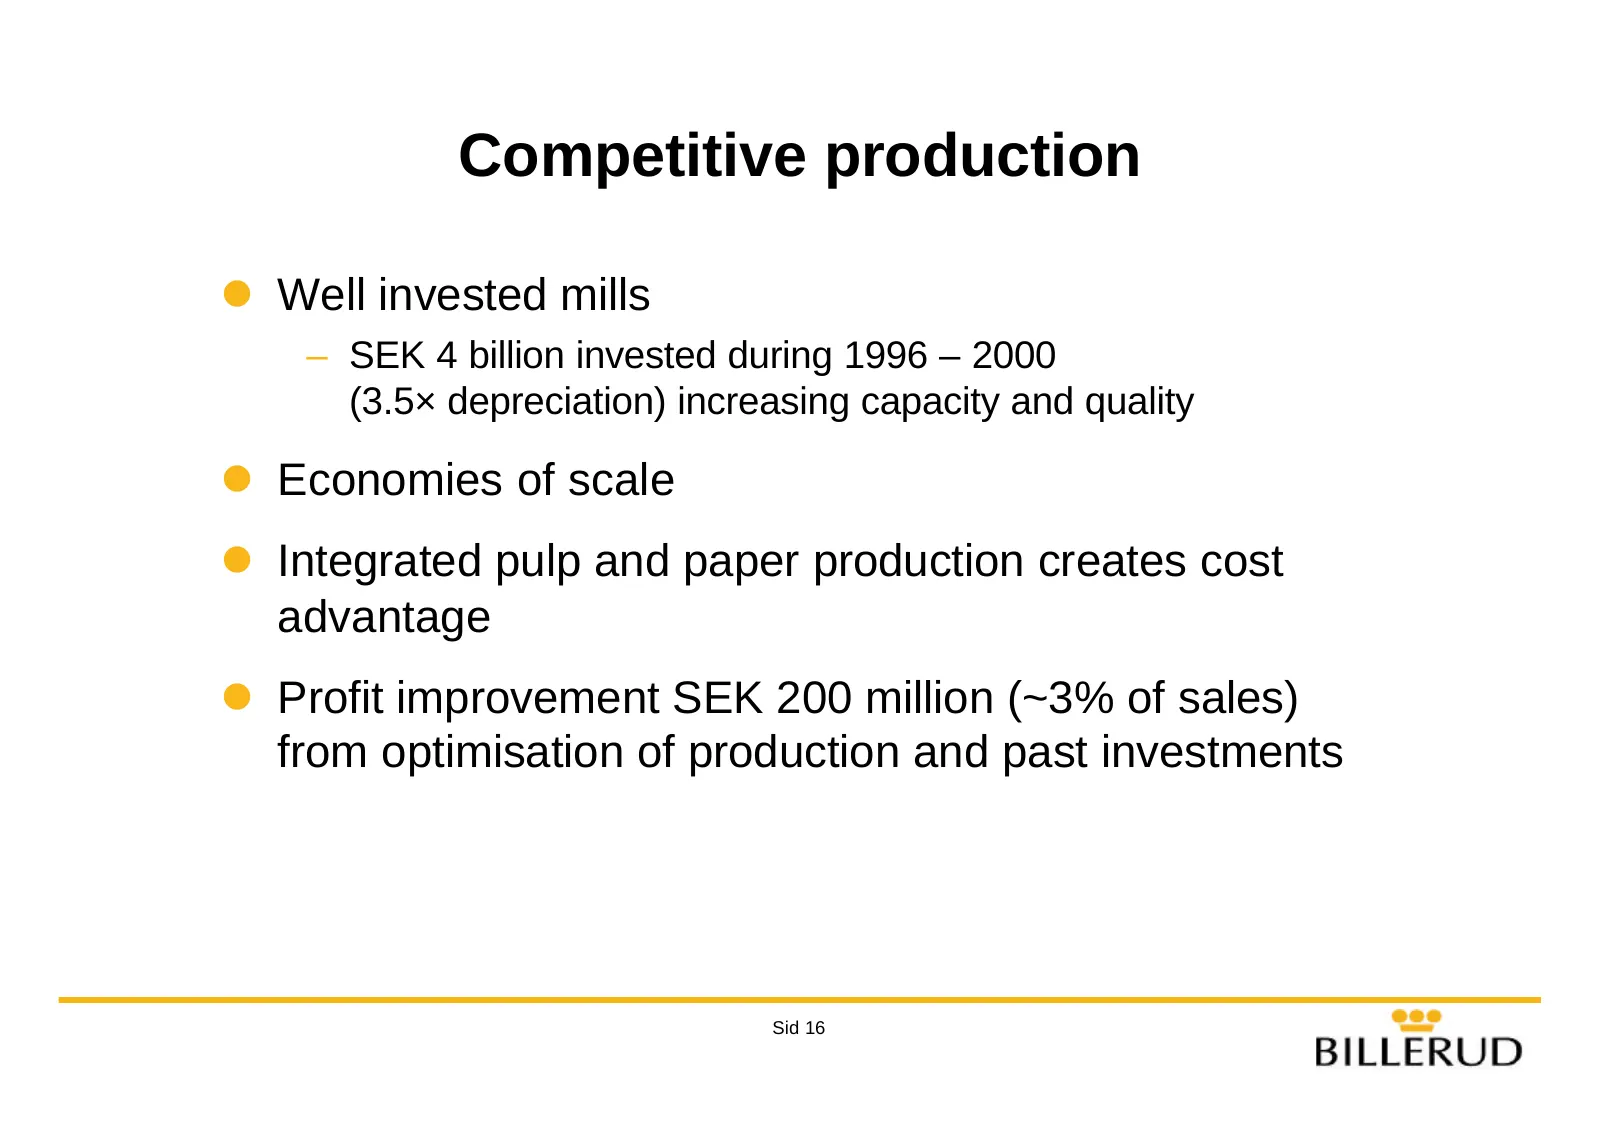
Competitive production l Well invested mills – SEK 4 billion invested during 1996 – 2000 (3.5× depreciation) increasing capacity and quality l Economies of scale l Integrated pulp and paper production creates cost advantage l Profit improvement SEK 200 million (~3% of sales) from optimisation of pro
Slide 17: Competitive cost position - mill benchmark
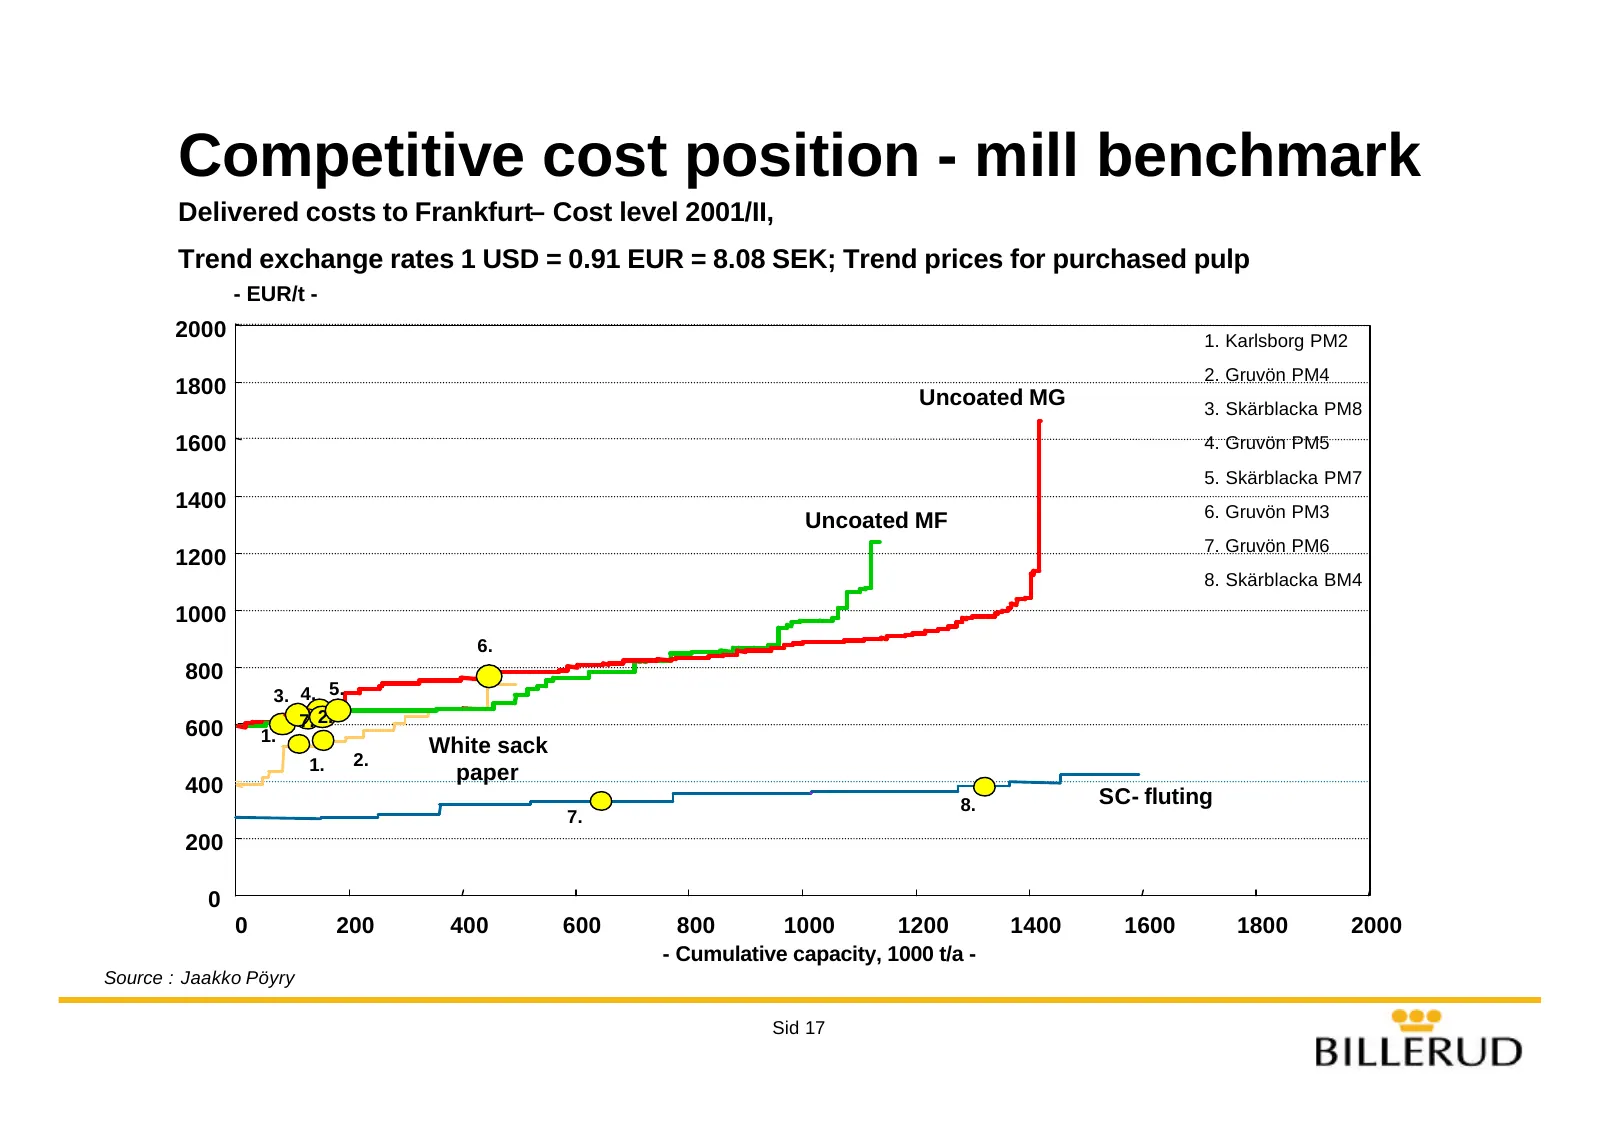
Competitive cost position - mill benchmark Delivered costs to Frankfurt– Cost level 2001/II, Trend exchange rates 1 USD = 0.91 EUR = 8.08 SEK; Trend prices for purchased pulp - EUR/t - 2000 1. Karlsborg PM2 2. Gruvön PM4 1800 Uncoated MG 3. Skärblacka PM8 1600 4. Gruvön PM5 5. Skärblacka PM7 1400 6.
Slide 18: Billerud – investment considerations
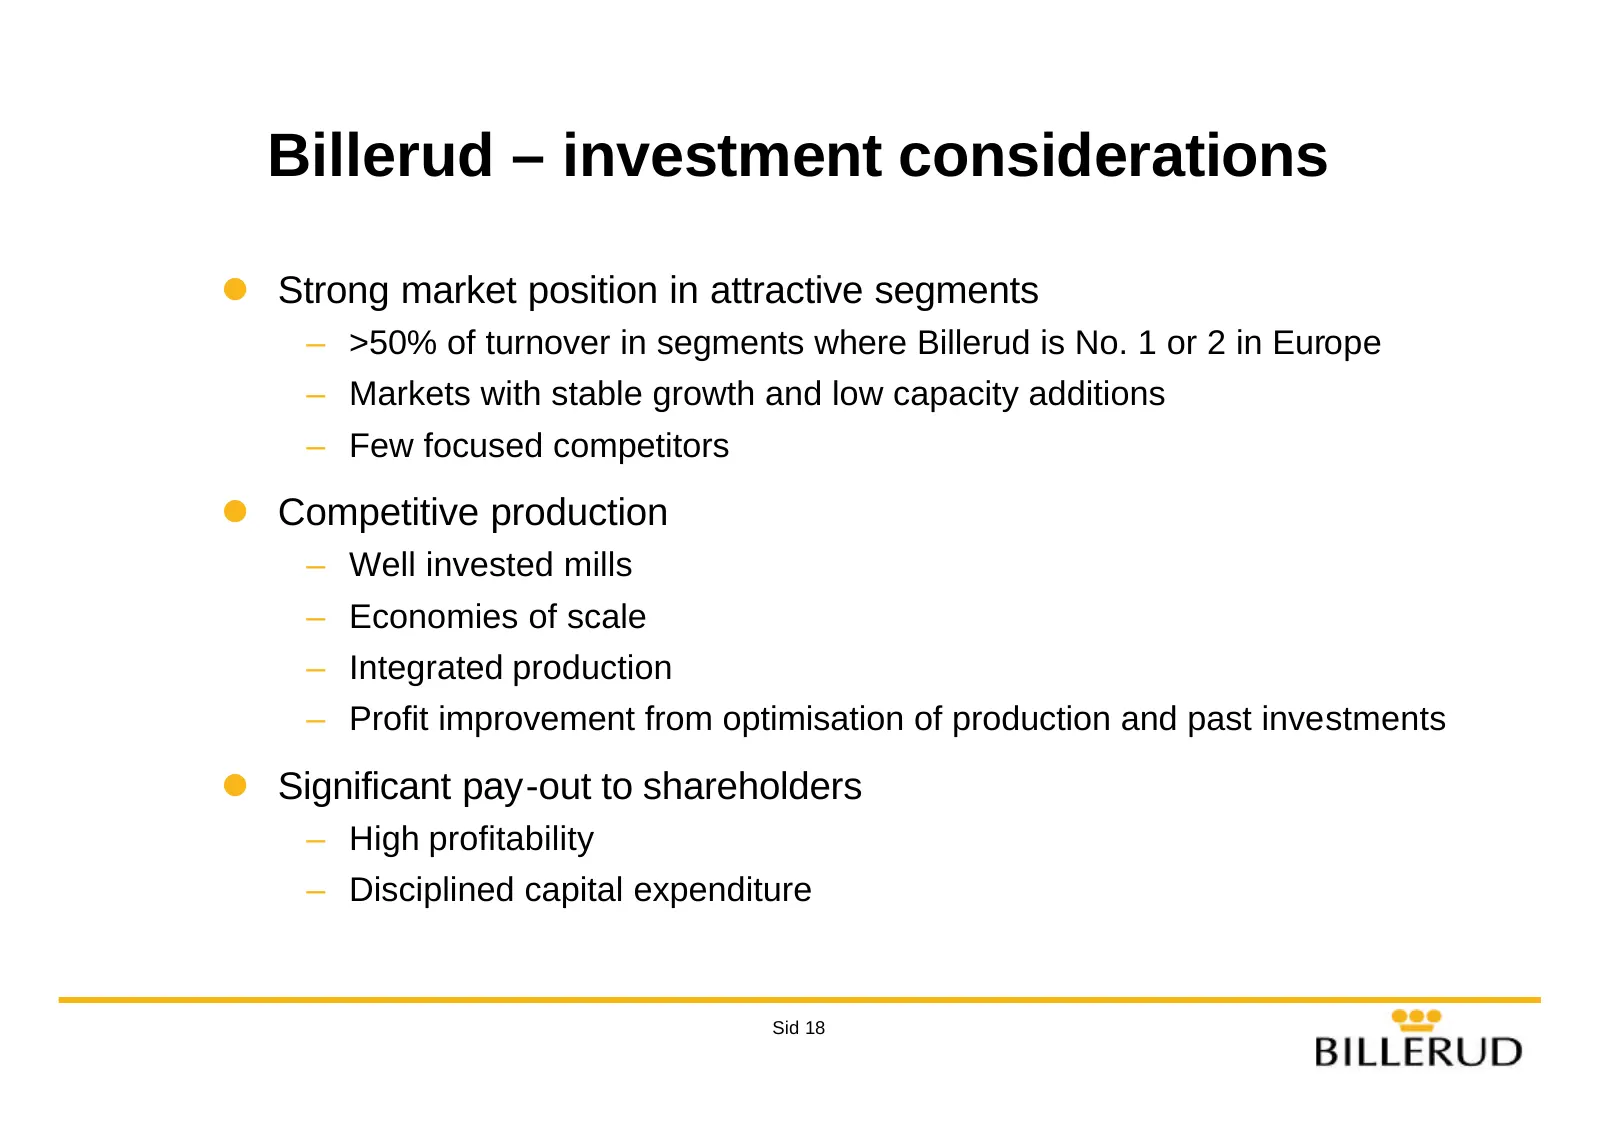
Billerud – investment considerations l Strong market position in attractive segments – >50% of turnover in segments where Billerud is No. 1 or 2 in Europe – Markets with stable growth and low capacity additions – Few focused competitors l Competitive production – Well invested mills – Economies of s
Slide 19: Financial objectives
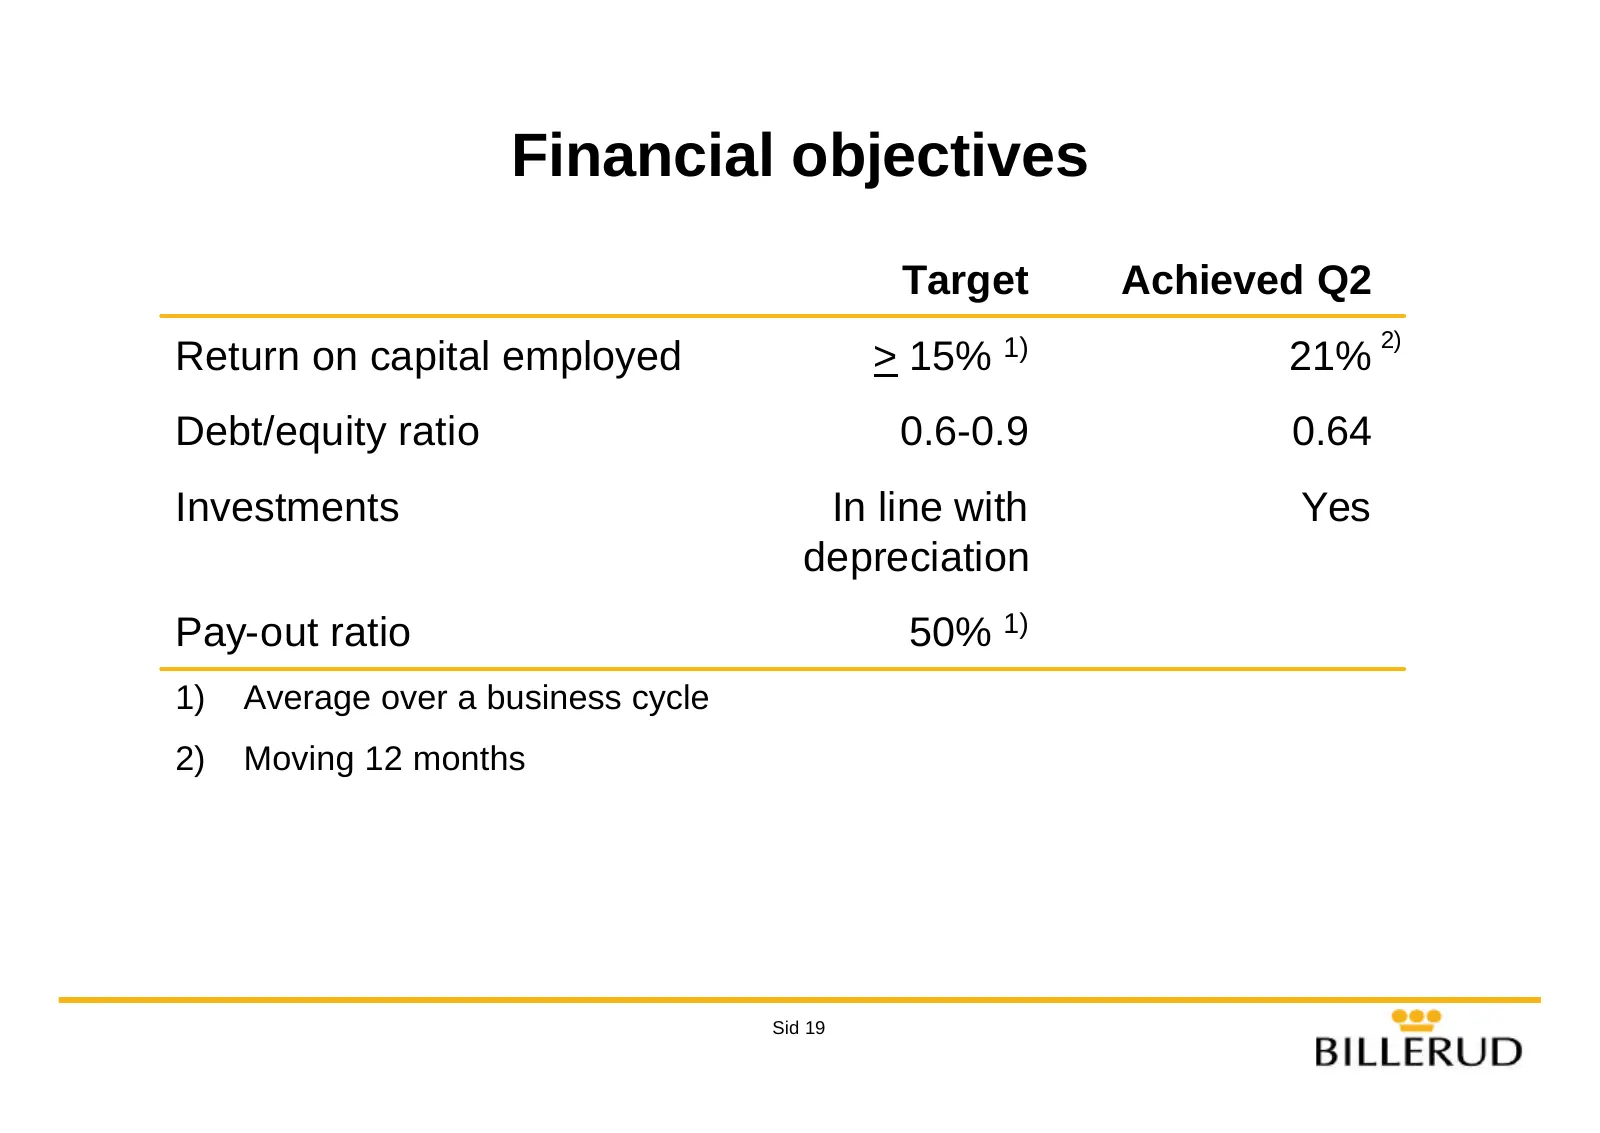
Financial objectives Target Achieved Q2 2) Return on capital employed > 15% 1) 21% Debt/equity ratio 0.6-0.9 0.64 Investments In line with Yes depreciation Pay-out ratio 50% 1) 1) Average over a business cycle 2) Moving 12 months Sid 19
Slide 20: Key figures Q2 2002
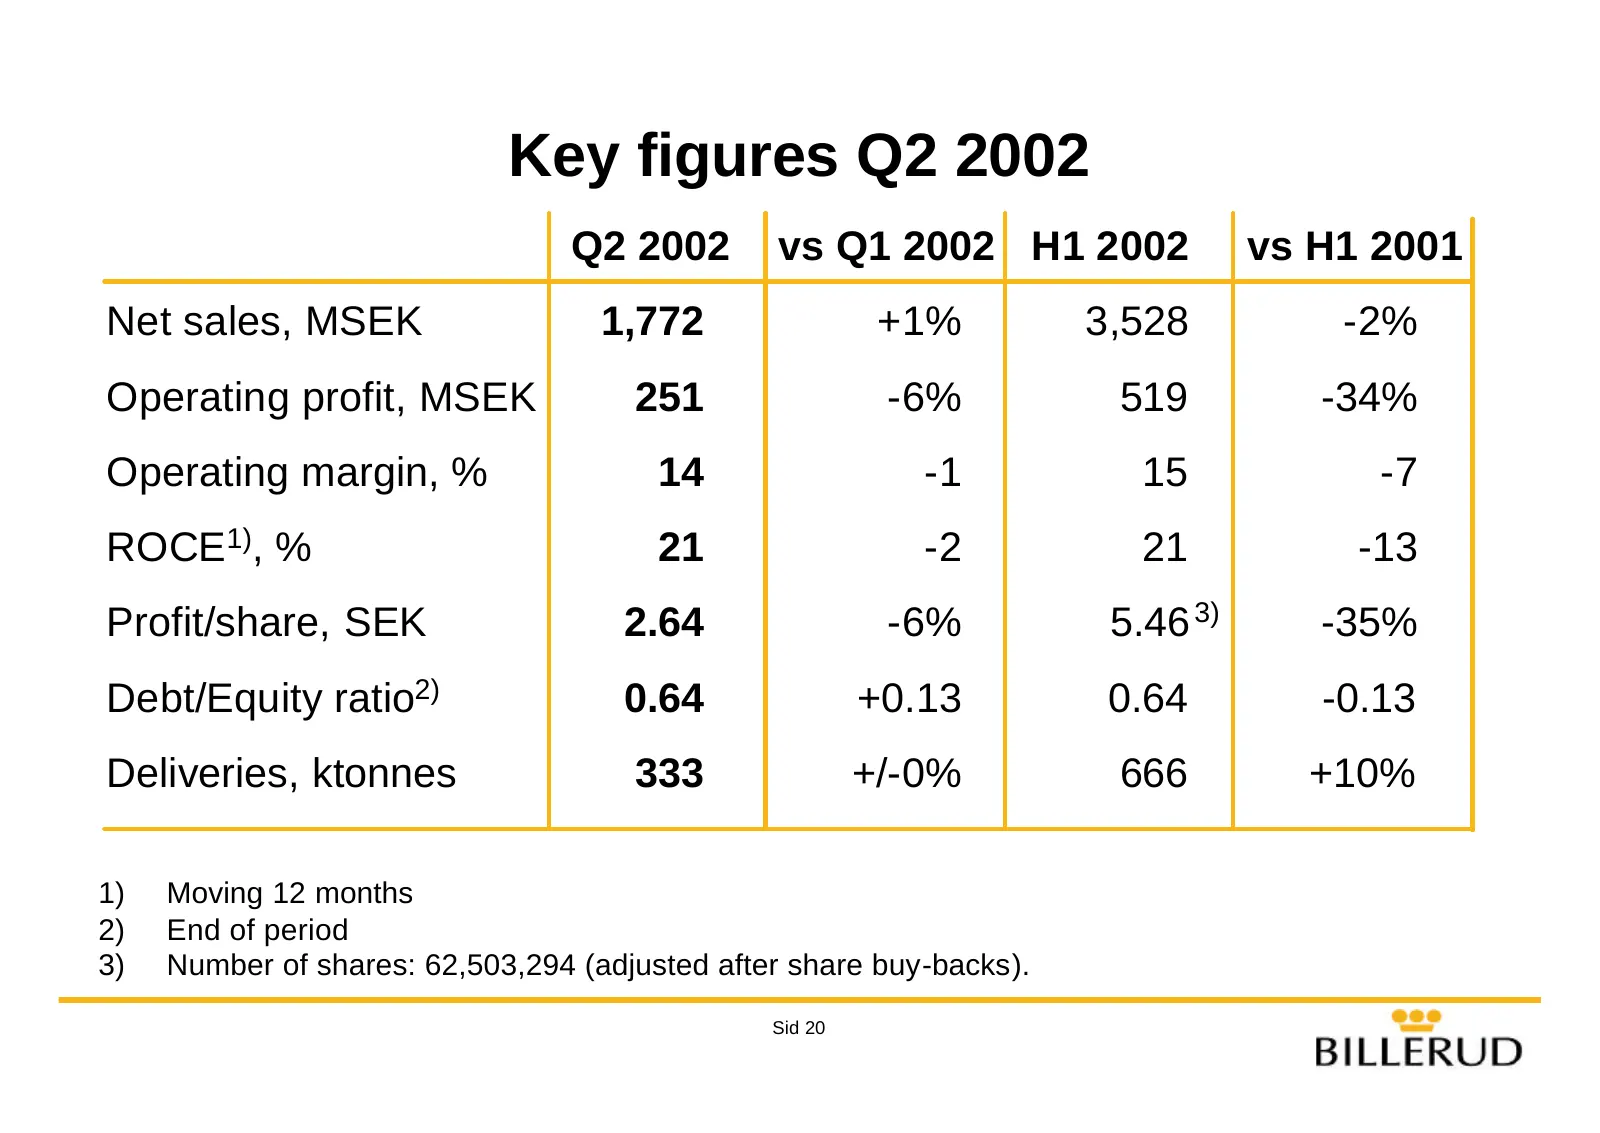
Key figures Q2 2002 Q2 2002 vs Q1 2002 H1 2002 vs H1 2001 Net sales, MSEK 1,772 +1% 3,528 -2% Operating profit, MSEK 251 -6% 519 -34% Operating margin, % 14 -1 15 -7 ROCE1), % 21 -2 21 -13 Profit/share, SEK 2.64 -6% 5.46 3) -35% Debt/Equity ratio2) 0.64 +0.13 0.64 -0.13 Deliveries, ktonnes 333 +/-0%
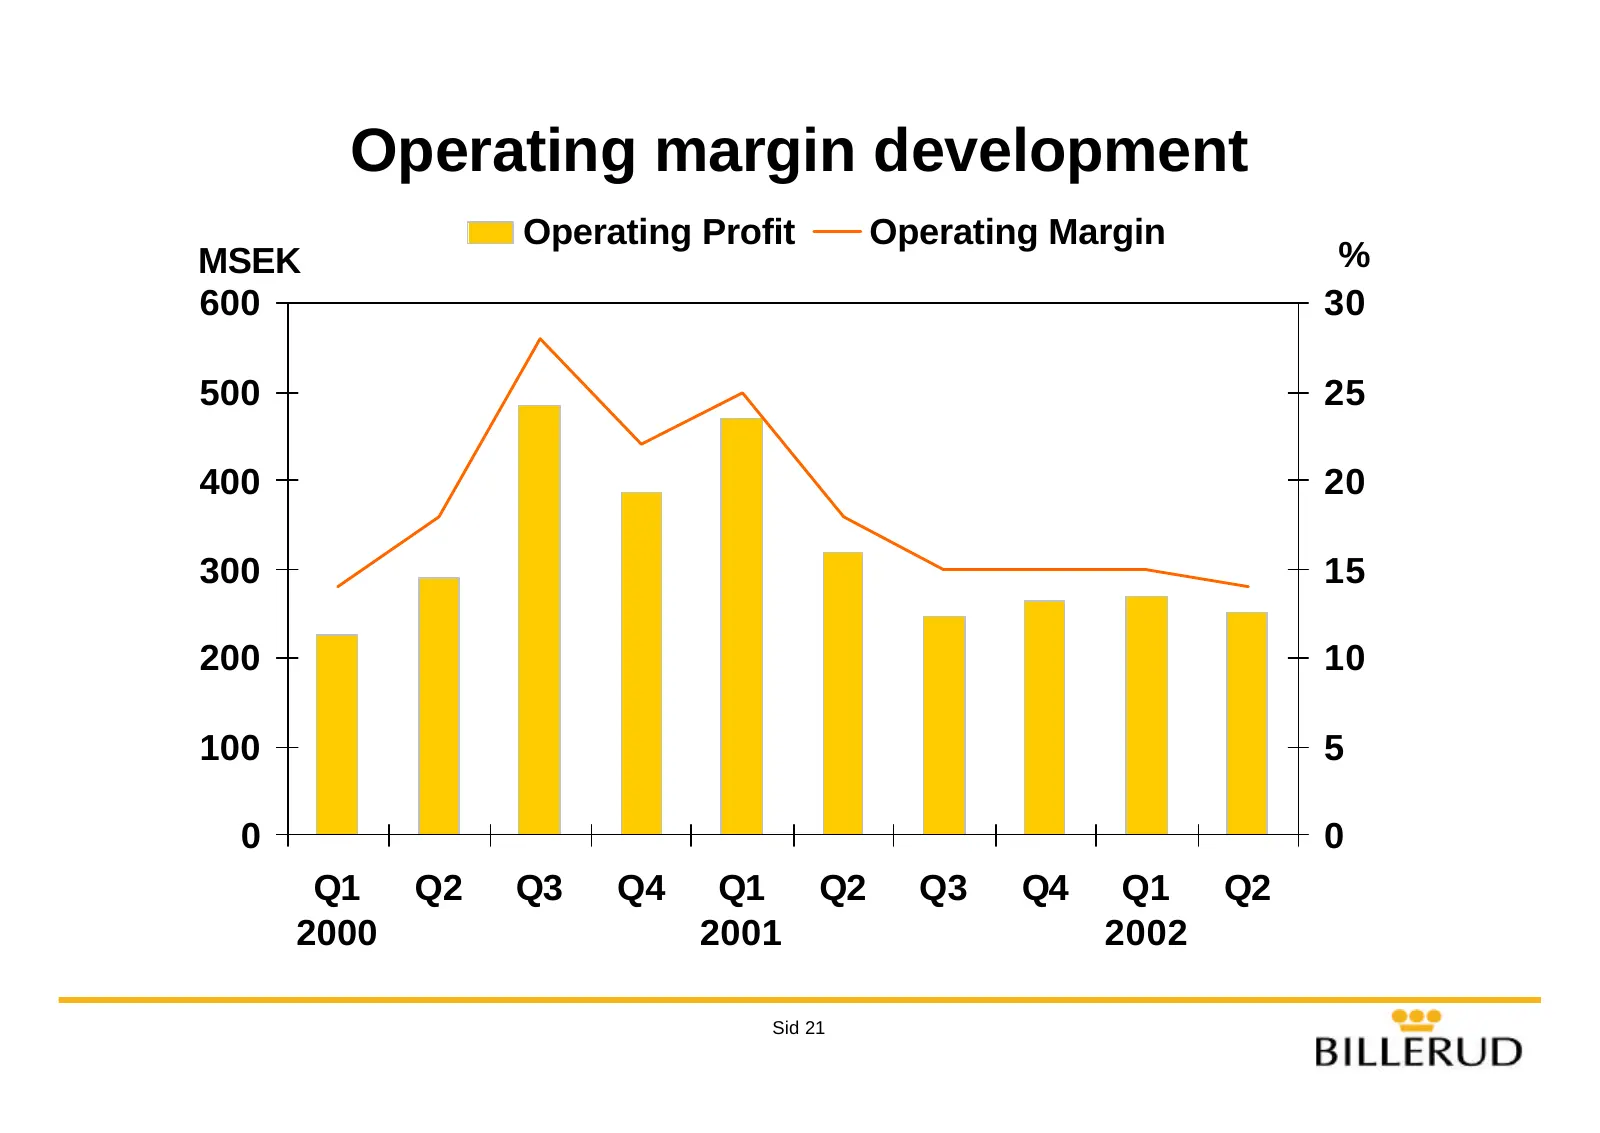
Slide 21: Operating margin development
Operating margin development Operating Profit Operating Margin MSEK % 600 30 500 25 400 20 300 15 200 10 100 5 0 0 Q1 Q2 Q3 Q4 Q1 Q2 Q3 Q4 Q1 Q2 2000 2001 2002 Sid 21
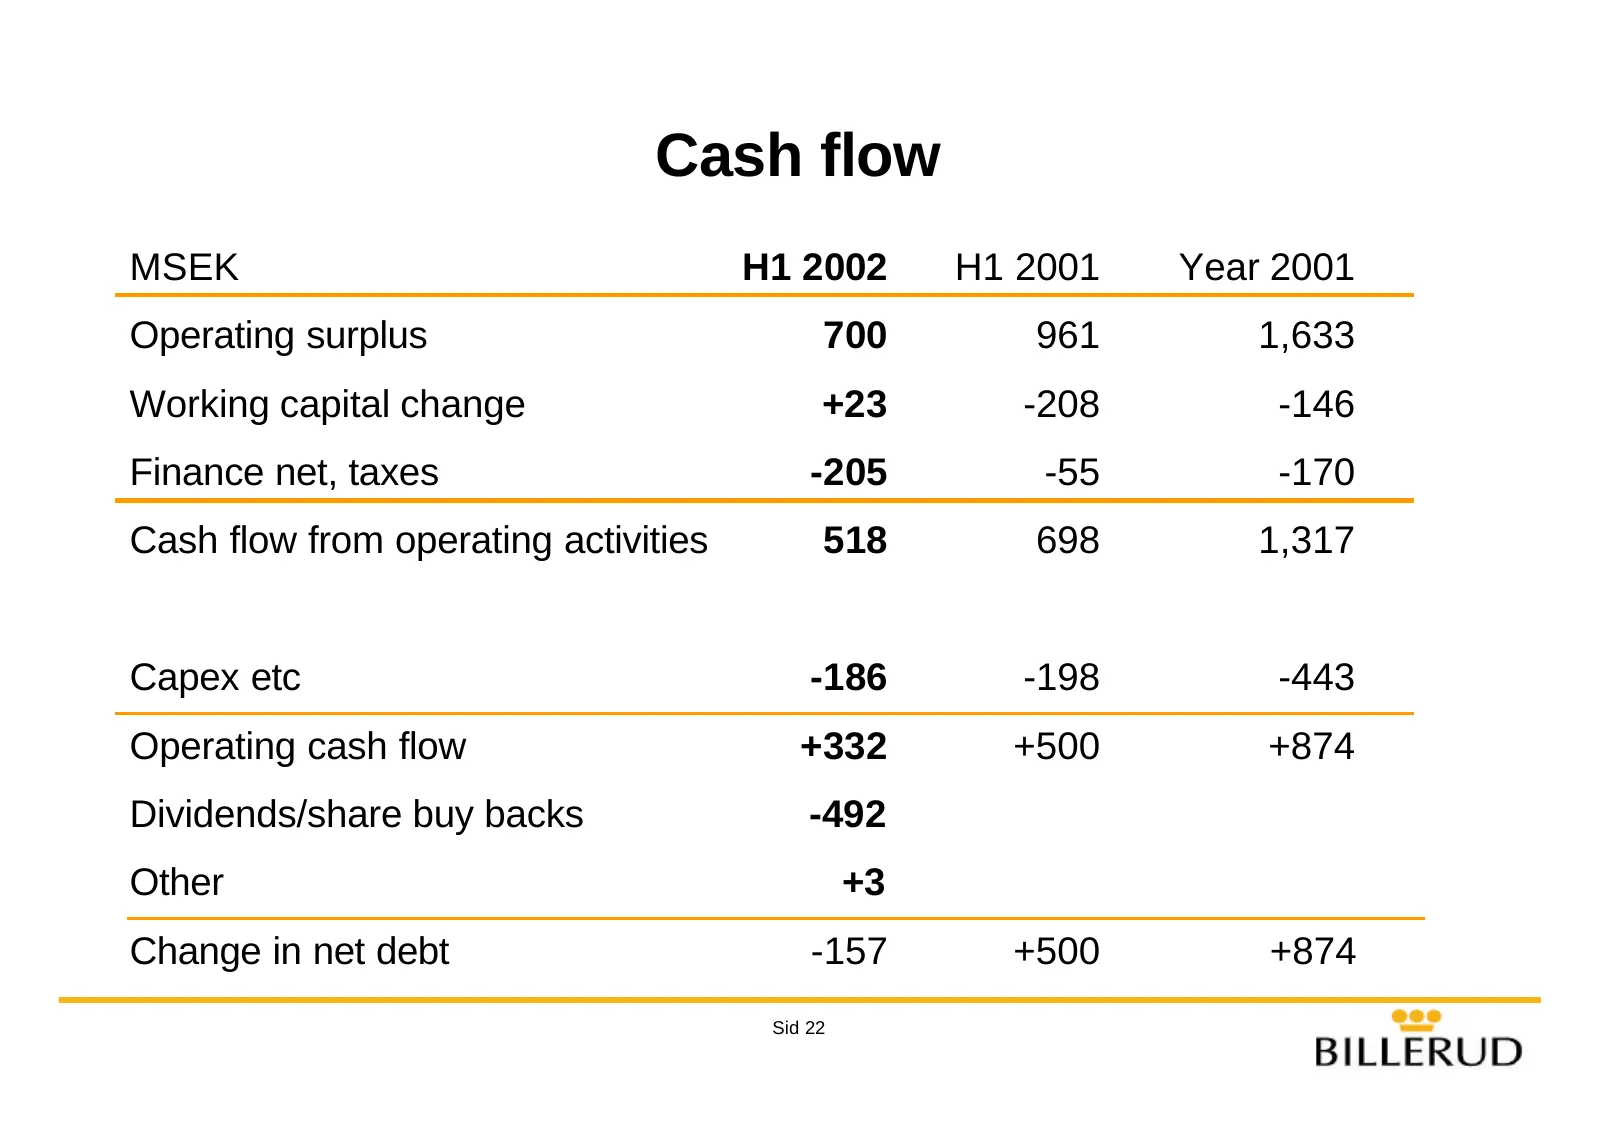
Slide 22: Cash flow
Cash flow MSEK H1 2002 H1 2001 Year 2001 Operating surplus 700 961 1,633 Working capital change +23 -208 -146 Finance net, taxes -205 -55 -170 Cash flow from operating activities 518 698 1,317 Capex etc -186 -198 -443 Operating cash flow +332 +500 +874 Dividends/share buy backs -492 Other +3 Change
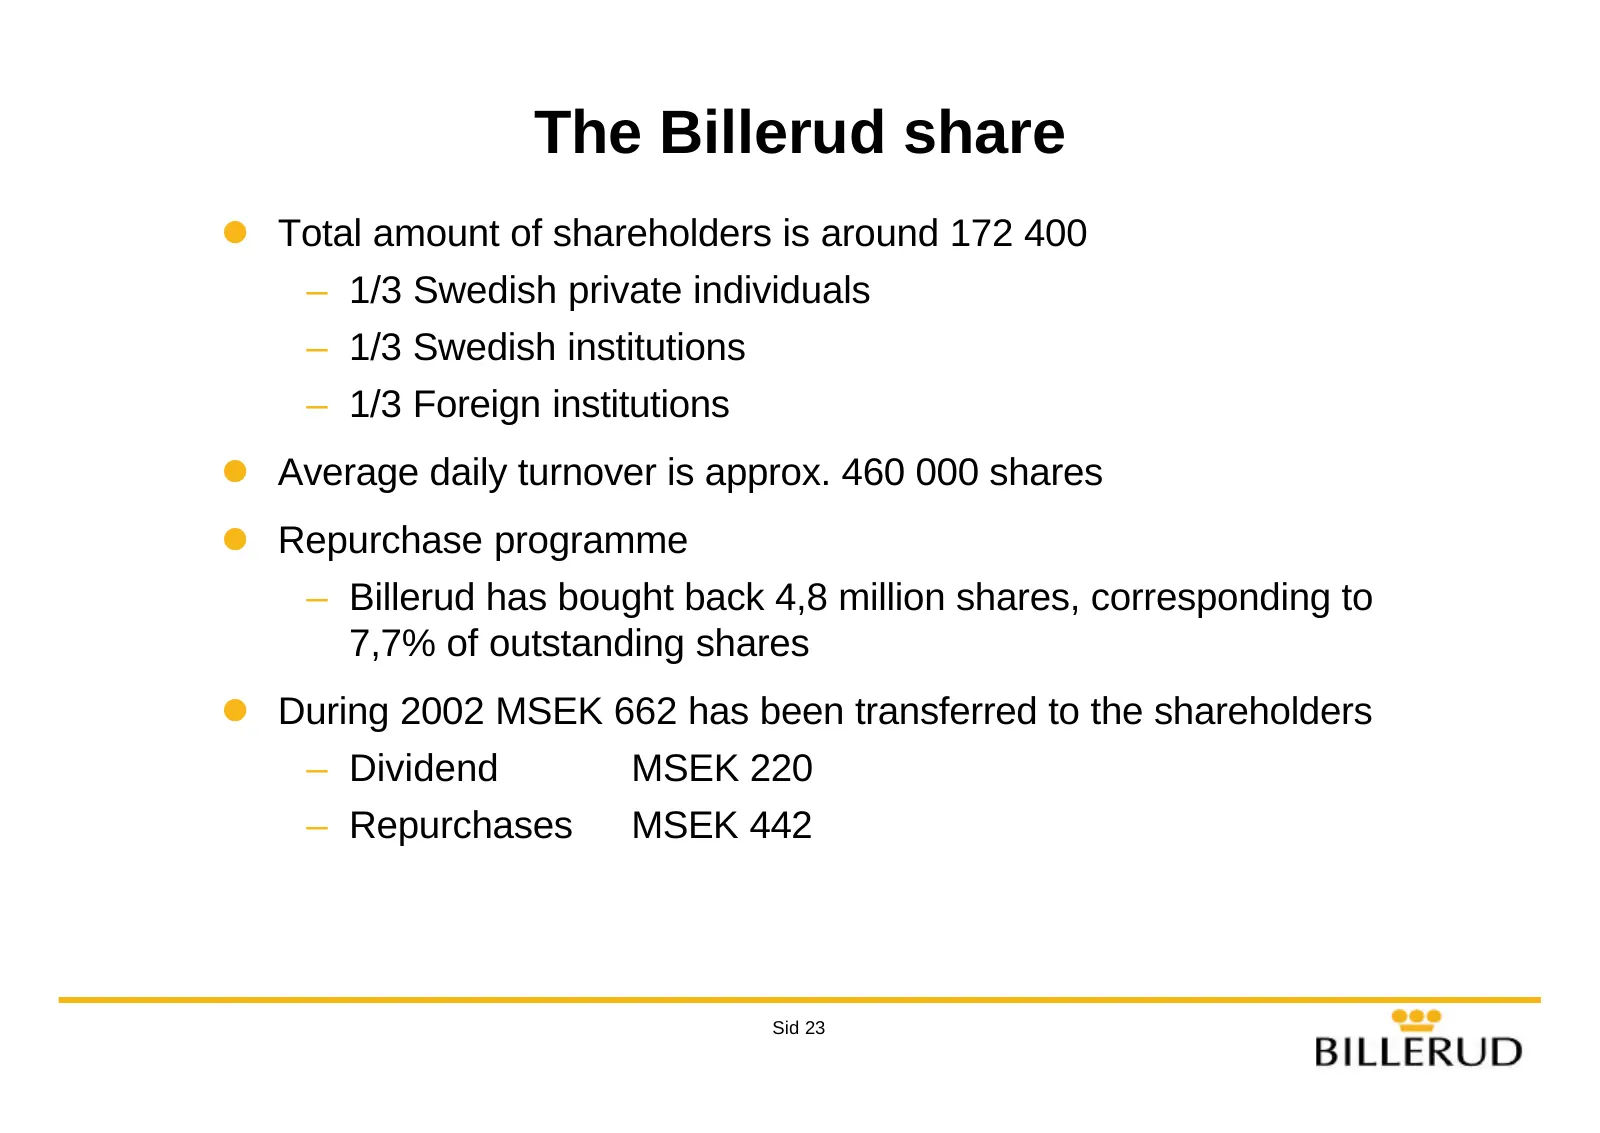
Slide 23: The Billerud share
The Billerud share l Total amount of shareholders is around 172 400 – 1/3 Swedish private individuals – 1/3 Swedish institutions – 1/3 Foreign institutions l Average daily turnover is approx. 460 000 shares l Repurchase programme – Billerud has bought back 4,8 million shares, corresponding to 7,7% o
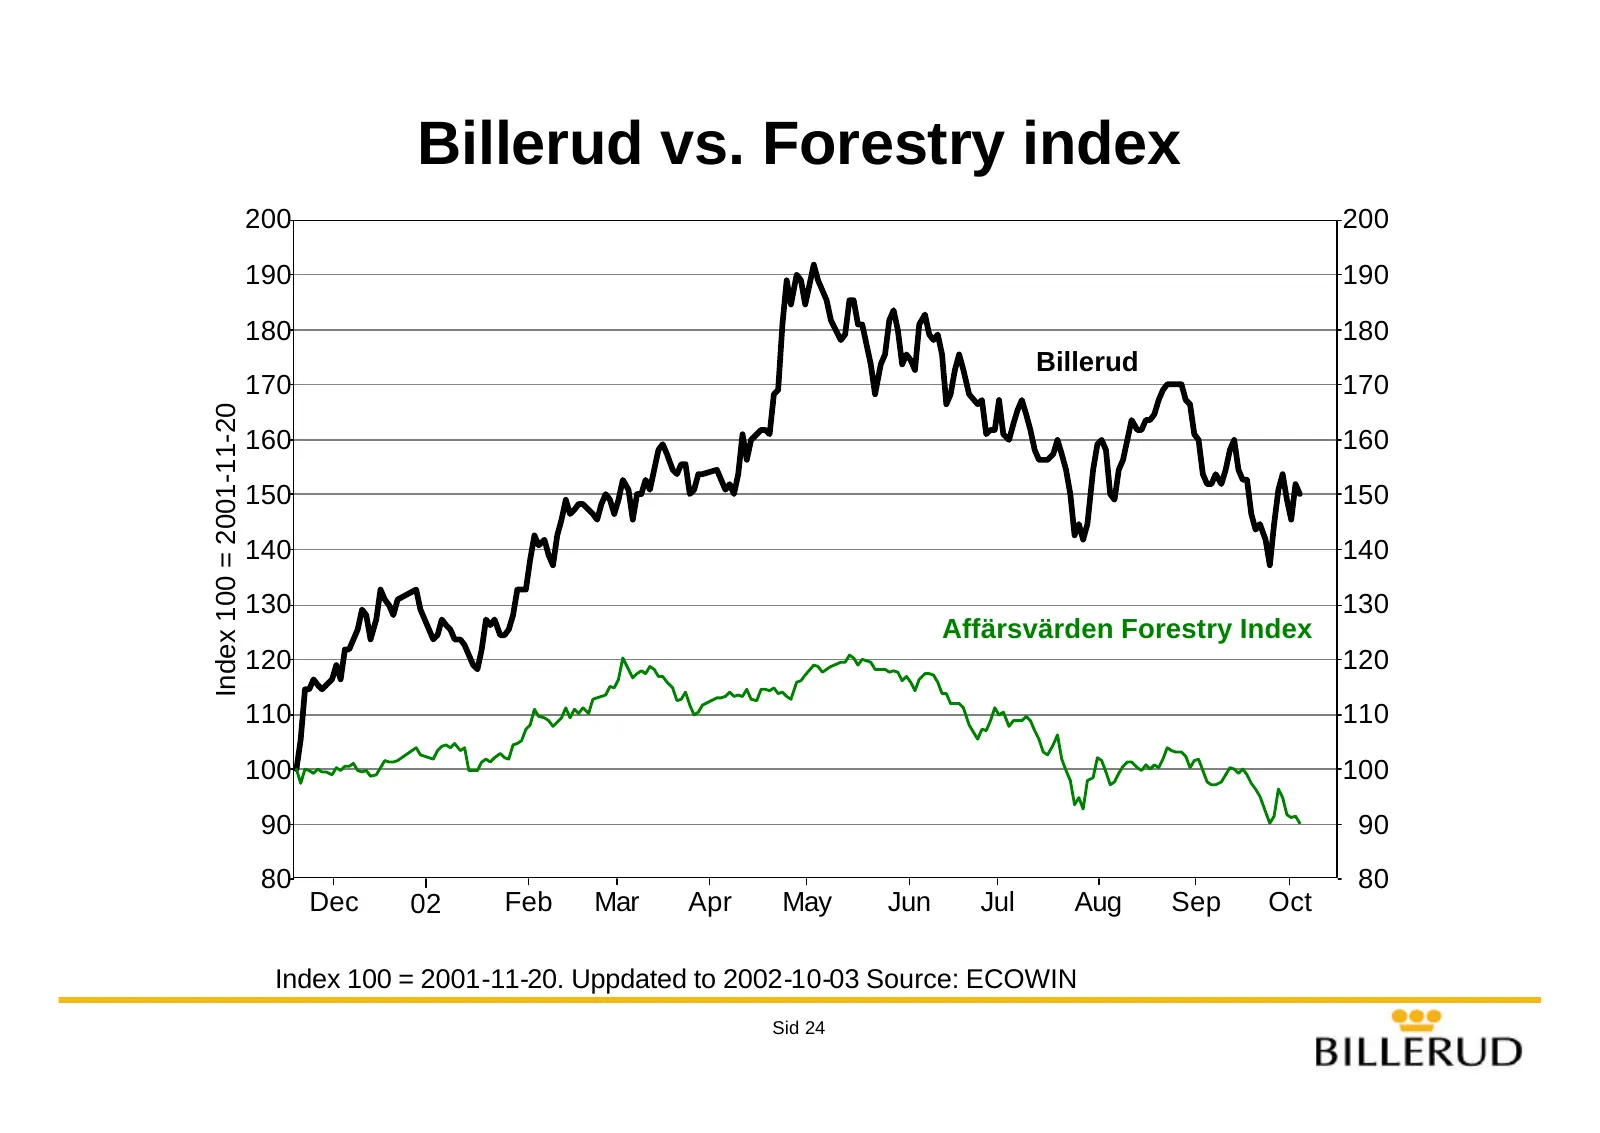
Slide 24: Billerud vs. Forestry index
Billerud vs. Forestry index 200 200 190 190 180 180 Billerud 170 170 Index 100 = 2001-11-20 160 160 150 150 140 140 130 130 Affärsvärden Forestry Index 120 120 110 110 100 100 90 90 80 80 Dec 02 Feb Mar Apr May Jun Jul Aug Sep Oct Index 100 = 2001-11-20. Uppdated to 2002-10-03 Source: ECOWIN Sid 24
Source: Internet Archive copy of billerud.se
More decks from Billerud AB
 Q3 2026 Earnings Presentation16 slides · Oct 22, 2026
 Q2 2026 Earnings Presentation17 slides · Jul 17, 2026
 Q1 2026 Earnings Presentation17 slides · Apr 28, 2026
 Q4 2025 Earnings Presentation21 slides · Jan 30, 2026
 DNB Carnegie Nordic Forest Conference 202515 slides · Nov 12, 2025
 Q3 2025 Earnings Presentation18 slides · Oct 23, 2025