Arotech — Investor Presentation (March 2015)
23 slides from Arotech's investor presentation, Mar 19, 2015
Slide 1: Introduction to Arotech - Spring 2015
SPRING 2015 INTRODUCTION TO AROTECH NASDAQ GM: ARTX —-_ WWW.AROTECH.COM AROTECH
Slide 2: Safe Harbor Statement
SAFE HARBOR STATEMENT This presentation contains forward-looking statements (within the meaning of Section 27A of the Securities Act of 1933, as amended and Section 21E of the Securities Exchange Act of 1934, as amended) regarding Arotech Corporation (Arotech) and/or its subsidiaries, (collective "t
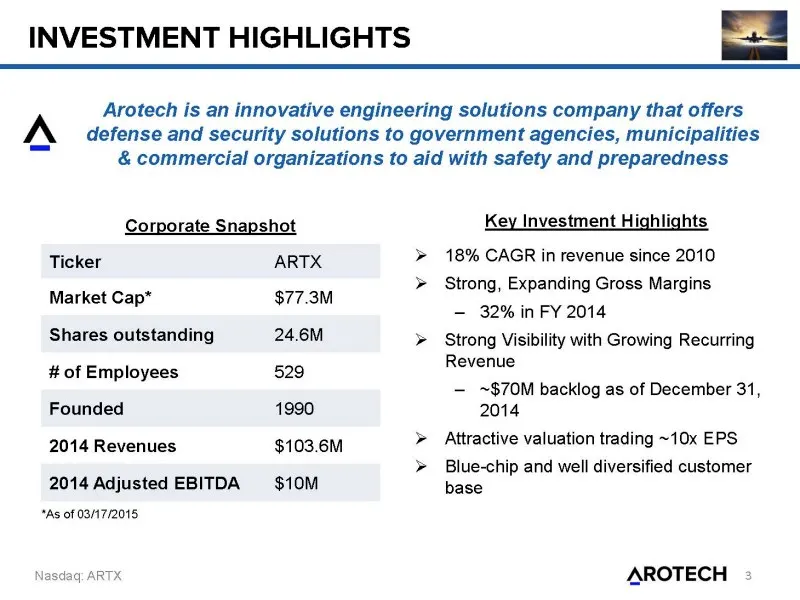
Slide 3: Investment Highlights
INVESTMENT HIGHLIGHTS Arotech is an innovative engineering solutions company that offers A defense and security solutions to government agencies, municipalities & commercial organizations to aid with safety and preparedness Corporate Snapshot Key Investment Highlights Ticker ARTX > 18% CAGR in reven
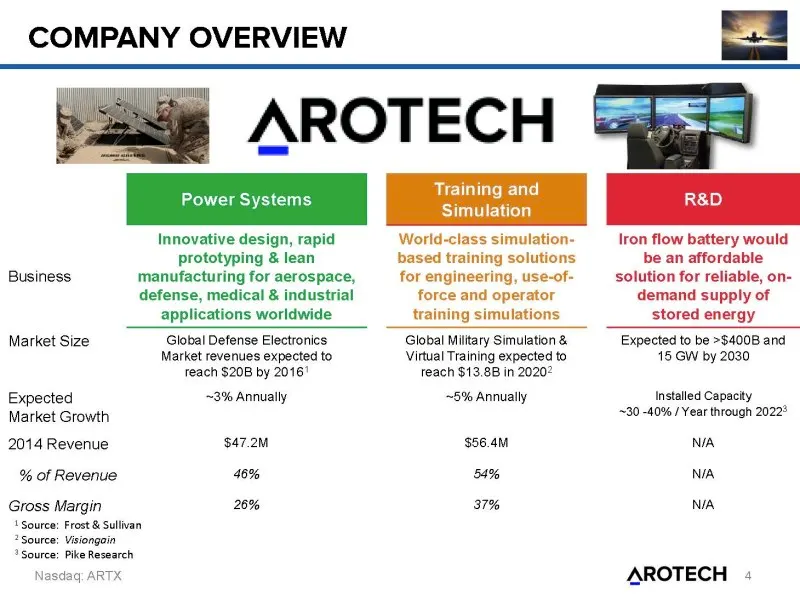
Slide 4: Company Overview
COMPANY OVERVIEW Power Systems Louder ess Simulation Innovative design, rapid World-class simulation- Iron flow battery would prototyping & lean based training solutions be an affordable Business manufacturing for aerospace, for engineering, use-of- _solution for reliable, on- defense, medical & ind
Slide 5: Key Customer Relationships
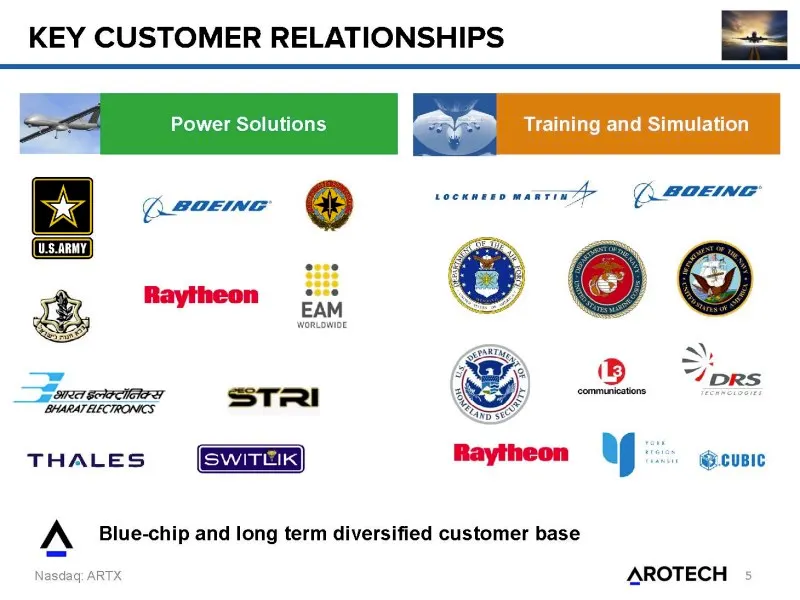
KEY CUSTOMER RELATIONSHIPS mone Qh Gewemer THALES A Blue-chip and long term diversified customer base AROTECH Nasdaq: ARTX
Slide 6: Financial Overview
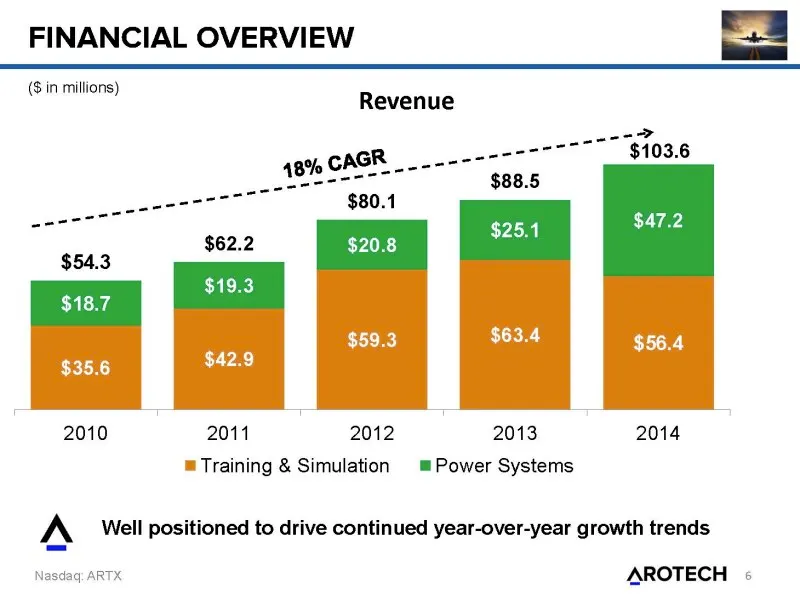
FINANCIAL OVERVIEW ($ in millions) Revenue o ref papees? 103.6 CAGR ___---- _ 18 ean $88.5 pene $80.1 : weeeree 47.2 25.1 fore $62.2 $20.8 a $19.3 $18.7 $59.3 $63.4 $56.4 $35.6 $42.9 2010 2011 2012 2013 2014 = Training & Simulation = Power Systems A Well positioned to drive continued year-over-year
Slide 7: Power Systems - Financial Overview
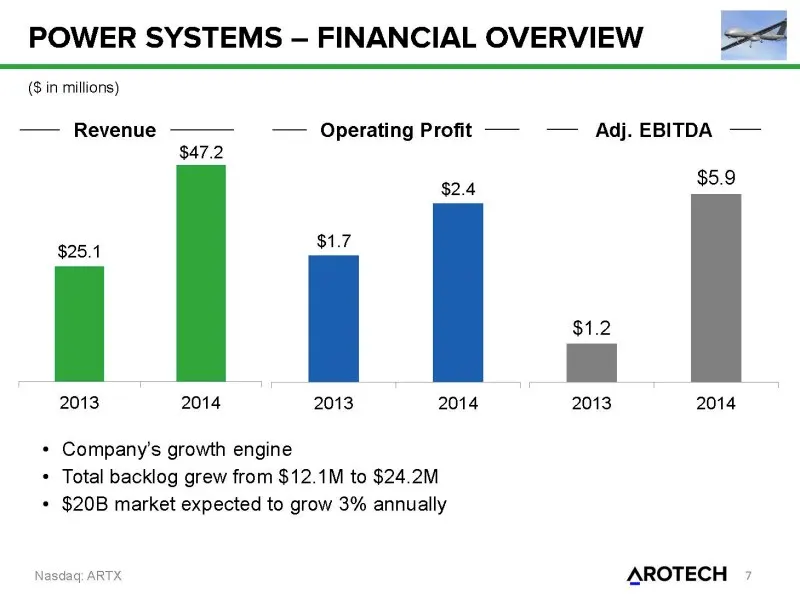
POWER SYSTEMS -— FINANCIAL OVERVIEW oat (Sin millions) —— Revenue — Operating Profit —- -— Adj. EBITDA — $47.2 $24 $5.9 $25.1 cis 2013 2014 2013 2014 2013 2014 * Company's growth engine + Total backlog grew from $12.1M to $24.2M + $20B market expected to grow 3% annually Nasdlag: ARTX AROTECH »
Slide 8: Power Systems - Overview
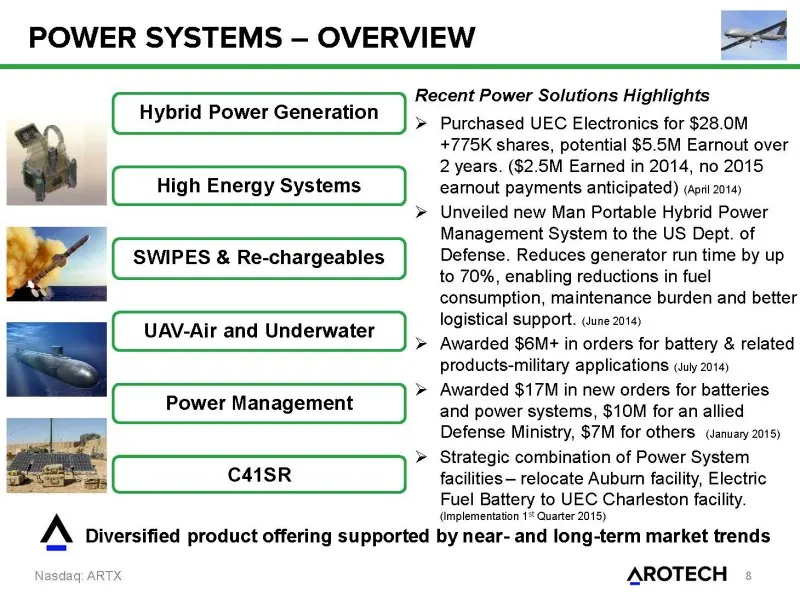
POWER SYSTEMS — OVERVIEW Hybrid Power Generation > High Energy Systems v SWIPES & Re-chargeables UAV-Air and Underwater Power Management C41SR A Diversified product offering supported Vv HN aq: ARTX Recent Power Solutions Highlights Purchased UEC Electronics for $28.0M +775K shares, potential $5.5M
Slide 9: Power Systems - Products
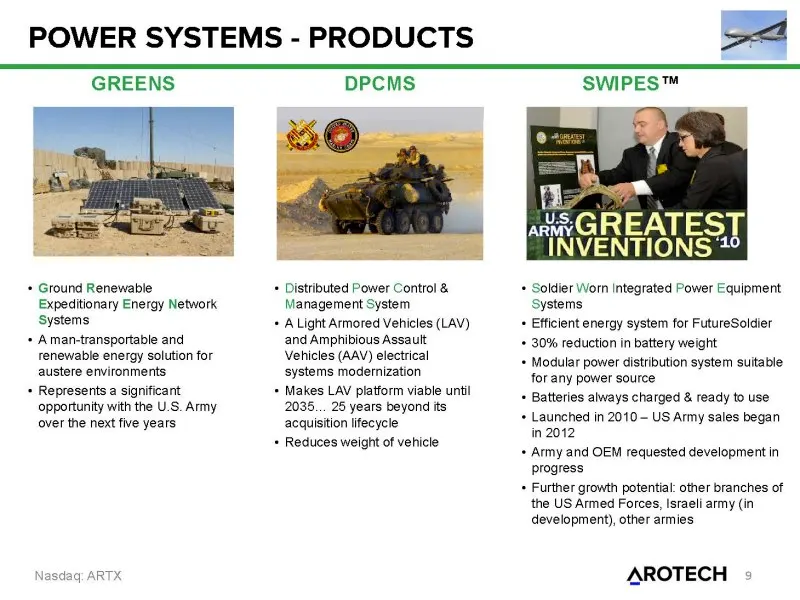
POWER SYSTEMS - PRODUCTS a] GREENS DPCMS SWIPES™ ae te GREATEST INVENTIONS 2° + Ground Renewable + Distributed Power Control & + Soldier Worn integrated Power Equipment Expeditionary Energy Network Management System Systems ‘Systems * A Light Armored Vehicles (LAV) + Efficient energy system for Futu
Slide 10: Power Systems - Growth Engines
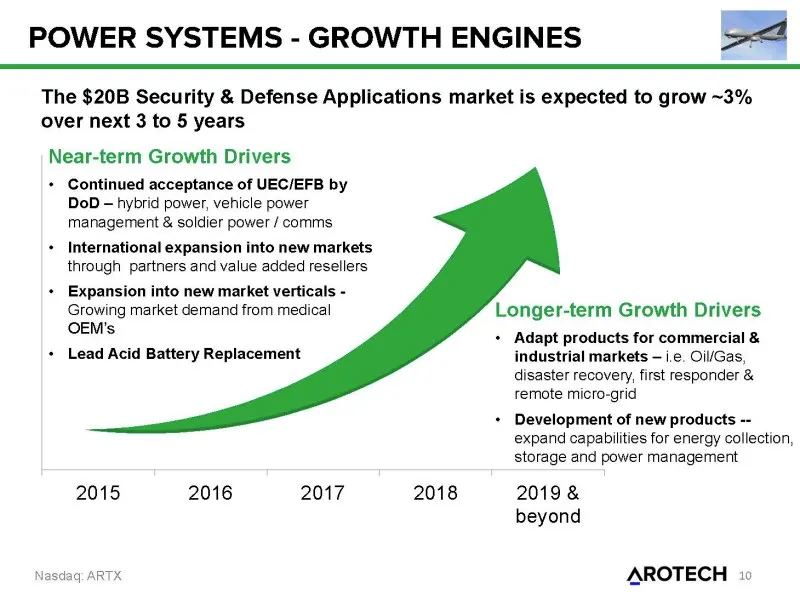
POWER SYSTEMS - GROWTH ENGINES | The $20B Security & Defense Applications market is expected to grow ~3% over next 3 to 5 years Near-term Growth Drivers + Continued acceptance of UEC/EFB by DoD — hybrid power, vehicle power management & soldier power / comms + International expansion into new market
Slide 11: Training & Simulation - Financial Overview
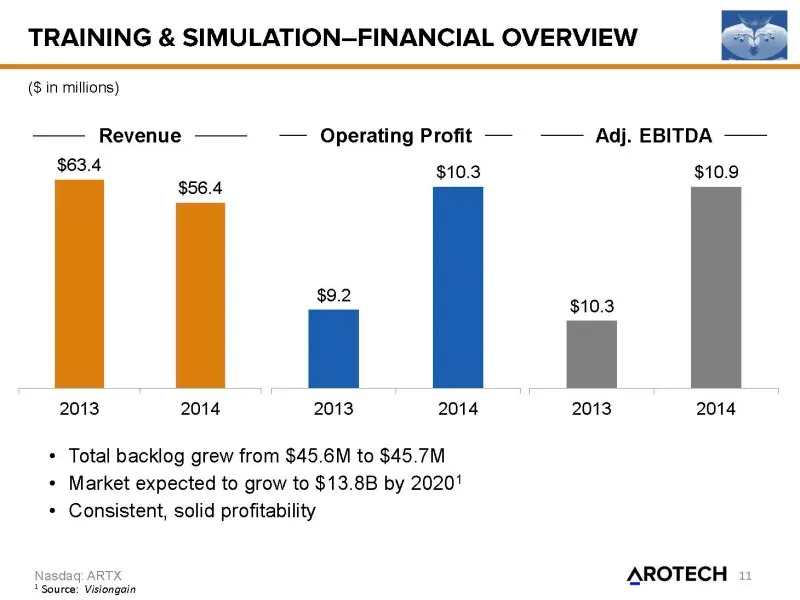
TRAINING & SIMULATION-FINANCIAL OVERVIEW en (8 in millions) —— Revenue — Operating Profit — — Adj. EBITDA — Lud $10.3 $10.9 $56.4 ; | i : 5 2013 2014 2013 2014 2013 2014 * Total backlog grew from $45.6M to $45.7M * Market expected to grow to $13.8B by 2020! + Consistent, solid profitability Nasdlag:
Slide 12: Training & Simulation - Overview
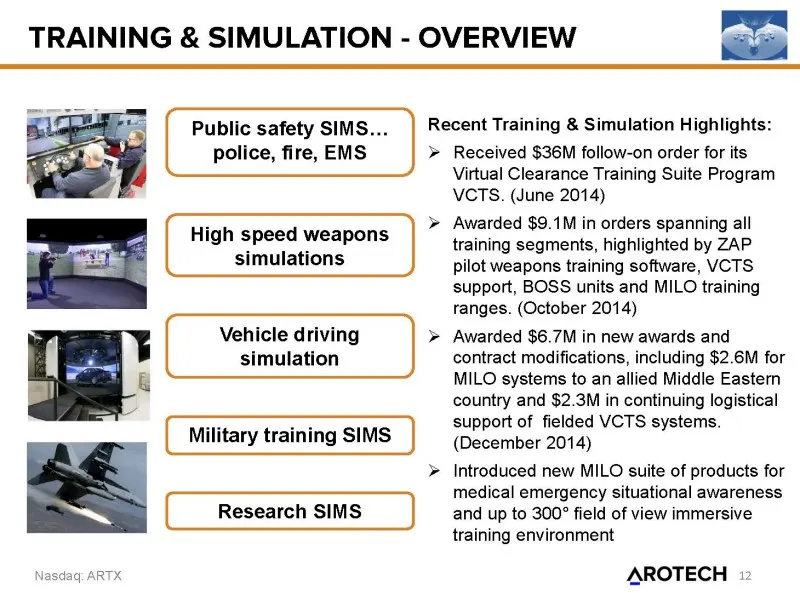
TRAINING & SIMULATION - OVERVIEW en Public safety SIMS... police, fire, EMS —————— High speed weapons simulations ————— Vehicle driving simulation Military training SIMS Hie Babee te Research SIMS Recent Training & Simulation Highlights: » Received $36M follow-on order for its Virtual Clearance Trai
Slide 13: Training & Simulation - Products
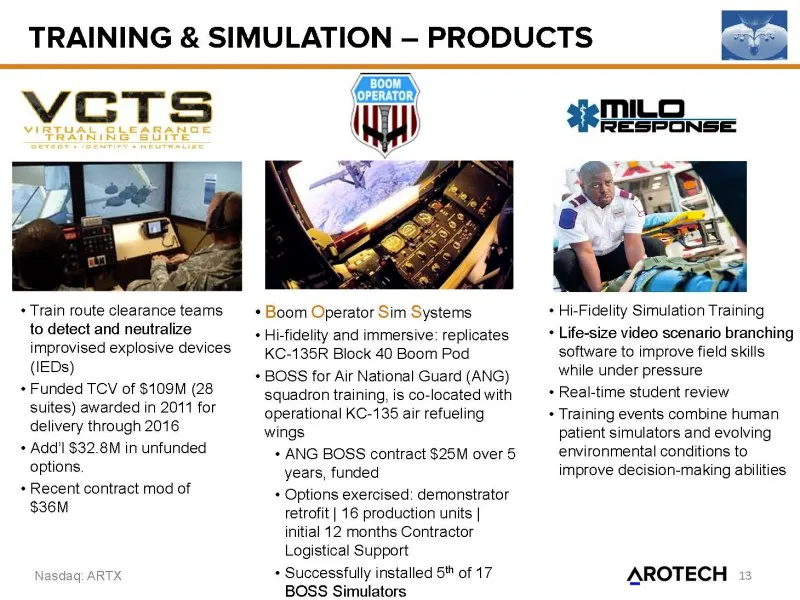
TRAINING & SIMULATION — PRODUCTS = Fs (My) Sy + Train route clearance teams to detect and neutralize improvised explosive devices (IEDs) + Funded TCV of $109M (28 suites) awarded in 2011 for delivery through 2016 + Add'l $32.8M in unfunded + Boom Operator Sim Systems + Hifidelity and immersive: repl
Slide 14: Training & Simulation - Growth Engines
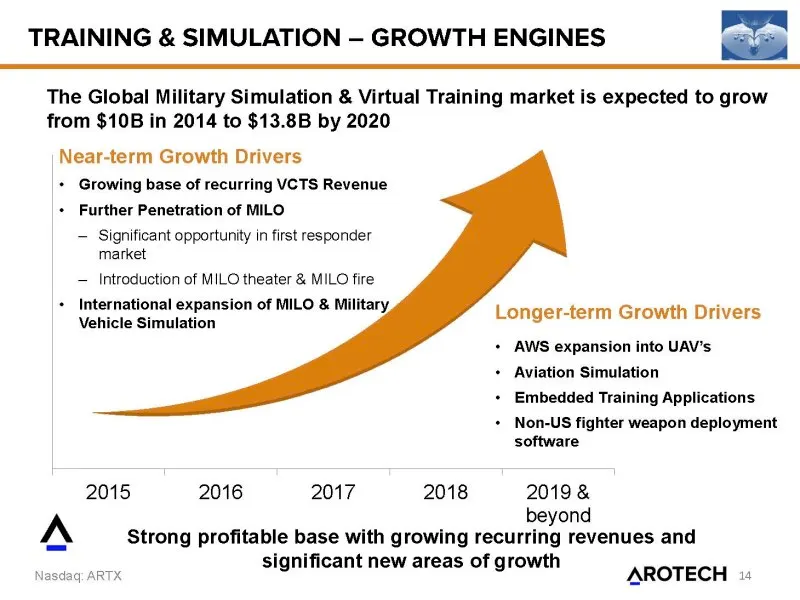
TRAINING & SIMULATION — GROWTH ENGINES en The Global Military Simulation & Virtual Training market is expected to grow from $10B in 2014 to $13.8B by 2020 Near-term Growth Drivers + Growing base of recurring VCTS Revenue + Further Penetration of MILO — Significant opportunity in first responder mark
Slide 15: R&D Growth Opportunity - SIRE
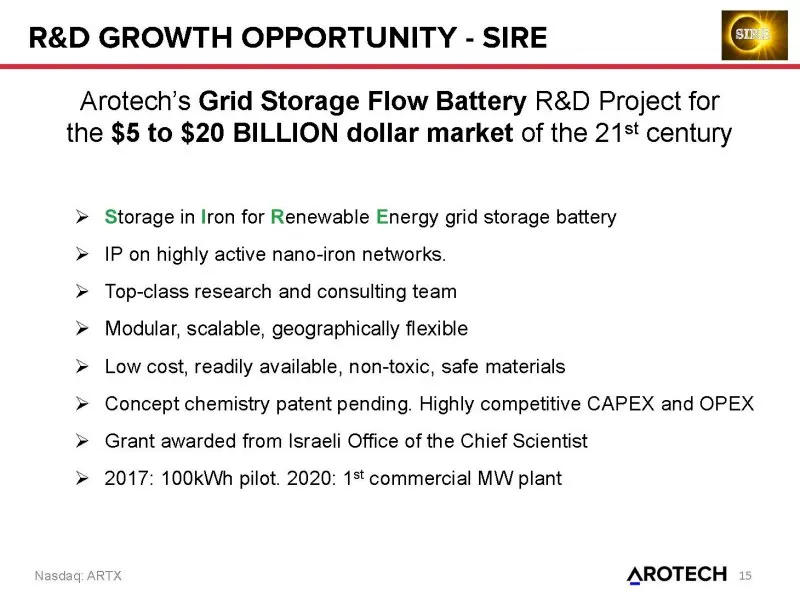
R&D GROWTH OPPORTUNITY - SIRE cae Arotech’s Grid Storage Flow Battery R&D Project for the $5 to $20 BILLION dollar market of the 215 century > Storage in Iron for Renewable Energy grid storage battery > IP on highly active nano-iron networks. > Top-class research and consulting team >» Modular, scal
Slide 16: Financial Overview
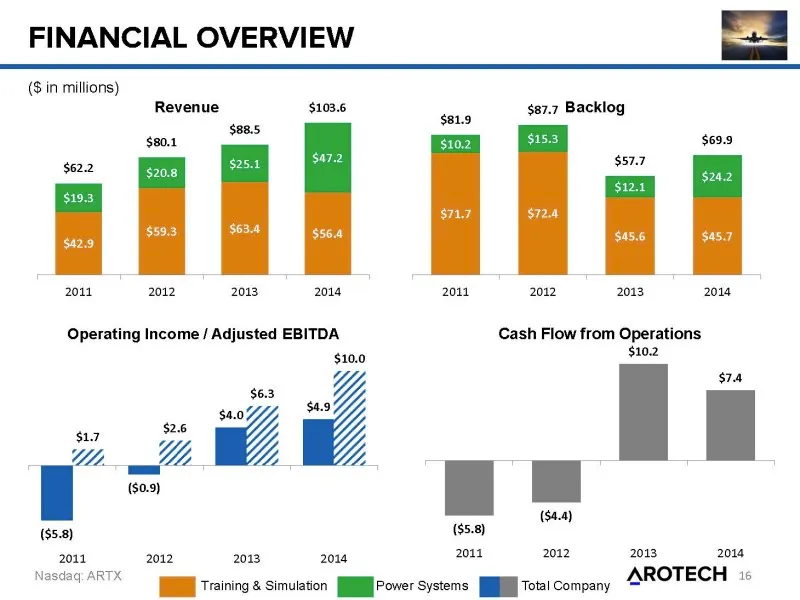
FINANCIAL OVERVIEW (8 in millions) $103.6 $62.2 2011 2012 2013 2014 Operating Income / Adjusted EBITDA $10.0 3 WG $17 $2.6 We. a W/Z. | tna) ($5.8) 2011 2012 2013 2014 Nasdaq: ARTX HE Training & Simulation IMJ Power systems I Tota! Company 27.7 Backl gen ba 8 $009 gsr $12.1 456 2011 2012 2013 2014 C
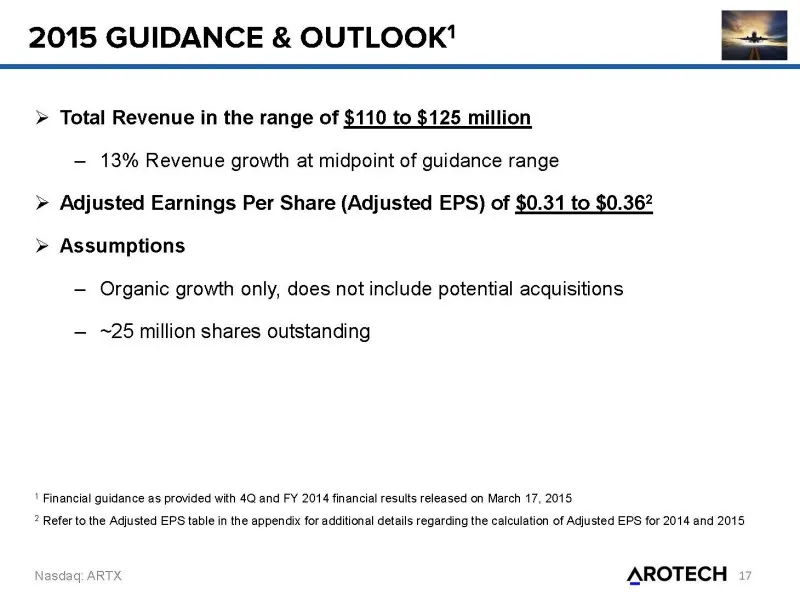
Slide 17: 2015 Guidance & Outlook
2015 GUIDANCE & OUTLOOK’ > Total Revenue in the range of $110 to $125 million — 13% Revenue growth at midpoint of guidance range >» Adjusted Earnings Per Share (Adjusted EPS) of $0.31 to $0.362 > Assumptions — Organic growth only, does not include potential acquisitions — ~25 million shares outstand
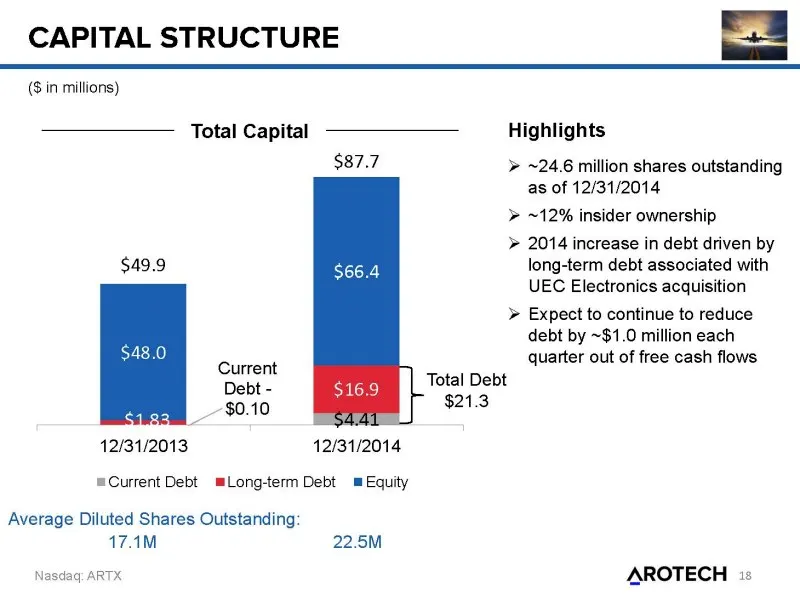
Slide 18: Capital Structure
CAPITAL STRUCTURE (8 in millions) Total Capital ———— Highlights $87.7 > ~24.6 million shares outstanding as of 12/31/2014 > ~12% insider ownership > 2014 increase in debt driven by long-term debt associated with UEC Electronics acquisition » Expect to continue to reduce debt by ~$1.0 million each qu
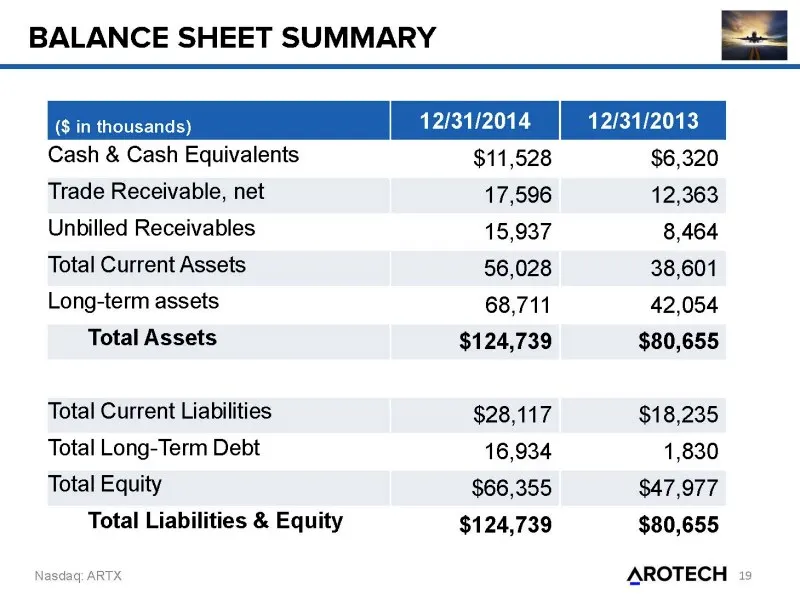
Slide 19: Balance Sheet Summary
BALANCE SHEET SUMMARY saisva014 | 12/31/2013 Cash & Cash Equivalents Trade Receivable, net Unbilled Receivables Total Current Assets Long-term assets Total Assets Total Current Liabilities Total Long-Term Debt Total Equity Total Liabilities & Equity jasdag: ARTX $11,528 17,596 15,937 56,028 68,711 $
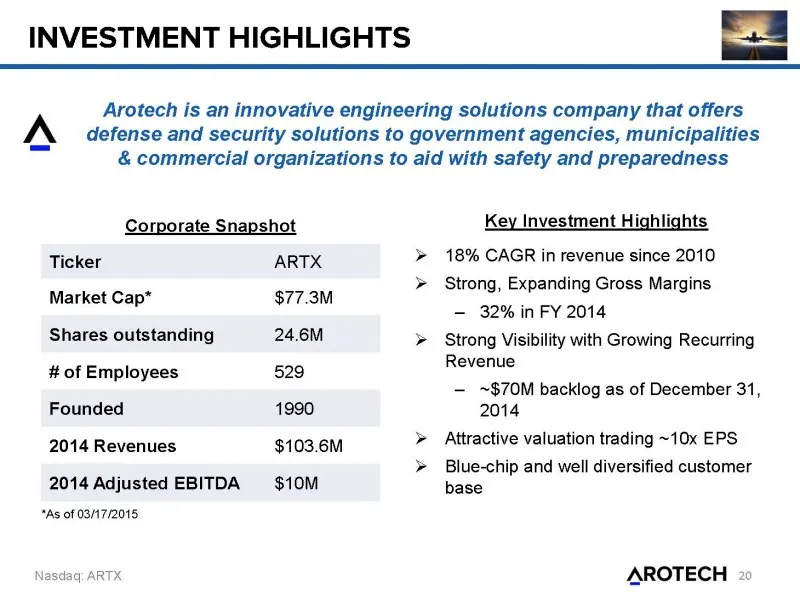
Slide 20: Investment Highlights
INVESTMENT HIGHLIGHTS Arotech is an innovative engineering solutions company that offers A defense and security solutions to government agencies, municipalities & commercial organizations to aid with safety and preparedness Corporate Snapshot Key Investment Highlights Ticker ARTX > 18% CAGR in reven
Slide 21: Executive Management Team
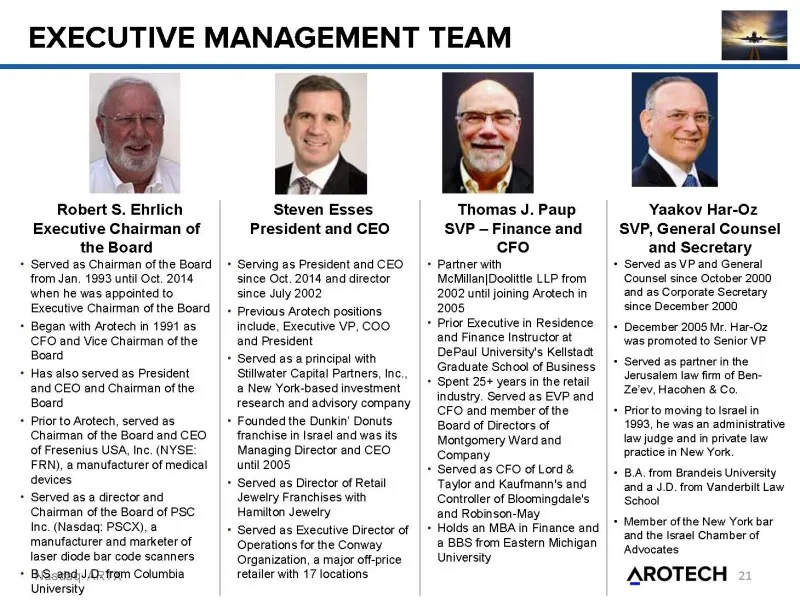
EXECUTIVE MANAGEMENT TEAM Robert S. Ehrlich Executive Chairman of the Board ‘Served as Chairman of the Board from Jan. 1993 until Oct. 2014 ‘when he was appointed to Executive Chairman of the Board Began with Arotech in 1991 as CFO and Vice Chairman of the Board Has also served as President ‘and CEO
Slide 22: Contacts
CONTACTS For More Information Company Contacts Steven Esses, CEO Arotech Corporation Tel 800.281.0356 * wwwaarotech.com Investor Relations Brett Maas & Rob Fink Hayden IR Tel 646.536.7331 / 646.415.8972 * www.haydenir.com Nasdaq ARTX AROTECH »
Slide 23: Calculation of Adjusted EPS
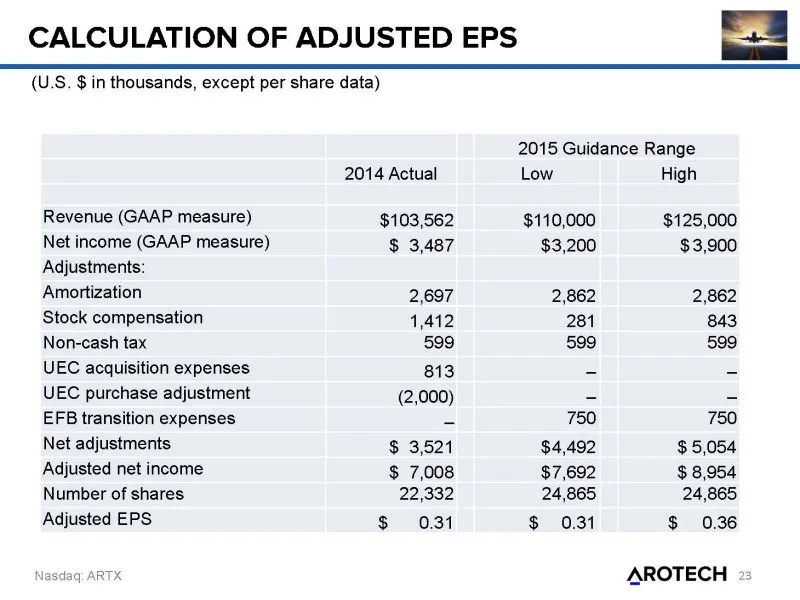
CALCULATION OF ADJUSTED EPS (U.S. $ in thousands, except per share data) 2015 Guidance Range 2014 Actual Low High Revenue (GAAP measure) $103,562 $110,000 $125,000 Net income (GAAP measure) $ 3,487 $3,200 $3,900 Adjustments: Amortization 2,697 2,862 2,862 Stock compensation 1,412 281 843 Non-cash ta
Source: SEC EDGAR · 8-K filed Mar 19, 2015
More decks from Arotech Corporation
 Investor Presentation (May 2019)23 slides · May 24, 2019
 Investor Presentation (May 2018)16 slides · May 24, 2018
 Investor Presentation (May 2017)17 slides · May 24, 2017
 Investor Presentation (May 2016)23 slides · May 25, 2016
 Investor Presentation (May 2015)29 slides · May 13, 2015
 Investor Presentation (January 2015)23 slides · Jan 14, 2015