Arotech — Investor Presentation (May 2015)
29 slides from Arotech's investor presentation, May 13, 2015

Slide 1: Spring 2015
SPRING 2015 NASDAQ GM: ARTX WWW.AROTECH.COM AROTECH
Slide 2: Safe Harbor Statement
SAFE HARBOR STATEMENT | This presentation contains forward-looking statements (within the meaning of Section 27A of the Securities Act of 1933, as amended and Section 21E of the Secunties Exchange Act of 1934, as amended) regarding Arotech Corporation (Arotech) and/or its subsidiaries, (collective "
Slide 3: Investment Highlights
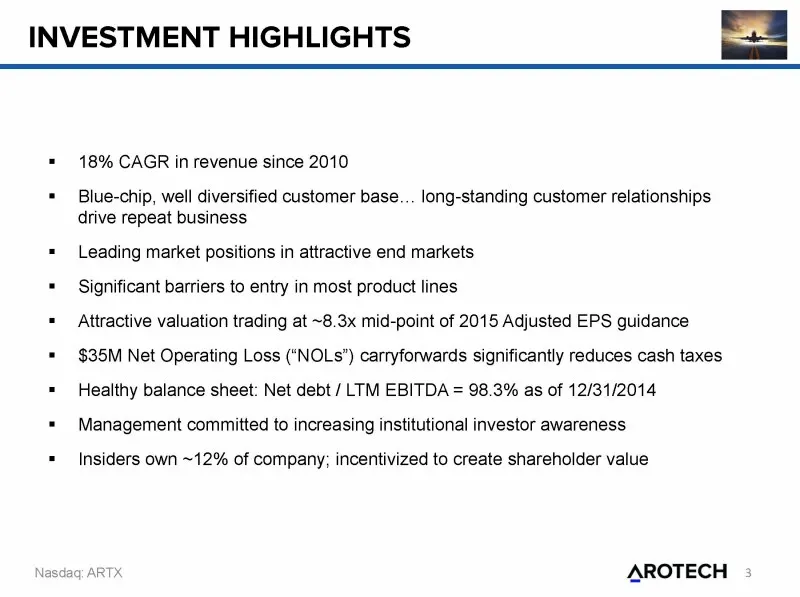
INVESTMENT HIGHLIGHTS 18% CAGR in revenue since 2010 Blue-chip, well diversified customer base... long-standing customer relationships drive repeat business Leading market positions in attractive end markets Significant barriers to entry in most product lines Attractive valuation trading at ~8.3x mi
Slide 4: Company Overview
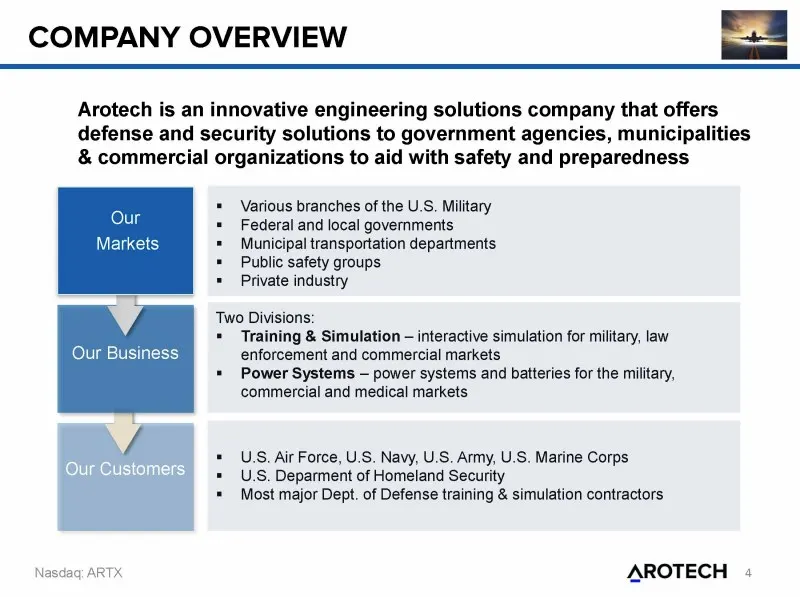
COMPANY OVERVIEW Arotech is an innovative engineering solutions company that offers defense and security solutions to government agencies, municipalities & commercial organizations to aid with safety and preparedness * Various branches of the U.S. Military Our = Federal and local governments Markets
Slide 5: Divisions Overview
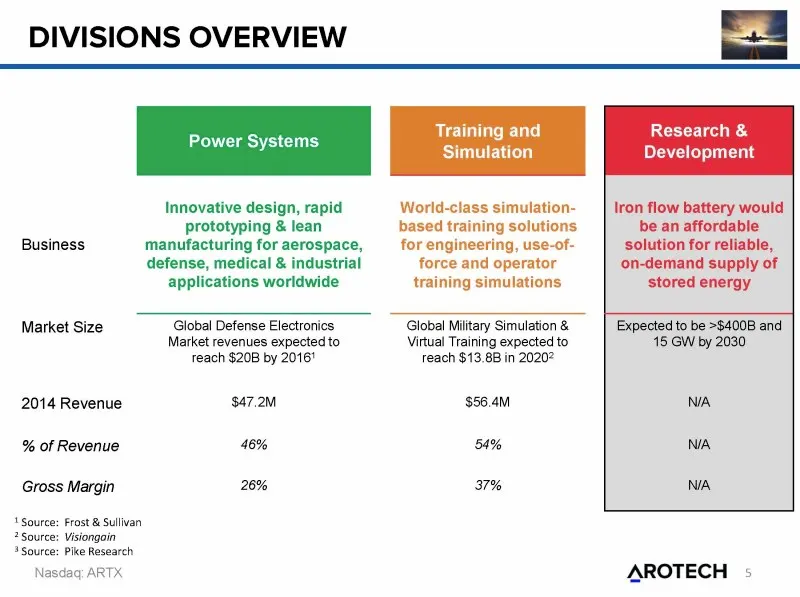
DIVISIONS OVERVIEW Power Systems Innovative design, rapid prototyping & lean manufacturing for aerospace, Training and Simulation World-class simulation- based training solutions for engineering, use-of- force and operator training simulations Research & Development Iron flow battery would be an aff
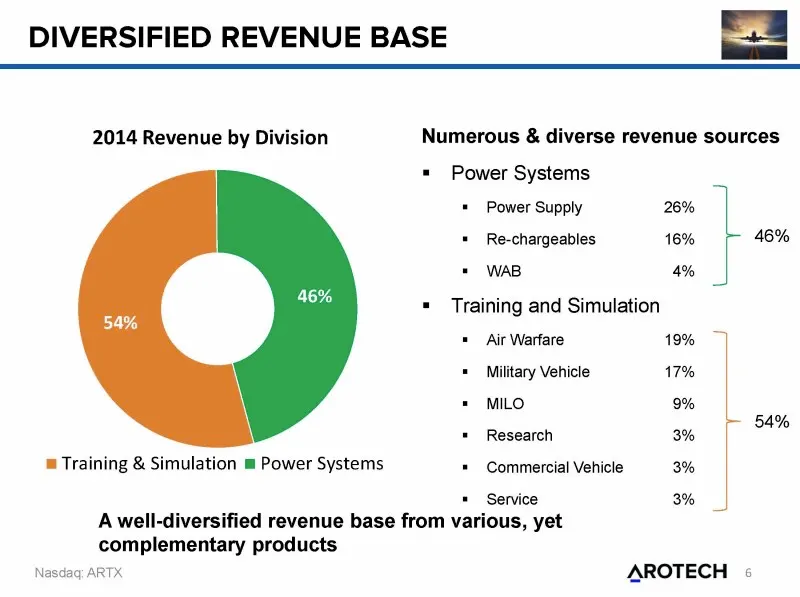
Slide 6: Diversified Revenue Base
DIVERSIFIED REVENUE BASE 2014 Revenue by Division Numerous & diverse revenue sources = Power Systems * Power Supply 26% * Re-chargeables 16% 46% + WAB 4% = Training and Simulation = Air Warfare 19% * Military Vehicle 17% * MILO 9% 54% + Research 3% = Training & Simulation = Power Systems = Commercia
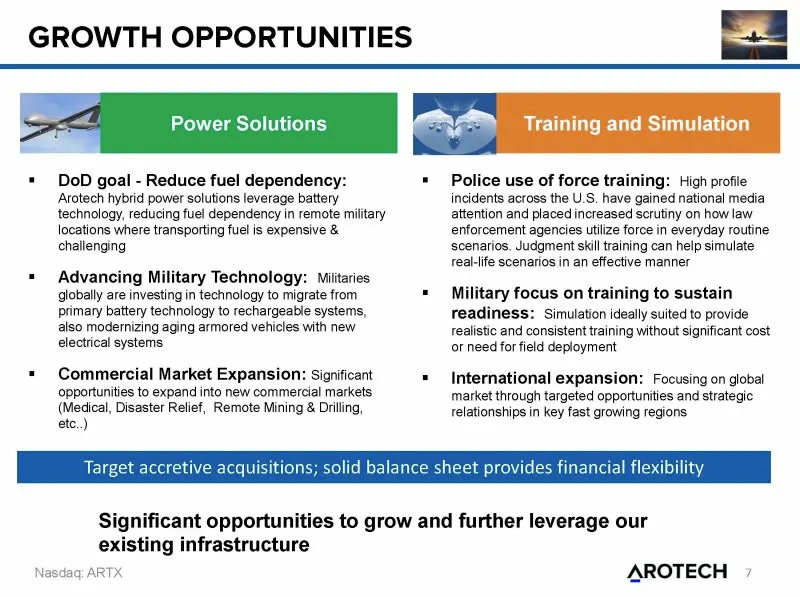
Slide 7: Growth Opportunities
GROWTH OPPORTUNITIES Nat Power Solutions DoD goal - Reduce fuel dependency: Arotech hybrid power solutions leverage battery technology, reducing fuel dependency in remote military locations where transporting fuel is expensive & challenging Advancing Military Technology: Militaries globally are inve
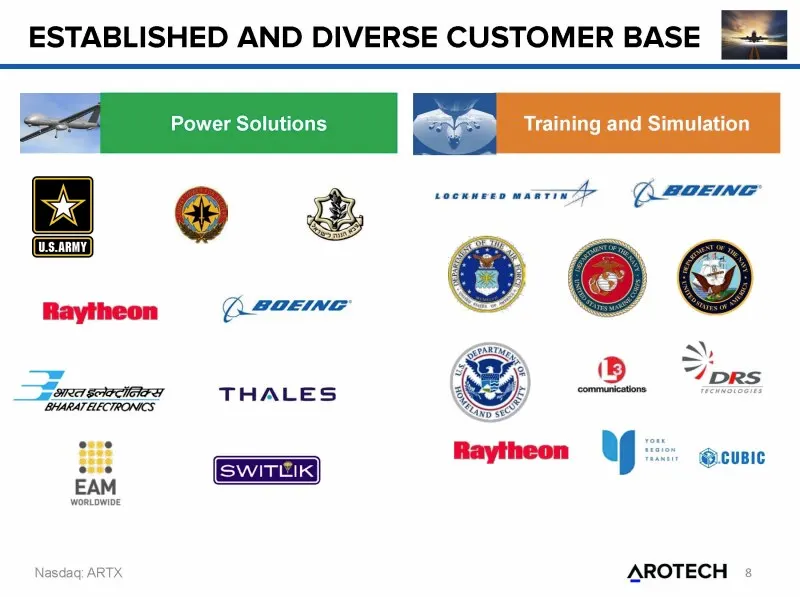
Slide 8: Established and Diverse Customer Base
ESTABLISHED AND DIVERSE CUSTOMER BASE faa eo Power Solutions os Vic) Training and Simulation Qeeene Pw 4 ) ® a THALES ] ssnaiens —_ Nasdag: ARTX AROTECH «
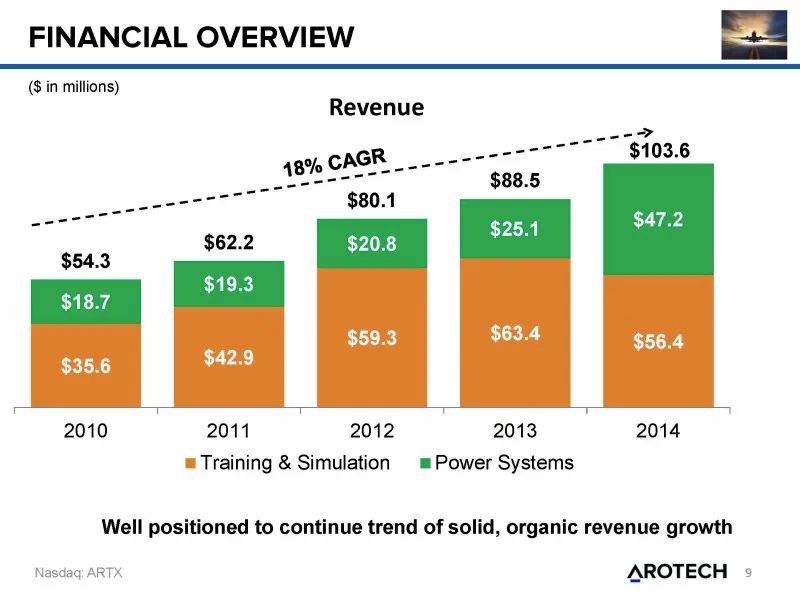
Slide 9: Financial Overview
FINANCIAL OVERVIEW | ($ in millions) Revenue 2010 2011 2012 2013 2014 Training & Simulation = Power Systems Well positioned to continue trend of solid, organic revenue growth R AROTECH
Slide 10: Power Systems - Financial Overview
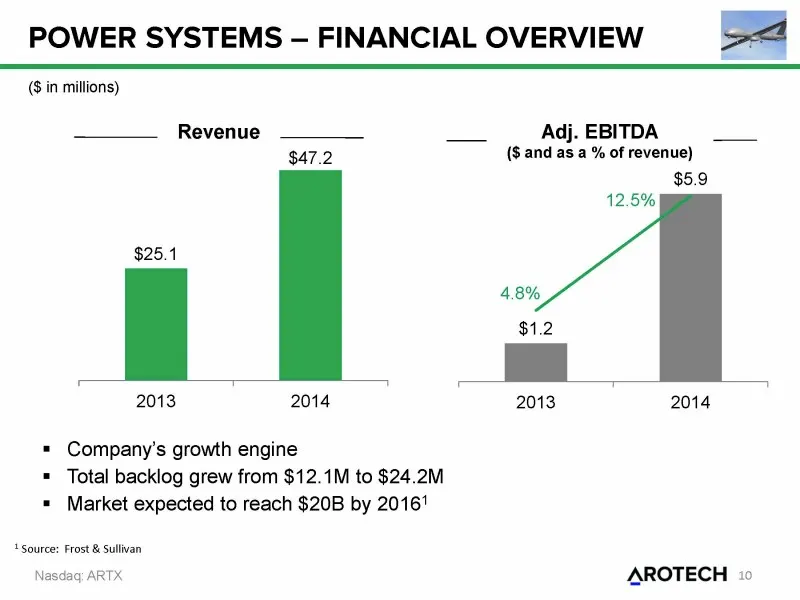
POWER SYSTEMS - FINANCIAL OVERVIEW [4 (6 in millions) Revenue —___ Adj. EBITDA $47.2 ($ and as a % of revenue) $5.9 12.5% $25.1 2013 2014 2013 2014 = Company's growth engine = Total backlog grew from $12.1M to $24.2M « Market expected to reach $20B by 20161 + Source: Frost & Sullivan Nasdoc: ARTX AR
Slide 11: Power Systems — Overview
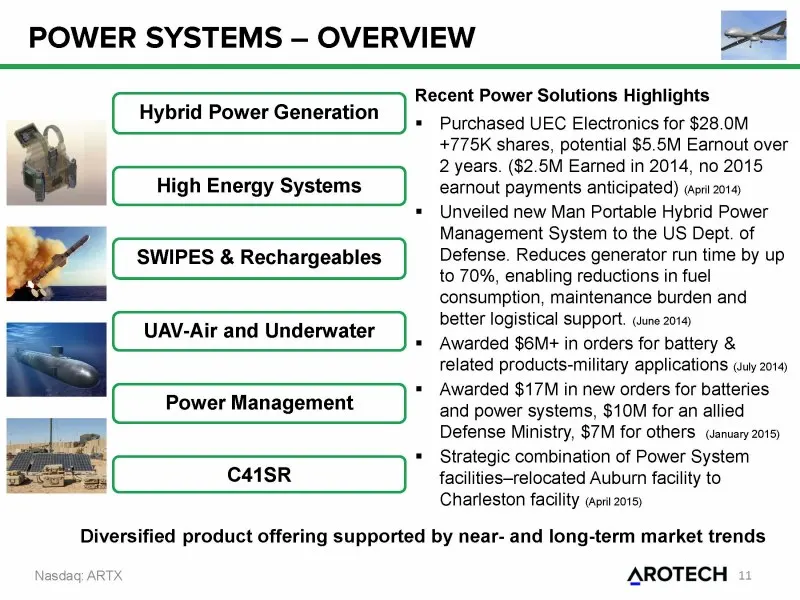
POWER SYSTEMS — OVERVIEW SA - - Recent Power Solutions Highlights Hybrid Power Generation) . purchased UEC Electronics for $28.0M a ) Ae [_oararaa ier) [_fovernsement (eee >" +775K shares, potential $5.5M Earnout over 2 years. ($2.5M Earned in 2014, no 2015 earnout payments anticipated) (Apri 2014)
Slide 12: Power Systems — UEC Acquisition
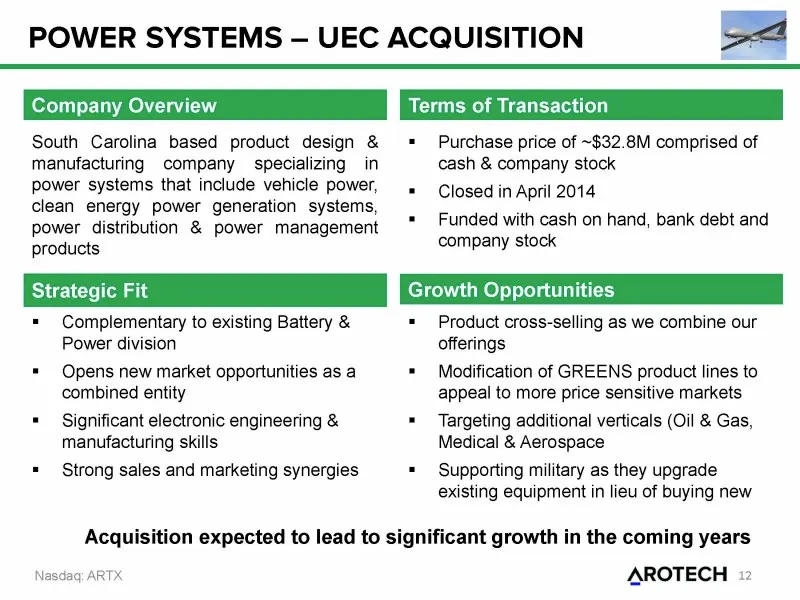
POWER SYSTEMS — UEC ACQUISITION Sa Company Overview Terms of Transaction South Carolina based product design & = Purchase price of ~$32.8M comprised of manufacturing company specializing in cash & company stock power systems that include vehicle power, . Closed in April 2014 clean energy power gener
Slide 13: Power Systems - Strategic Consolidation
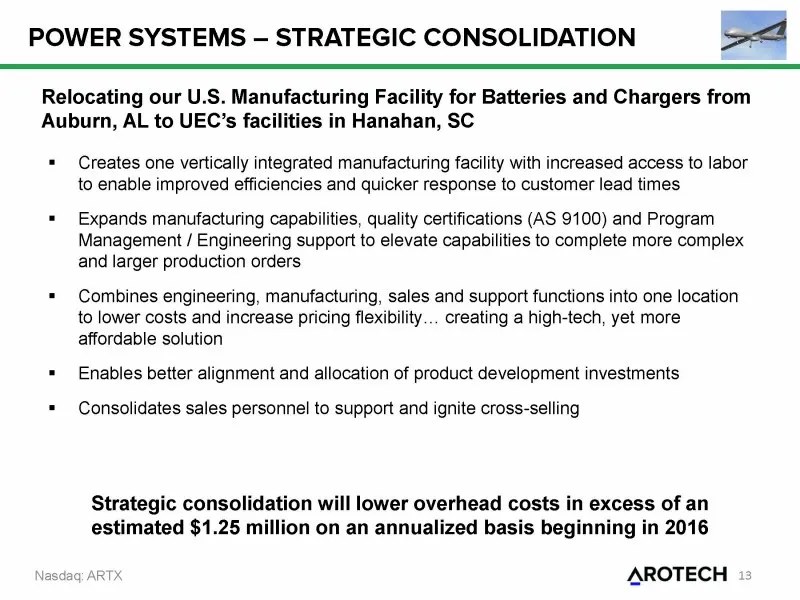
POWER SYSTEMS - STRATEGIC CONSOLIDATION Sa Relocating our U.S. Manufacturing Facility for Batteries and Chargers from Auburn, AL to UEC’s facilities in Hanahan, SC = Creates one vertically integrated manufacturing facility with increased access to labor to enable improved efficiencies and quicker re
Slide 14: Power Systems - Products
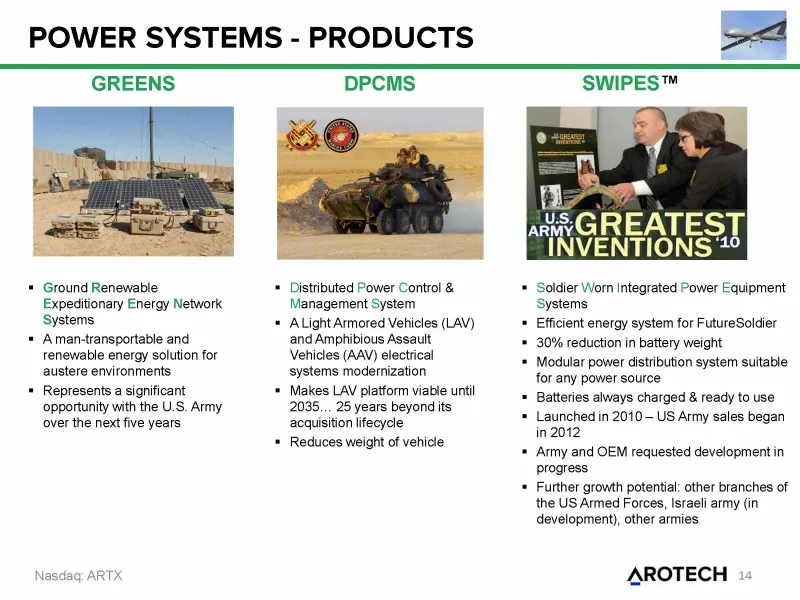
POWER SYSTEMS - PRODUCTS GREENS DPCMS SWIPES™ INVENTIONS ° * Ground Renewable Expeditionary Energy Network ‘Systems = Aman-tansportable and renewable energy solution for austere environments + Represents a significant ‘opportunity with the U.S, Army over the next five years Distributed Power Control
Slide 15: Power Systems - Growth Engines
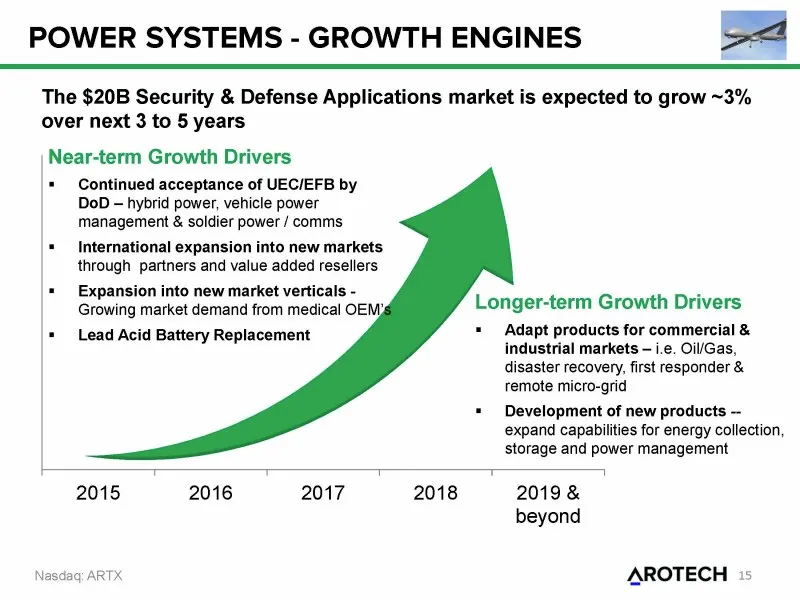
POWER SYSTEMS - GROWTH ENGINES Sa The $20B Security & Defense Applications market is expected to grow ~3% over next 3 to 5 years Near-term Growth Drivers + Continued acceptance of UEC/EFB by DoD — hybrid power, vehicle power management & soldier power / comms « — International expansion into new mar
Slide 16: Training & Simulation - Financial Overview
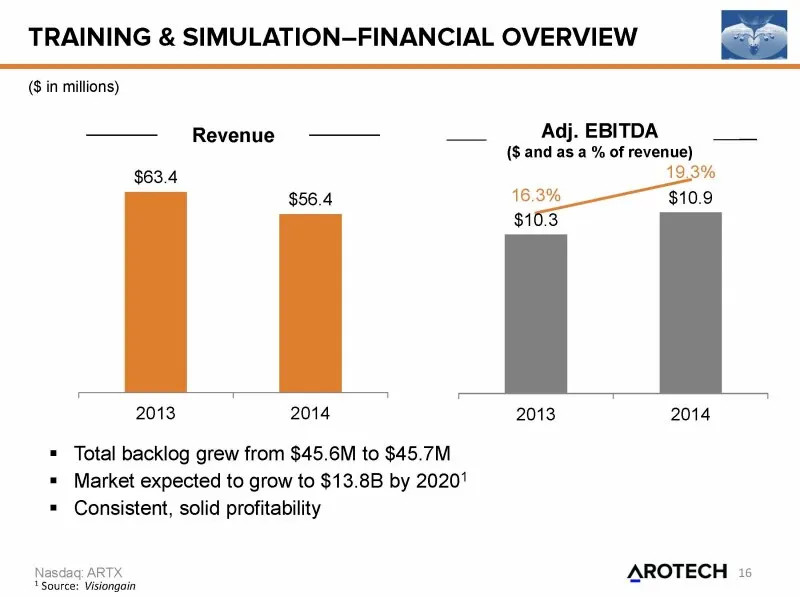
TRAINING & SIMULATION-FINANCIAL OVERVIEW aun (8 in millions) — Revenue ——— — Adj. EBITDA ($ and as a % of revenue) $63.4 19.3% $56.4 16.3% $10.9 $10.3 2013 2014 2013 2014 = Total backlog grew from $45.6M to $45.7M « Market expected to grow to $13.8B by 2020' = Consistent, solid profitability Nasdloc
Slide 17: Training & Simulation - Overview
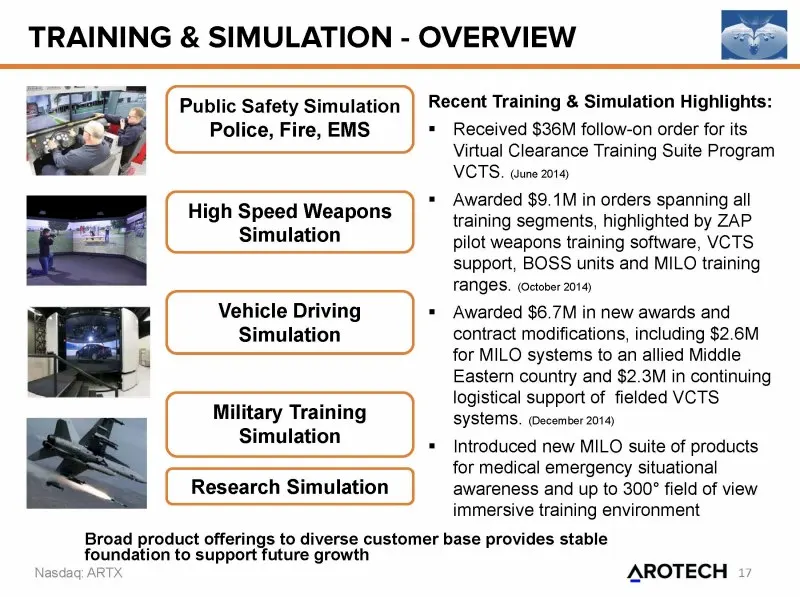
TRAINING & SIMULATION - OVERVIEW aun Pul Safety ulation | Recent Training & Simulation Highlights: Police, Fire, EMS = Received $36M follow-on order for its Virtual Clearance Training Suite Program VCTS. (une 2014) i « Awarded $9.1M in orders spanning all High Speed Weapons training segments, highli
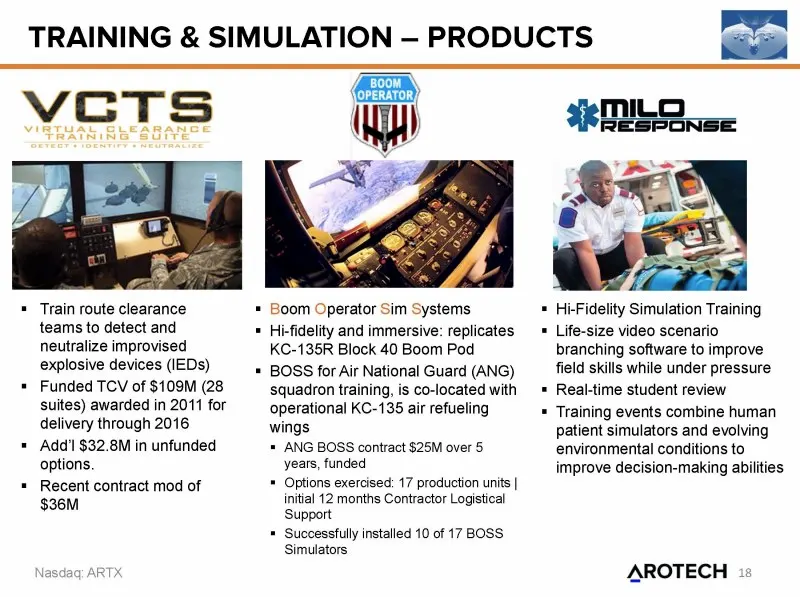
Slide 18: Training & Simulation — Products
TRAINING & SIMULATION — PRODUCTS Train route clearance teams to detect and neutralize improvised explosive devices (IEDs) Funded TCV of $109M (28 suites) awarded in 2011 for delivery through 2016 Addl $32.8M in unfunded options. Recent contract mod of $36M ARTX Boom Operator Sim Systems Hi-fidelity
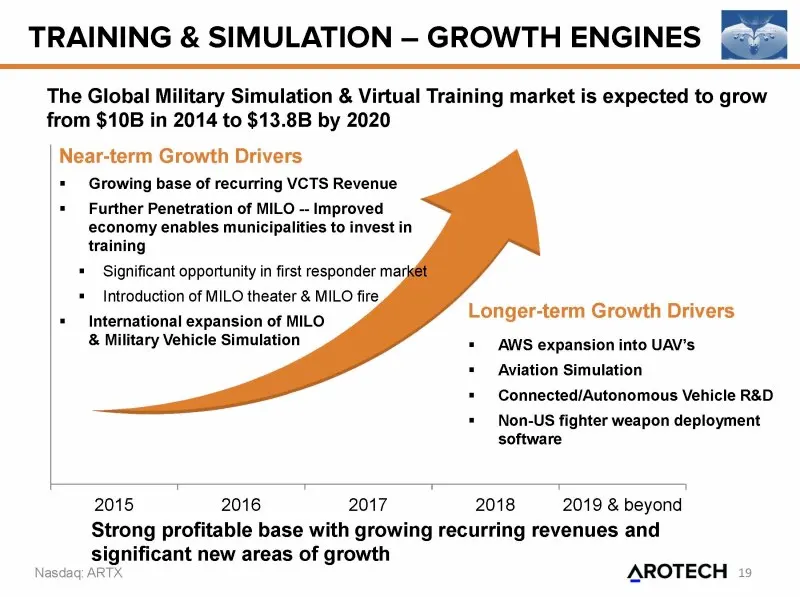
Slide 19: Training & Simulation - Growth Engines
TRAINING & SIMULATION - GROWTH ENGINES E™ The Global Military Simulation & Virtual Training market is expected to grow from $10B in 2014 to $13.8B by 2020 Near-term Growth Drivers + Growing base of recurring VCTS Revenue + Further Penetration of MILO -- Improved economy enables municipalities to inv
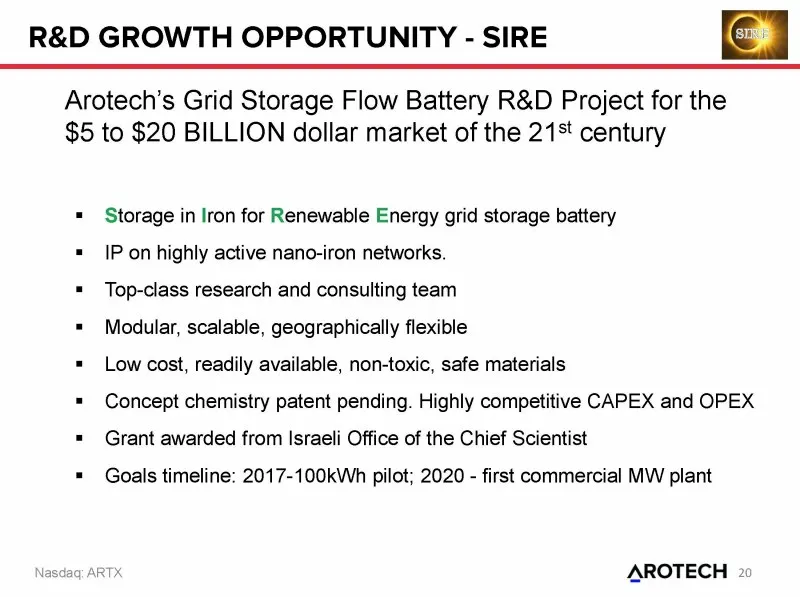
Slide 20: R&D Growth Opportunity - SIRE
R&D GROWTH OPPORTUNITY - SIRE Arotech’s Grid Storage Flow Battery R&D Project for the $5 to $20 BILLION dollar market of the 21S century = Storage in Iron for Renewable Energy grid storage battery = IP on highly active nano-iron networks. = Top-class research and consulting team = Modular, scalable,
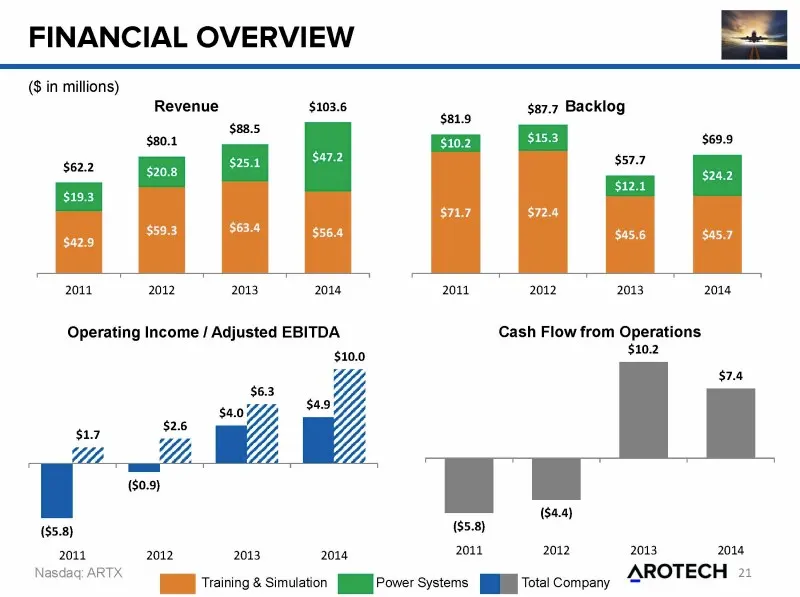
Slide 21: Financial Overview
FINANCIAL OVERVIEW (8 in millions) Revenue $103.6 cae $87.7 Backlog 2011 2012 2013, 2018 20 2012 2013 2018 Operating Income / Adjusted EBITDA Cash Flow from Operations $10.0 $102 Z $7.4 sss Y $40% si ($4.4) ($5.8) ($5.8) 2011 2012 2013 2014 201} 2012 2013 2014 Nasdaq: ARTX 2 eeteg [EB Tsing & simula
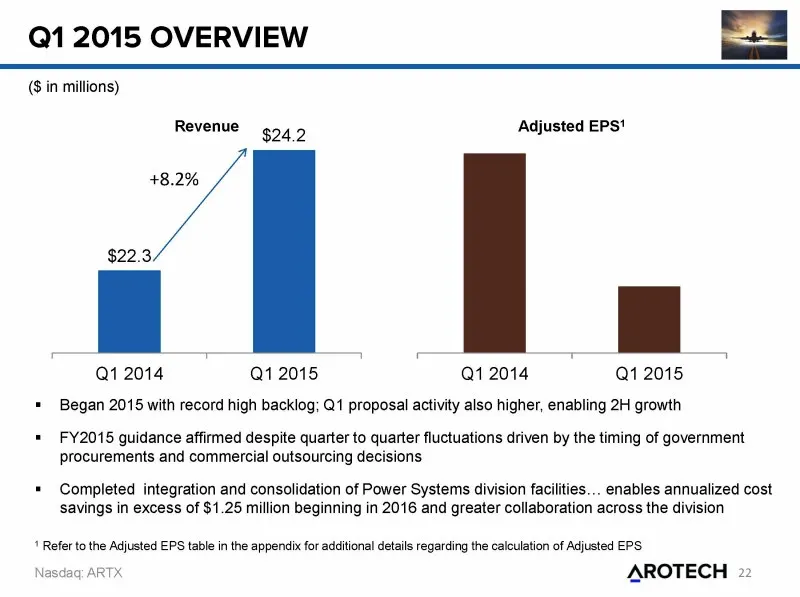
Slide 22: Q1 2015 Overview
Q1 2015 OVERVIEW (8 in millions) Revenue 9549 Adjusted EPS* ra $22.3. Q1 2014 Q1 2015 Q1 2014 Q1 2015 * Began 2015 with record high backlog; Q1 proposal activity also higher, enabling 2H growth * FY2015 guidance affirmed despite quarter to quarter fluctuations driven by the timing of government proc
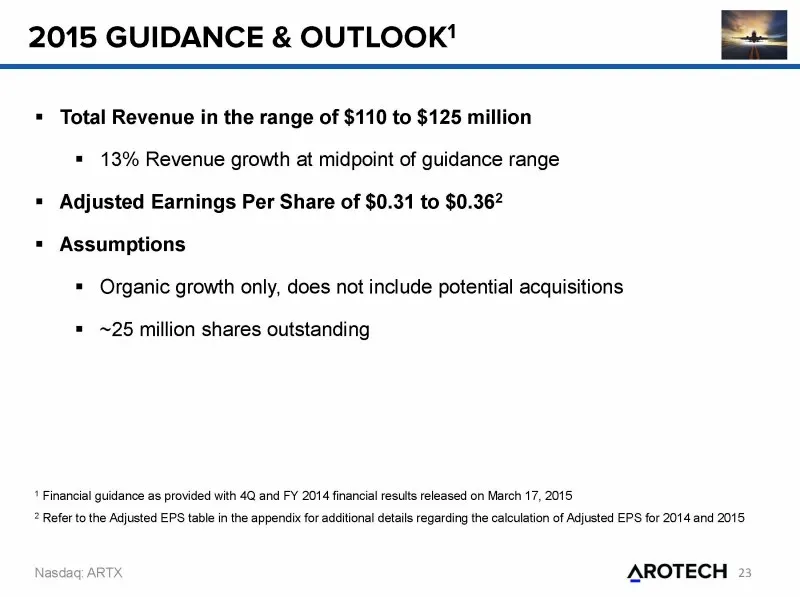
Slide 23: 2015 Guidance & Outlook
2015 GUIDANCE & OUTLOOK' = Total Revenue in the range of $110 to $125 million = 13% Revenue growth at midpoint of guidance range = Adjusted Earnings Per Share of $0.31 to $0.362 = Assumptions = Organic growth only, does not include potential acquisitions = ~25 million shares outstanding * Financial
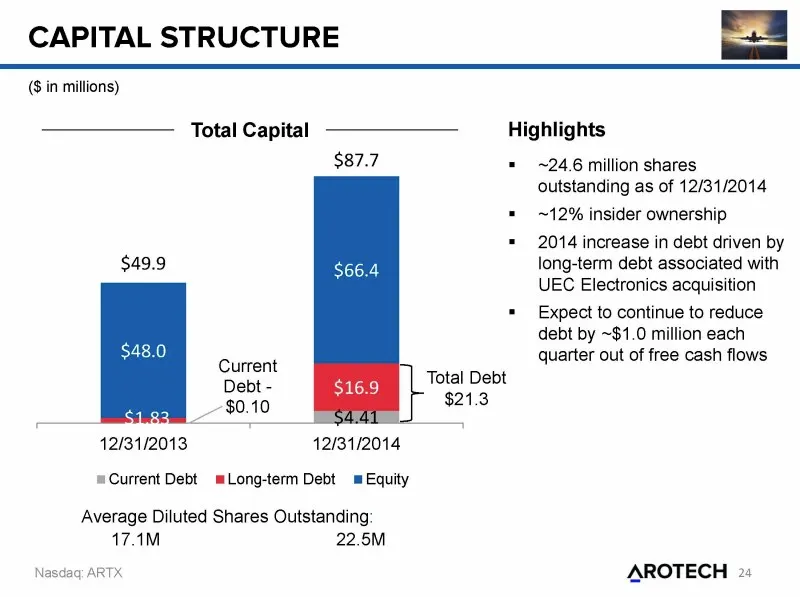
Slide 24: Capital Structure
CAPITAL STRUCTURE (8 in millions) Total Capital ———————_ Highlights $87.7 = ~24.6 million shares outstanding as of 12/31/2014 = ~12% insider ownership = 2014 increase in debt driven by long-term debt associated with UEC Electronics acquisition = Expect to continue to reduce debt by ~$1.0 million eac
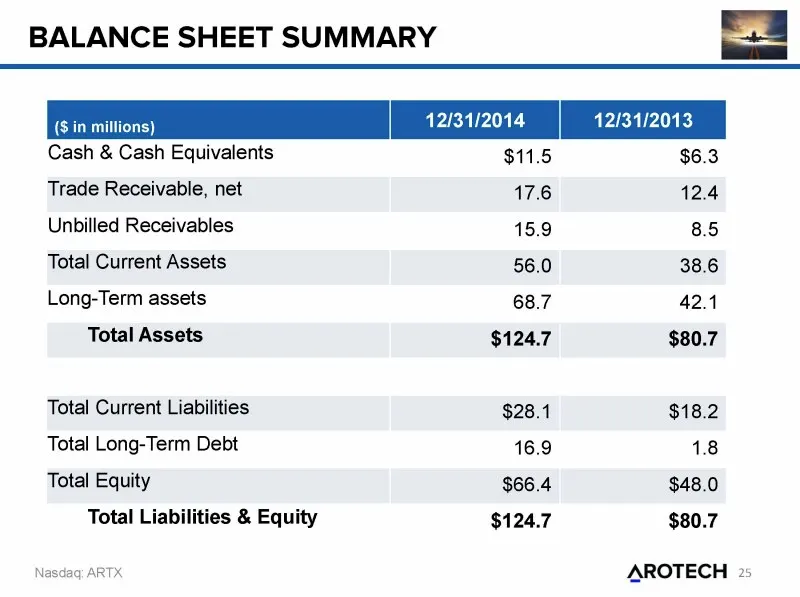
Slide 25: Balance Sheet Summary
BALANCE SHEET SUMMARY 12/31/2014 12/31/2013 Cash & Cash Equivalents $11.5 $6.3 Trade Receivable, net 17.6 12.4 Unbilled Receivables 15.9 8.5 Total Current Assets 56.0 38.6 Long-Term assets 68.7 42.1 Total Assets $124.7 $80.7 Total Current Liabilities $28.1 $18.2 Total Long-Term Debt 16.9 1.8 Total E
Slide 26: Investment Highlights
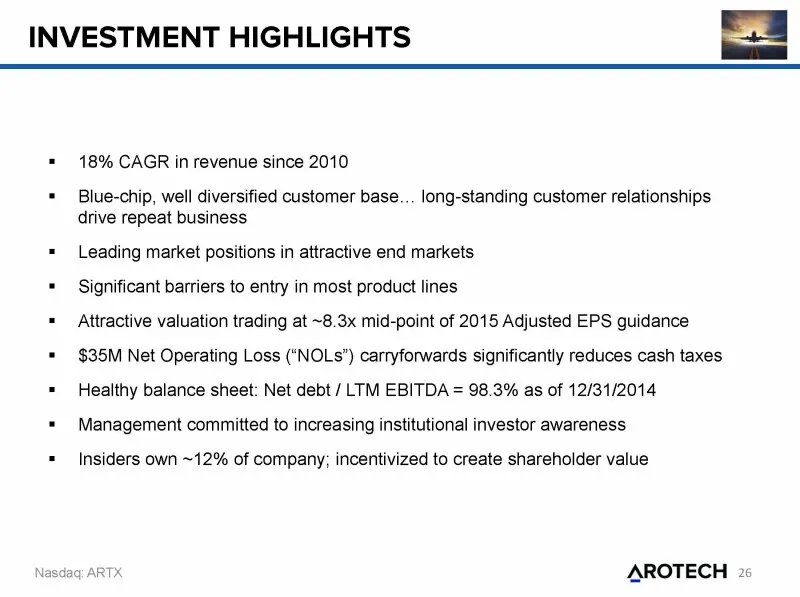
INVESTMENT HIGHLIGHTS = 18% CAGR in revenue since 2010 * Blue-chip, well diversified customer base... long-standing customer relationships drive repeat business = Leading market positions in attractive end markets = — Significant barriers to entry in most product lines = Attractive valuation trading
Slide 27: Executive Management Team
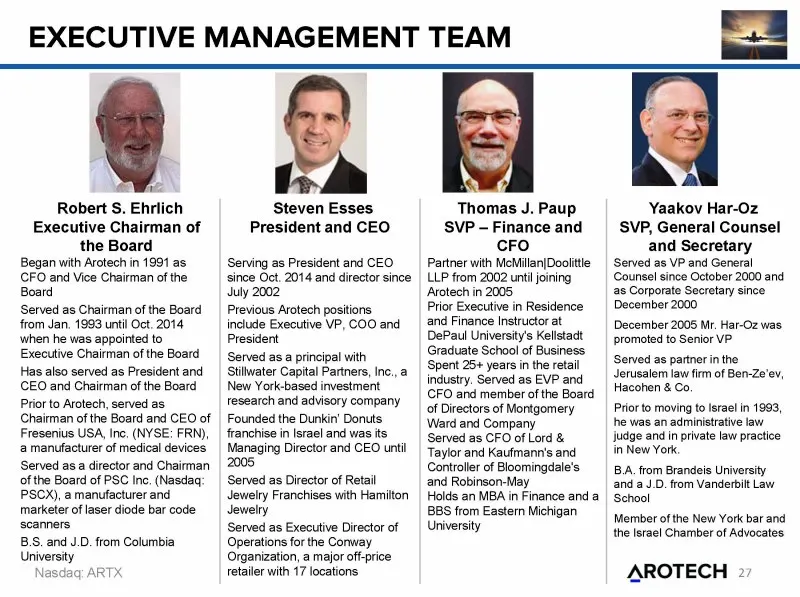
EXECUTIVE MANAGEMENT TEAM Robert S. Ehrlich Executive Chairman of the Board Began with Arotech in 1991 as CFO and Vice Chairman of the Board Served as Chairman of the Board from Jan, 1993 until Oct. 2014 ‘when he was appointed to Executive Chairman of the Board Has also served as President and CEO a
Slide 28: Contacts
CONTACTS Company Contact Arotech Corporation Steven Esses, CEO - esses@arotech.com | (800) 281-0356 Investor Relations Hayden IR Brett Maas — brett@haydenir.com | (646) 536-7331 Rob Fink — rob@haydenir.com | (646) 415-8972 Nasdaq ARTX AROTECH 2:
Slide 29: Calculation of Adjusted EPS
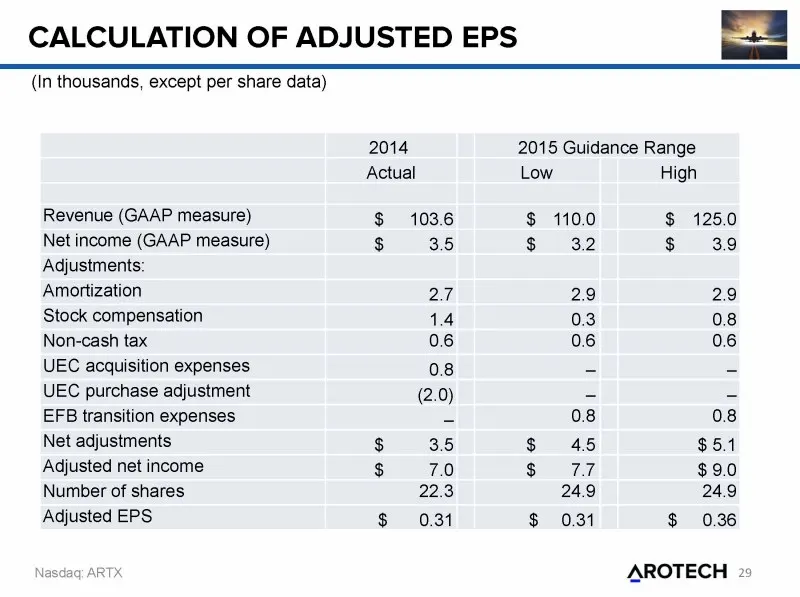
CALCULATION OF ADJUSTED EPS (In thousands, except per share data) 2014 2015 Guidance Range Actual Low High Revenue (GAAP measure) $ 103.6 $ 110.0 $ 125.0 Net income (GAAP measure) $ 3.5 $ 3.2 $ 3.9 Adjustments: Amortization 27 29 29 Stock compensation 1.4 0.3 08 Non-cash tax 06 06 06 UEC acquisition
Source: SEC EDGAR · 8-K filed May 13, 2015
More decks from Arotech Corporation
 Investor Presentation (May 2019)23 slides · May 24, 2019
 Investor Presentation (May 2018)16 slides · May 24, 2018
 Investor Presentation (May 2017)17 slides · May 24, 2017
 Investor Presentation (May 2016)23 slides · May 25, 2016
 Investor Presentation (March 2015)23 slides · Mar 19, 2015
 Investor Presentation (January 2015)23 slides · Jan 14, 2015