Analysts International — Investor Presentation (December 2004)
14 slides from Analysts International's investor presentation, Dec 8, 2004

Slide 1: Link
Link to searchable text of slide shown abov e
Slide 2: Safe Harbor Statement
Safe Harbor Statement Statements contained herein, which are not strictly historical information, are forward- looking statements. Words such as "believes," "intends," "possible," "expects," “estimates,” "anticipates," or "plans" and similar expressions are intended to identify forward-looking state
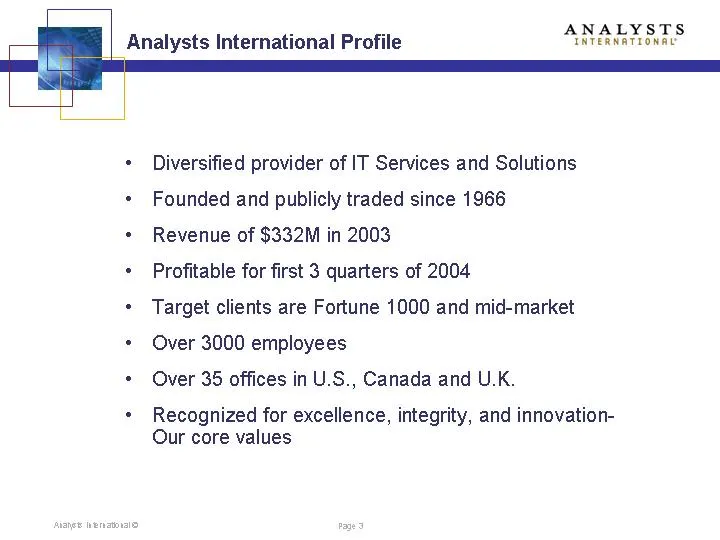
Slide 3: Analysts International Profile
Analysts International Profile + Diversified provider of IT Services and Solutions + Founded and publicly traded since 1966 + Revenue of $332M in 2003 * Profitable for first 3 quarters of 2004 + Target clients are Fortune 1000 and mid-market + Over 3000 employees + Over 35 offices in U.S., Canada an
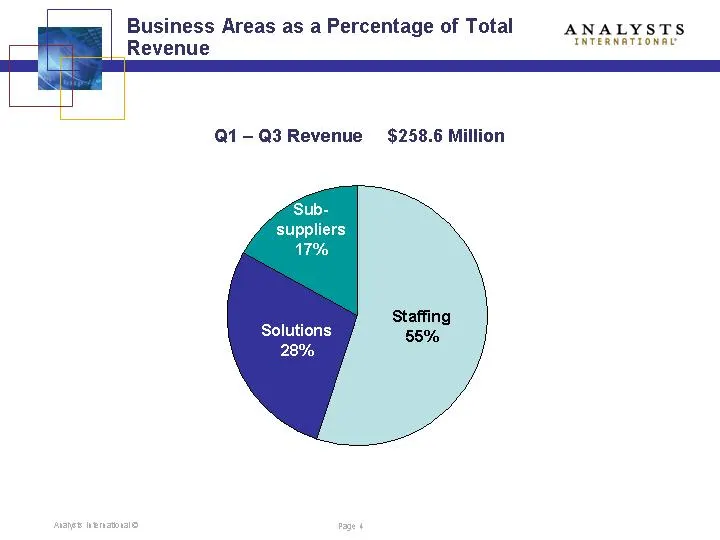
Slide 4: Business Areas as a Percentage of Total Revenue
Business Areas as a Percentage of Total ANALYSTS Revenue ‘ Q1 — Q3 Revenue ‘Sub- suppliers 1% Solutions 28% aes mente ra 4
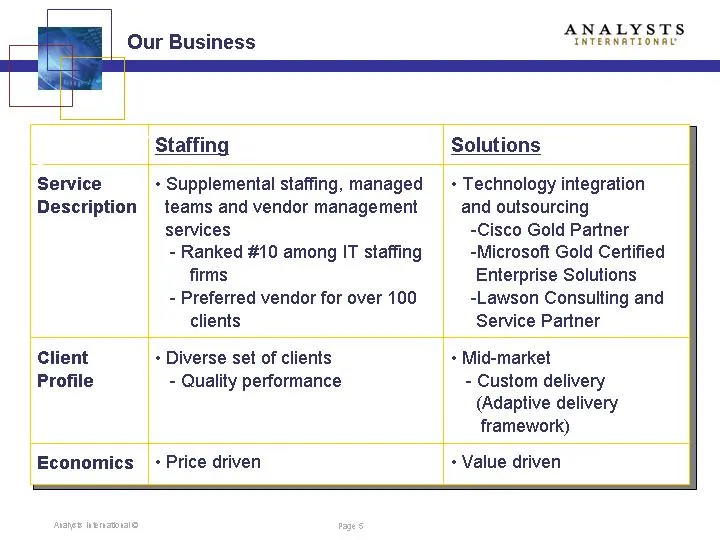
Slide 5: Our Business
Our Business ' Staffing Solutions Servi Description + Supplemental staffing, managed teams and vendor management services - Ranked #10 among IT staffing firms - Preferred vendor for over 100 clients + Technology integration and outsourcing -Cisco Gold Partner -Microsoft Gold Certified Enterprise Sol
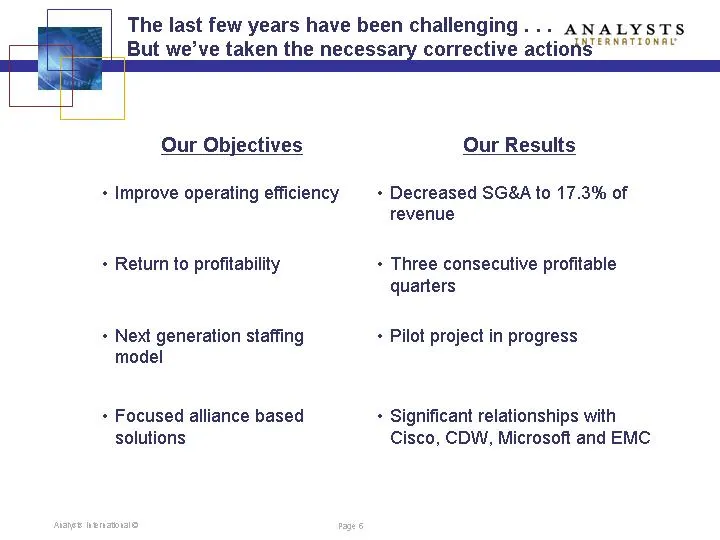
Slide 6: The last few years have been challenging...
The last few years have been challenging... anaLysTs But we’ve taken the necessary corrective actio ee Rearr OWA” Our Objectives Our Results + Improve operating efficiency + Decreased SG&A to 17.3% of revenue + Return to profitability + Three consecutive profitable quarters + Next generation staffin
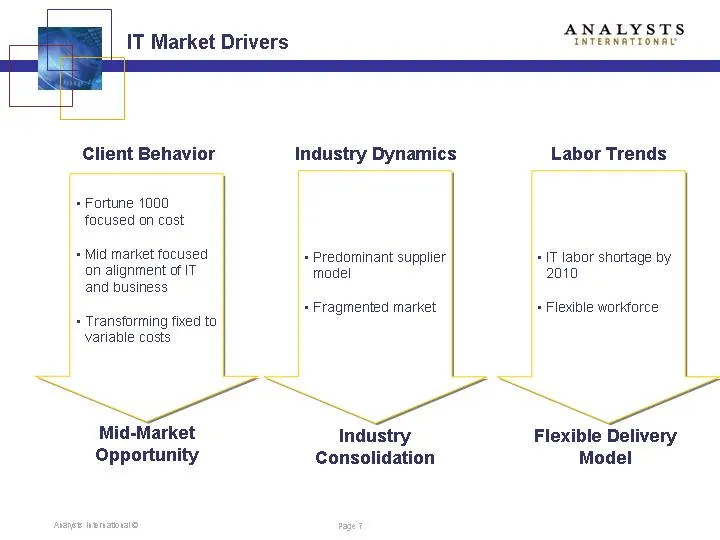
Slide 7: IT Market Drivers
IT Market Drivers Client Behavior Industry Dynamics Labor Trends + Fortune 1000 focused on cast + Mid market focused an alignment of IT and business + Transforming fixed ta variable costs Mid-Market Opportunity + Predominant supplier model + Fragmented market Industry Consolidation +IT labor shortag
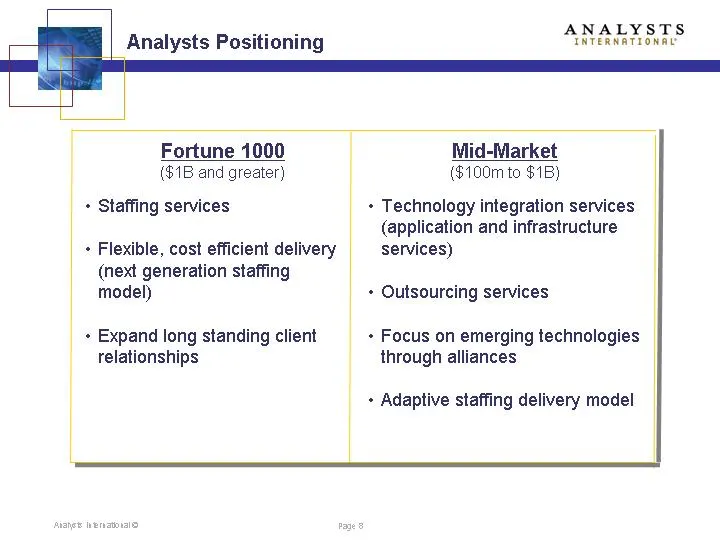
Slide 8: Analysts Positioning
Analysts Positioning Fortune 1000 Mid-Market ($18 and greater) ($100m to $1B) + Staffing services + Technology integration services (application and infrastructure + Flexible, cost efficient delivery services) (next generation staffing model) + Outsourcing services + Expand long standing client + Fo
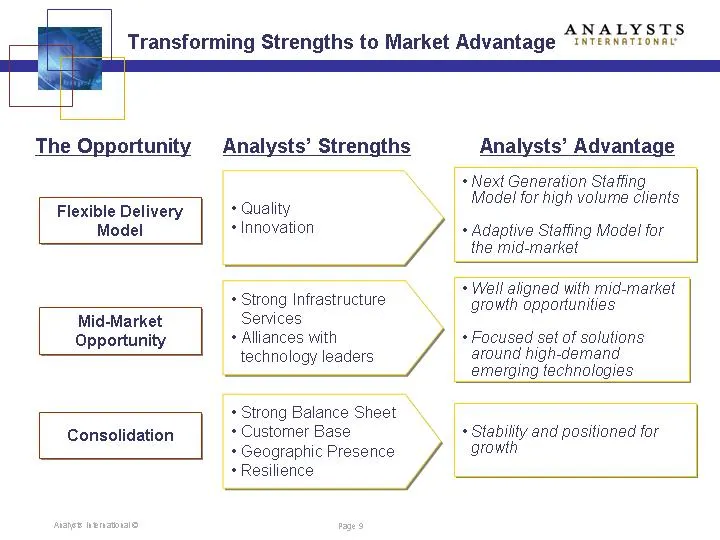
Slide 9: Transforming Strengths to Market Advantage
Transforming Strengths to Market Advantage The Opportunity Analysts’ Strengths Analysts’ Advantage Flexible Delivery Model Mid-Market Opportunity Consolidation \ + Quality + Innovation ) + Strong Infrastructure Services + Alliances with technology leaders + Strong Balance Sheet ‘e + Customer Base +
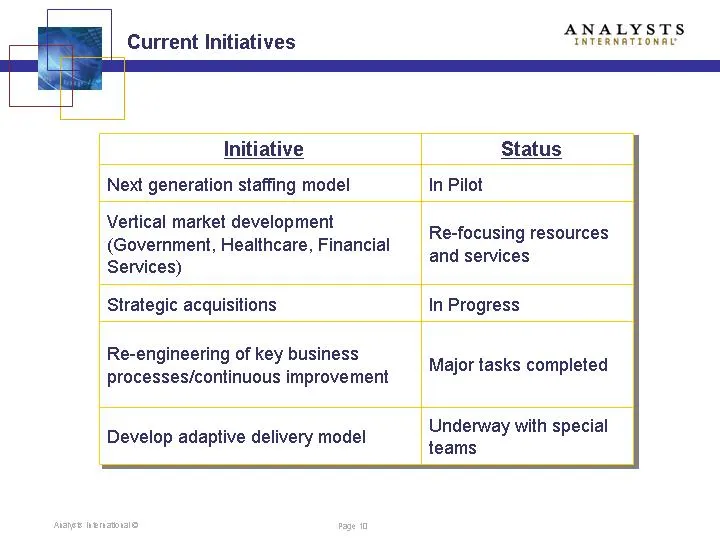
Slide 10: Status
Status Next generation staffing model In Pilot Vertical market development (Government, Healthcare, Financial Services) Re-focusing resources and services Strategic acquisitions In Progress Re-engineering of key business : i Major tasks completed processes/continuous improvement Underway with specia
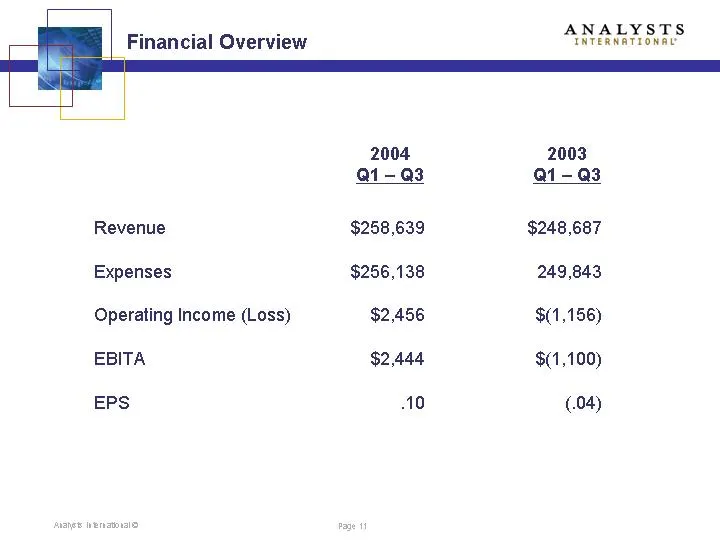
Slide 11: Financial Overview
Financial Overview Revenue Expenses Operating Income (Loss) EBITA EPS 2004 Q1- 3 $258,639 $256,138 $2,456 $2,444 10 2003 Q1- Q3 $248,687 249,843 $(1,156) $(1,100) (04)
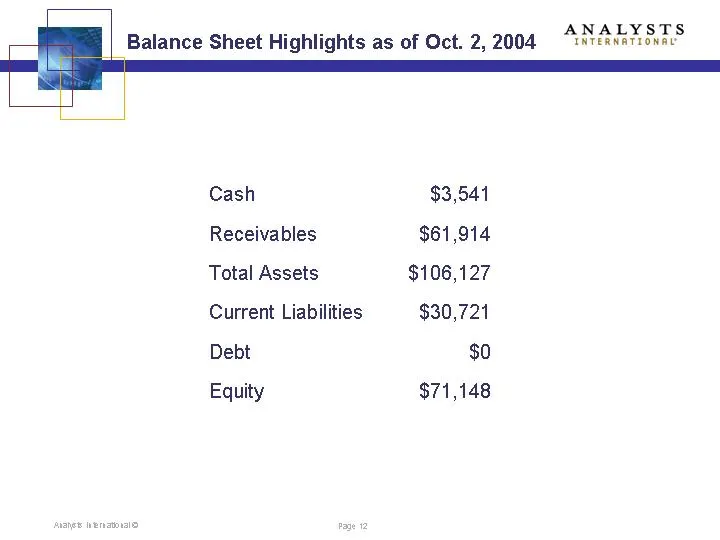
Slide 12: Balance Sheet Highlights as of Oct. 2, 2004
Balance Sheet Highlights as of Oct. 2, 2004 Cash $3,541 Receivables $61,914 Total Assets $106,127 Current Liabilities $30,721 Debt $0 Equity $71,148
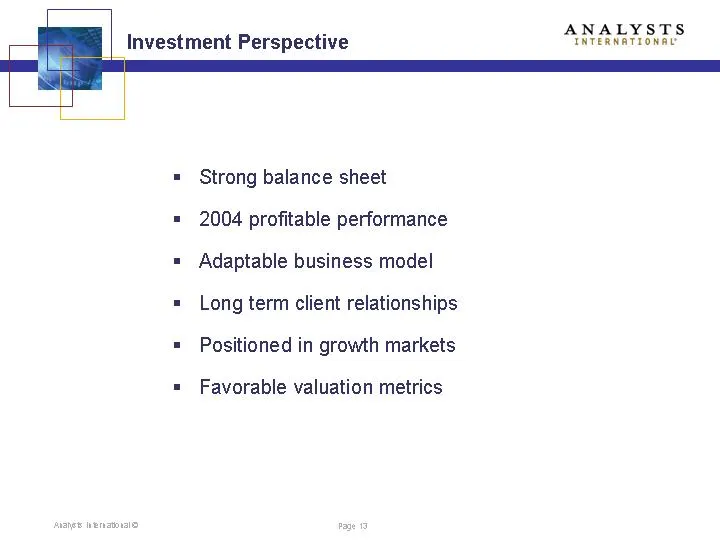
Slide 13: Investment Perspective
Investment Perspective = Strong balance sheet = 2004 profitable performance = Adaptable business model = Long term client relationships = Positioned in growth markets = Favorable valuation metrics

Slide 14: Link to searchable text of slides
Link to searchable text of slide shown abov e Searchable text section of graphics shown above [LOGO] Private & Confidential Safe Harbor Statement [LOGO] Statements contained herein, which are not strictly historical information, are forward-looking statements. Words such as “believes,” “intends,” “p
Source: SEC EDGAR · 8-K filed Dec 8, 2004
More decks from Analysts International Corp
 Shareholder Meeting (May 2011)20 slides · May 24, 2011
 Shareholder Meeting (May 2010)21 slides · May 25, 2010
 Shareholder Meeting (May 2008)40 slides · May 28, 2008
 Southwestern Showcase Investor Conference November 200621 slides · Nov 16, 2006
 ed Chip Conference August 200621 slides · Aug 15, 2006
 Investor Presentation (October 2005)16 slides · Oct 26, 2005