Analysts International — ed Chip Conference August 2006
21 slides from Analysts International's conference presentation, Aug 15, 2006
Slide 1: Analysts International Corporation – ed Chip Conference August 2006
Analysts International Corporation Jeffrey P. Baker President and Chief Executive Officer ed Chip Conference August 2006 Analysts International Corporation Jeffrey P. Baker President and Chief Executive Officer
Slide 2: Cautionary Statement for the Purpose of Safe Harbor Provisions
Cautionary Statement for the Purpose of Safe Harbor Provisions of the Private Securities Litigation Reform Act of 1995 This Presentation may contain forward-looking statements within the meaning of the safe harbor provisions of the Private Securities Litigation Reform Act of 1995. In some cases, for
Slide 3: Company Overview
Innovative Flexible Cost-Effective Company Overview
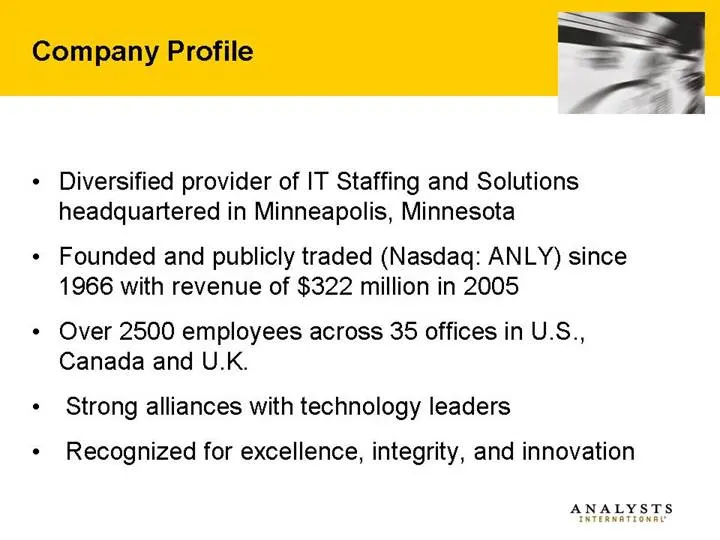
Slide 4: Company Profile
Company Profile Diversified provider of IT Staffing and Solutions headquartered in Minneapolis, Minnesota Founded and publicly traded (Nasdaq: ANLY) since 1966 with revenue of $322 million in 2005 Over 2500 employees across 35 offices in U.S., Canada and U.K. Strong alliances with technology leaders
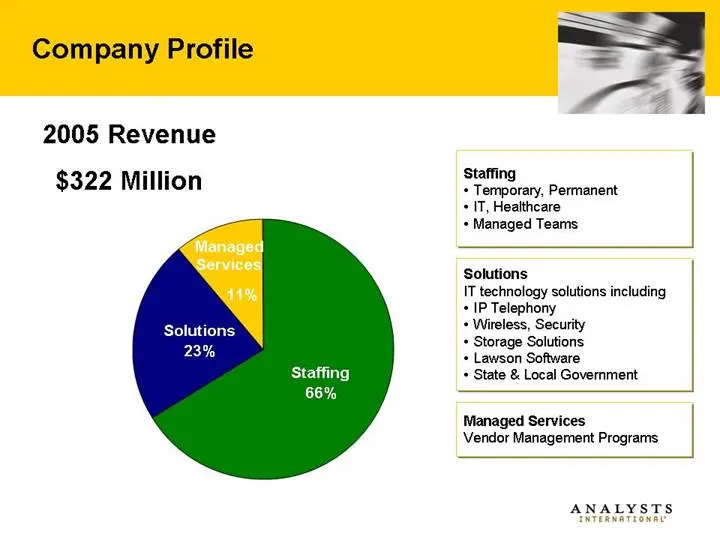
Slide 5: Company Profile: 2005 Revenue $322 Million
2005 Revenue $322 Million Company Profile Staffing Temporary, Permanent IT, Healthcare Managed Teams Solutions IT technology solutions including IP Telephony Wireless, Security Storage Solutions Lawson Software State & Local Government Managed Services Vendor Management Programs Staffing 66% Solutio
Slide 6: Analysts International's Clients
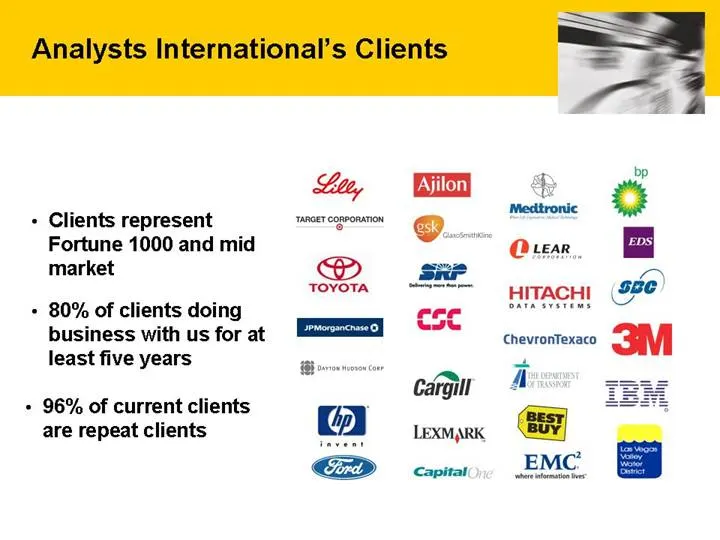
Analysts International’s Clients 80% of clients doing business with us for at least five years 96% of current clients are repeat clients Clients represent Fortune 1000 and mid market

Slide 7: Industry Overview
Innovative Flexible Cost-Effective Industry Overview
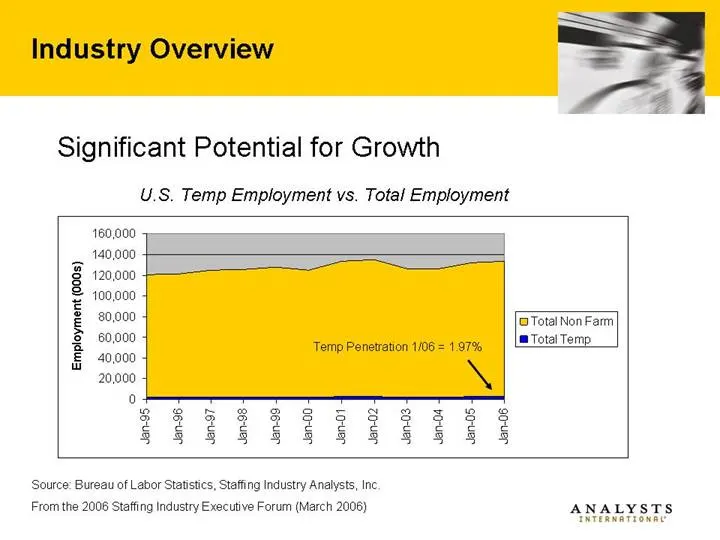
Slide 8: Industry Overview: Temp Employment vs. Total Employment
Industry Overview Source: Bureau of Labor Statistics, Staffing Industry Analysts, Inc. From the 2006 Staffing Industry Executive Forum (March 2006) Temp Penetration 1/06 = 1.97% Significant Potential for Growth U.S. Temp Employment vs. Total Employment 0 20,000 40,000 60,000 80,000 100,000 120,000 1
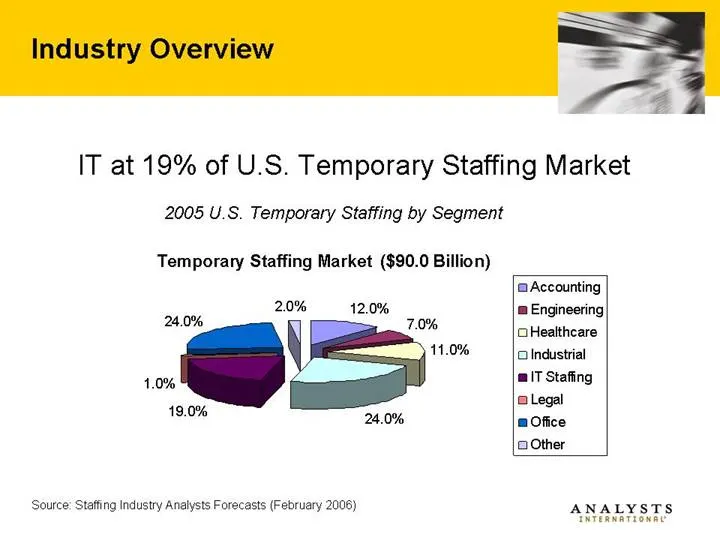
Slide 9: Industry Overview: IT at 19% of U.S. Temporary Staffing Market
Industry Overview IT at 19% of U.S. Temporary Staffing Market Source: Staffing Industry Analysts Forecasts (February 2006) 2005 U.S. Temporary Staffing by Segment Temporary Staffing Market ($90.0 Billion) 12.0% 7.0% 11.0% 24.0% 19.0% 1.0% 24.0% 2.0% Accounting Engineering Healthcare Industrial IT St
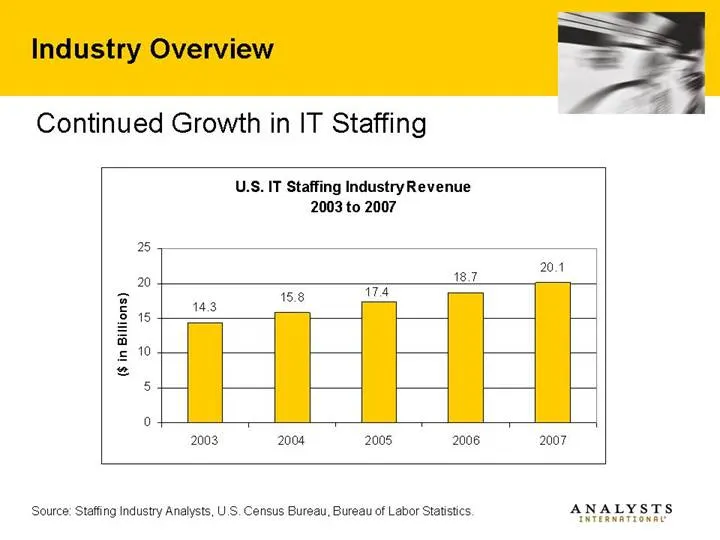
Slide 10: Industry Overview: Continued Growth in IT Staffing
Industry Overview Source: Staffing Industry Analysts, U.S. Census Bureau, Bureau of Labor Statistics. Continued Growth in IT Staffing U.S. IT Staffing Industry Revenue 2003 to 2007 14.3 15.8 18.7 20.1 17.4 0 5 10 15 20 25 2003 2004 2005 2006 2007 ($ in Billions)
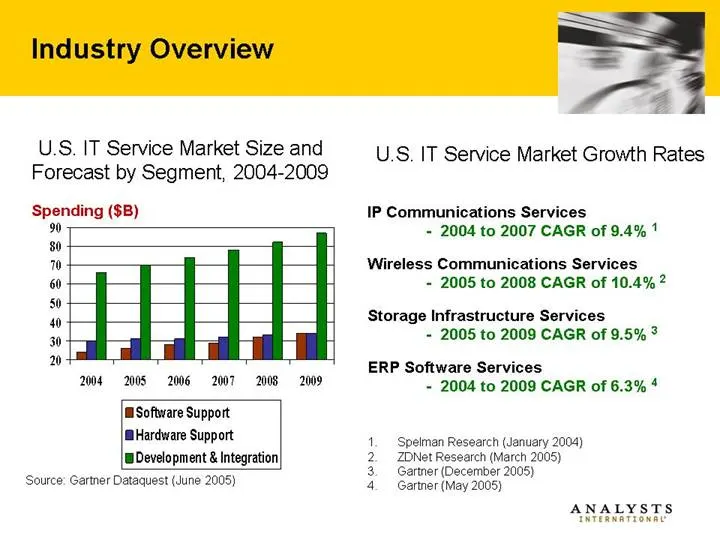
Slide 11: Industry Overview: U.S. IT Service Market Growth Rates
Industry Overview U.S. IT Service Market Growth Rates IP Communications Services - 2004 to 2007 CAGR of 9.4% 1 Wireless Communications Services - 2005 to 2008 CAGR of 10.4% 2 Storage Infrastructure Services - 2005 to 2009 CAGR of 9.5% 3 ERP Software Services - 2004 to 2009 CAGR of 6.3% 4 1. Spelman
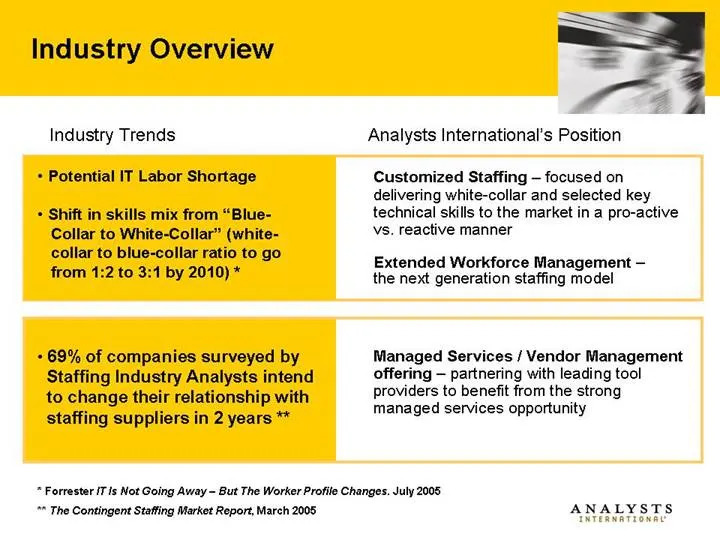
Slide 12: Industry Overview: Trends and Analysts International's Position
Industry Overview * Forrester IT Is Not Going Away – But The Worker Profile Changes. July 2005 ** The Contingent Staffing Market Report, March 2005 Managed Services / Vendor Management offering – partnering with leading tool providers to benefit from the strong managed services opportunity • 69% of
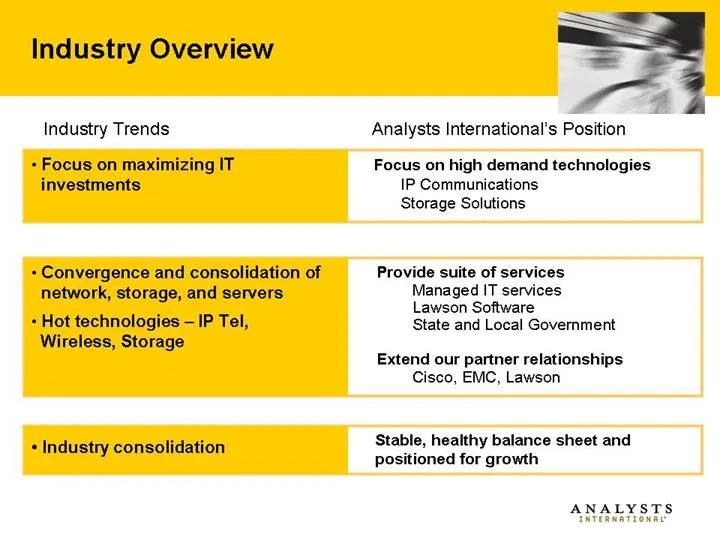
Slide 13: Industry Overview: Trends and Analysts International's Position
Industry Overview Provide suite of services Managed IT services Lawson Software State and Local Government Extend our partner relationships Cisco, EMC, Lawson Industry consolidation Convergence and consolidation of network, storage, and servers Hot technologies – IP Tel, Wireless, Storage Stable, he
Slide 14: Recent Events
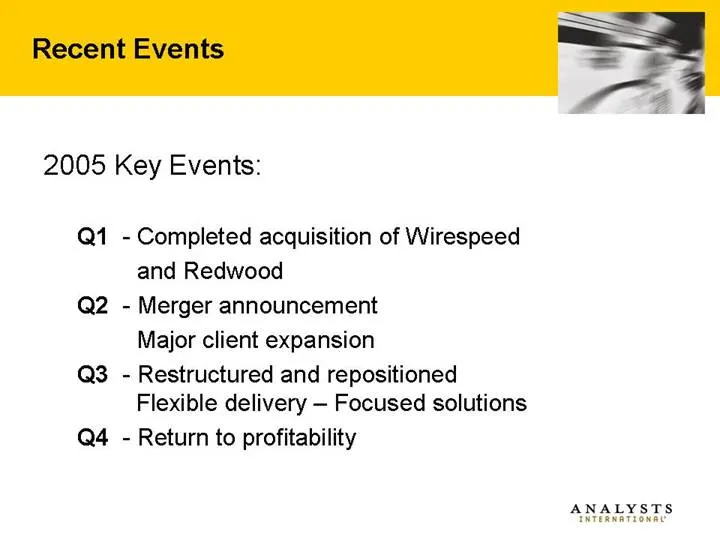
Recent Events 2005 Key Events: Q1 - Completed acquisition of Wirespeed and Redwood Q2 - Merger announcement Major client expansion Q3 - Restructured and repositioned Flexible delivery – Focused solutions Q4 - Return to profitability

Slide 15: Financial Overview
Innovative Flexible Cost-Effective Financial Overview
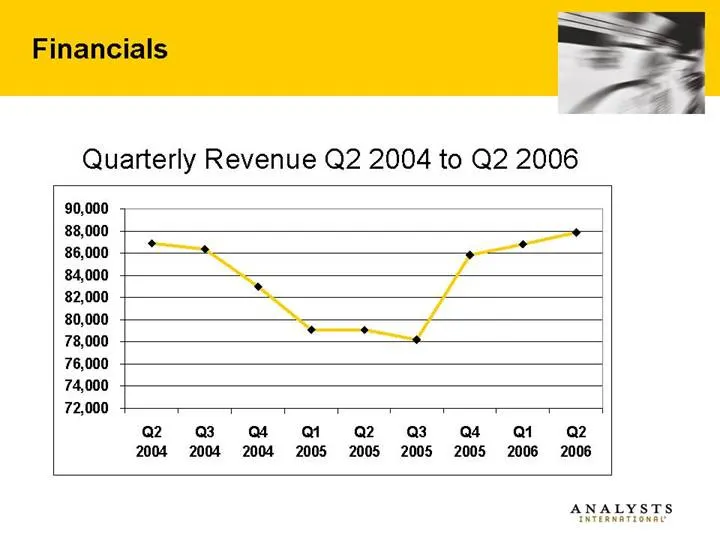
Slide 16: Financials: Quarterly Revenue Q2 2004 to Q2 2006
Financials Quarterly Revenue Q2 2004 to Q2 2006 72,000 74,000 76,000 78,000 80,000 82,000 84,000 86,000 88,000 90,000 Q2 2004 Q3 2004 Q4 2004 Q1 2005 Q2 2005 Q3 2005 Q4 2005 Q1 2006 Q2 2006
Slide 17: Financials: Q2 and Q1 2006
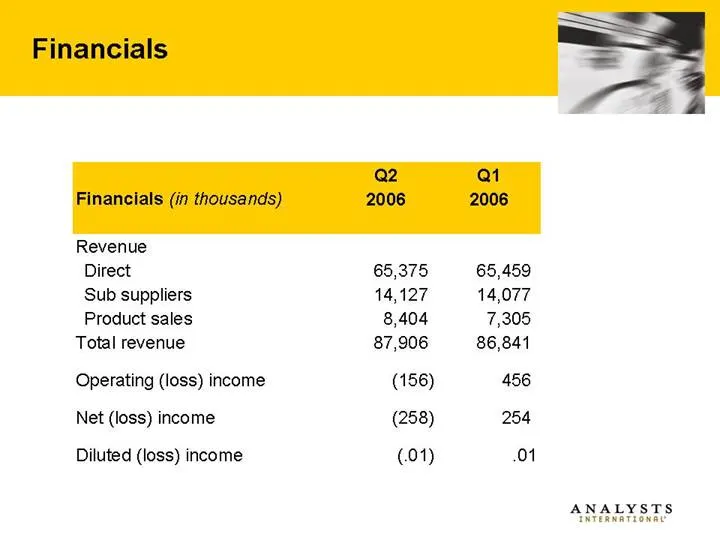
Financials Q2 Q1 Financials (in thousands) 2006 2006 Revenue Direct 65,375 65,459 Sub suppliers 14,127 14,077 Product sales 8,404 7,305 Total revenue 87,906 86,841 Operating (loss) income (156) 456 Net (loss) income (258) 254 Diluted (loss) income (.01) .01
Slide 18: Financials: Q2 2006 Balance Sheet
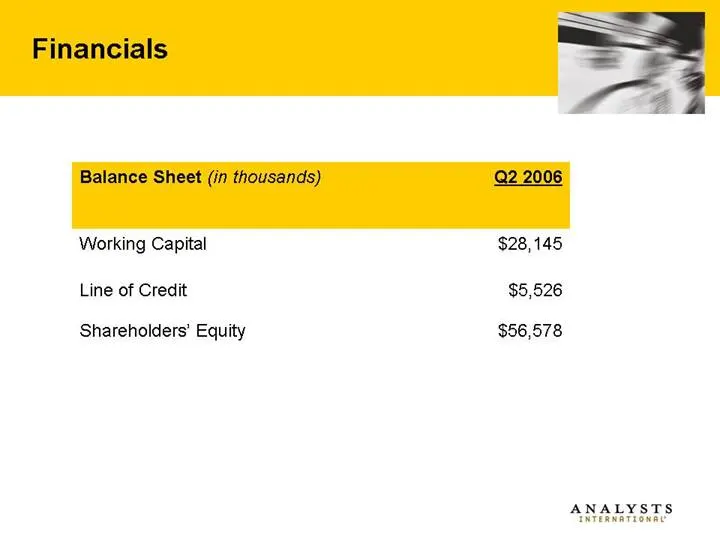
Financials $56,578 Shareholders’ Equity $5,526 Line of Credit $28,145 Working Capital Q2 2006 Balance Sheet (in thousands)

Slide 19: Analysts International's Direction
Innovative Flexible Cost-Effective Analysts International’s Direction
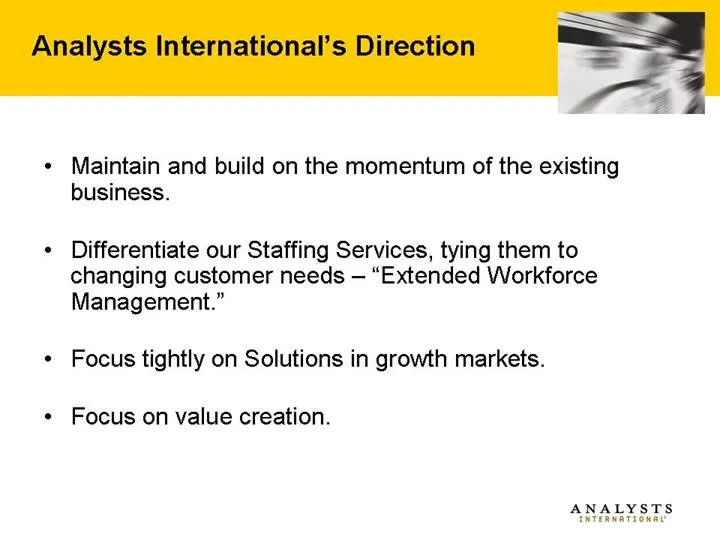
Slide 20: Analysts International's Direction
Analysts International’s Direction Maintain and build on the momentum of the existing business. Differentiate our Staffing Services, tying them to changing customer needs – “Extended Workforce Management.” Focus tightly on Solutions in growth markets. Focus on value creation.

Slide 21: Analysts International
Innovative Flexible Cost-Effective Analysts International
Source: SEC EDGAR · 8-K filed Aug 15, 2006
More decks from Analysts International Corp
 Shareholder Meeting (May 2011)20 slides · May 24, 2011
 Shareholder Meeting (May 2010)21 slides · May 25, 2010
 Shareholder Meeting (May 2008)40 slides · May 28, 2008
 Southwestern Showcase Investor Conference November 200621 slides · Nov 16, 2006
 Investor Presentation (October 2005)16 slides · Oct 26, 2005
 Merger or Acquisition (August 2005)22 slides · Aug 17, 2005