Bellway p.l.c. · LSE:BWY
Bellway p.l.c — FY2022 Earnings Presentation
99 slides from Bellway p.l.c's earnings presentation, October 2022
Slide 1: Results Presentation Year ended 31 July 2022
Results Presentation Year ended 31 July 2022
Slide 2: Agenda
Agenda 1. Introduction 2. Finance review 3. Operating review 4. Q&A 5. Appendices Unless otherwise stated, all numbers throughout this presentation excludes the Group’s share of its joint ventures. Results presentation Results presentation1816 October 2022 October 2018 - Page 2 -
Slide 3: Introduction
Introduction Jason Honeyman Chief Executive Results presentation Results presentation1816 October 2022 October 2018 - Page 3 -
Slide 4: Highlights
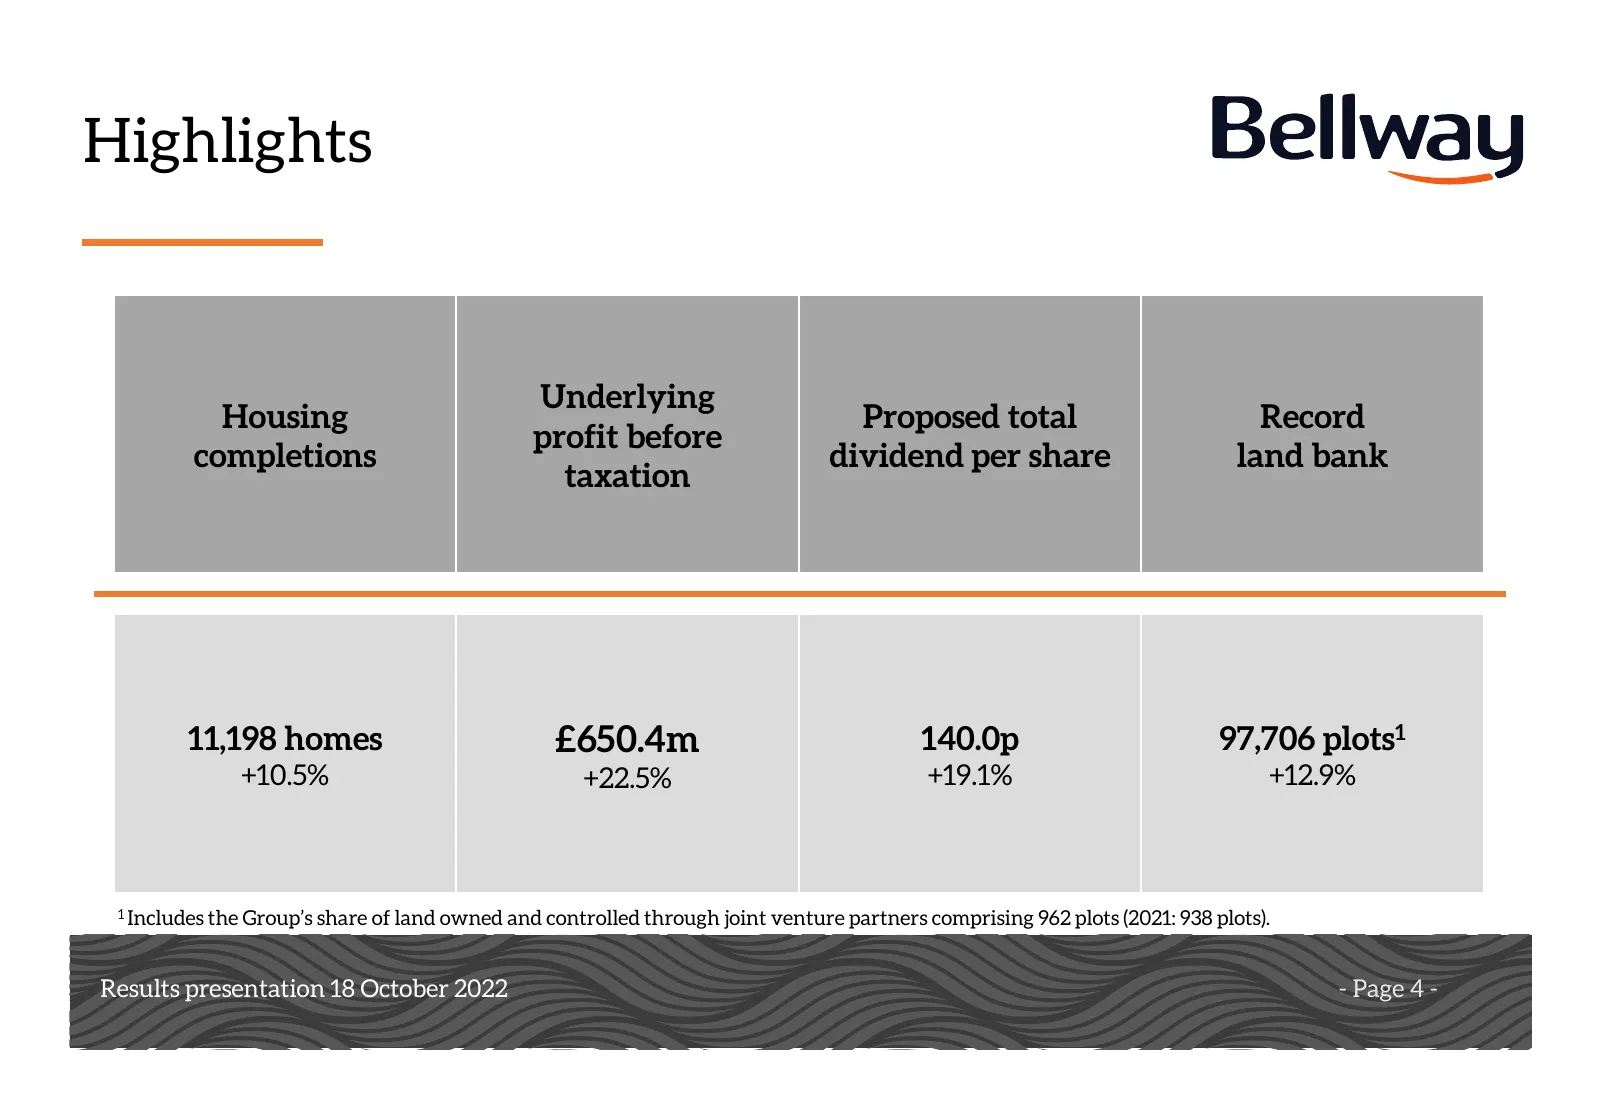
Highlights Underlying Housing Proposed total Record profit before completions dividend per share land bank taxation 11,198 homes £650.4m 140.0p 97,706 plots1 +10.5% +22.5% +19.1% +12.9% 1 Includes the Group’s share of land owned and controlled through joint venture partners comprising 962 plots (202

Slide 5: Notes
Notes Results presentation Results presentation1816 October 2022 October 2018 - Page 5 -
Slide 6: Strategic priorities
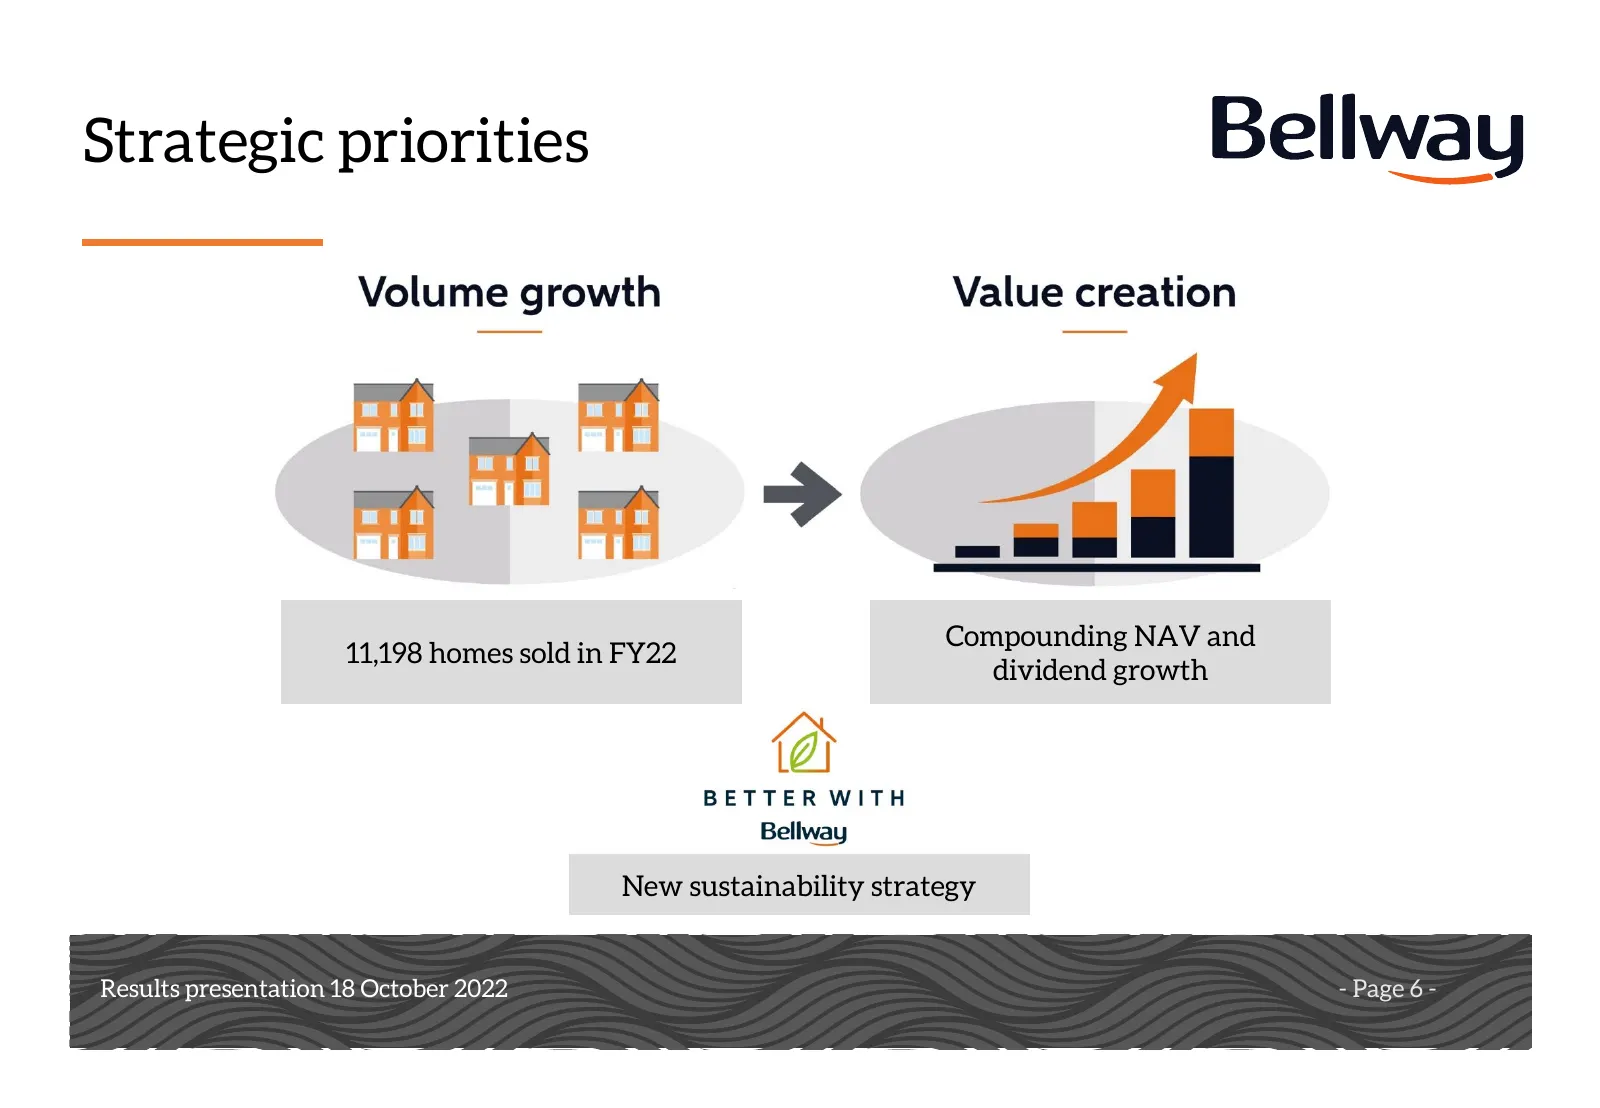
Strategic priorities Compounding NAV and 11,198 homes sold in FY22 dividend growth New sustainability strategy Results presentation Results presentation1816 October 2022 October 2018 - Page 6 -

Slide 7: Notes
Notes Results presentation Results presentation1816 October 2022 October 2018 - Page 7 -
Slide 8: Resilience and long-term growth
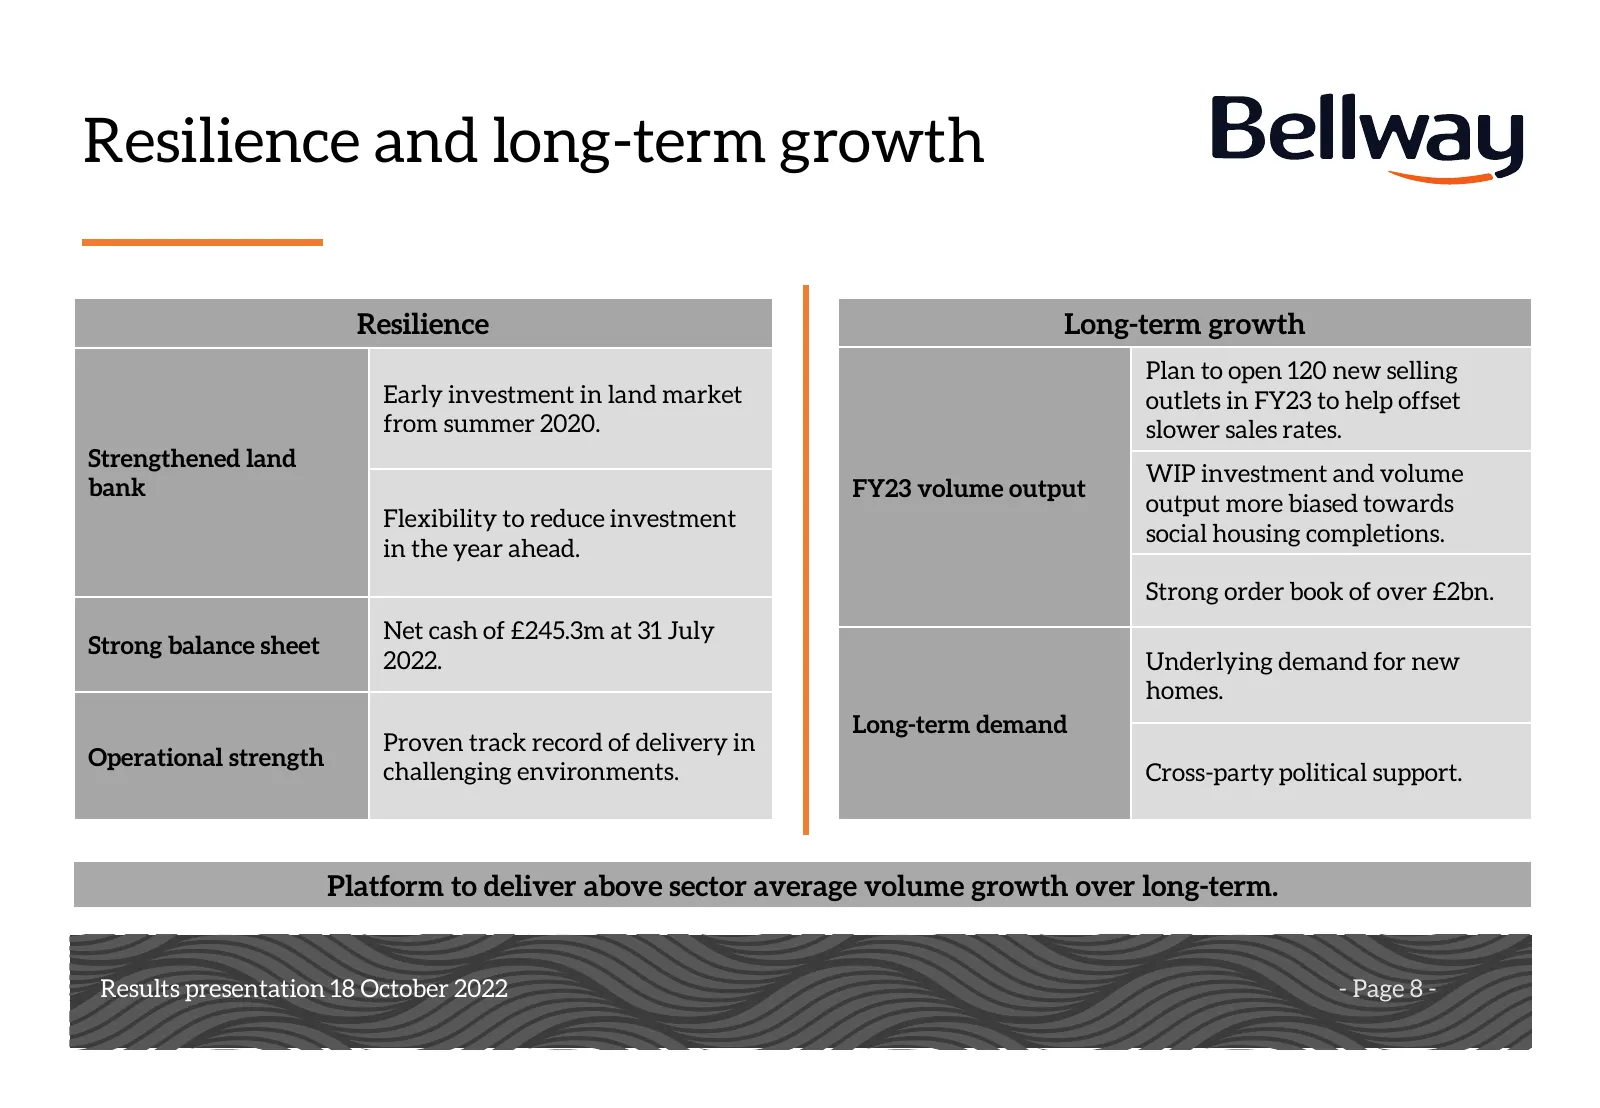
Resilience and long-term growth Resilience Long-term growth Plan to open 120 new selling Early investment in land market outlets in FY23 to help offset from summer 2020. slower sales rates. Strengthened land WIP investment and volume bank FY23 volume output output more biased towards Flexibility to

Slide 9: Notes
Notes Results presentation Results presentation1816 October 2022 October 2018 - Page 9 -
Slide 10: Finance review
Finance review Keith Adey Finance Director Results presentation Results presentation1816 October 2022 October 2018 - Page 10 -

Slide 11: Notes
Notes Results presentation Results presentation1816 October 2022 October 2018 - Page 11 -
Slide 12: Strong financial performance
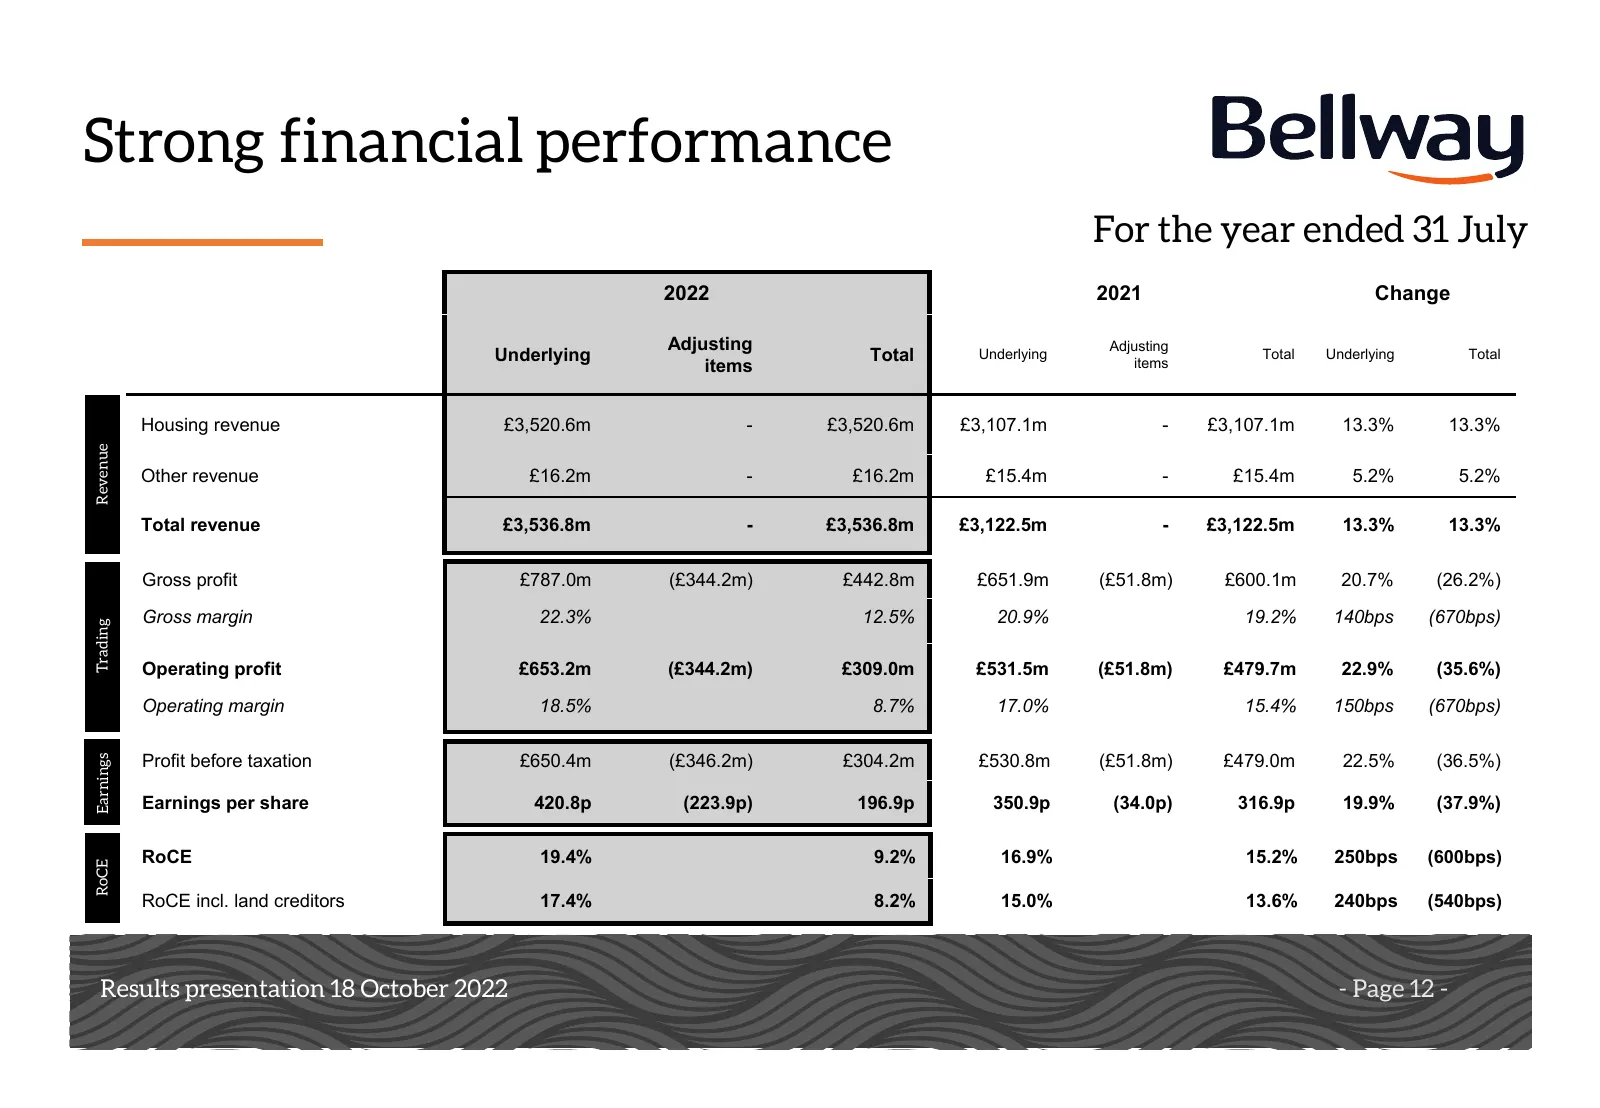
Strong financial performance For the year ended 31 July 2022 2021 Change Adjusting Adjusting Underlying Total Underlying Total Underlying Total items items Housing revenue £3,520.6m - £3,520.6m £3,107.1m - £3,107.1m 13.3% 13.3% Revenue Other revenue £16.2m - £16.2m £15.4m - £15.4m 5.2% 5.2% Total re

Slide 13: Notes
Notes Results presentation Results presentation1816 October 2022 October 2018 - Page 13 -
Slide 14: Record housing revenue
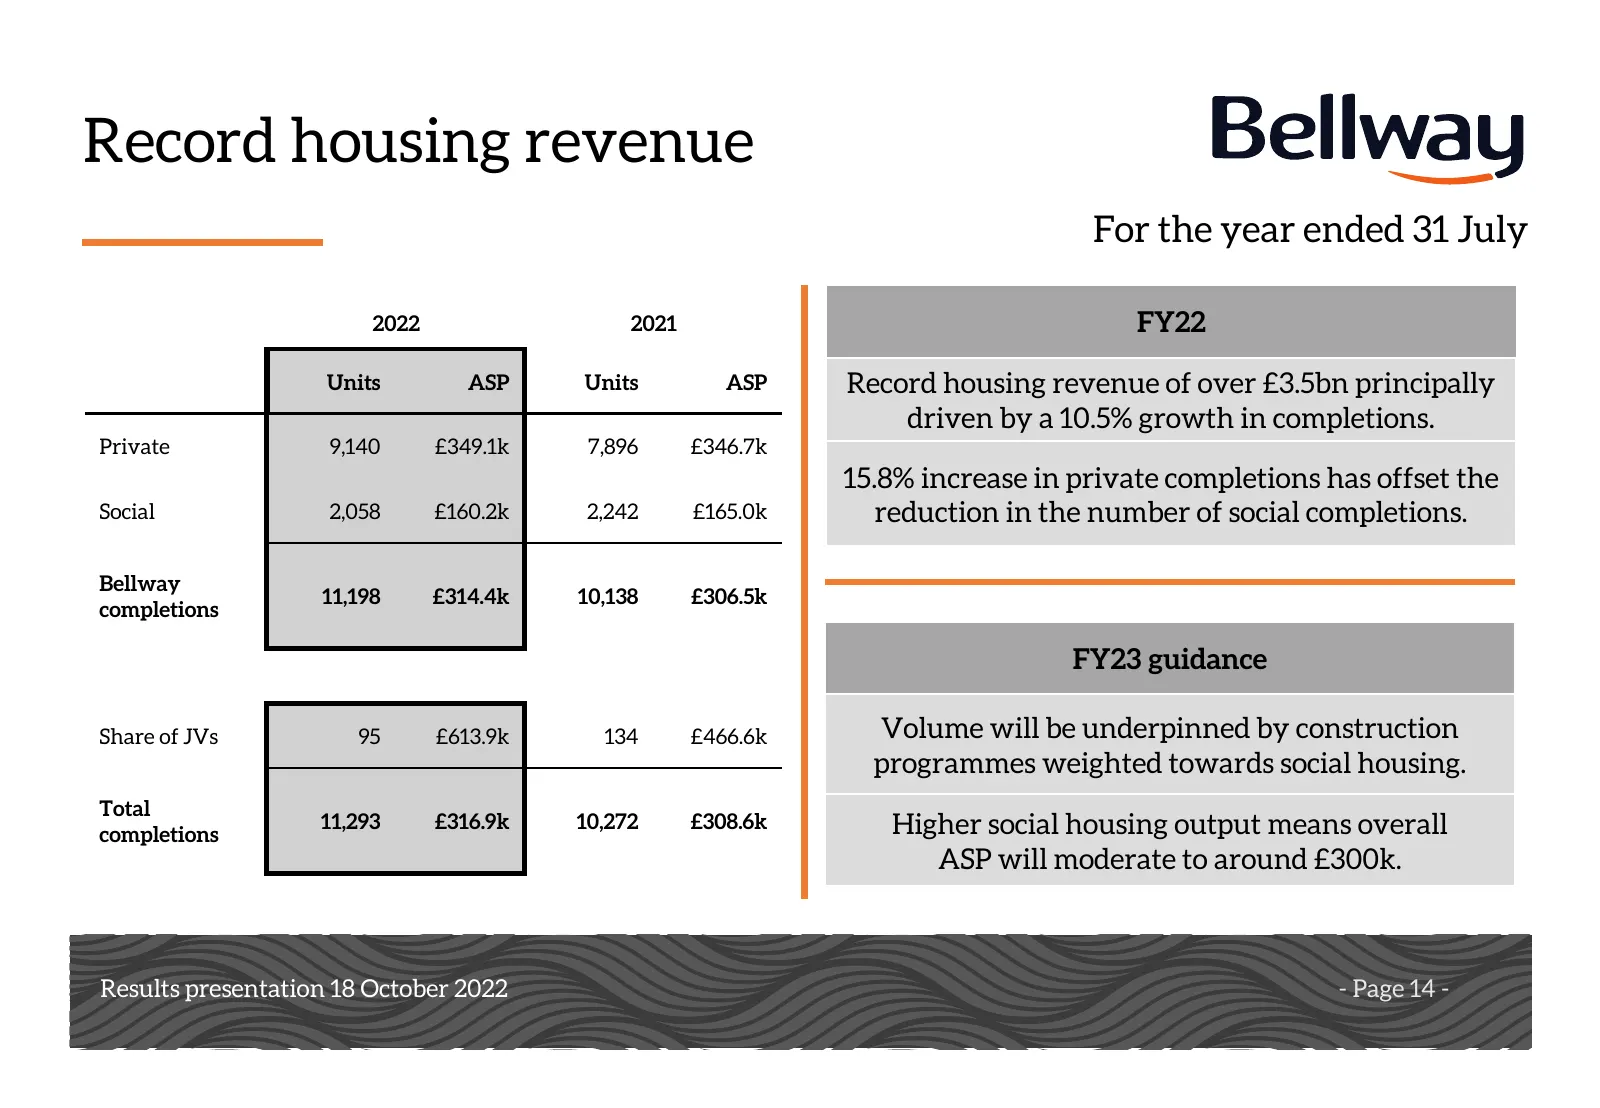
Record housing revenue For the year ended 31 July 2022 2021 FY22 Units ASP Units ASP Record housing revenue of over £3.5bn principally driven by a 10.5% growth in completions. Private 9,140 £349.1k 7,896 £346.7k 15.8% increase in private completions has offset the Social 2,058 £160.2k 2,242 £165.0k

Slide 15: Notes
Notes Results presentation Results presentation1816 October 2022 October 2018 - Page 15 -
Slide 16: Three brands and wide geographic presence
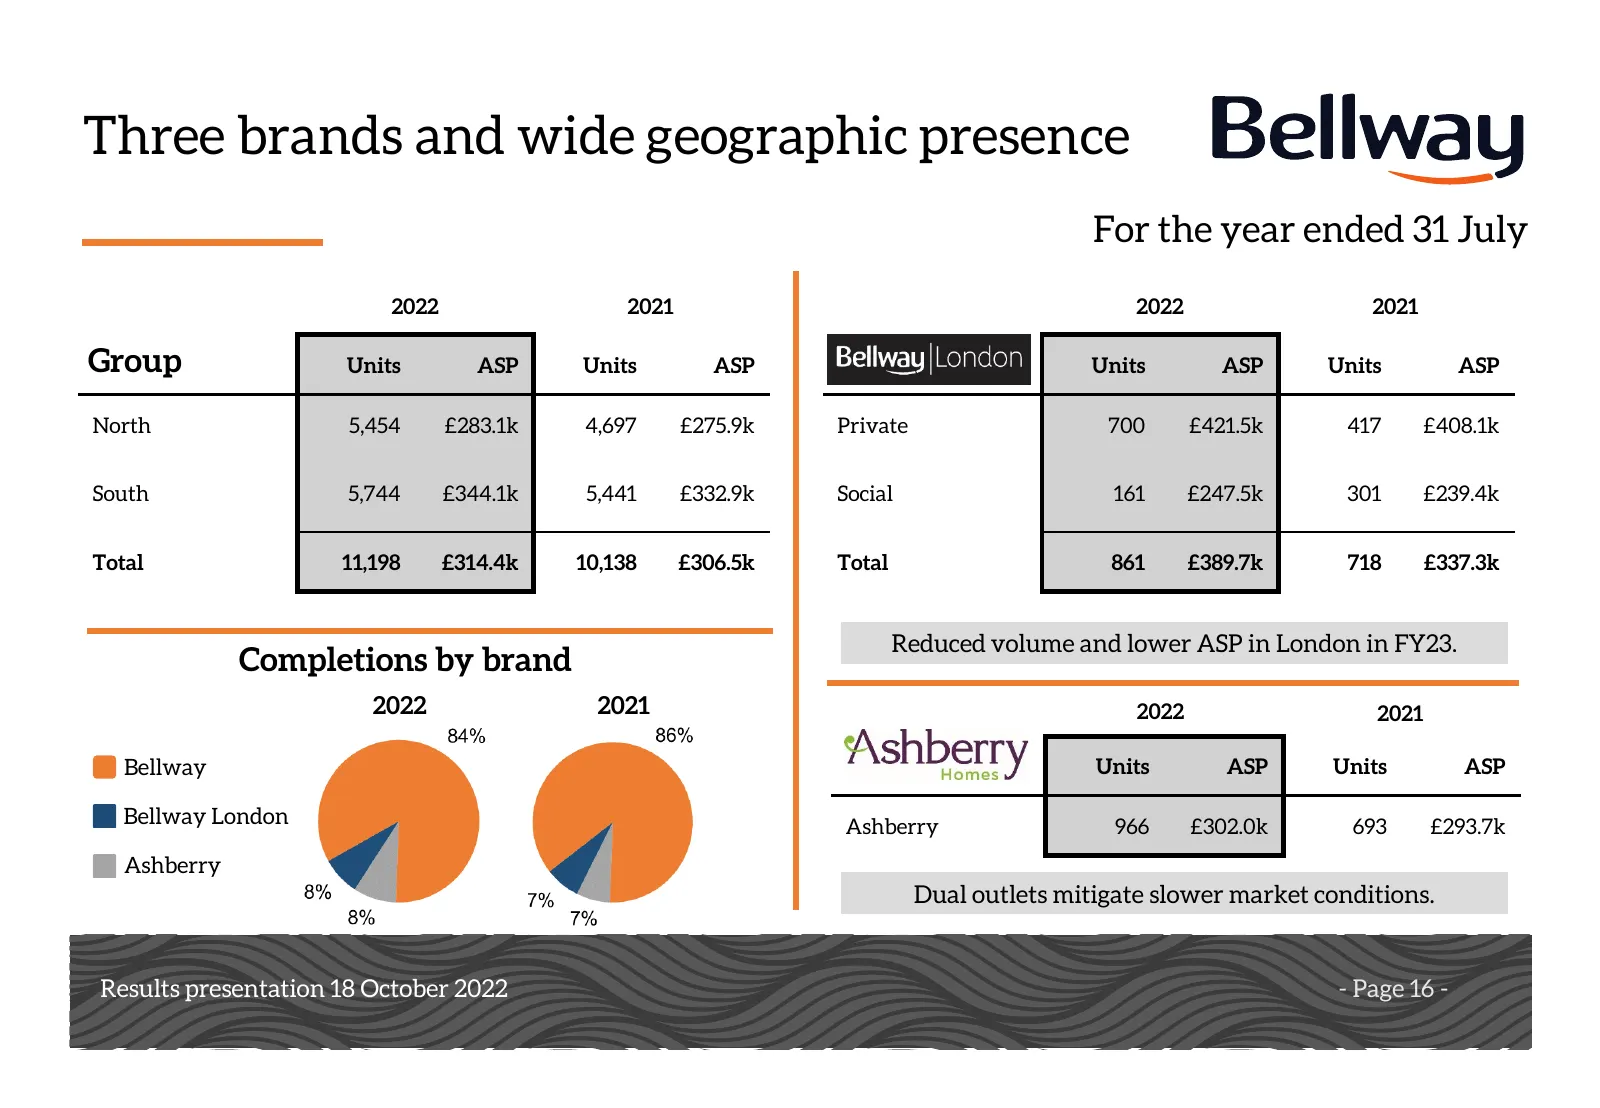
Three brands and wide geographic presence For the year ended 31 July 2022 2021 2022 2021 Group Units ASP Units ASP Units ASP Units ASP North 5,454 £283.1k 4,697 £275.9k Private 700 £421.5k 417 £408.1k South 5,744 £344.1k 5,441 £332.9k Social 161 £247.5k 301 £239.4k Total 11,198 £314.4k 10,138 £306.5

Slide 17: Notes
Notes Results presentation Results presentation1816 October 2022 October 2018 - Page 17 -
Slide 18: Good operating performance
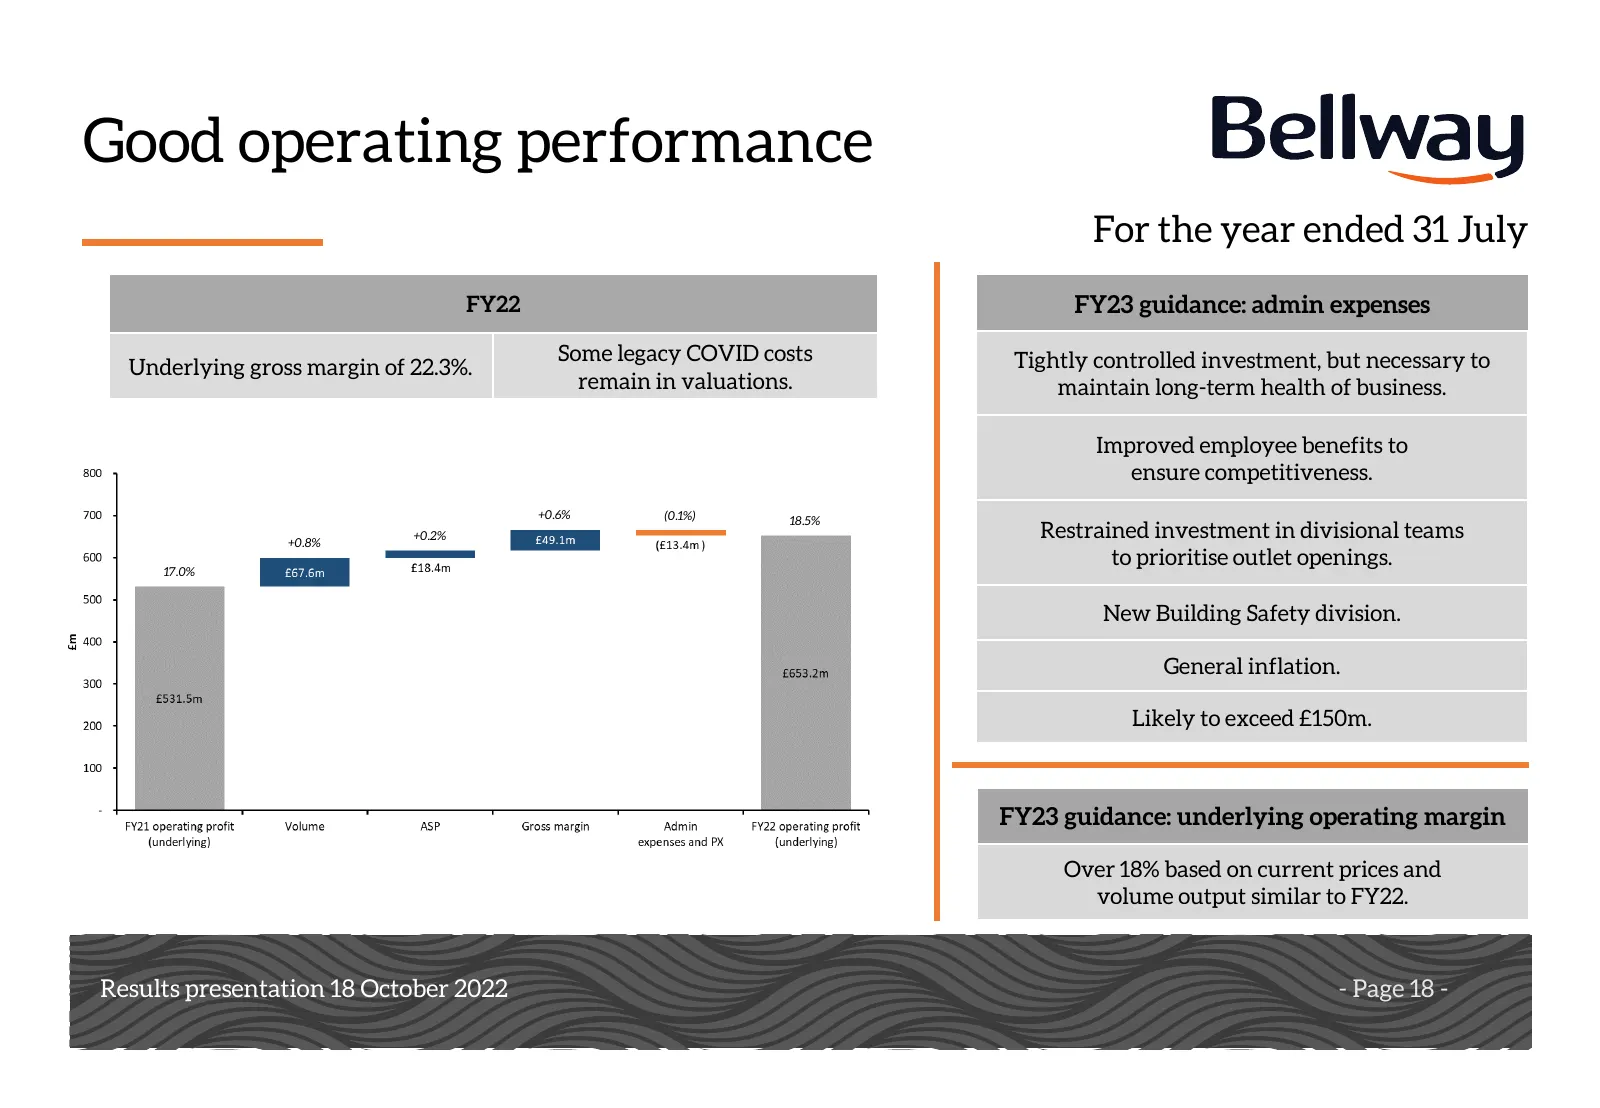
Good operating performance For the year ended 31 July FY22 FY23 guidance: admin expenses Some legacy COVID costs Tightly controlled investment, but necessary to Underlying gross margin of 22.3%. remain in valuations. maintain long-term health of business. Improved employee benefits to ensure competi

Slide 19: Notes
Notes Results presentation Results presentation1816 October 2022 October 2018 - Page 19 -
Slide 20: Further growth in underlying earnings
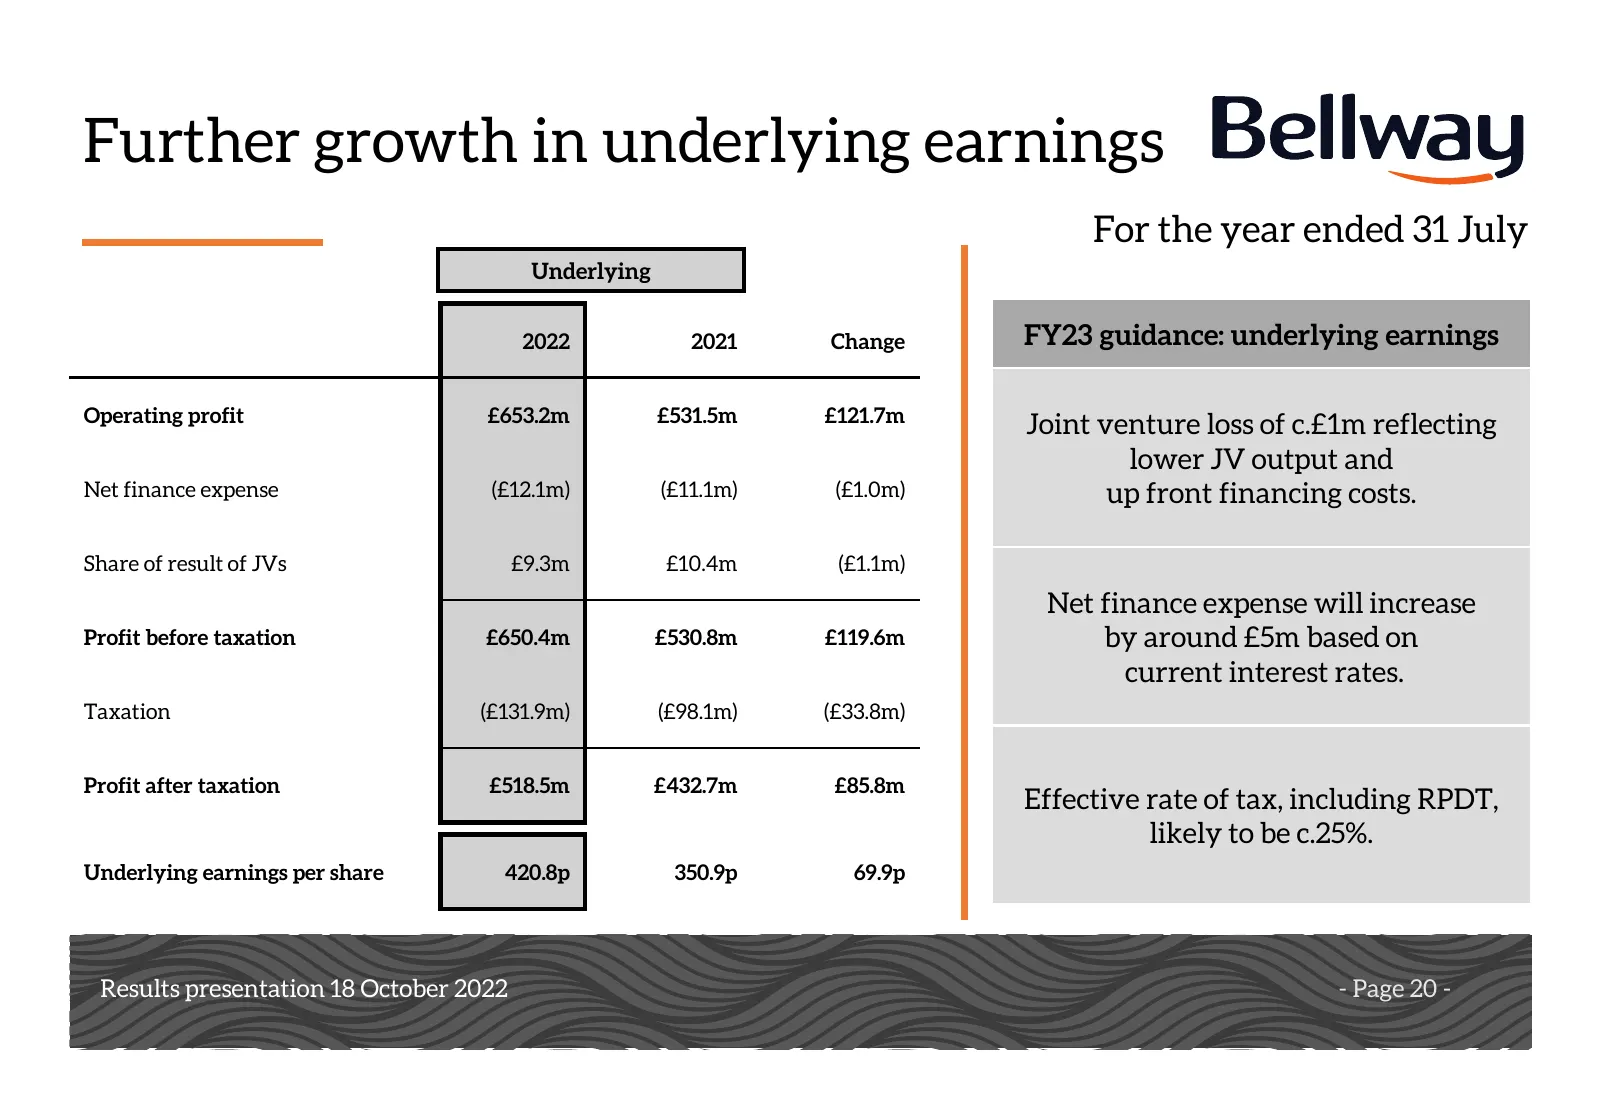
Further growth in underlying earnings For the year ended 31 July Underlying 2022 2021 Change FY23 guidance: underlying earnings Operating profit £653.2m £531.5m £121.7m Joint venture loss of c.£1m reflecting lower JV output and Net finance expense (£12.1m) (£11.1m) (£1.0m) up front financing costs.

Slide 21: Notes
Notes Results presentation Results presentation1816 October 2022 October 2018 - Page 21 -
Slide 22: Building safety pledge
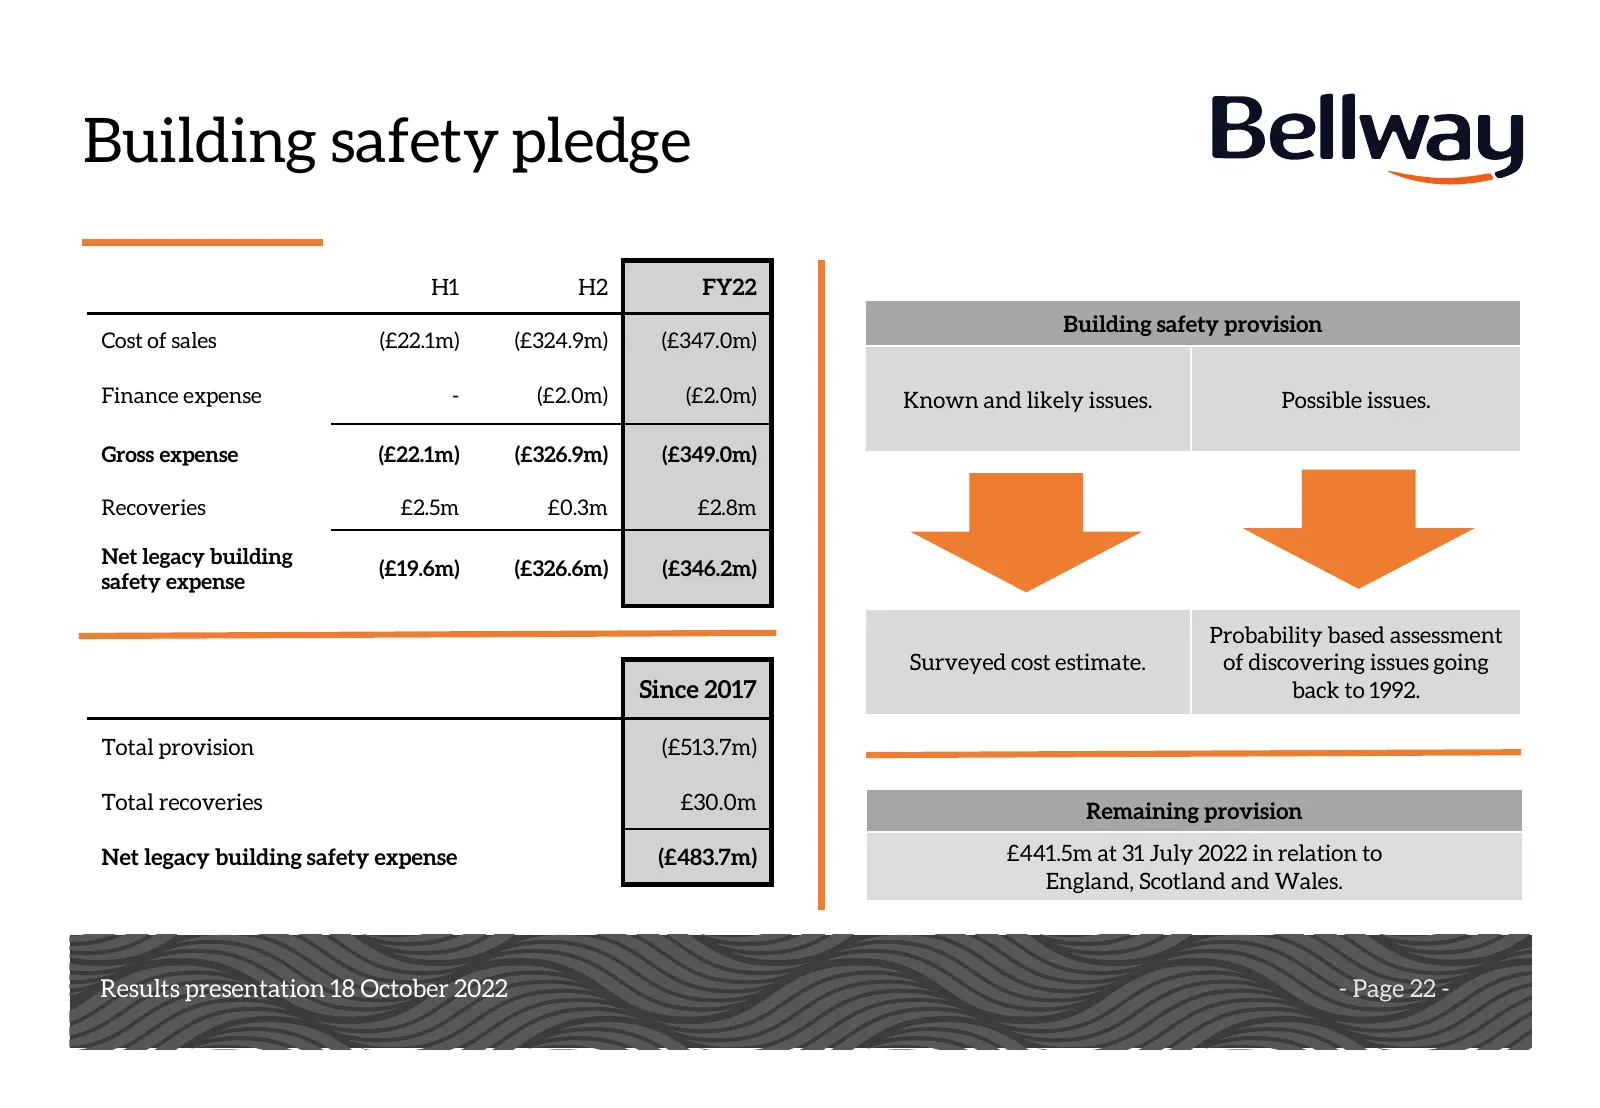
Building safety pledge H1 H2 FY22 Building safety provision Cost of sales (£22.1m) (£324.9m) (£347.0m) Finance expense - (£2.0m) (£2.0m) Known and likely issues. Possible issues. Gross expense (£22.1m) (£326.9m) (£349.0m) Recoveries £2.5m £0.3m £2.8m Net legacy building (£19.6m) (£326.6m) (£346.2m)

Slide 23: Notes
Notes Results presentation Results presentation1816 October 2022 October 2018 - Page 23 -
Slide 24: A responsible approach to building safety
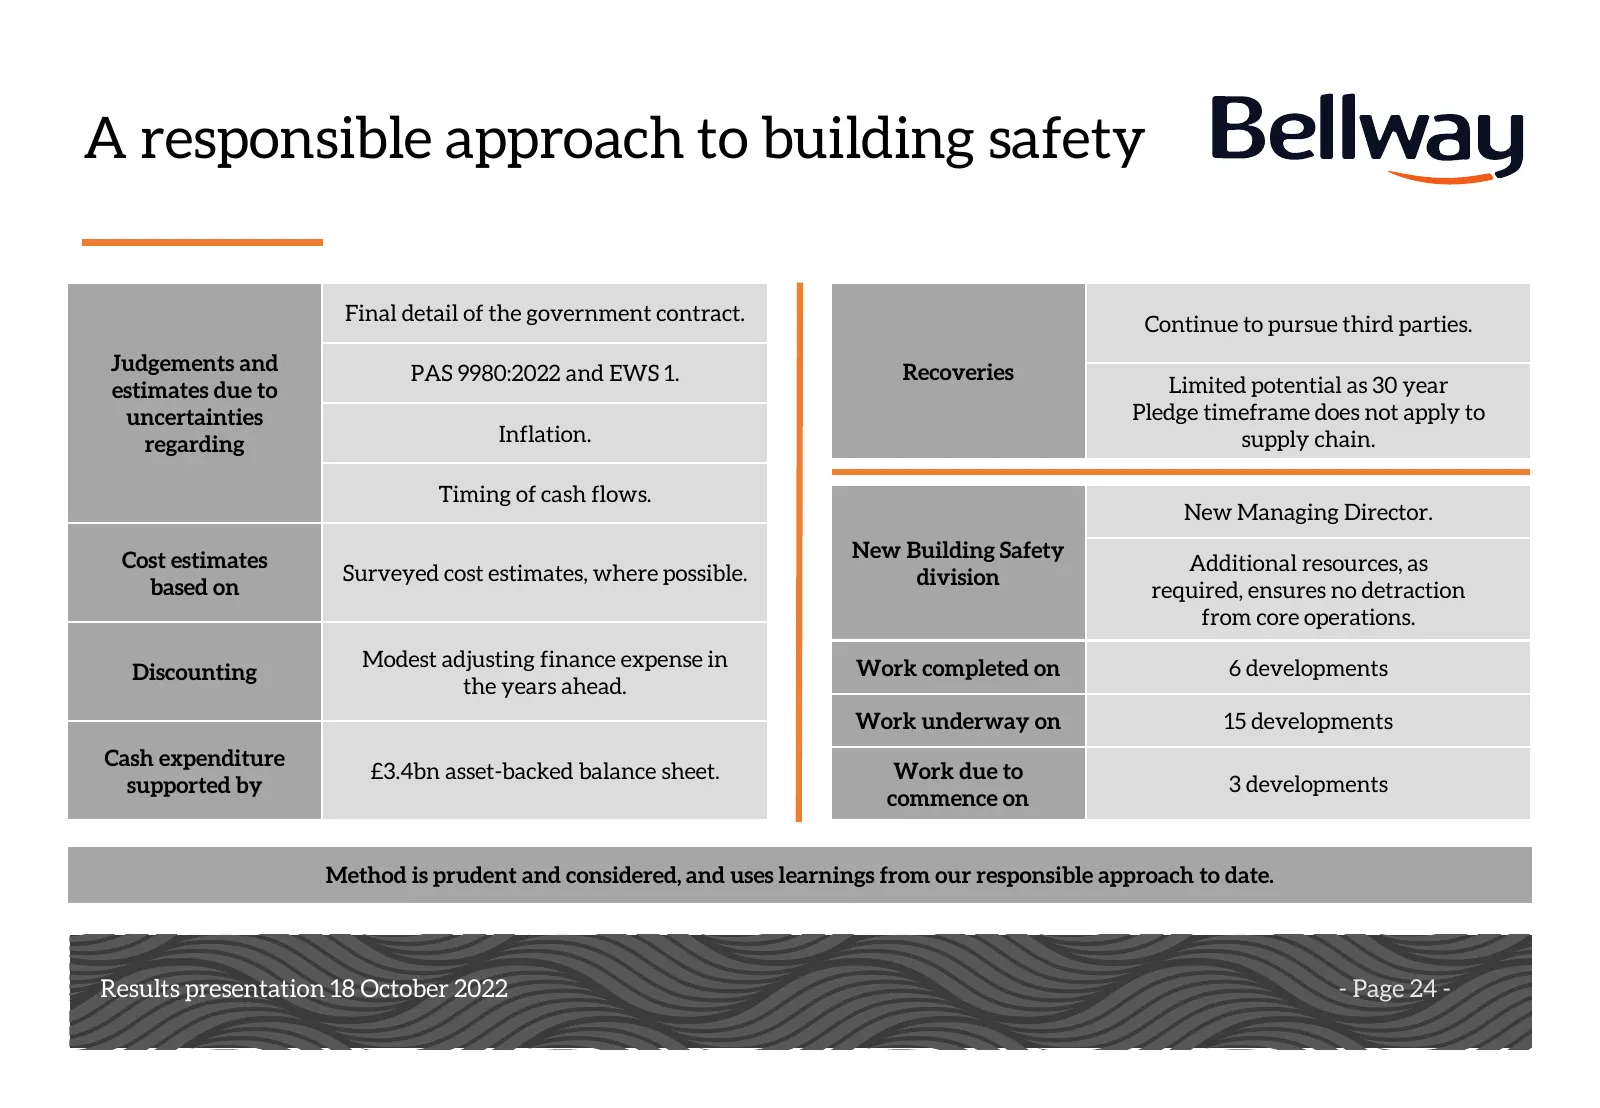
A responsible approach to building safety Final detail of the government contract. Continue to pursue third parties. Judgements and PAS 9980:2022 and EWS 1. Recoveries estimates due to Limited potential as 30 year uncertainties Pledge timeframe does not apply to regarding Inflation. supply chain. Ti

Slide 25: Notes
Notes Results presentation Results presentation1816 October 2022 October 2018 - Page 25 -
Slide 26: A strong balance sheet
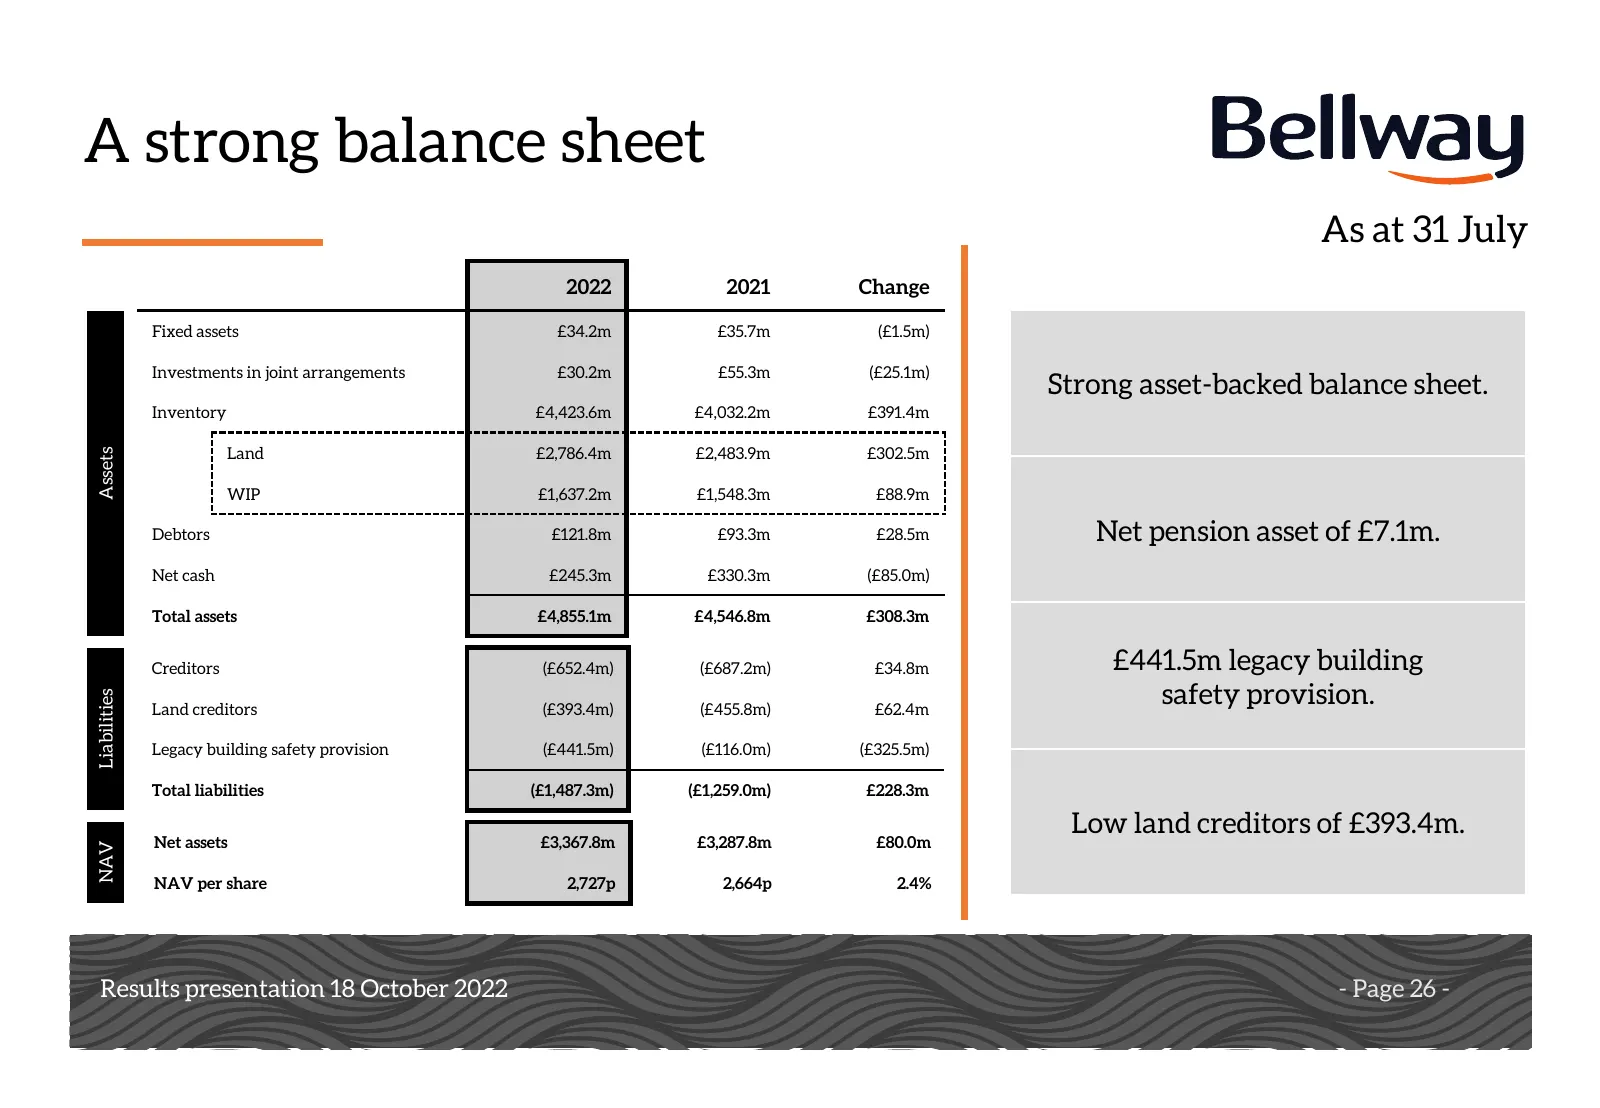
A strong balance sheet As at 31 July 2022 2021 Change Fixed assets £34.2m £35.7m (£1.5m) Investments in joint arrangements £30.2m £55.3m (£25.1m) Strong asset-backed balance sheet. Inventory £4,423.6m £4,032.2m £391.4m Land £2,786.4m £2,483.9m £302.5m Assets WIP £1,637.2m £1,548.3m £88.9m Debtors £1

Slide 27: Notes
Notes Results presentation Results presentation1816 October 2022 October 2018 - Page 27 -
Slide 28: Strengthened overall land bank
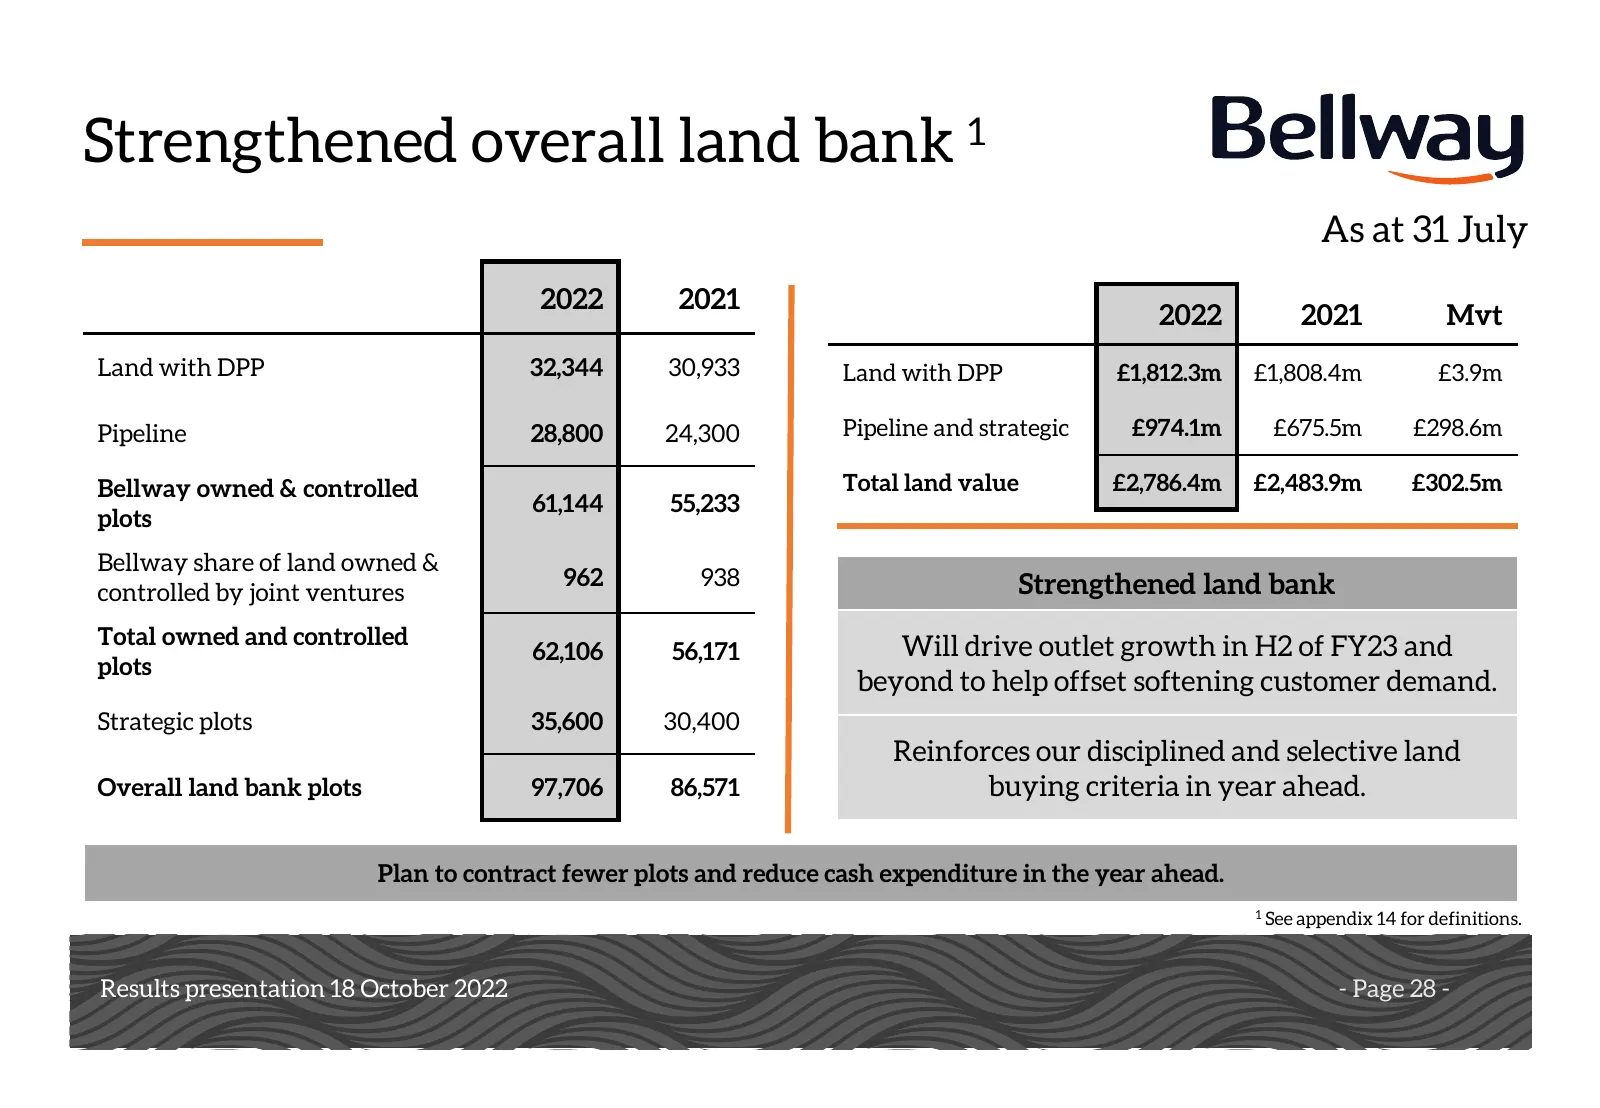
Strengthened overall land bank 1 As at 31 July 2022 2021 2022 2021 Mvt Land with DPP 32,344 30,933 Land with DPP £1,812.3m £1,808.4m £3.9m Pipeline 28,800 24,300 Pipeline and strategic £974.1m £675.5m £298.6m Bellway owned & controlled Total land value £2,786.4m £2,483.9m £302.5m 61,144 55,233 plots

Slide 29: Notes
Notes Results presentation Results presentation1816 October 2022 October 2018 - Page 29 -
Slide 30: Focused investment in work-in-progress
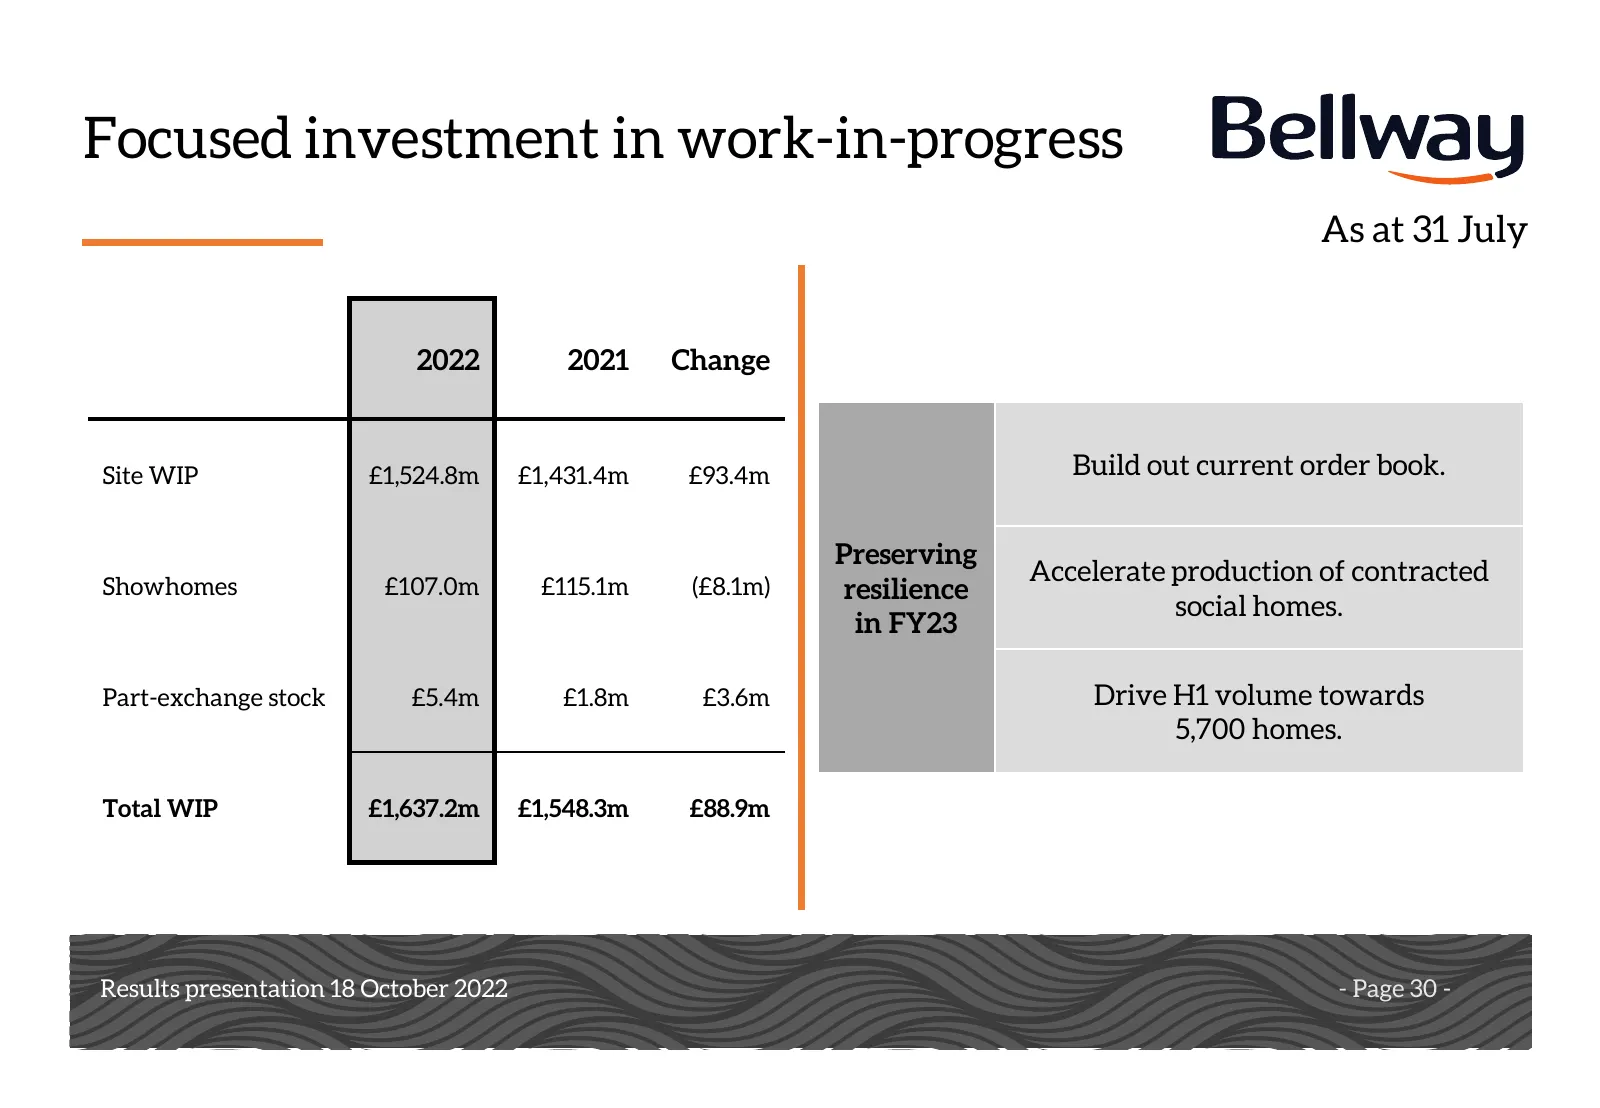
Focused investment in work-in-progress As at 31 July 2022 2021 Change Site WIP £1,524.8m £1,431.4m £93.4m Build out current order book. Preserving Accelerate production of contracted Showhomes £107.0m £115.1m (£8.1m) resilience social homes. in FY23 Part-exchange stock £5.4m £1.8m £3.6m Drive H1 vol

Slide 31: Notes
Notes Results presentation Results presentation1816 October 2022 October 2018 - Page 31 -
Slide 32: Strong cash balance provides resilience
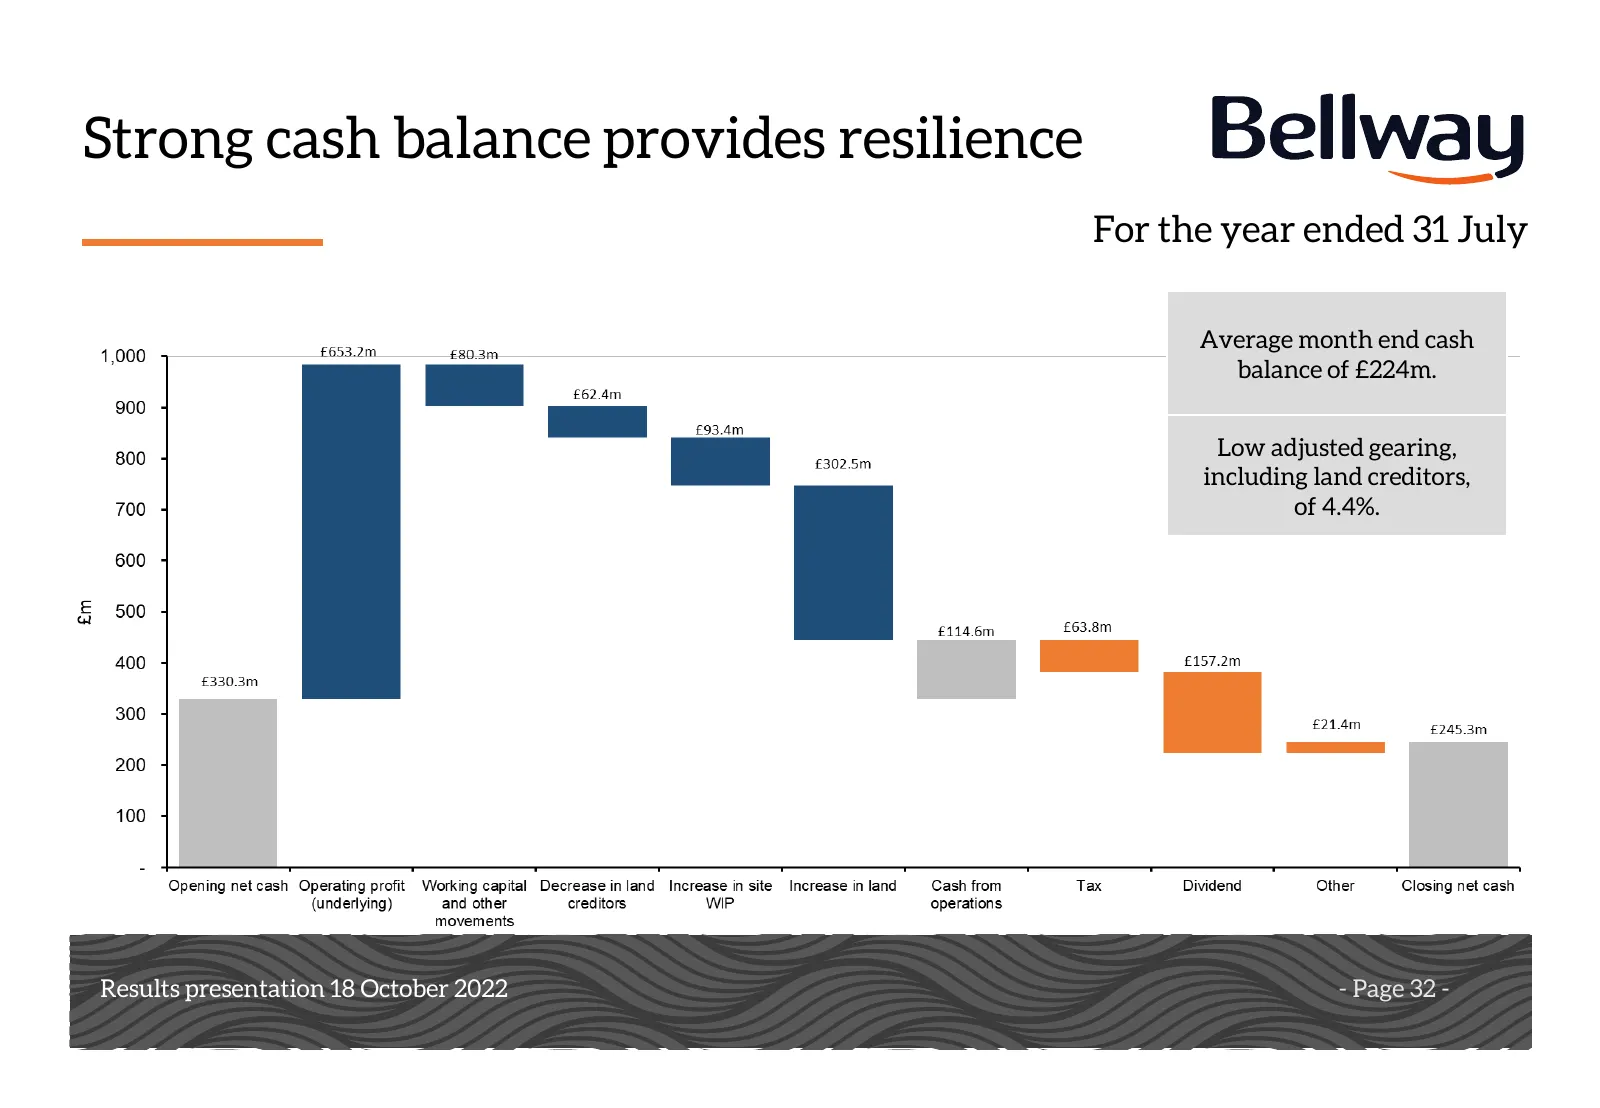
Strong cash balance provides resilience For the year ended 31 July Average month end cash balance of £224m. Low adjusted gearing, including land creditors, of 4.4%. Results presentation Results presentation1816 October 2022 October 2018 - Page 32 -

Slide 33: Notes
Notes Results presentation Results presentation1816 October 2022 October 2018 - Page 33 -
Slide 34: Prioritising cash and preserving value
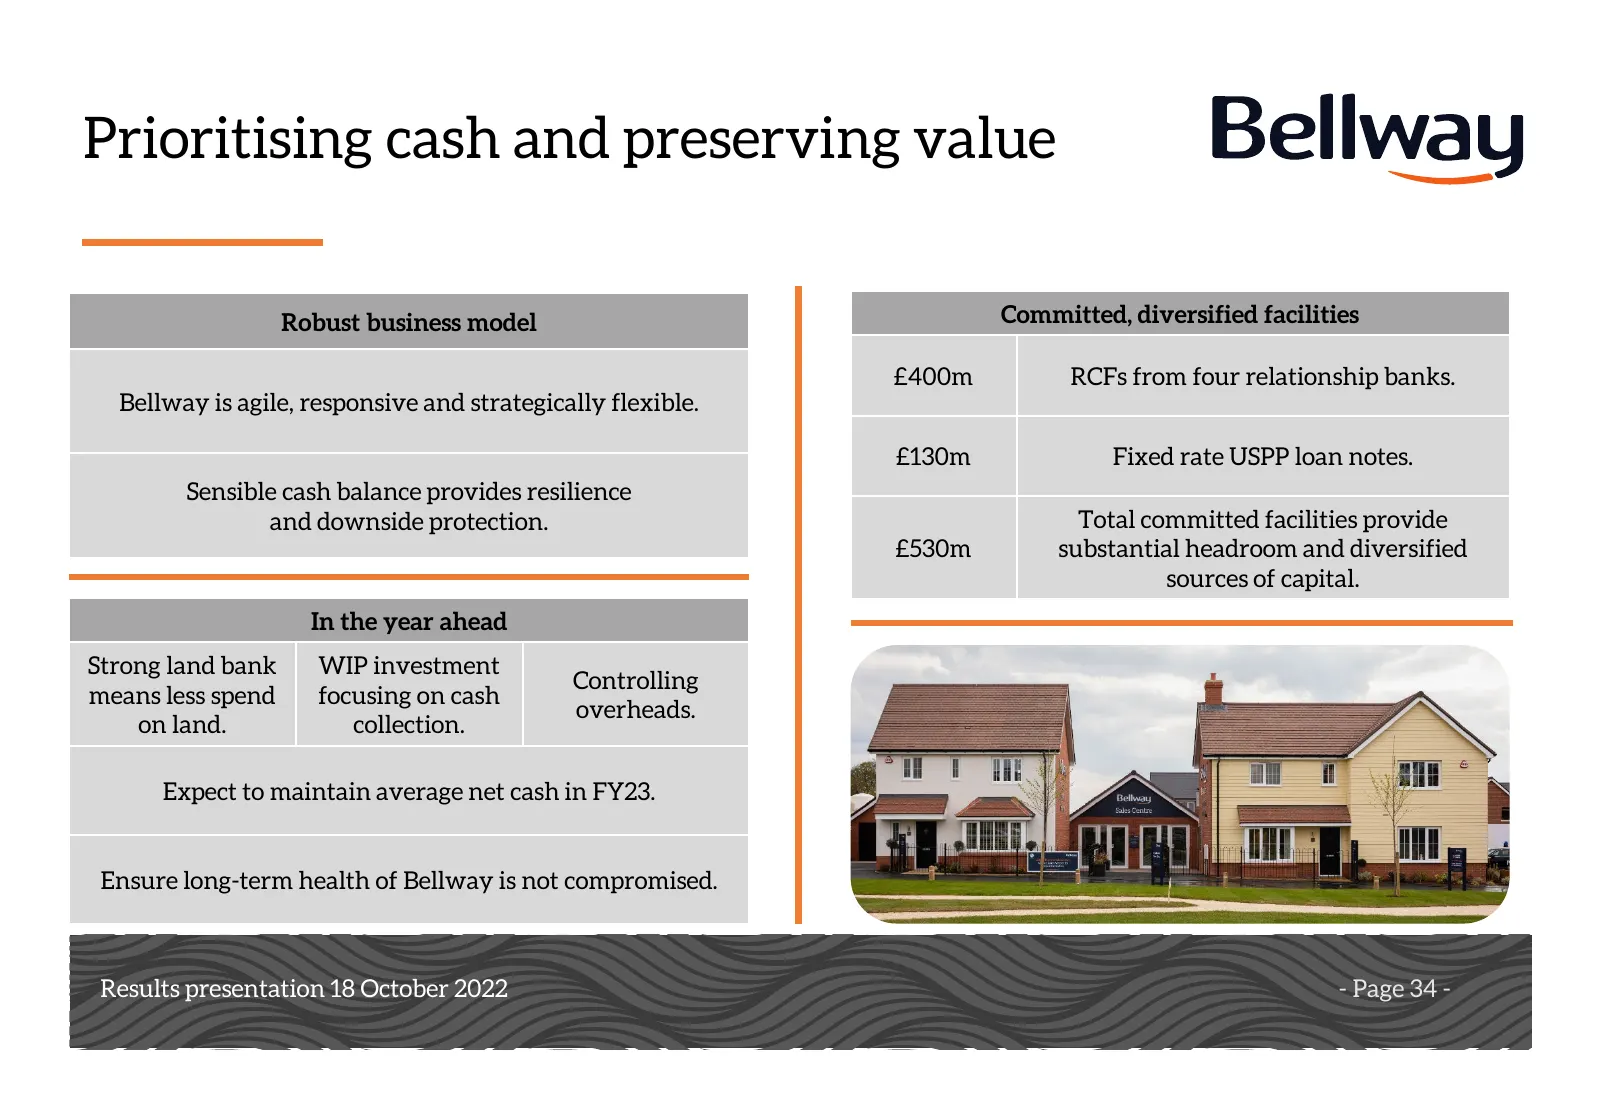
Prioritising cash and preserving value Robust business model Committed, diversified facilities £400m RCFs from four relationship banks. Bellway is agile, responsive and strategically flexible. £130m Fixed rate USPP loan notes. Sensible cash balance provides resilience and downside protection. Total

Slide 35: Notes
Notes Results presentation Results presentation1816 October 2022 October 2018 - Page 35 -
Slide 36: Rising dividend and value creation
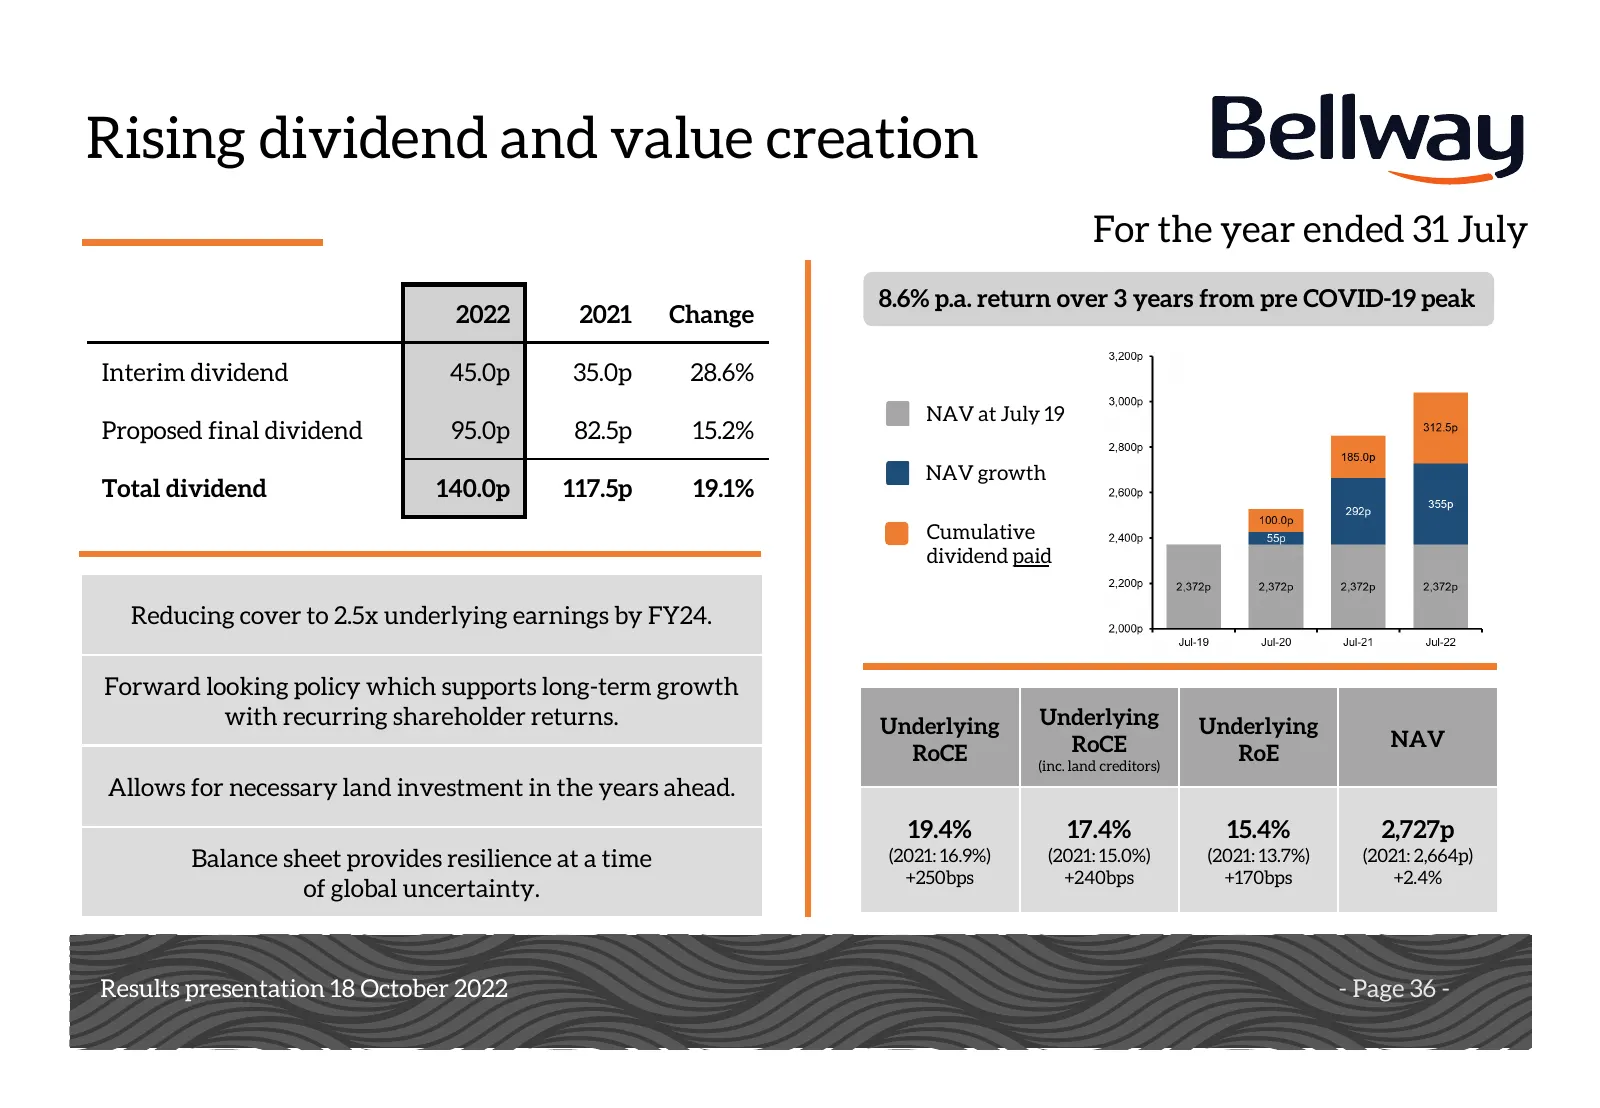
Rising dividend and value creation For the year ended 31 July 8.6% p.a. return over 3 years from pre COVID-19 peak 2022 2021 Change Interim dividend 45.0p 35.0p 28.6% NAV at July 19 Proposed final dividend 95.0p 82.5p 15.2% NAV growth Total dividend 140.0p 117.5p 19.1% Cumulative dividend paid Reduc

Slide 37: Notes
Notes Results presentation Results presentation1816 October 2022 October 2018 - Page 37 -
Slide 38: Better with Bellway
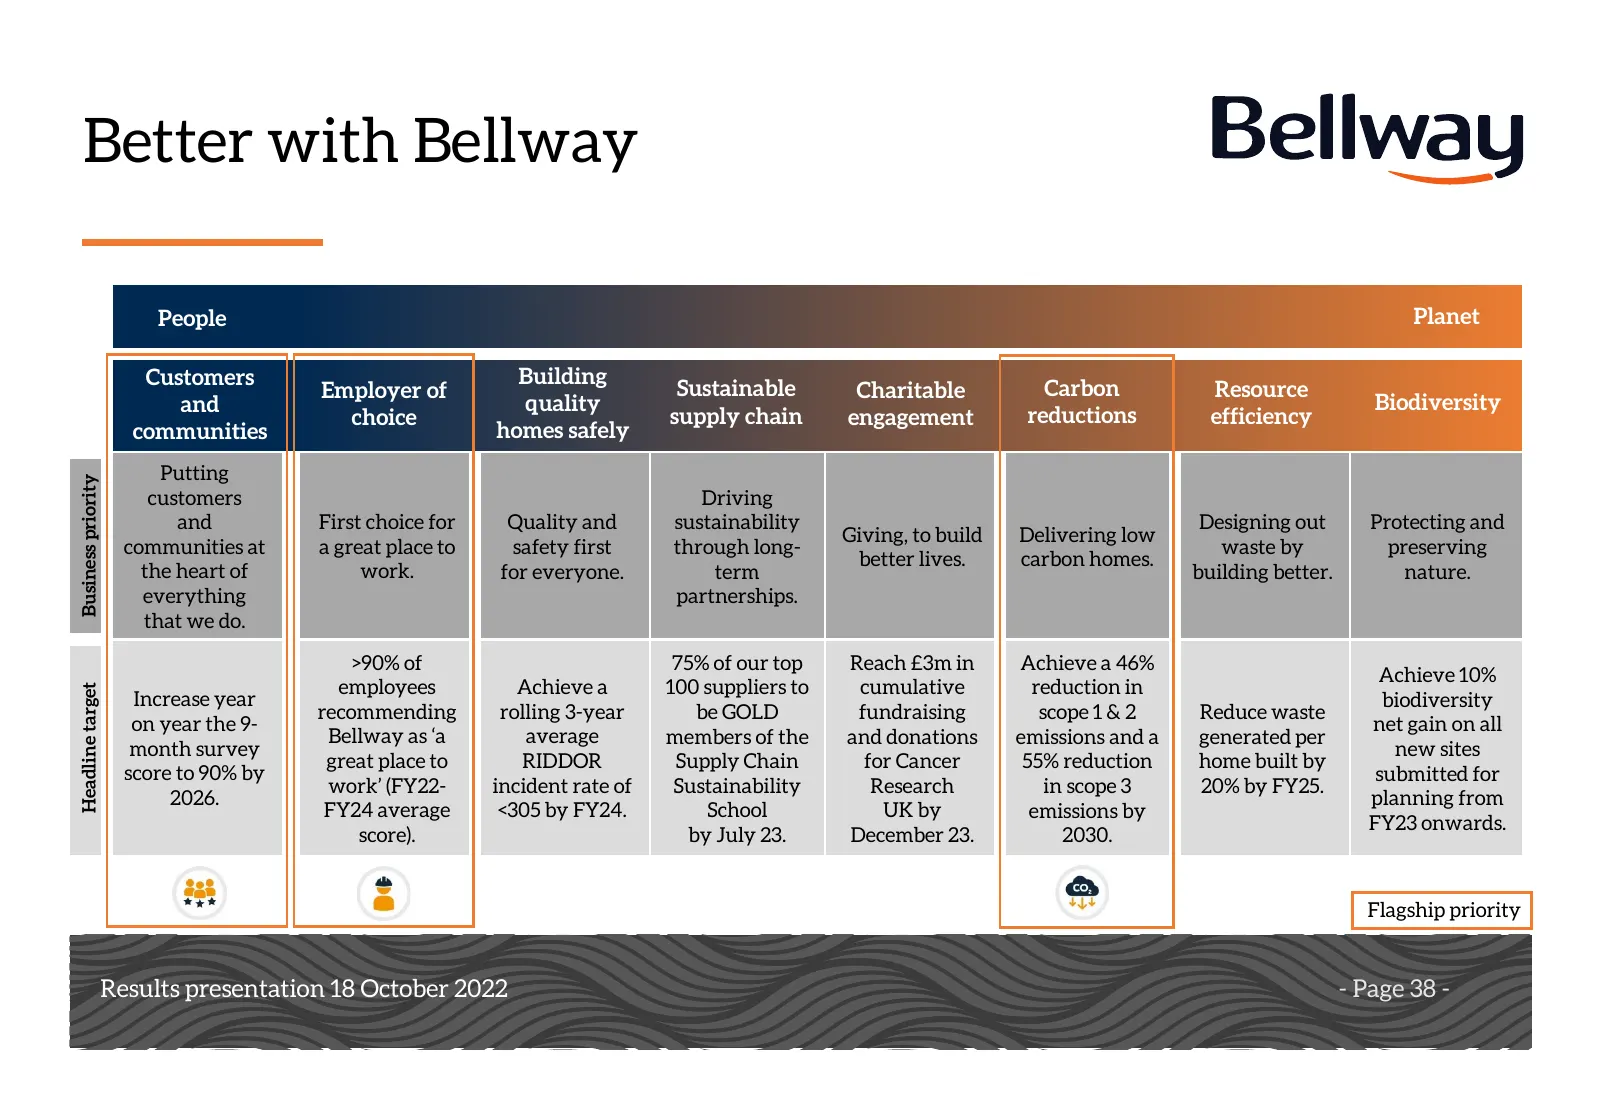
Better with Bellway People Planet Customers Building Employer of Sustainable Charitable Carbon Resource and quality Biodiversity choice supply chain engagement reductions efficiency communities homes safely Putting Business priority customers Driving and First choice for Quality and sustainability D

Slide 39: Notes
Notes Results presentation Results presentation1816 October 2022 October 2018 - Page 39 -
Slide 40: Ambitious carbon reduction plans
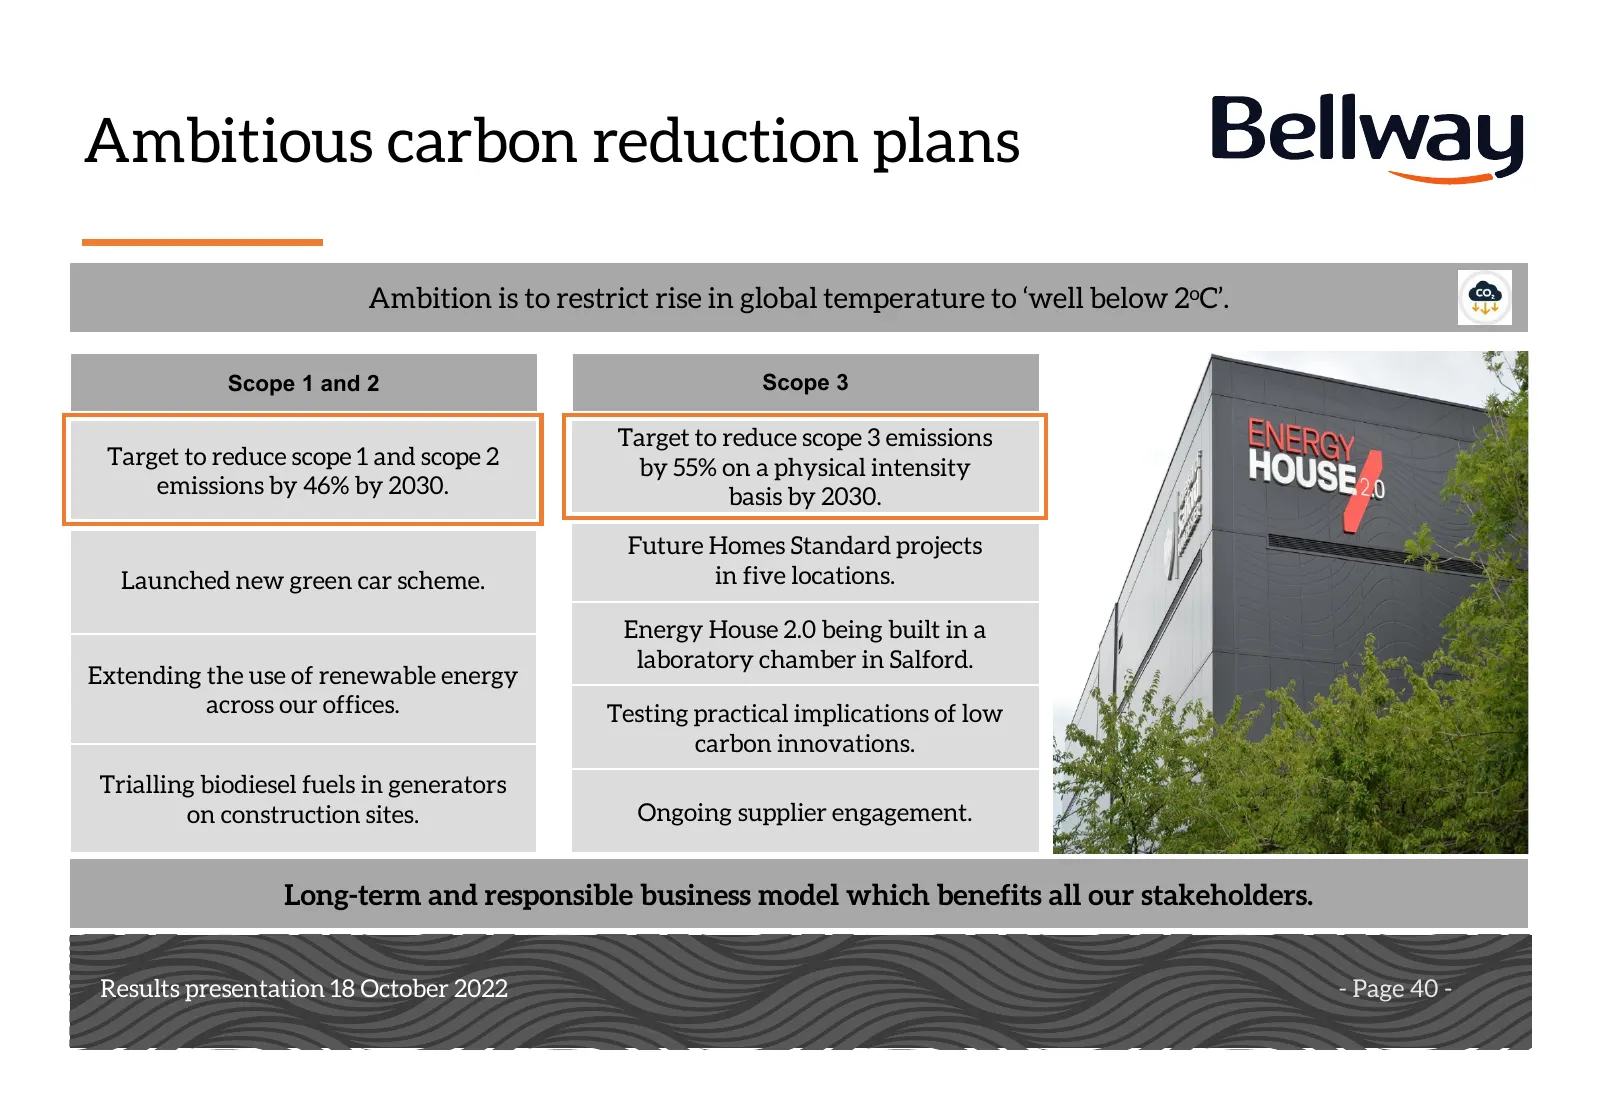
Ambitious carbon reduction plans Ambition is to restrict rise in global temperature to ‘well below 2oC’. Scope 1 and 2 Scope 3 Target to reduce scope 3 emissions Target to reduce scope 1 and scope 2 by 55% on a physical intensity emissions by 46% by 2030. basis by 2030. Future Homes Standard project

Slide 41: Notes
Notes Results presentation Results presentation1816 October 2022 October 2018 - Page 41 -
Slide 42: Summary
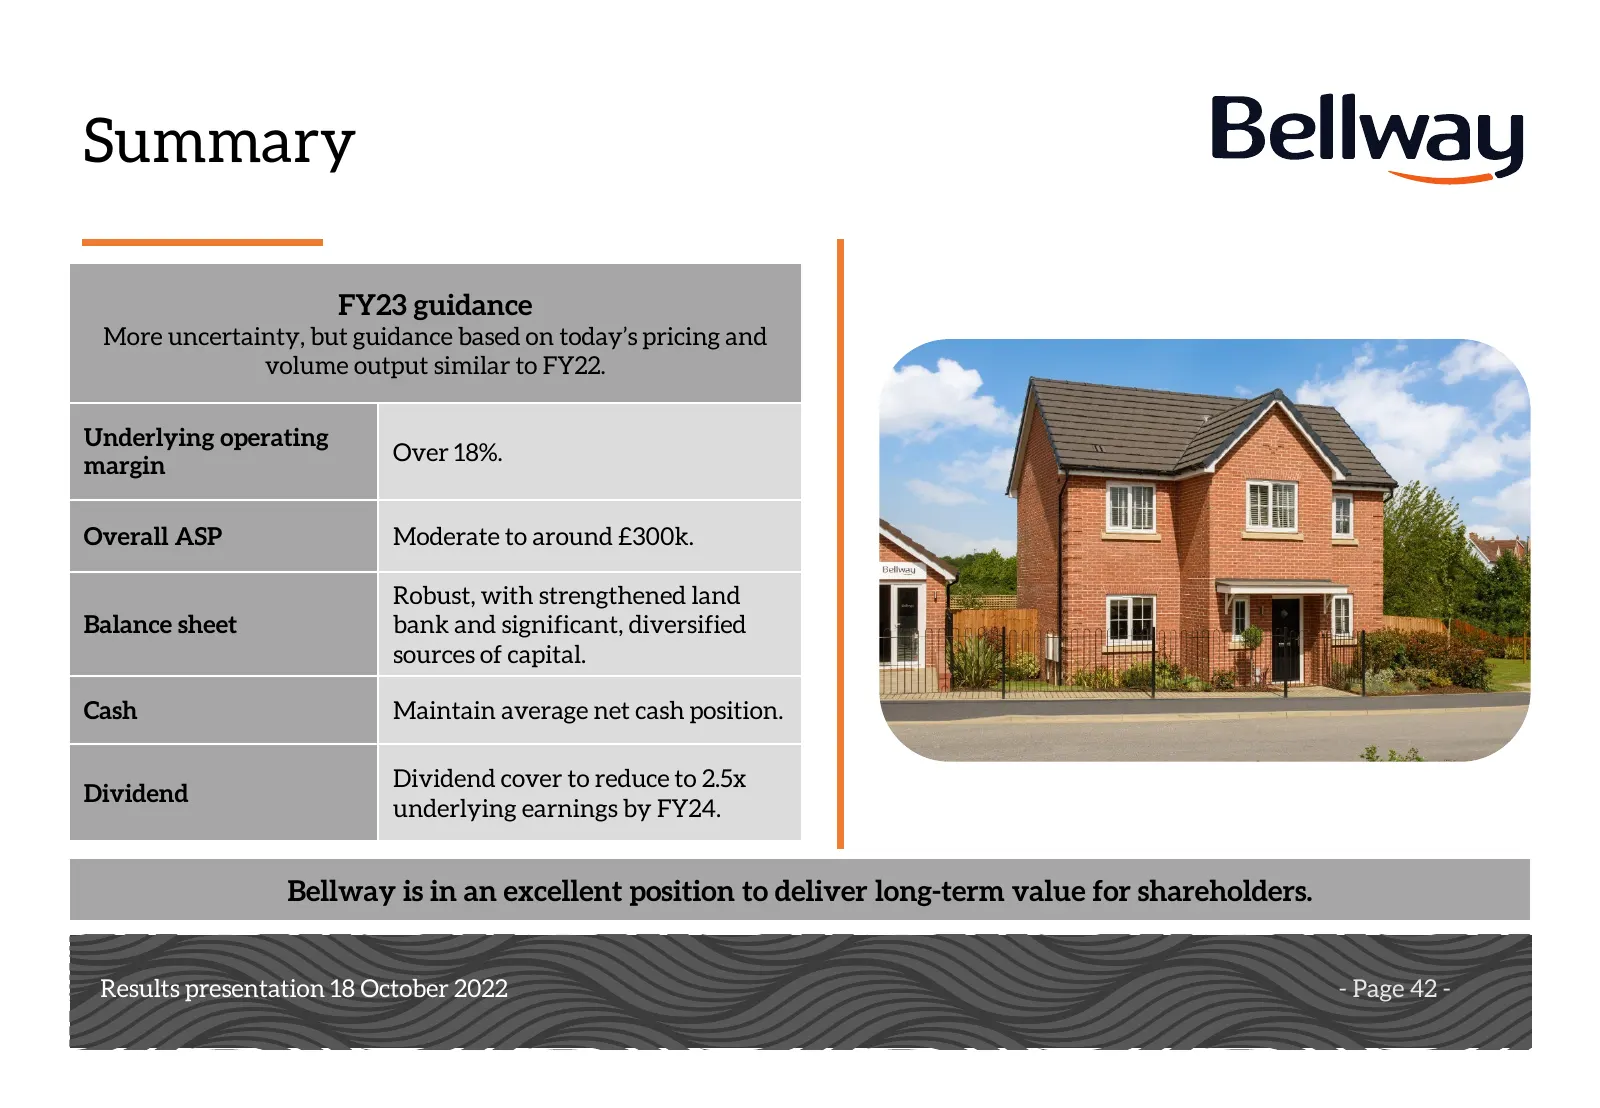
Summary FY23 guidance More uncertainty, but guidance based on today’s pricing and volume output similar to FY22. Underlying operating Over 18%. margin Overall ASP Moderate to around £300k. Robust, with strengthened land Balance sheet bank and significant, diversified sources of capital. Cash Maintai

Slide 43: Notes
Notes Results presentation Results presentation1816 October 2022 October 2018 - Page 43 -

Slide 44: Operating review
Operating review Jason Honeyman Chief Executive Results presentation Results presentation1816 October 2022 October 2018 - Page 44 -

Slide 45: Notes
Notes Results presentation Results presentation1816 October 2022 October 2018 - Page 45 -
Slide 46: Strong trading in FY22
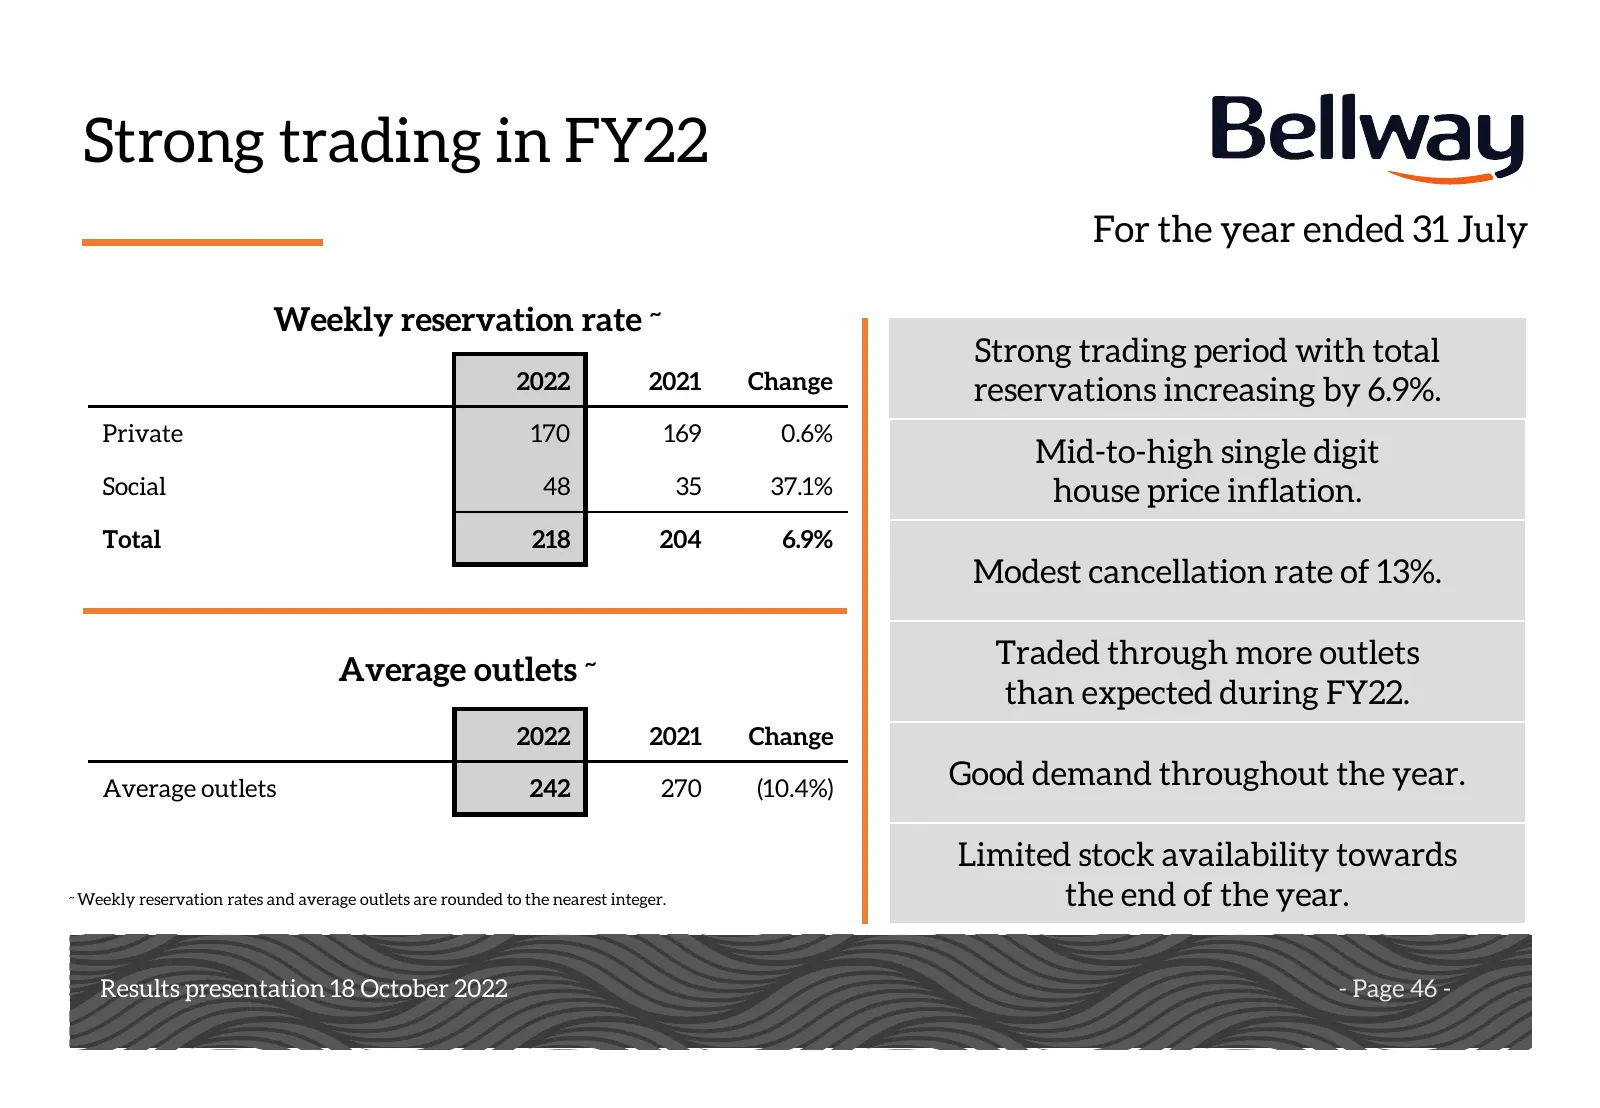
Strong trading in FY22 For the year ended 31 July Weekly reservation rate ~ Strong trading period with total 2022 2021 Change reservations increasing by 6.9%. Private 170 169 0.6% Mid-to-high single digit Social 48 35 37.1% house price inflation. Total 218 204 6.9% Modest cancellation rate of 13%. A

Slide 47: Notes
Notes Results presentation Results presentation1816 October 2022 October 2018 - Page 47 -
Slide 48: Current trading in FY23
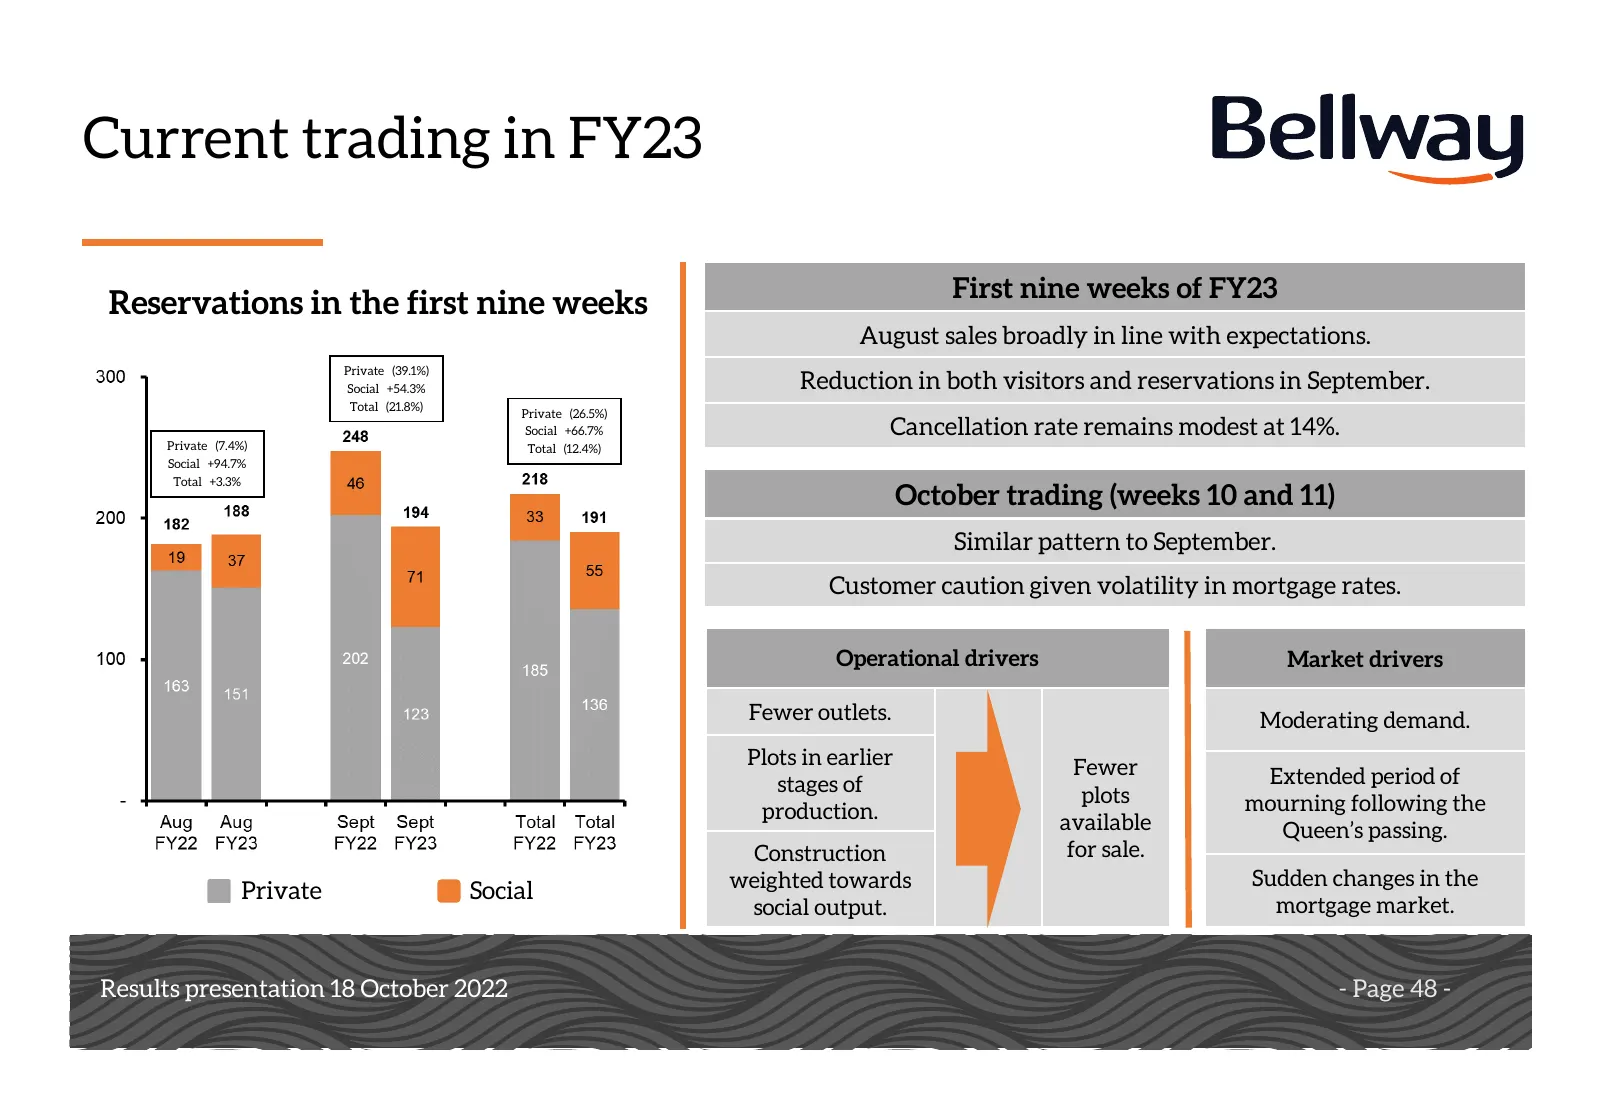
Current trading in FY23 First nine weeks of FY23 Reservations in the first nine weeks August sales broadly in line with expectations. Private (39.1%) Social +54.3% Reduction in both visitors and reservations in September. Total (21.8%) Private (26.5%) Social +66.7% Cancellation rate remains modest a

Slide 49: Notes
Notes Results presentation Results presentation1816 October 2022 October 2018 - Page 49 -
Slide 50: Current order book and demand
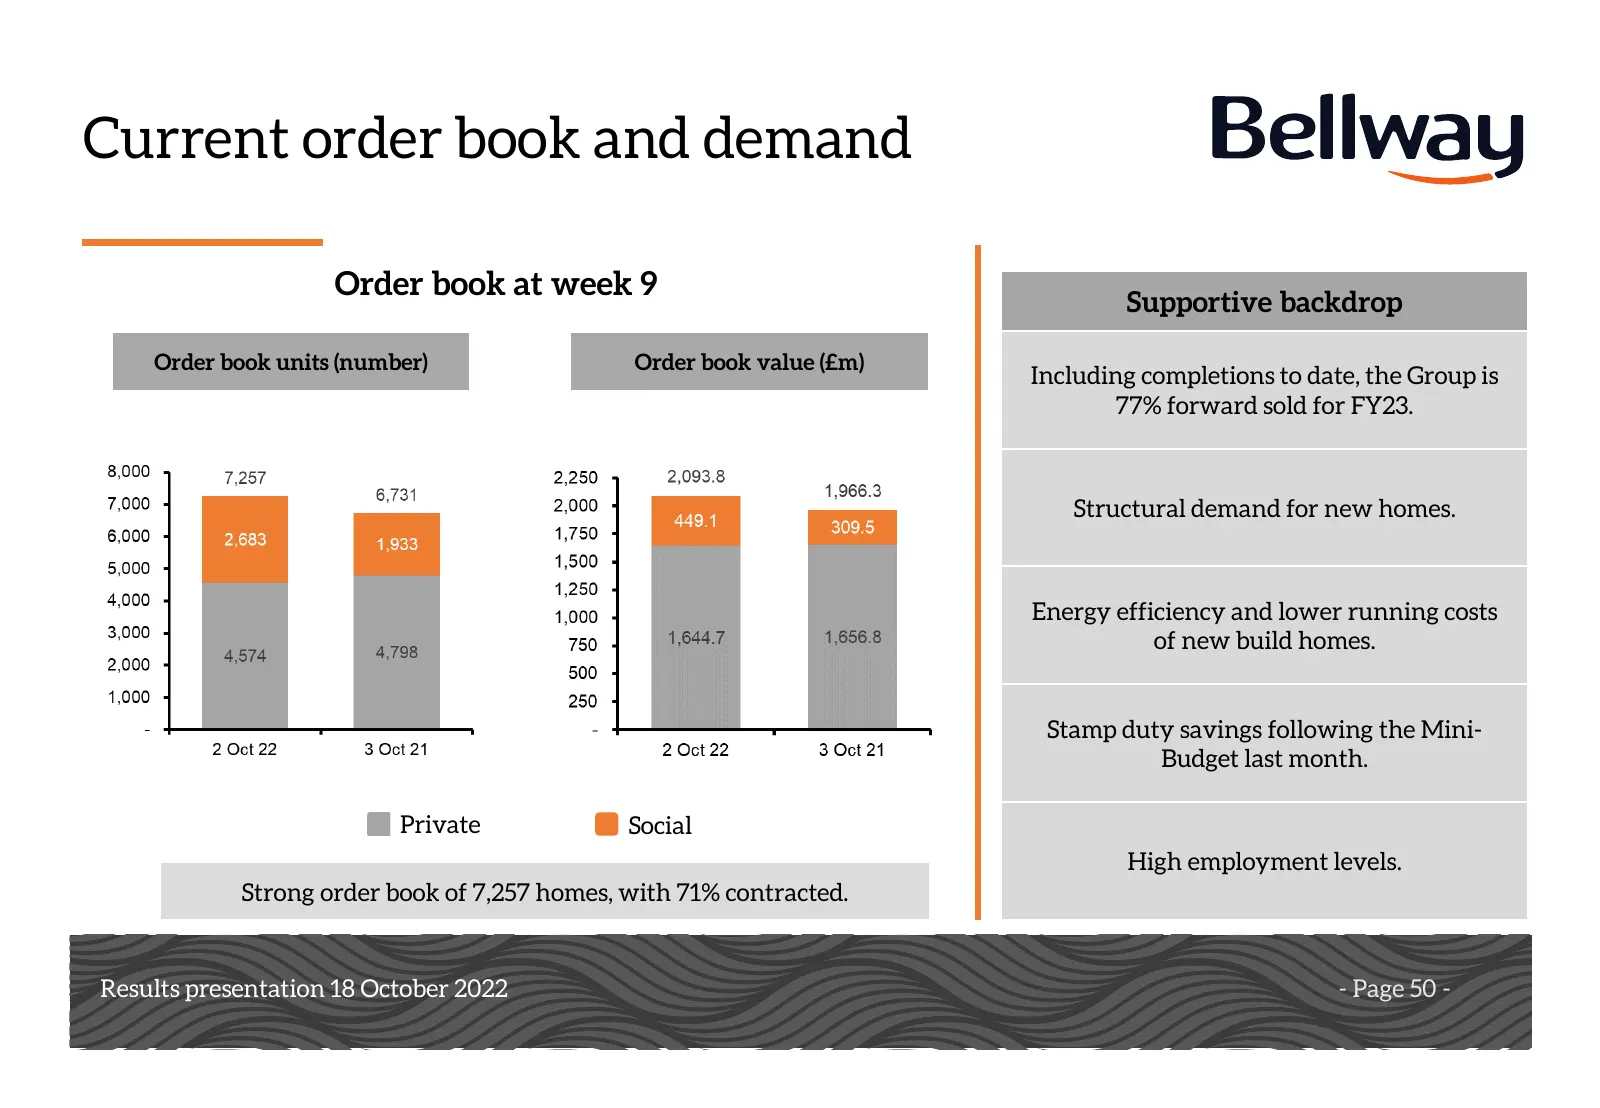
Current order book and demand Order book at week 9 Supportive backdrop Order book units (number) Order book value (£m) Including completions to date, the Group is 77% forward sold for FY23. Structural demand for new homes. Energy efficiency and lower running costs of new build homes. Stamp duty savi

Slide 51: Notes
Notes Results presentation Results presentation1816 October 2022 October 2018 - Page 51 -
Slide 52: Mortgages and affordability
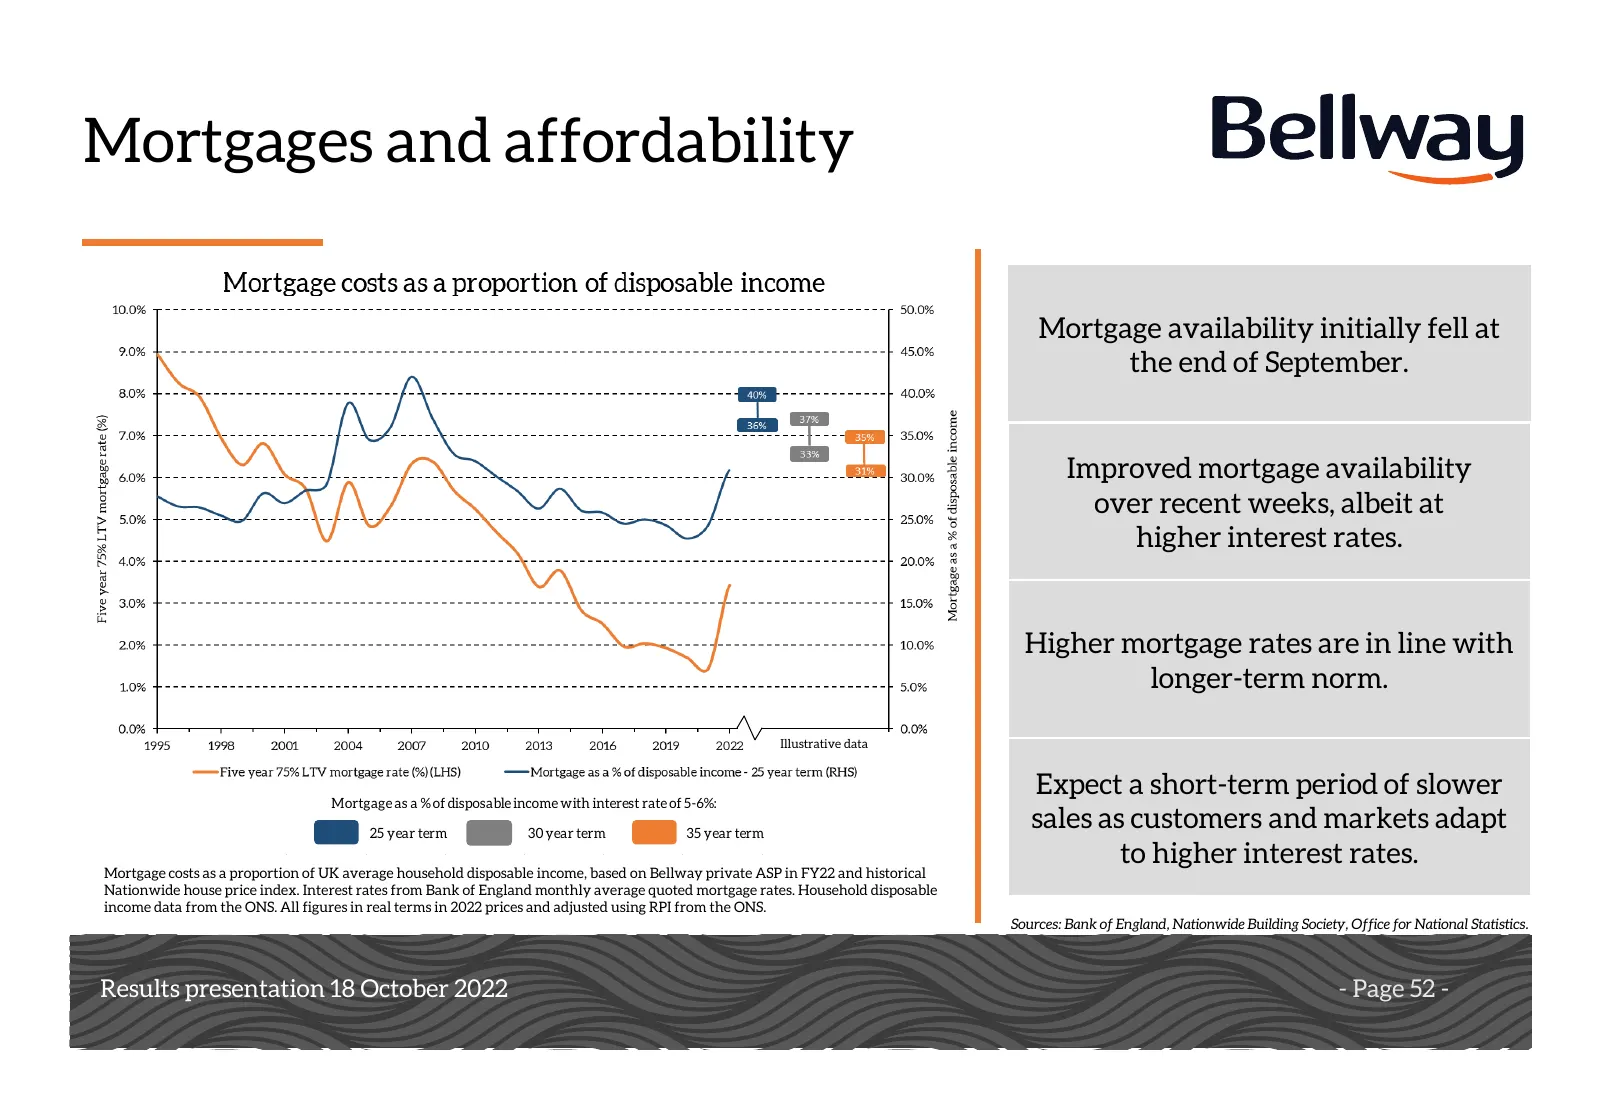
Mortgages and affordability Mortgage availability initially fell at the end of September. Improved mortgage availability over recent weeks, albeit at higher interest rates. Higher mortgage rates are in line with longer-term norm. Illustrative data Mortgage as a % of disposable income with interest r

Slide 53: Notes
Notes Results presentation Results presentation1816 October 2022 October 2018 - Page 53 -
Slide 54: Strengthened land bank supports resilience
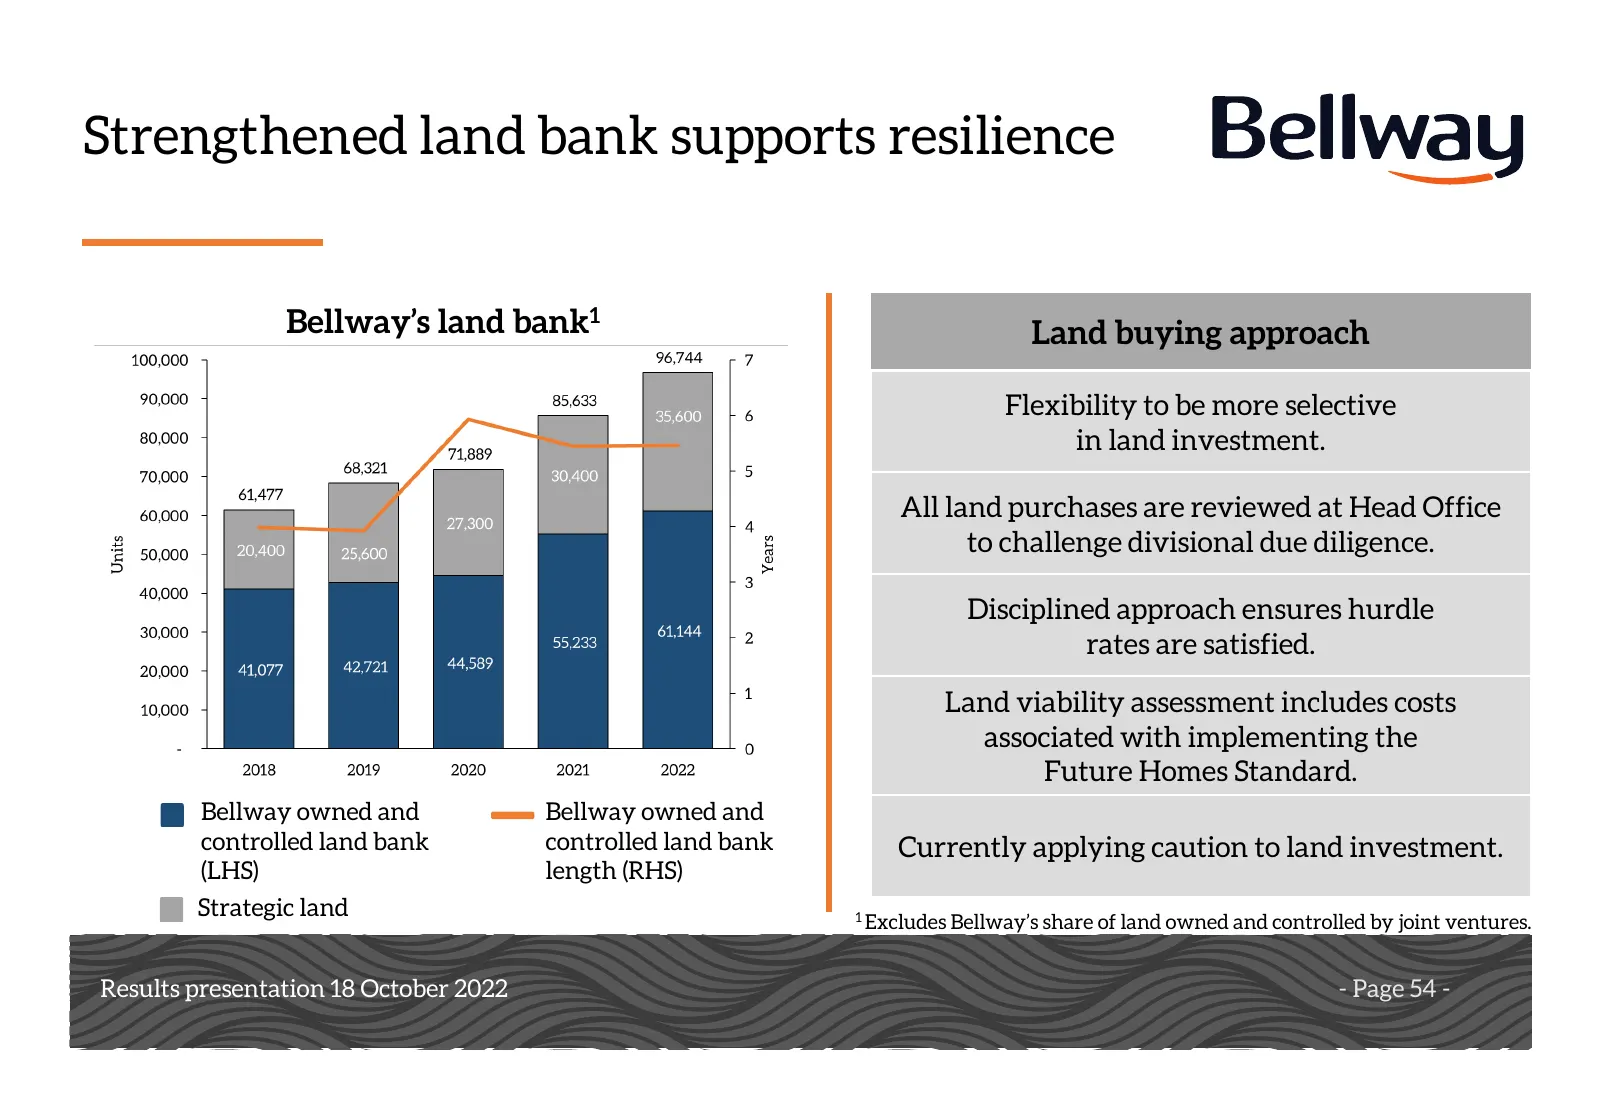
Strengthened land bank supports resilience Bellway’s land bank1 Land buying approach Flexibility to be more selective in land investment. All land purchases are reviewed at Head Office to challenge divisional due diligence. Disciplined approach ensures hurdle rates are satisfied. Land viability asse

Slide 55: Notes
Notes Results presentation Results presentation1816 October 2022 October 2018 - Page 55 -
Slide 56: Strategic land supports long-term growth
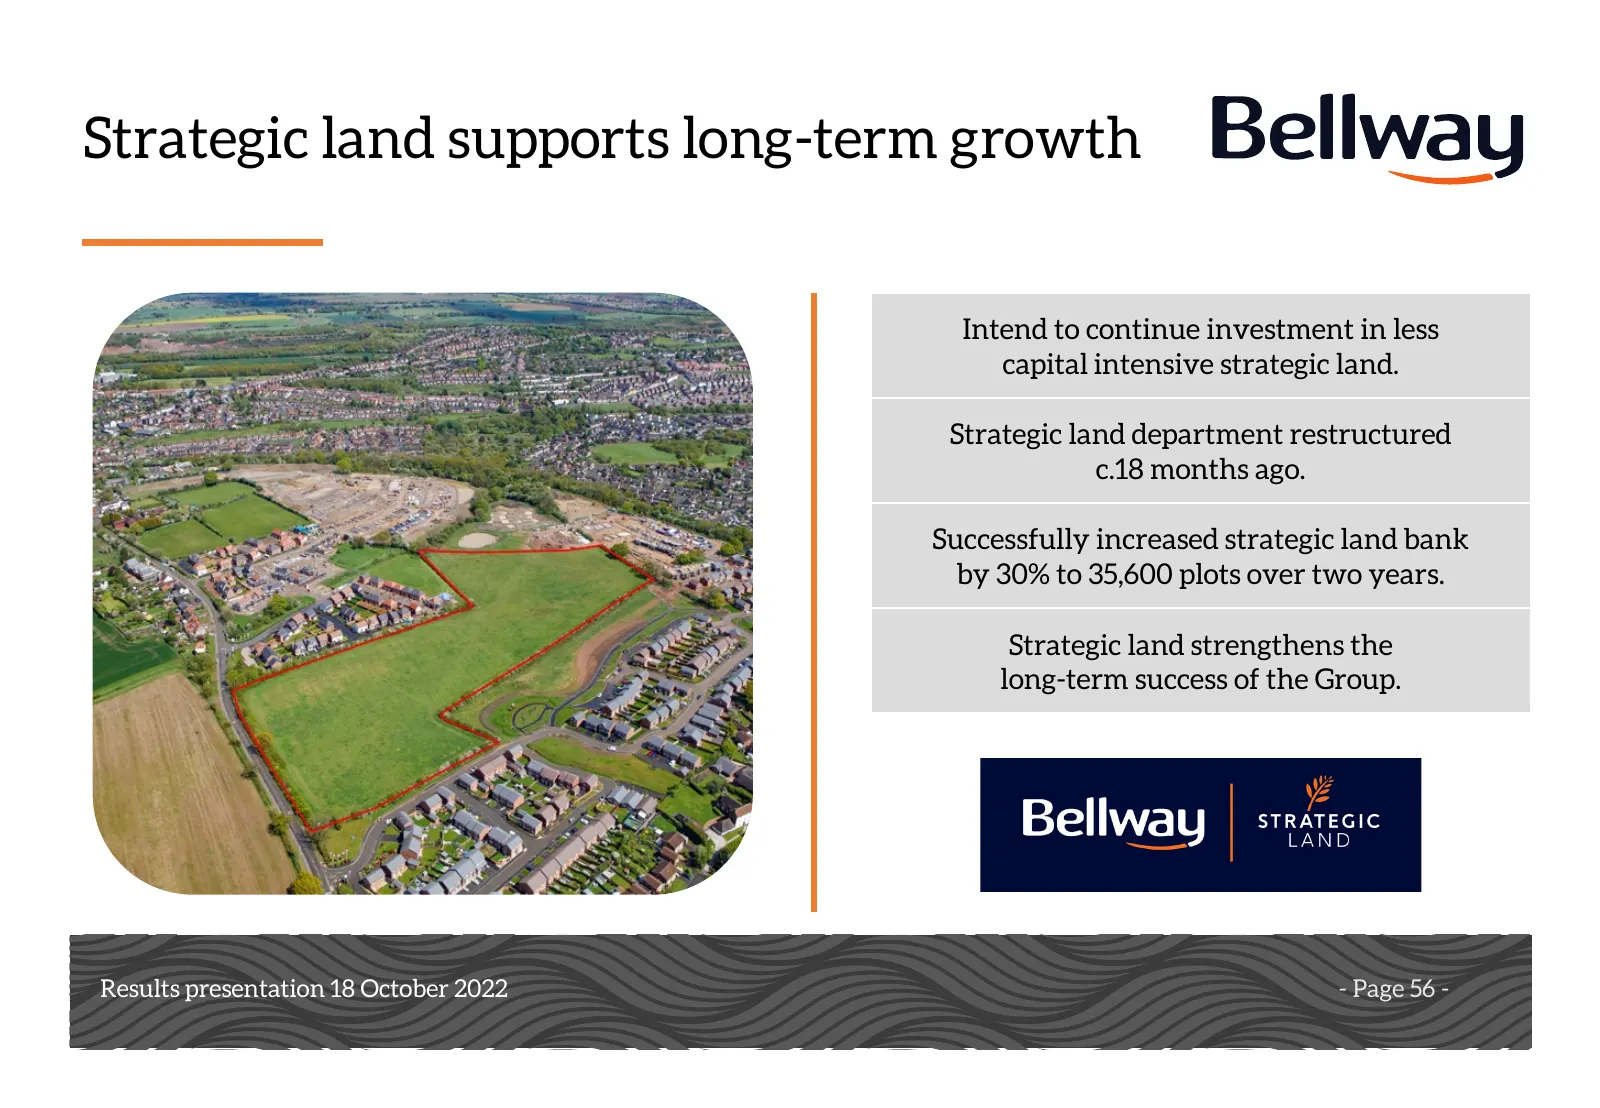
Strategic land supports long-term growth Intend to continue investment in less capital intensive strategic land. Strategic land department restructured c.18 months ago. Successfully increased strategic land bank by 30% to 35,600 plots over two years. Strategic land strengthens the long-term success

Slide 57: Notes
Notes Results presentation Results presentation1816 October 2022 October 2018 - Page 57 -
Slide 58: Managing production and improving efficiency
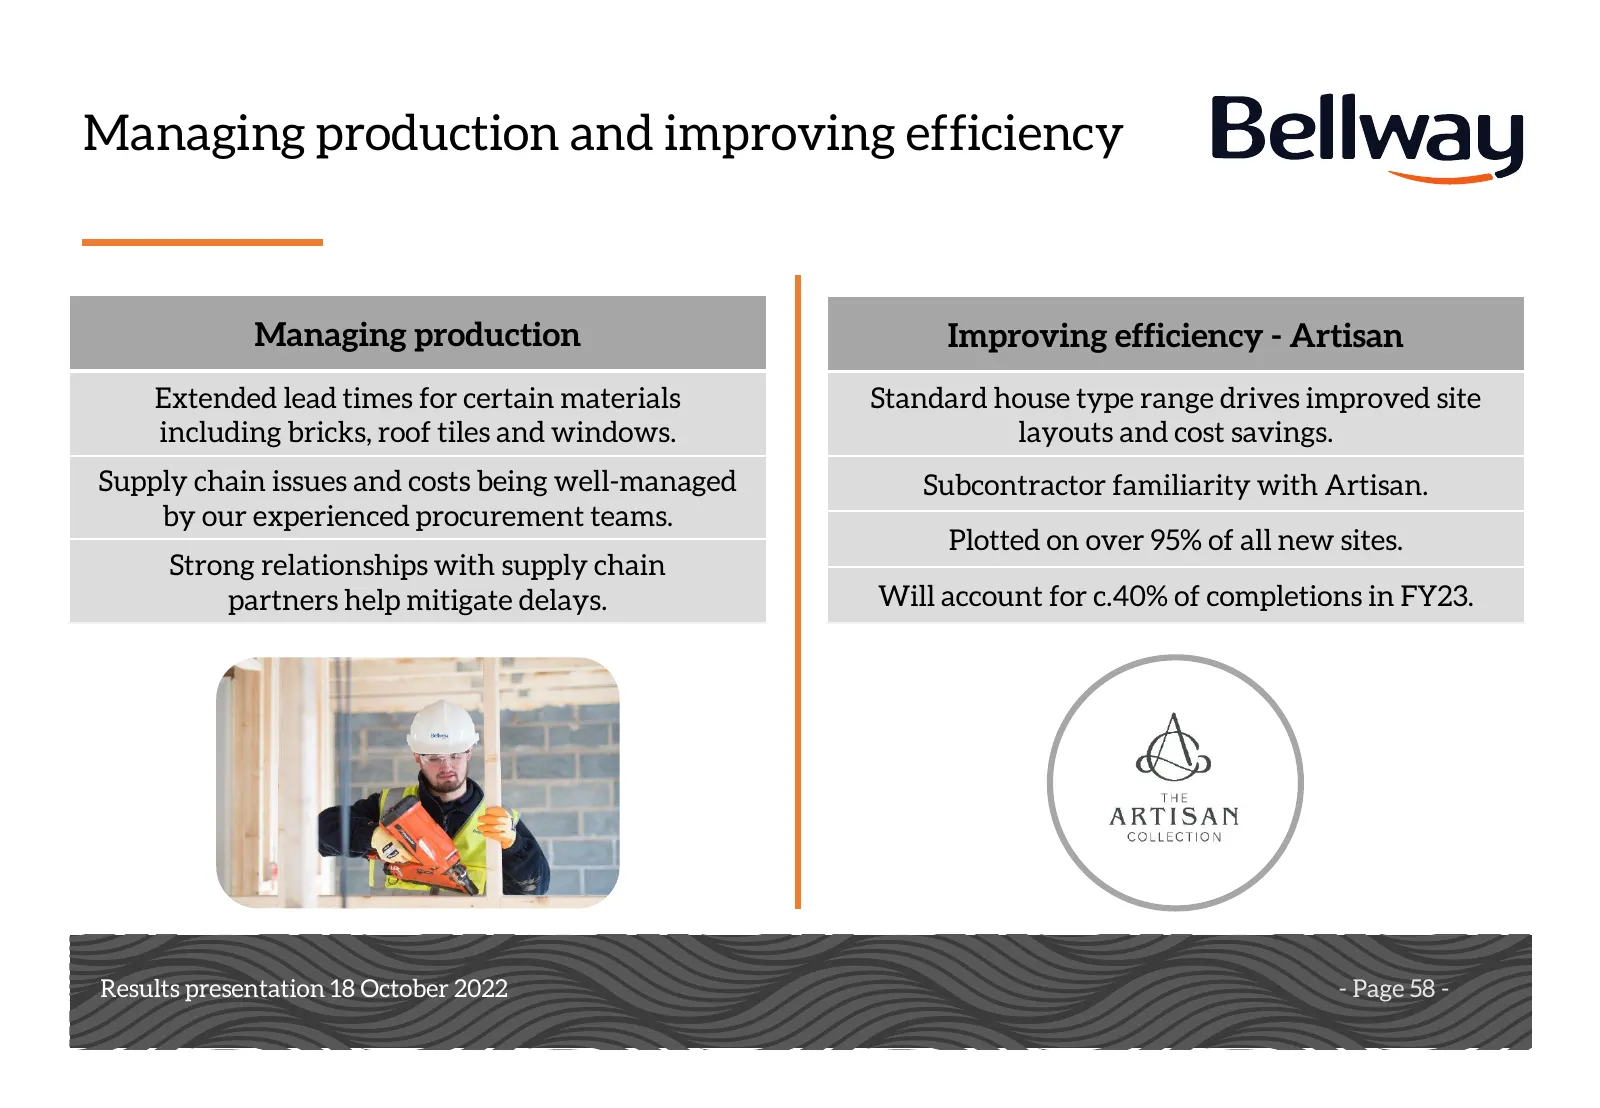
Managing production and improving efficiency Managing production Improving efficiency - Artisan Extended lead times for certain materials Standard house type range drives improved site including bricks, roof tiles and windows. layouts and cost savings. Supply chain issues and costs being well-manage

Slide 59: Notes
Notes Results presentation Results presentation1816 October 2022 October 2018 - Page 59 -
Slide 60: Better with Bellway - Employer of Choice
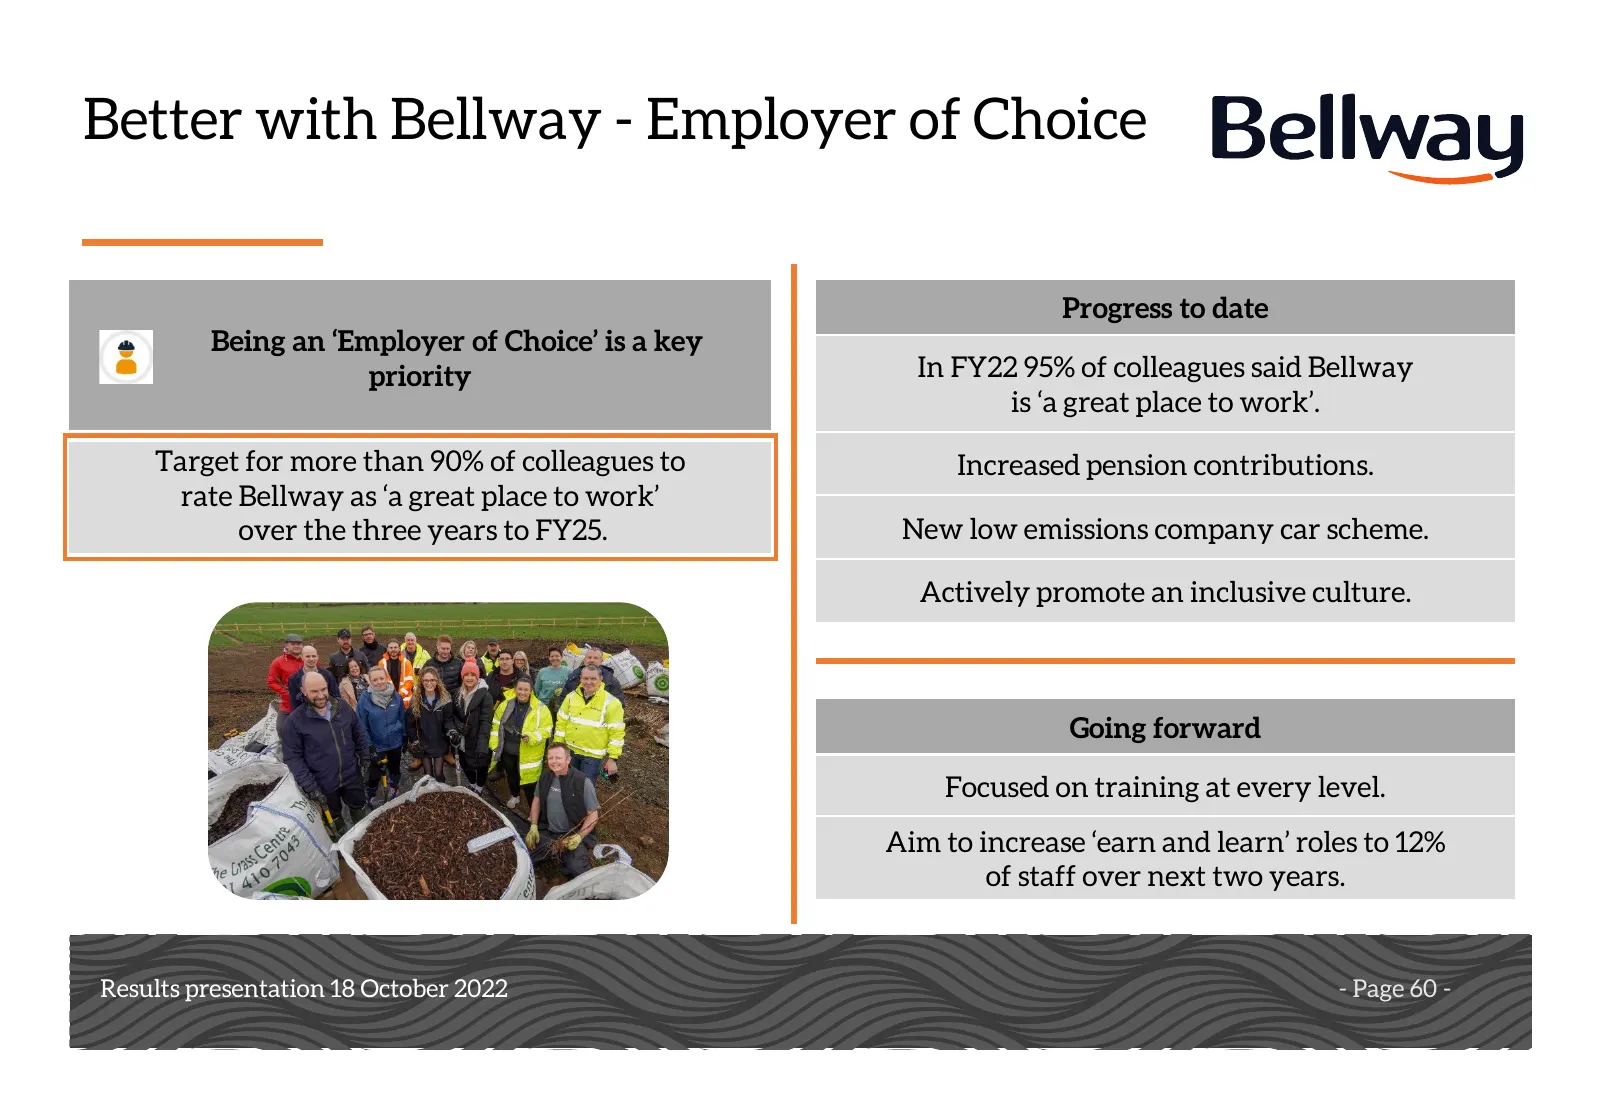
Better with Bellway - Employer of Choice Progress to date Being an ‘Employer of Choice’ is a key priority In FY22 95% of colleagues said Bellway is ‘a great place to work’. Target for more than 90% of colleagues to Increased pension contributions. rate Bellway as ‘a great place to work’ over the thr

Slide 61: Notes
Notes Results presentation Results presentation1816 October 2022 October 2018 - Page 61 -
Slide 62: Better with Bellway - Customer First
Better with Bellway - Customer First Progress to date Customer First is a key priority 8 week customer satisfaction survey score of 93.6%. 9 month customer satisfaction score of 82.1%. Target to improve 9 month Customer Satisfaction One of the first home builders to sign up to survey score to 90% ov

Slide 63: Notes
Notes Results presentation Results presentation1816 October 2022 October 2018 - Page 63 -
Slide 64: Outlook
Outlook Strong balance sheet with net cash of £245.3m at 31 July 2022. Resilience Strengthened land bank supports less investment in year ahead. More outlets to help offset softer demand. Demand Social units help underpin FY23 volume. Order book at 2 October was over £2bn. Volume similar to FY22. FY

Slide 65: Notes
Notes Results presentation Results presentation1816 October 2022 October 2018 - Page 65 -
Slide 66: Q&A
Q&A New Cardington Fields Bedfordshire Results presentation Results presentation1816 October 2022 October 2018 - Page 66 -

Slide 67: Notes
Notes Results presentation Results presentation1816 October 2022 October 2018 - Page 67 -
Slide 68: Appendices
Appendices 1. Income statement 2. Net finance expense 3. Housing revenue 4. ASP per square foot 5. Geographic split 6. Product analysis 7. Buyer analysis (completions) 8. Order book at 31 July 9. Mortgage products and affordability 10. Land with DPP 11. Land supply 12. Strategic land 13. Land credit

Slide 69: Notes
Notes Results presentation Results presentation1816 October 2022 October 2018 - Page 69 -
Slide 70: Appendix 1 - Income statement
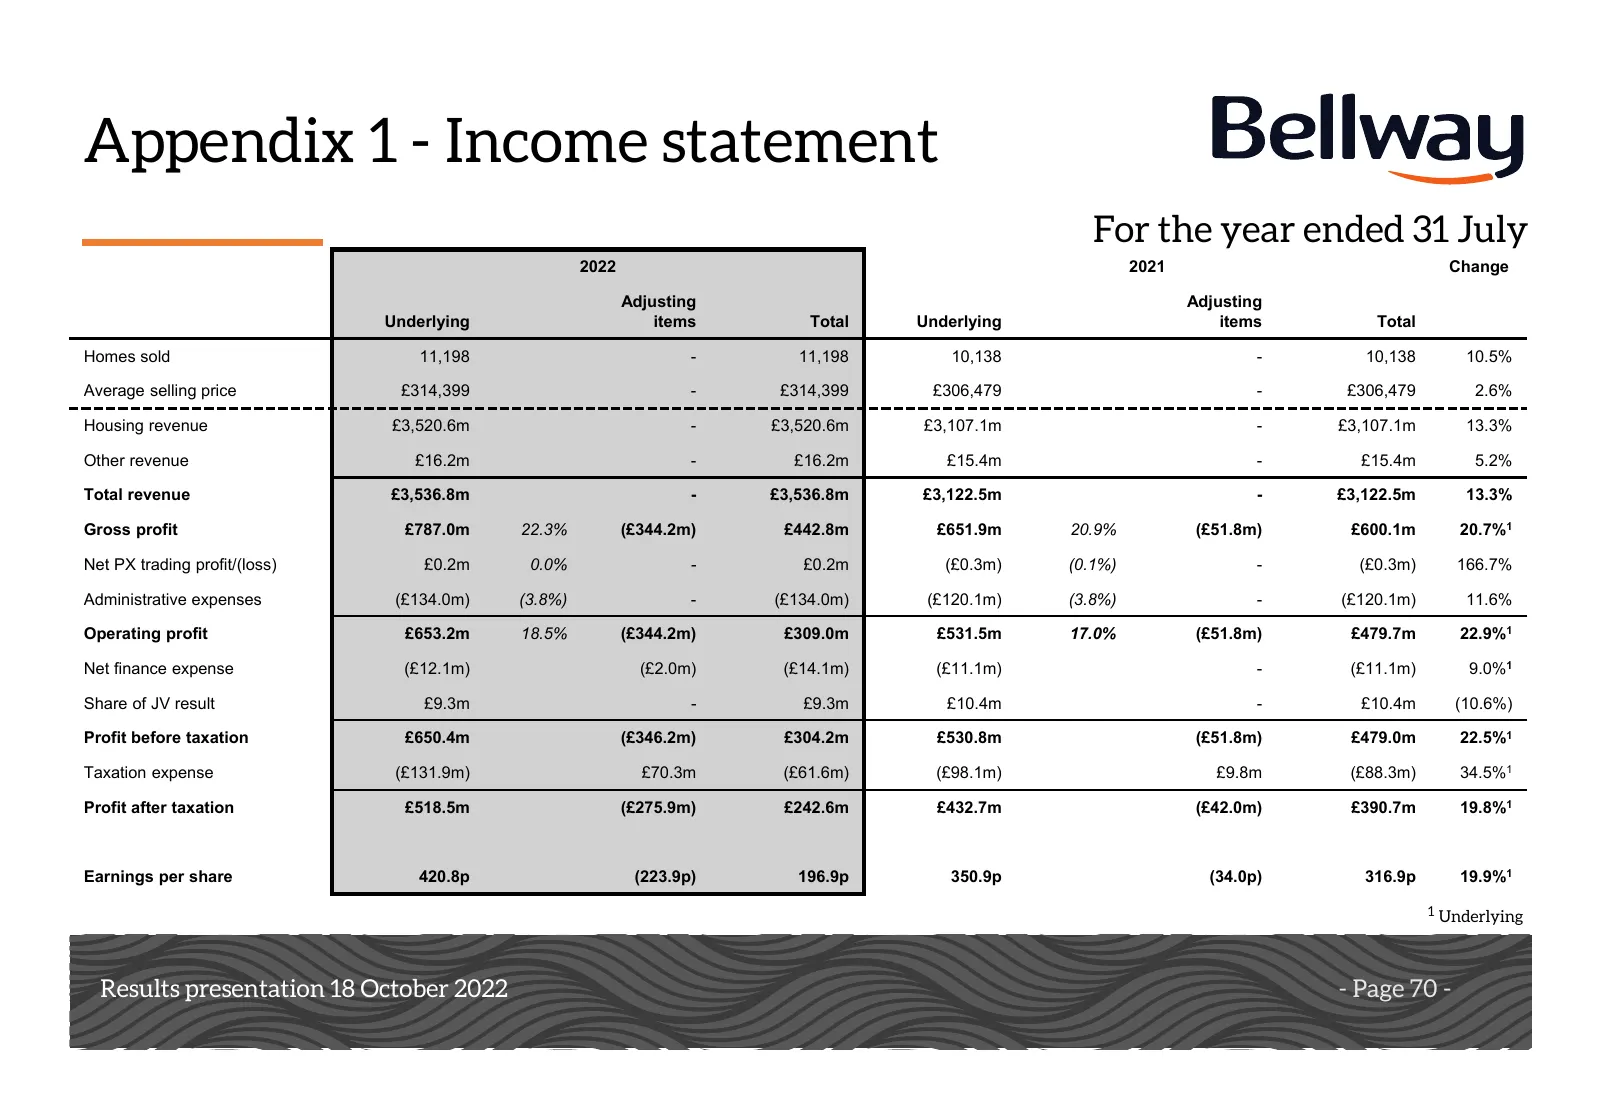
Appendix 1 - Income statement For the year ended 31 July 2022 2021 Change Adjusting Adjusting Underlying items Total Underlying items Total Homes sold 11,198 - 11,198 10,138 - 10,138 10.5% Average selling price £314,399 - £314,399 £306,479 - £306,479 2.6% Housing revenue £3,520.6m - £3,520.6m £3,107

Slide 71: Notes
Notes Results presentation Results presentation1816 October 2022 October 2018 - Page 71 -
Slide 72: Appendix 2 – Net finance expense
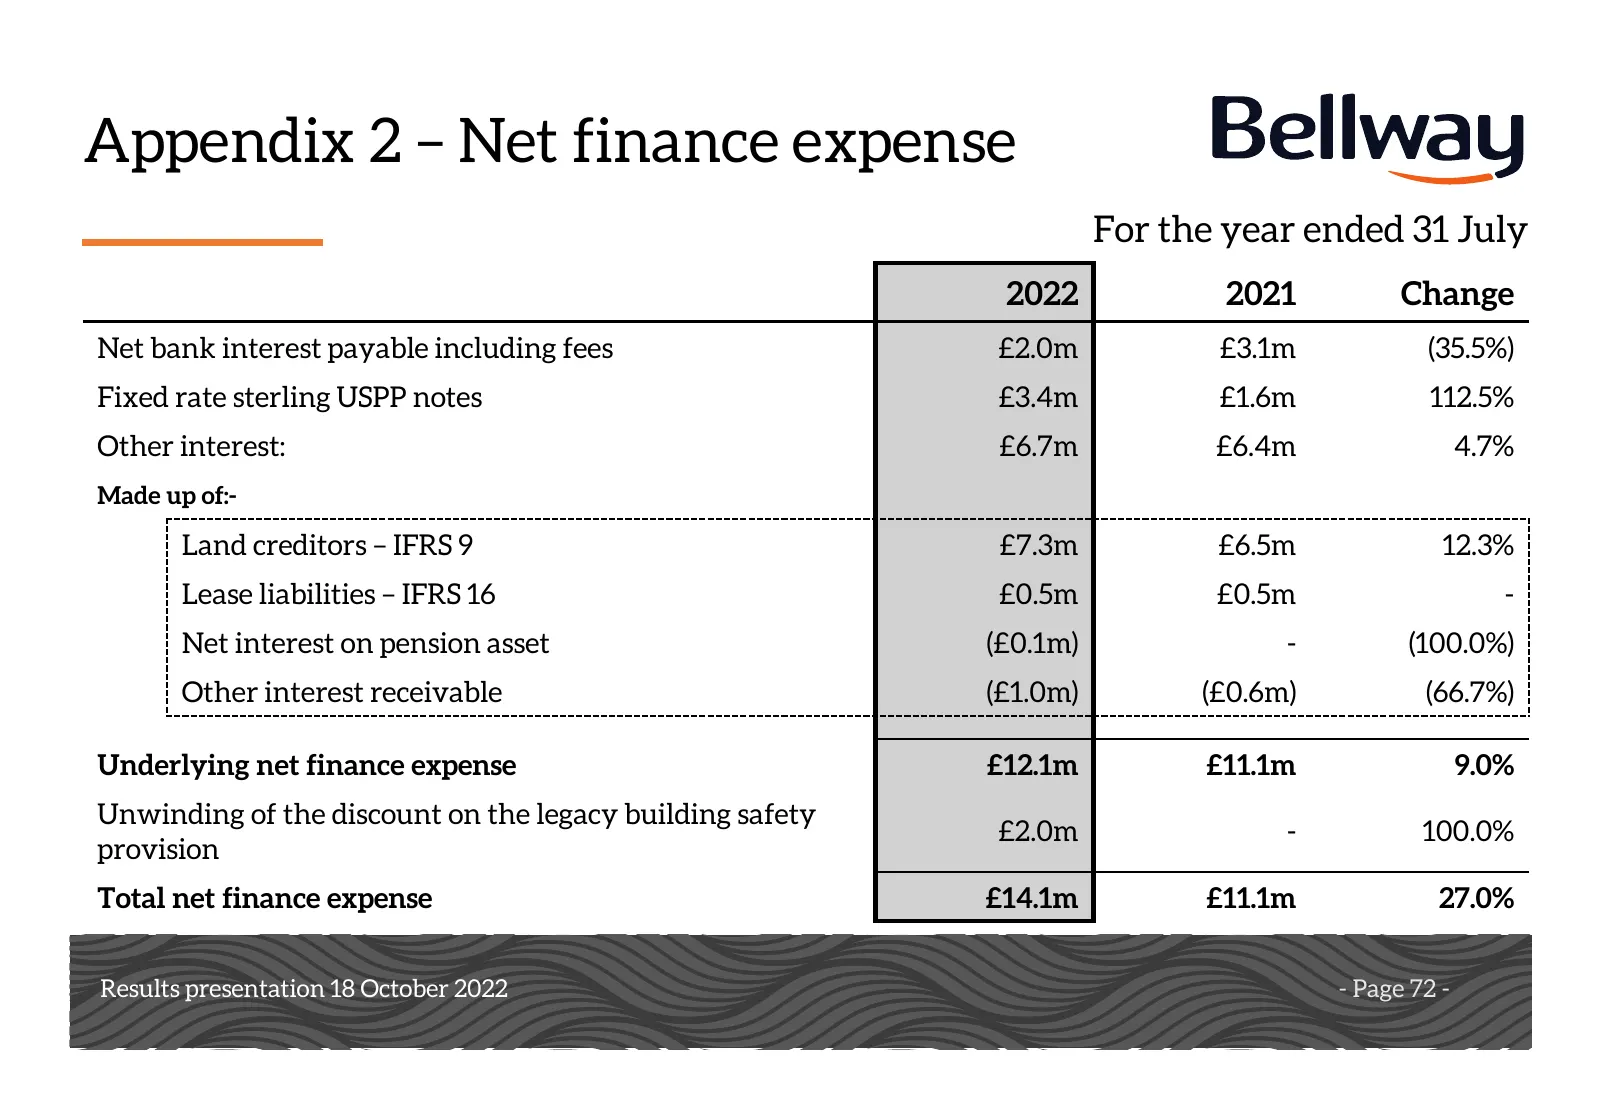
Appendix 2 – Net finance expense For the year ended 31 July 2022 2021 Change Net bank interest payable including fees £2.0m £3.1m (35.5%) Fixed rate sterling USPP notes £3.4m £1.6m 112.5% Other interest: £6.7m £6.4m 4.7% Made up of:- Land creditors – IFRS 9 £7.3m £6.5m 12.3% Lease liabilities – IFRS

Slide 73: Notes
Notes Results presentation Results presentation1816 October 2022 October 2018 - Page 73 -
Slide 74: Appendix 3 – Housing revenue
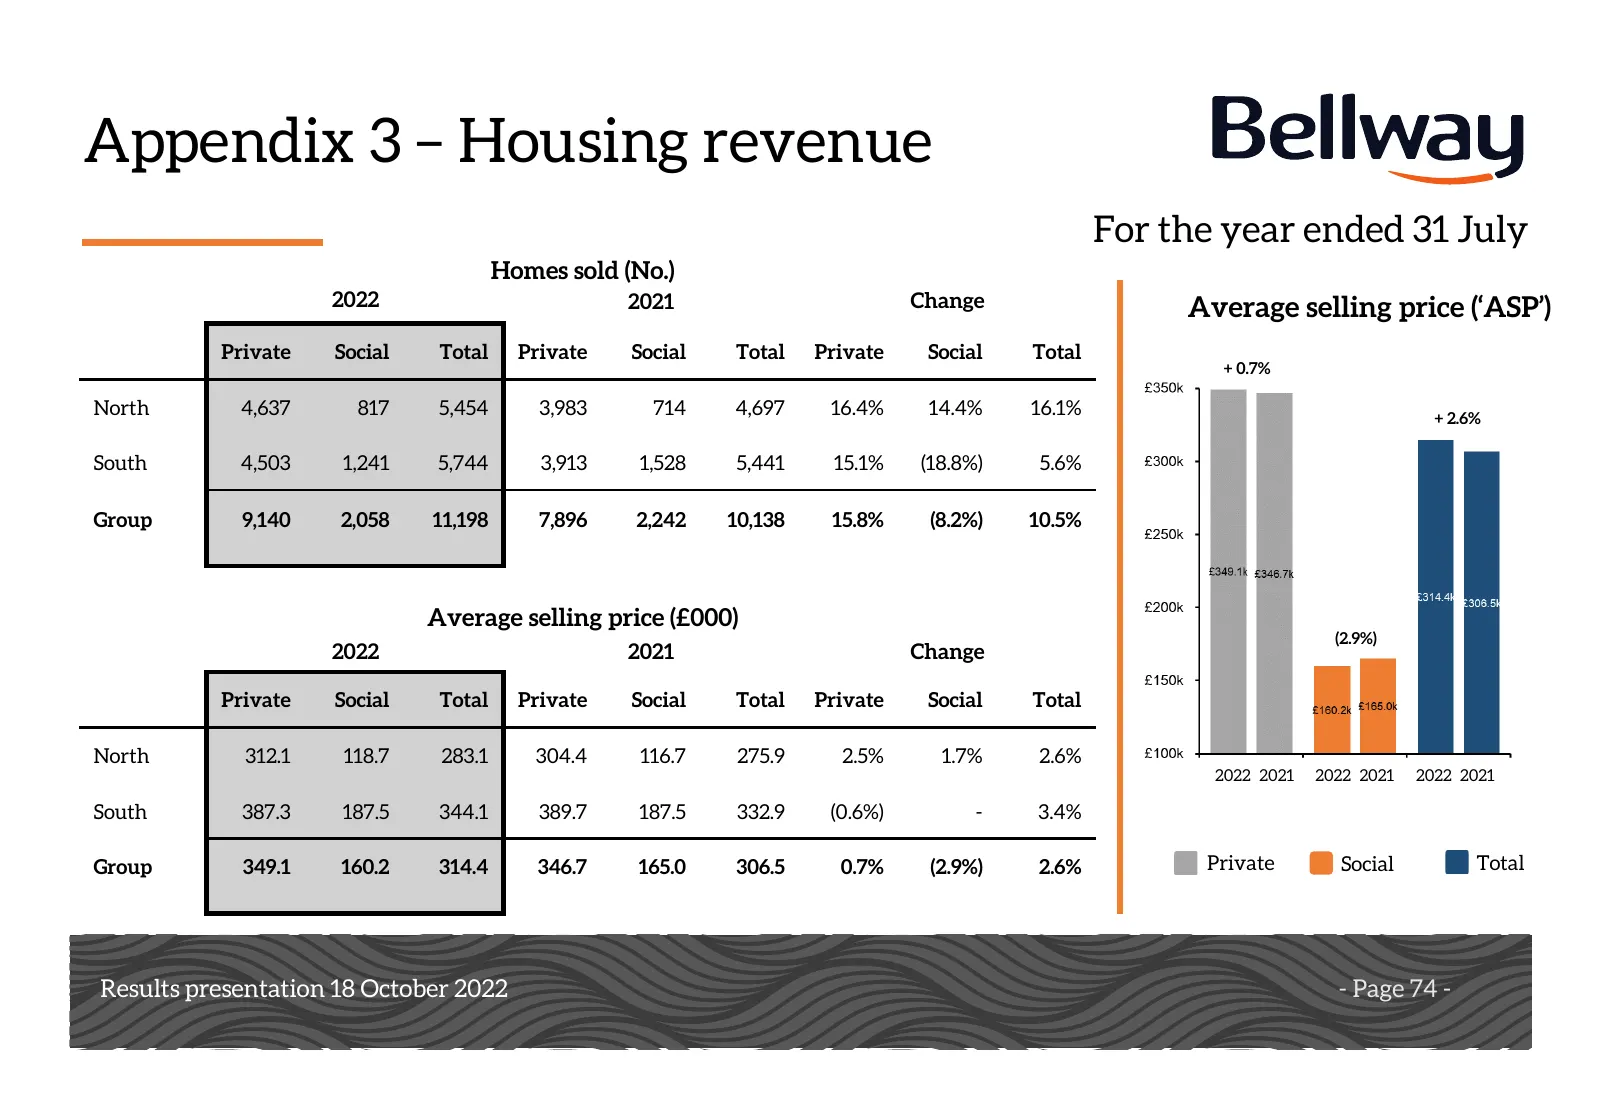
Appendix 3 – Housing revenue For the year ended 31 July Homes sold (No.) 2022 2021 Change Average selling price (‘ASP’) Private Social Total Private Social Total Private Social Total + 0.7% North 4,637 817 5,454 3,983 714 4,697 16.4% 14.4% 16.1% + 2.6% South 4,503 1,241 5,744 3,913 1,528 5,441 15.1%

Slide 75: Notes
Notes Results presentation Results presentation1816 October 2022 October 2018 - Page 75 -
Slide 76: Appendix 4 – ASP per square foot
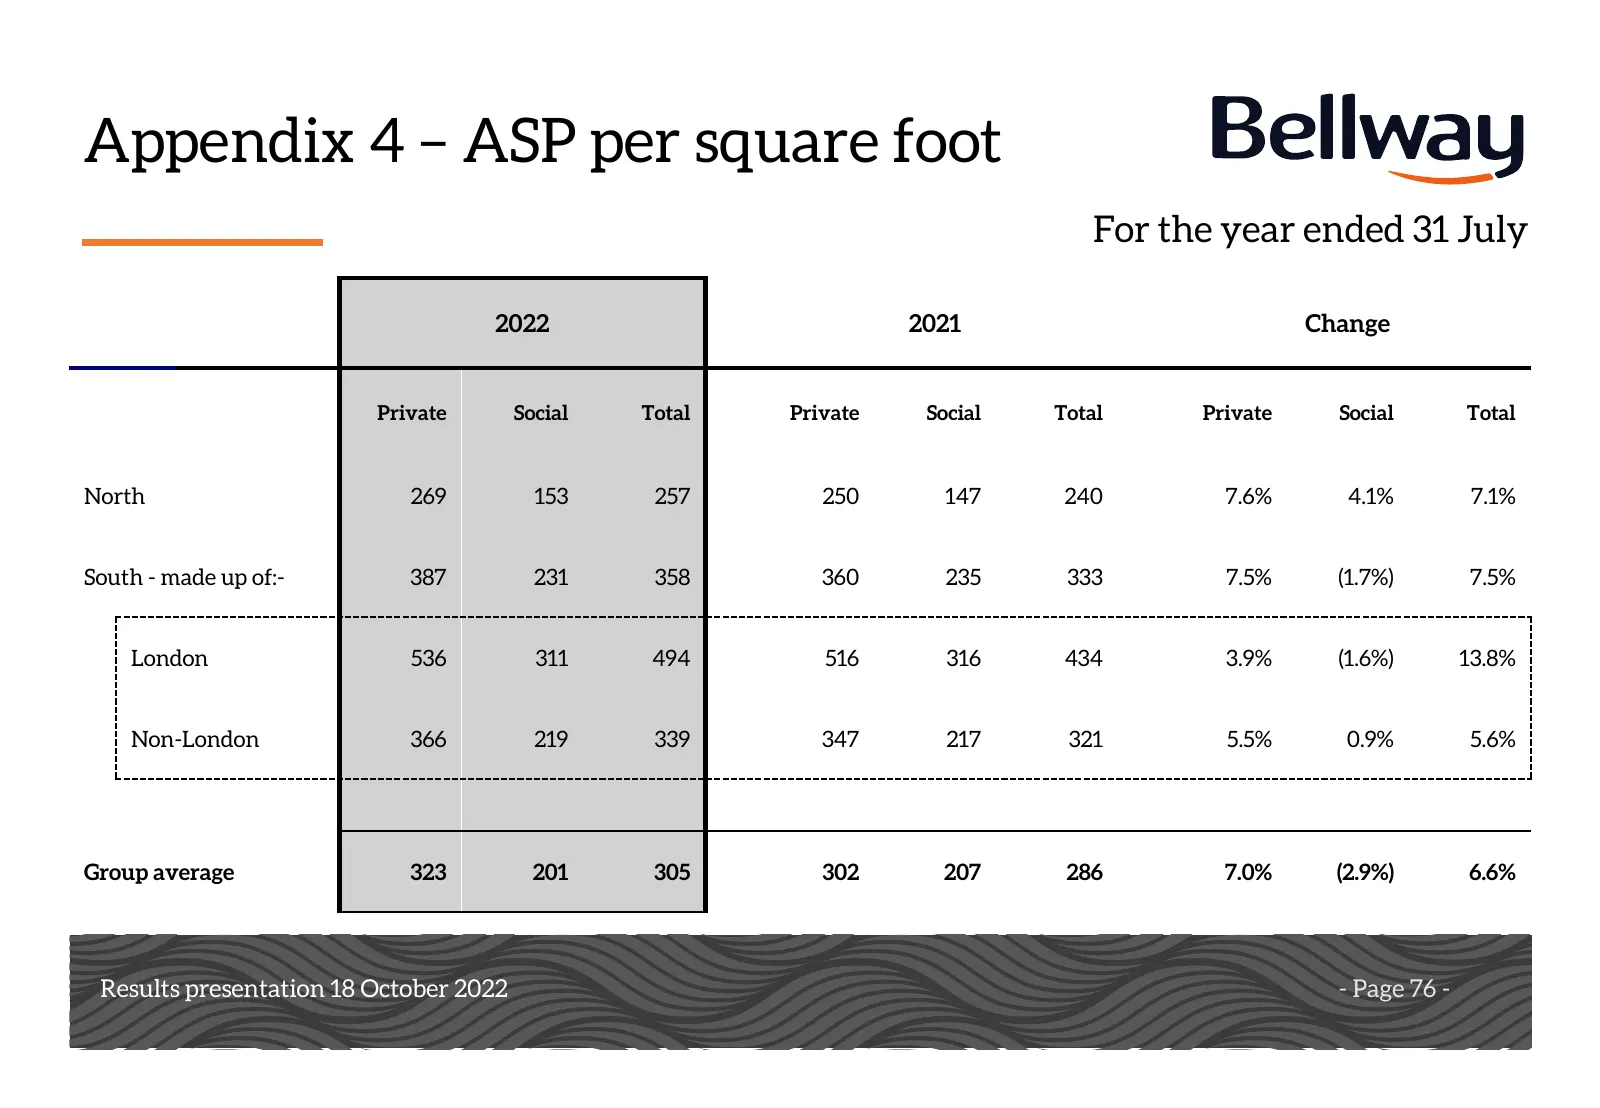
Appendix 4 – ASP per square foot For the year ended 31 July 2022 2021 Change Private Social Total Private Social Total Private Social Total North 269 153 257 250 147 240 7.6% 4.1% 7.1% South - made up of:- 387 231 358 360 235 333 7.5% (1.7%) 7.5% London 536 311 494 516 316 434 3.9% (1.6%) 13.8% Non-

Slide 77: Notes
Notes Results presentation Results presentation1816 October 2022 October 2018 - Page 77 -
Slide 78: Appendix 5 – Geographic split
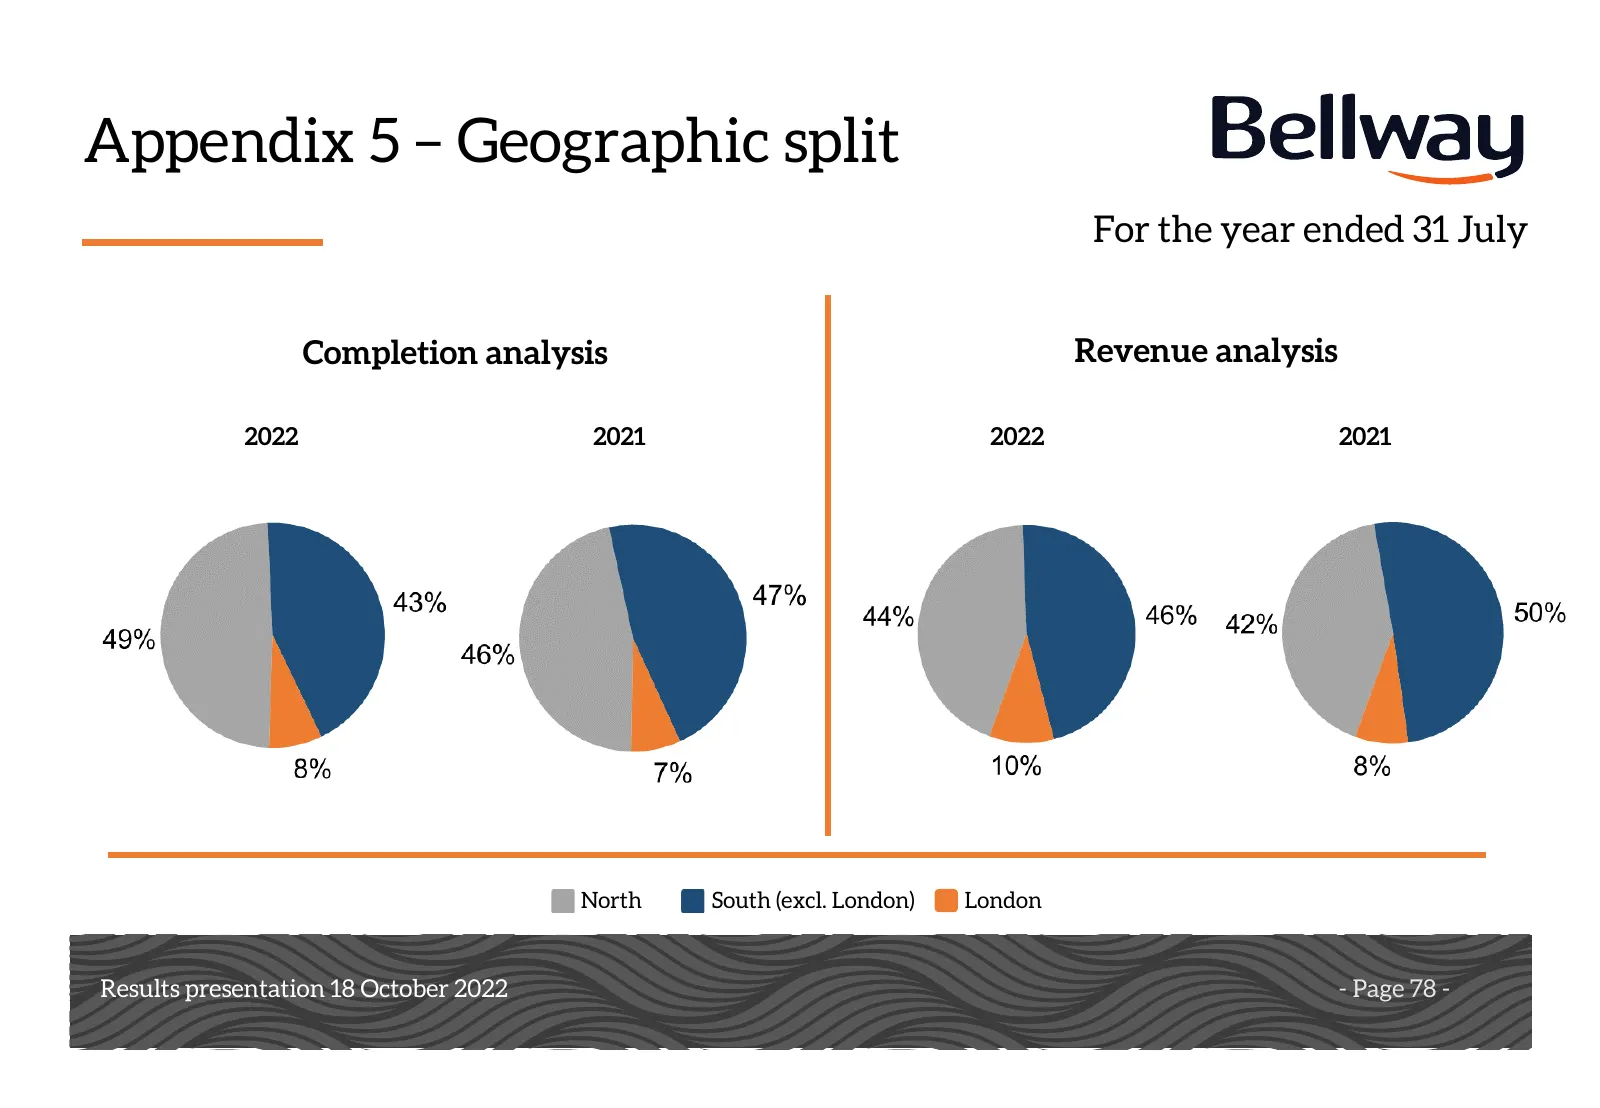
Appendix 5 – Geographic split For the year ended 31 July Completion analysis Revenue analysis 2022 2021 2022 2021 North South (excl. London) London Results presentation Results presentation1816 October 2022 October 2018 - Page 78 -

Slide 79: Notes
Notes Results presentation Results presentation1816 October 2022 October 2018 - Page 79 -
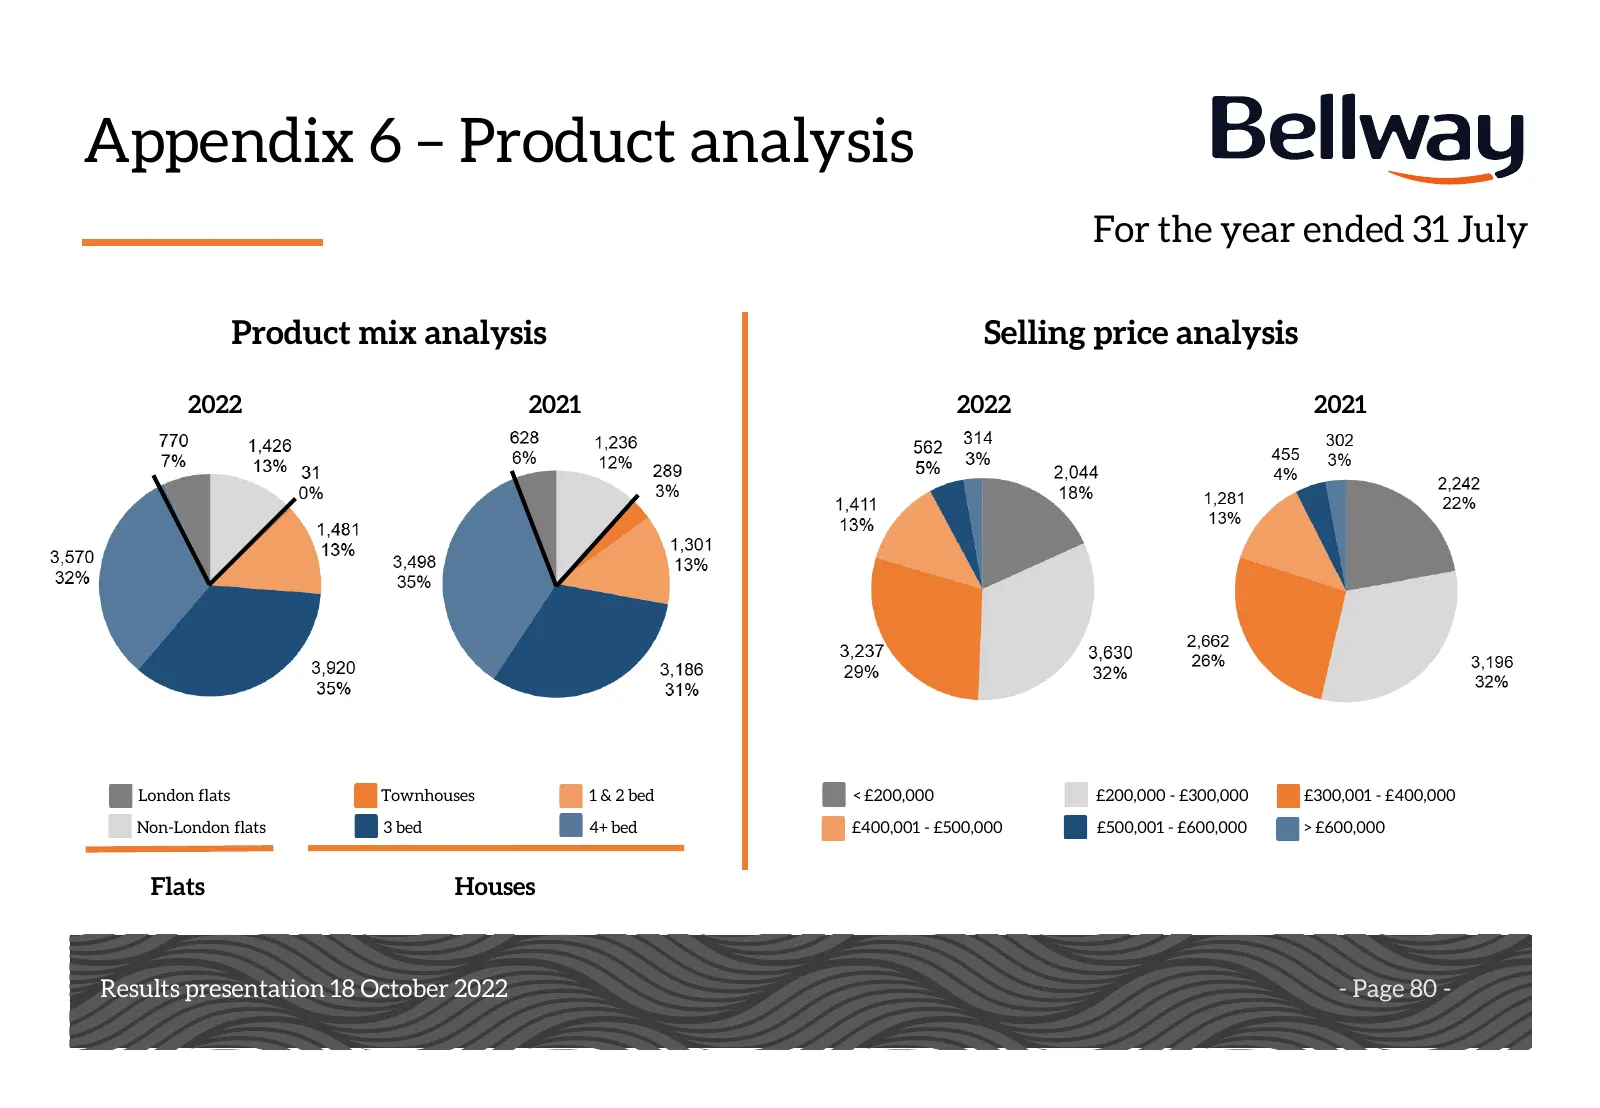
Slide 80: Appendix 6 – Product analysis
Appendix 6 – Product analysis For the year ended 31 July Product mix analysis Selling price analysis 2022 2021 2022 2021 London flats Townhouses 1 & 2 bed < £200,000 £200,000 - £300,000 £300,001 - £400,000 Non-London flats 3 bed 4+ bed £400,001 - £500,000 £500,001 - £600,000 > £600,000 Flats Houses

Slide 81: Notes
Notes Results presentation Results presentation1816 October 2022 October 2018 - Page 81 -
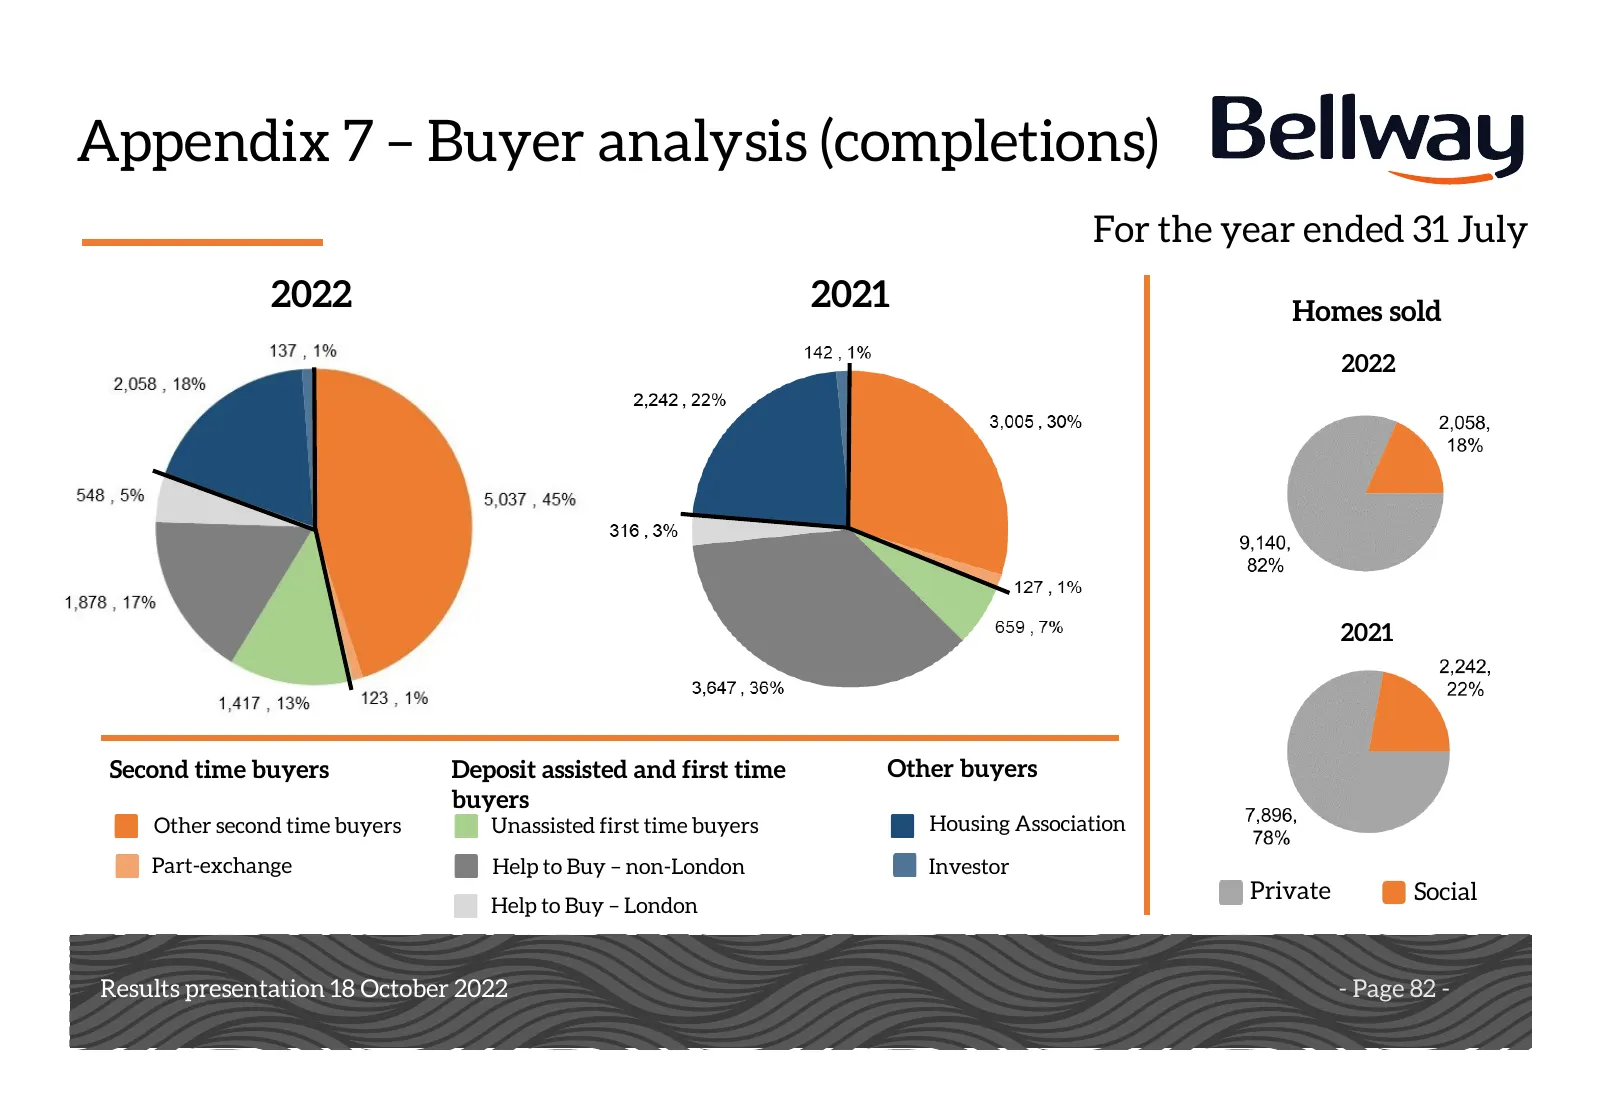
Slide 82: Appendix 7 – Buyer analysis (completions)
Appendix 7 – Buyer analysis (completions) For the year ended 31 July 2022 2021 Homes sold 2022 2021 Second time buyers Deposit assisted and first time Other buyers buyers Other second time buyers Unassisted first time buyers Housing Association Part-exchange Help to Buy – non-London Investor Private

Slide 83: Notes
Notes Results presentation Results presentation1816 October 2022 October 2018 - Page 83 -
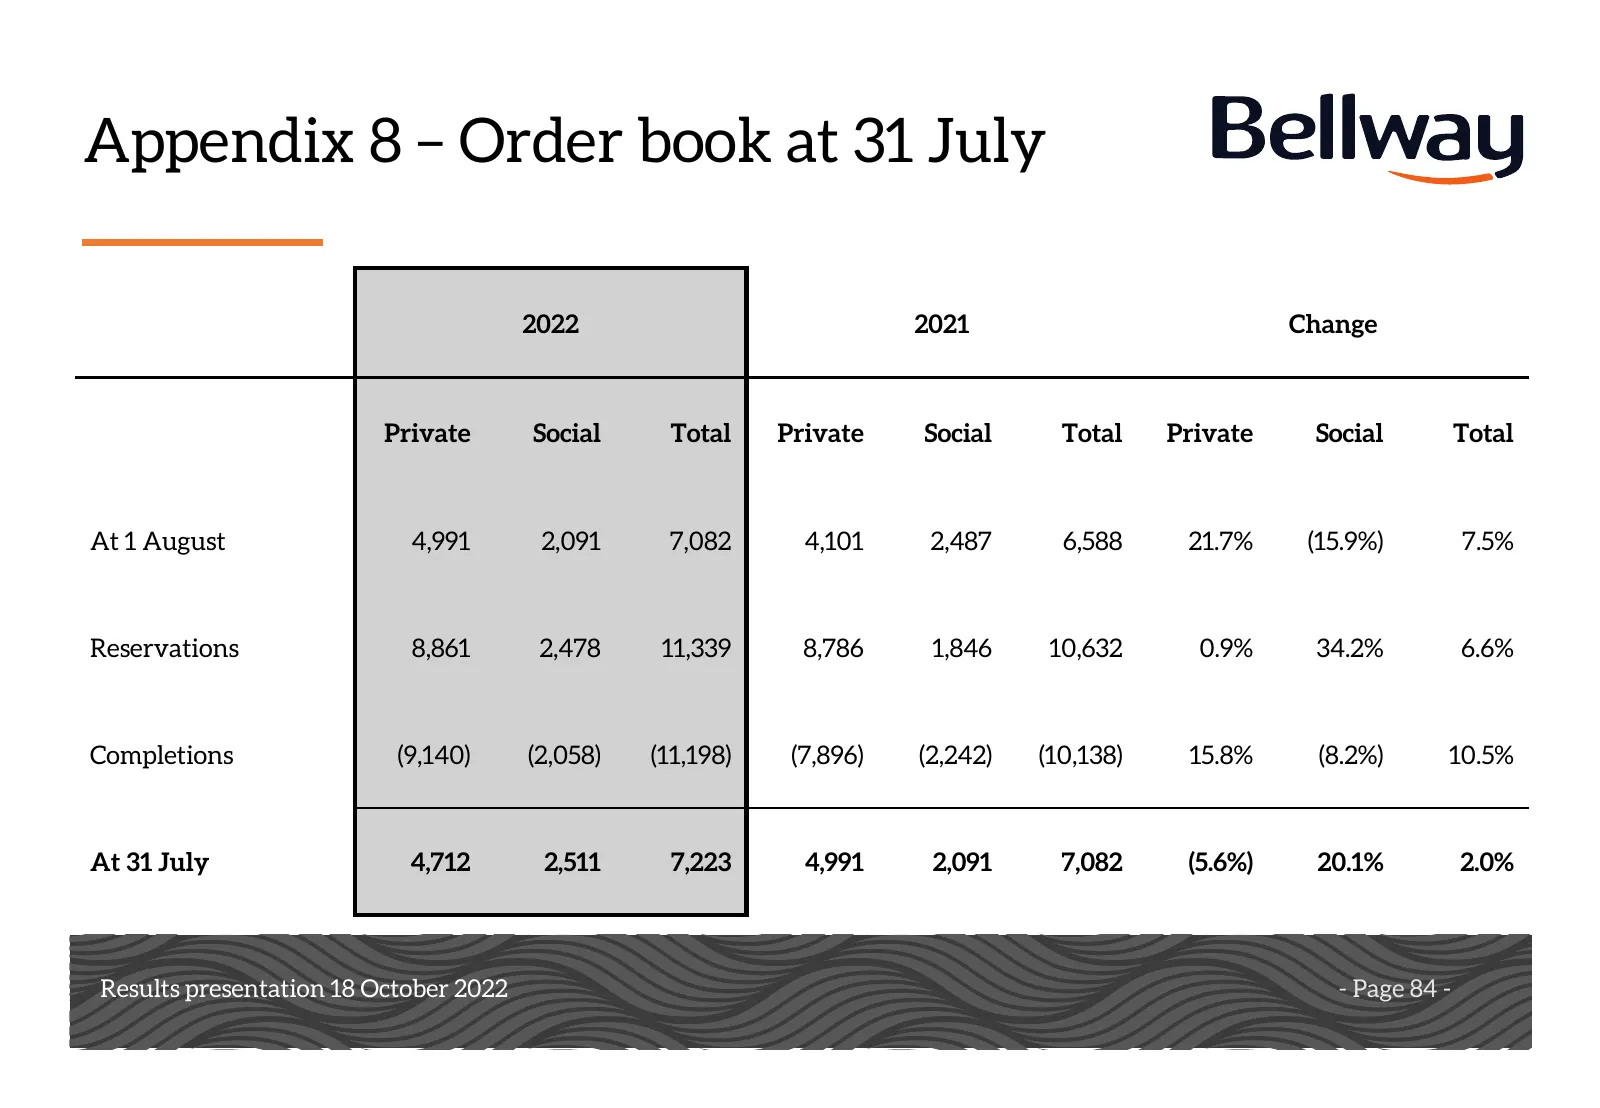
Slide 84: Appendix 8 – Order book at 31 July
Appendix 8 – Order book at 31 July 2022 2021 Change Private Social Total Private Social Total Private Social Total At 1 August 4,991 2,091 7,082 4,101 2,487 6,588 21.7% (15.9%) 7.5% Reservations 8,861 2,478 11,339 8,786 1,846 10,632 0.9% 34.2% 6.6% Completions (9,140) (2,058) (11,198) (7,896) (2,242

Slide 85: Notes
Notes Results presentation Results presentation1816 October 2022 October 2018 - Page 85 -
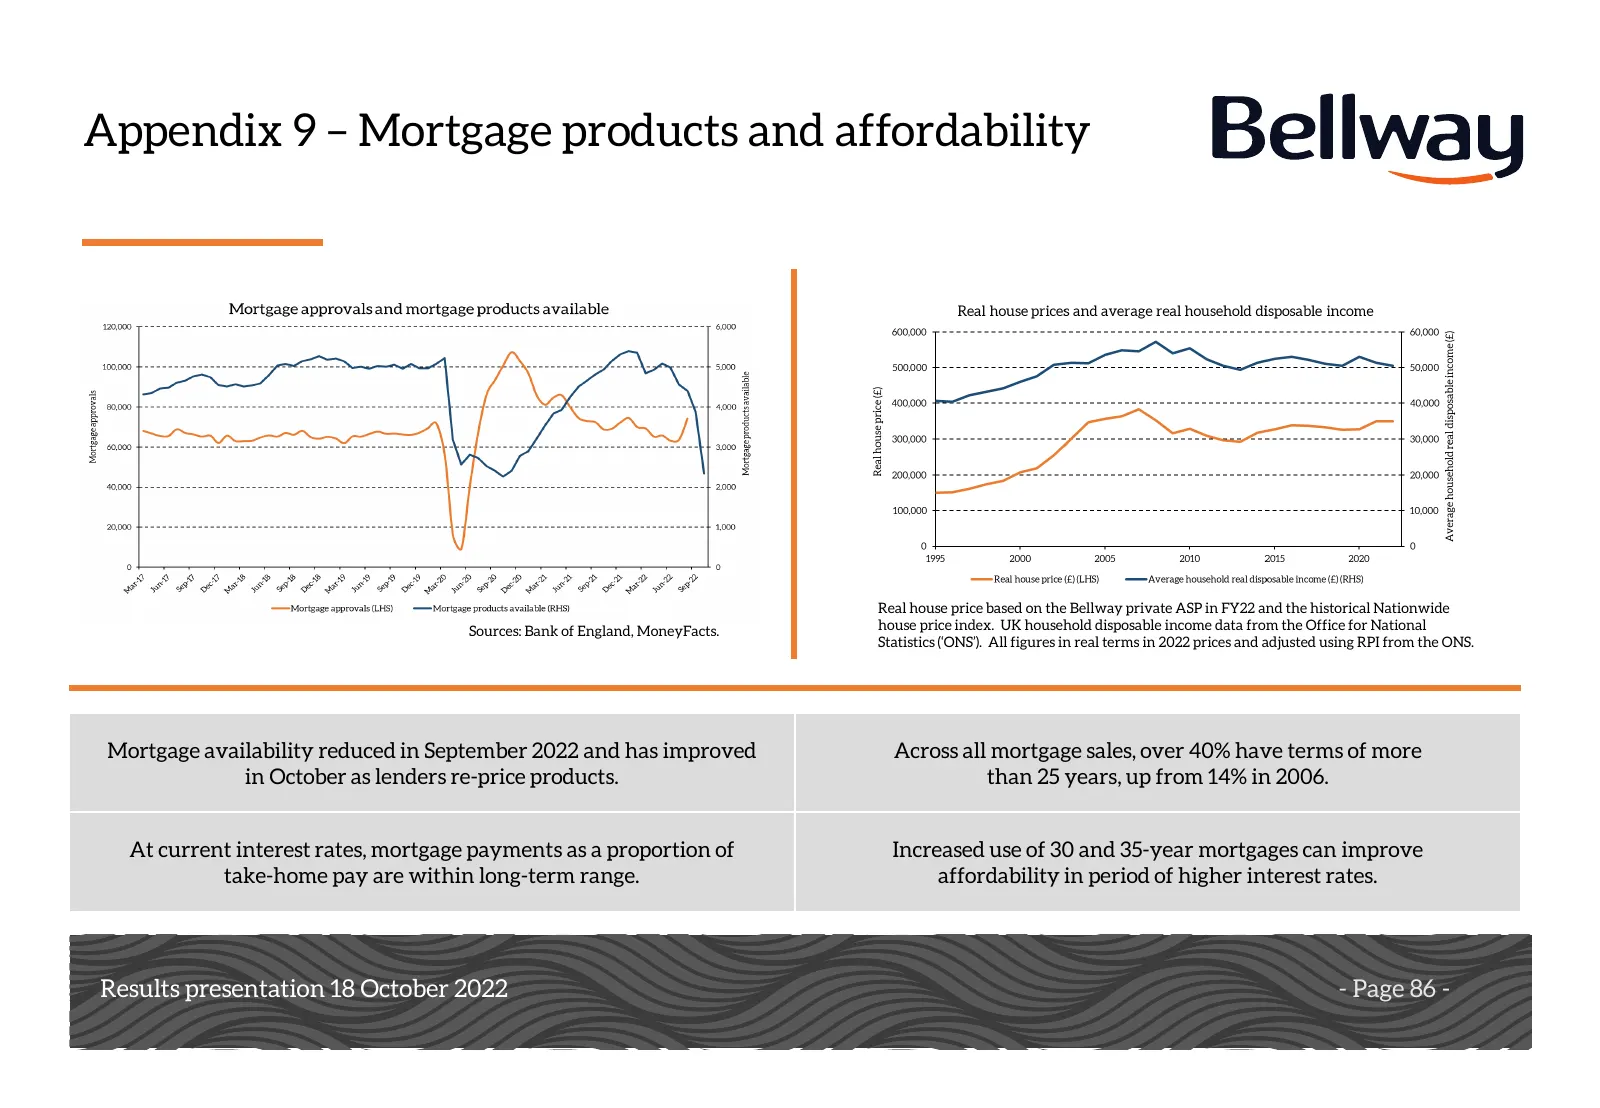
Slide 86: Appendix 9 – Mortgage products and affordability
Appendix 9 – Mortgage products and affordability Real house price based on the Bellway private ASP in FY22 and the historical Nationwide Sources: Bank of England, MoneyFacts. house price index. UK household disposable income data from the Office for National Statistics (‘ONS’). All figures in real t

Slide 87: Notes
Notes Results presentation Results presentation1816 October 2022 October 2018 - Page 87 -
Slide 88: Appendix 10 - Land with detailed planning permission
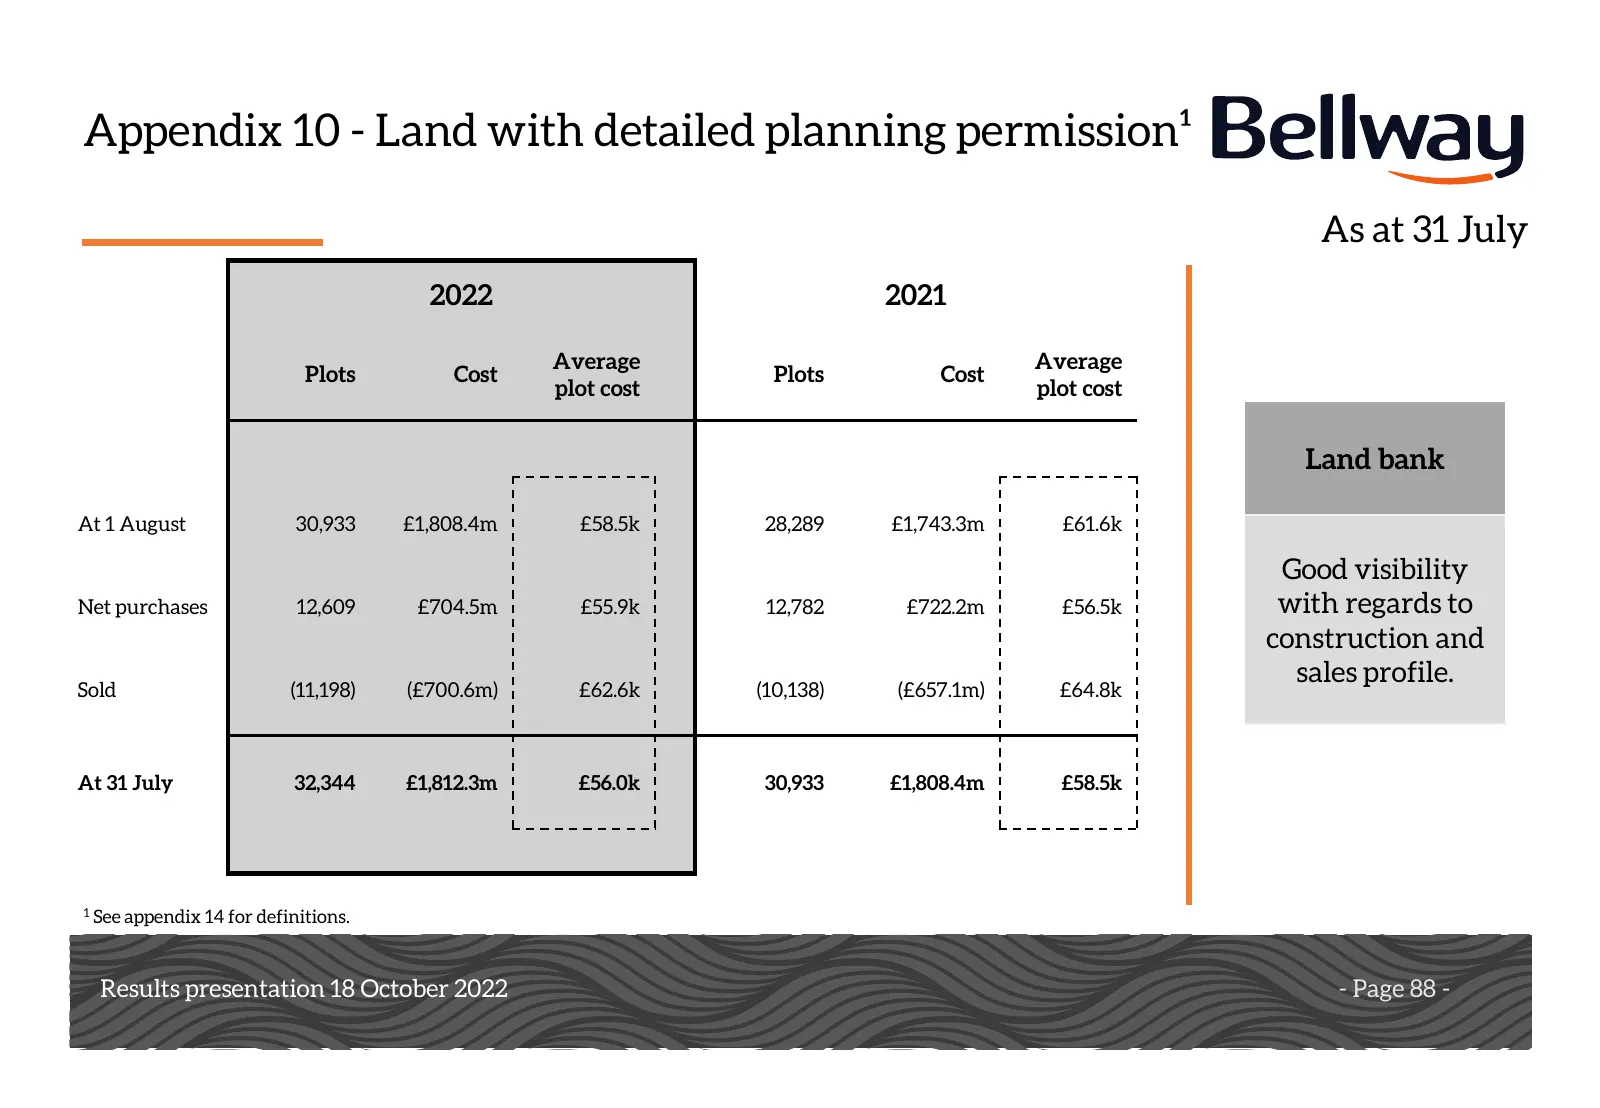
Appendix 10 - Land with detailed planning permission¹ As at 31 July 2022 2021 Average Average Plots Cost Plots Cost plot cost plot cost Land bank At 1 August 30,933 £1,808.4m £58.5k 28,289 £1,743.3m £61.6k Good visibility Net purchases 12,609 £704.5m £55.9k 12,782 £722.2m £56.5k with regards to cons

Slide 89: Notes
Notes Results presentation Results presentation1816 October 2022 October 2018 - Page 89 -
Slide 90: Appendix 11 – Land supply
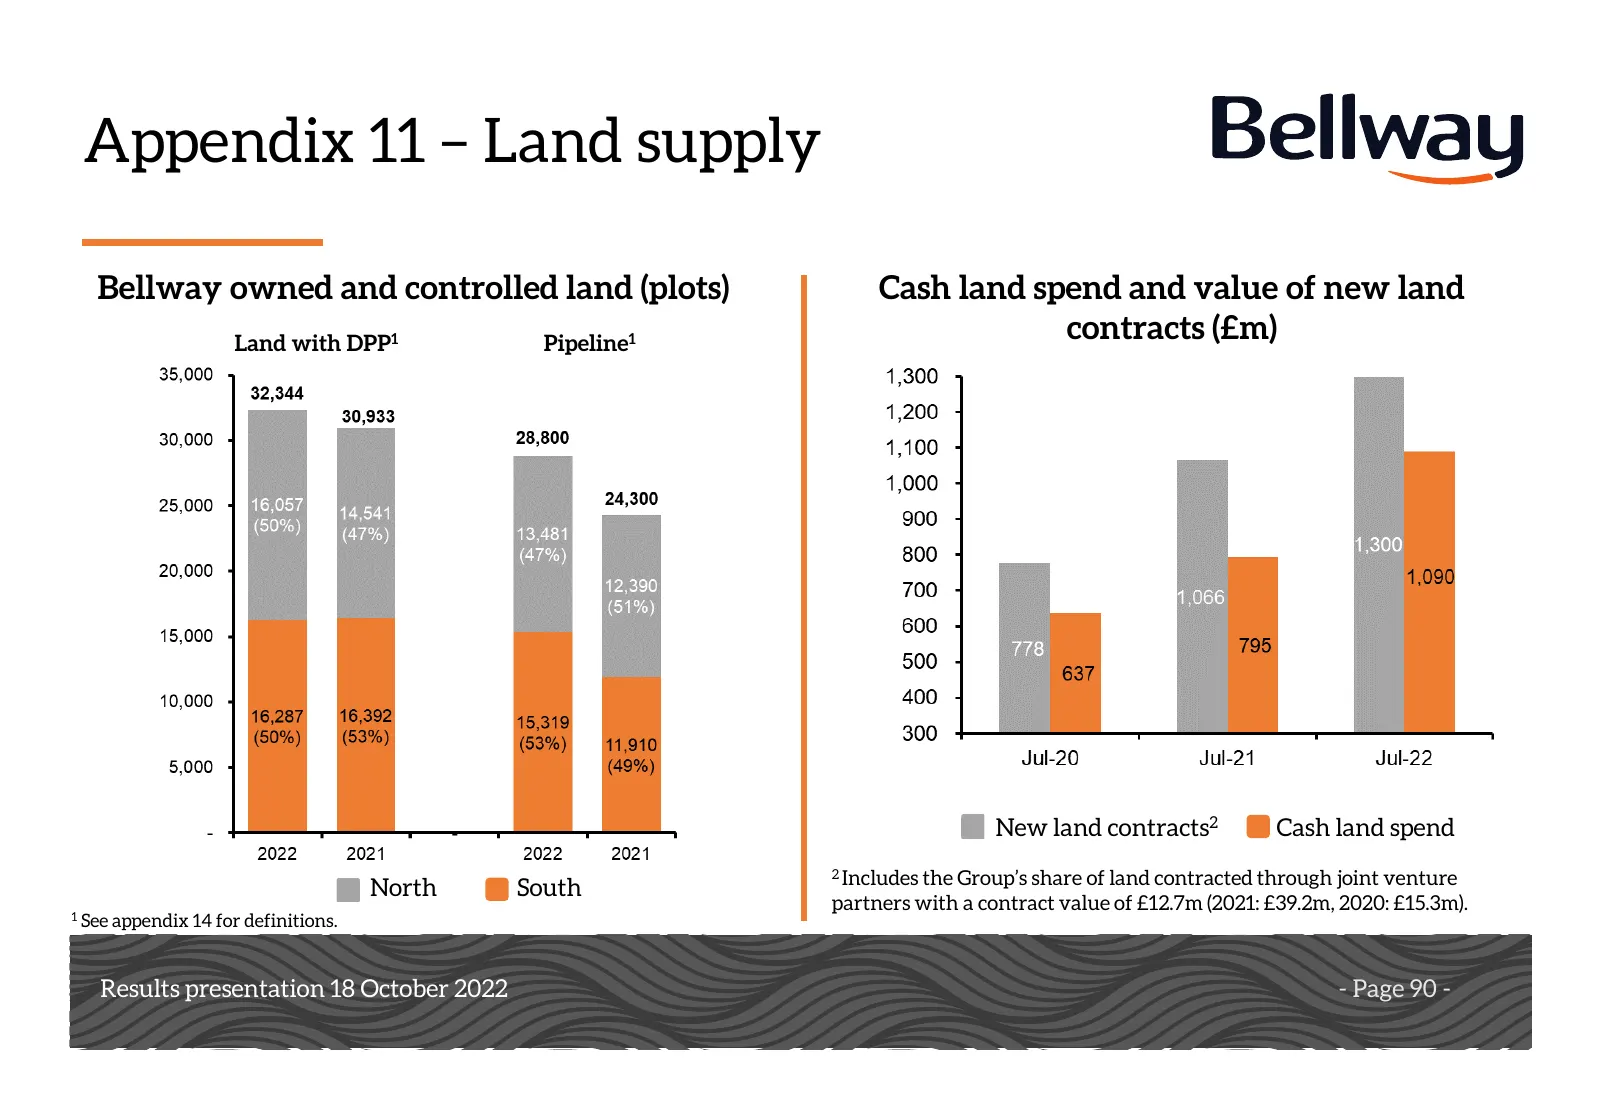
Appendix 11 – Land supply Bellway owned and controlled land (plots) Cash land spend and value of new land Land with DPP1 Pipeline1 contracts (£m) New land contracts2 Cash land spend 2 Includes the Group’s share of land contracted through joint venture North South partners with a contract value of £1

Slide 91: Notes
Notes Results presentation Results presentation1816 October 2022 October 2018 - Page 91 -
Slide 92: Appendix 12 – Strategic land
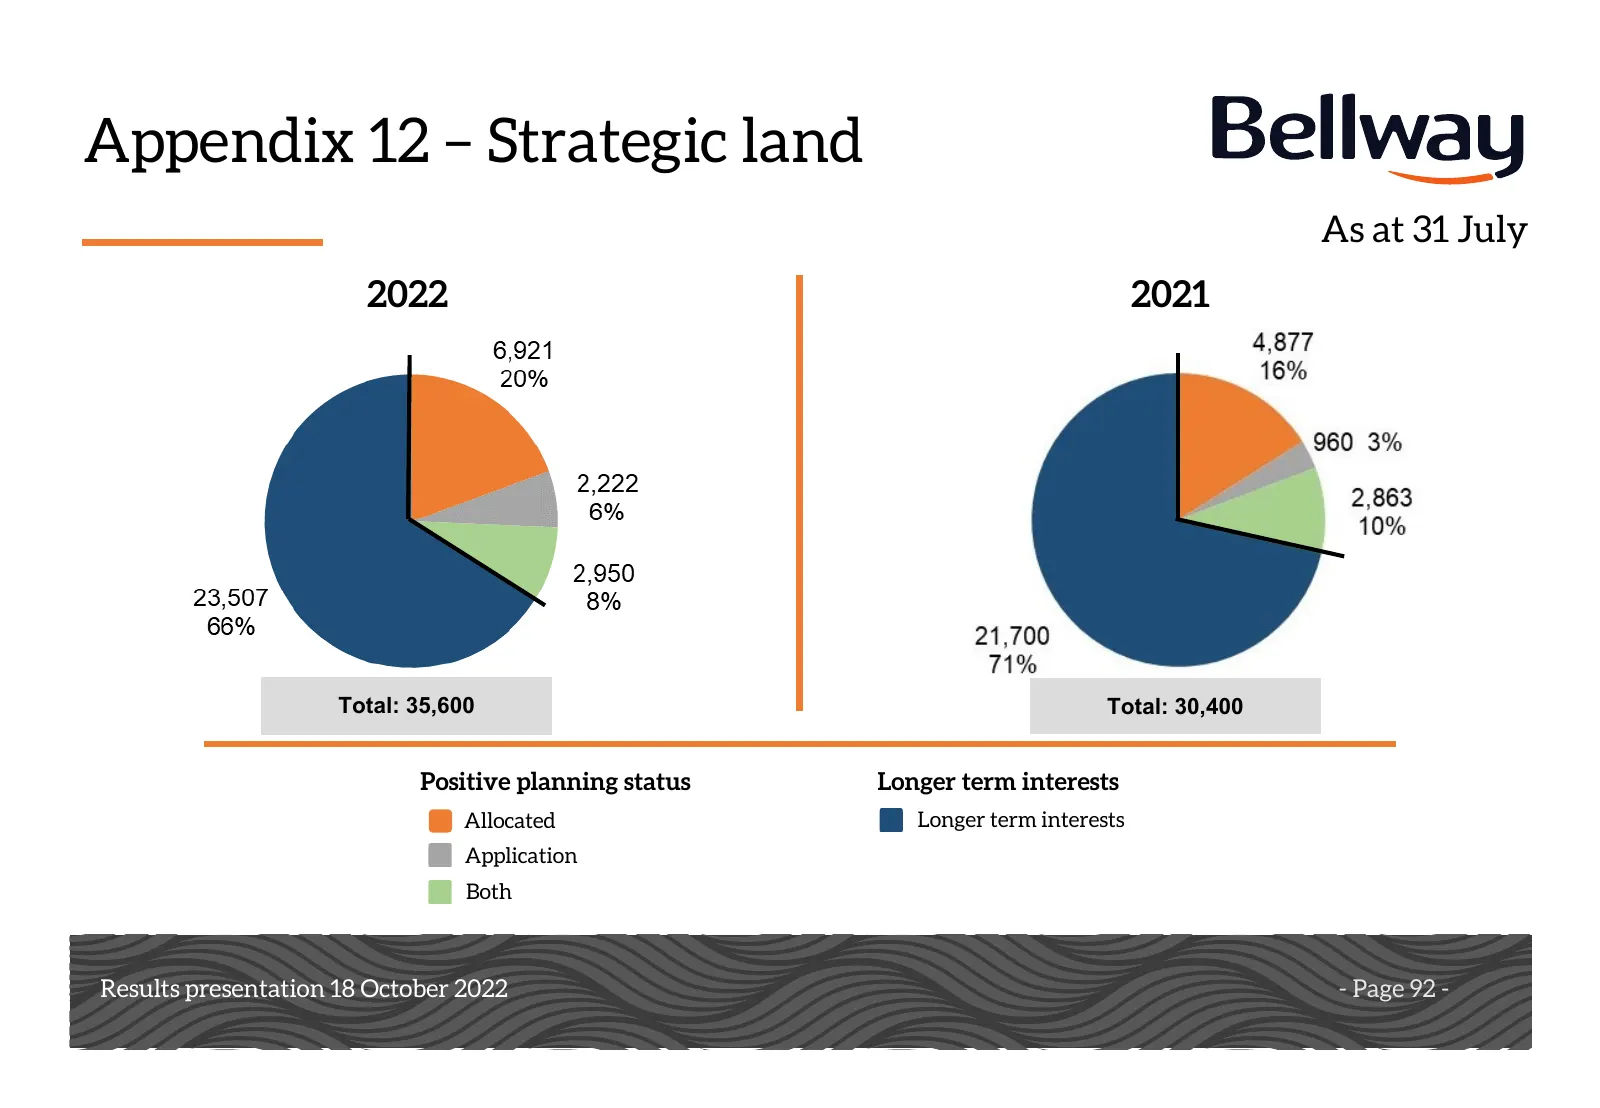
Appendix 12 – Strategic land As at 31 July 2022 2021 Total: 35,600 Total: 30,400 Positive planning status Longer term interests Allocated Longer term interests Application Both Results presentation Results presentation1816 October 2022 October 2018 - Page 92 -

Slide 93: Notes
Notes Results presentation Results presentation1816 October 2022 October 2018 - Page 93 -
Slide 94: Appendix 13 – Land creditors
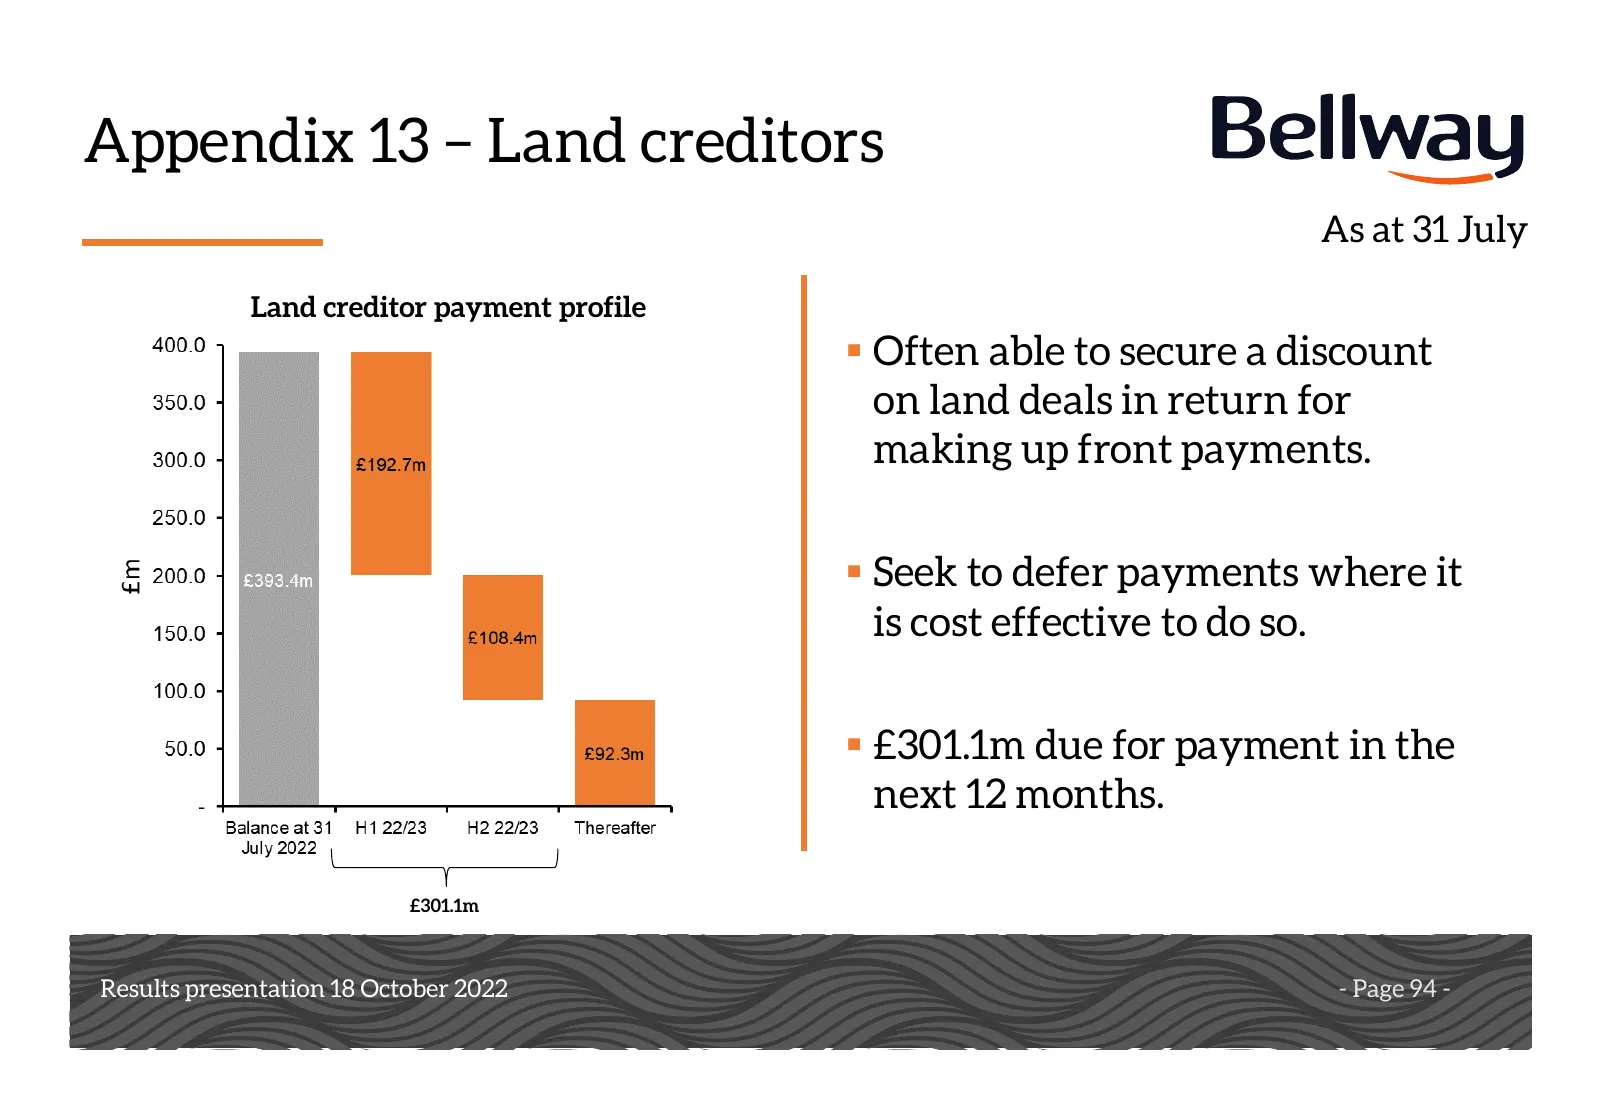
Appendix 13 – Land creditors As at 31 July Land creditor payment profile Often able to secure a discount on land deals in return for making up front payments. Seek to defer payments where it is cost effective to do so. £301.1m due for payment in the next 12 months. £301.1m Results presentation

Slide 95: Notes
Notes Results presentation Results presentation1816 October 2022 October 2018 - Page 95 -
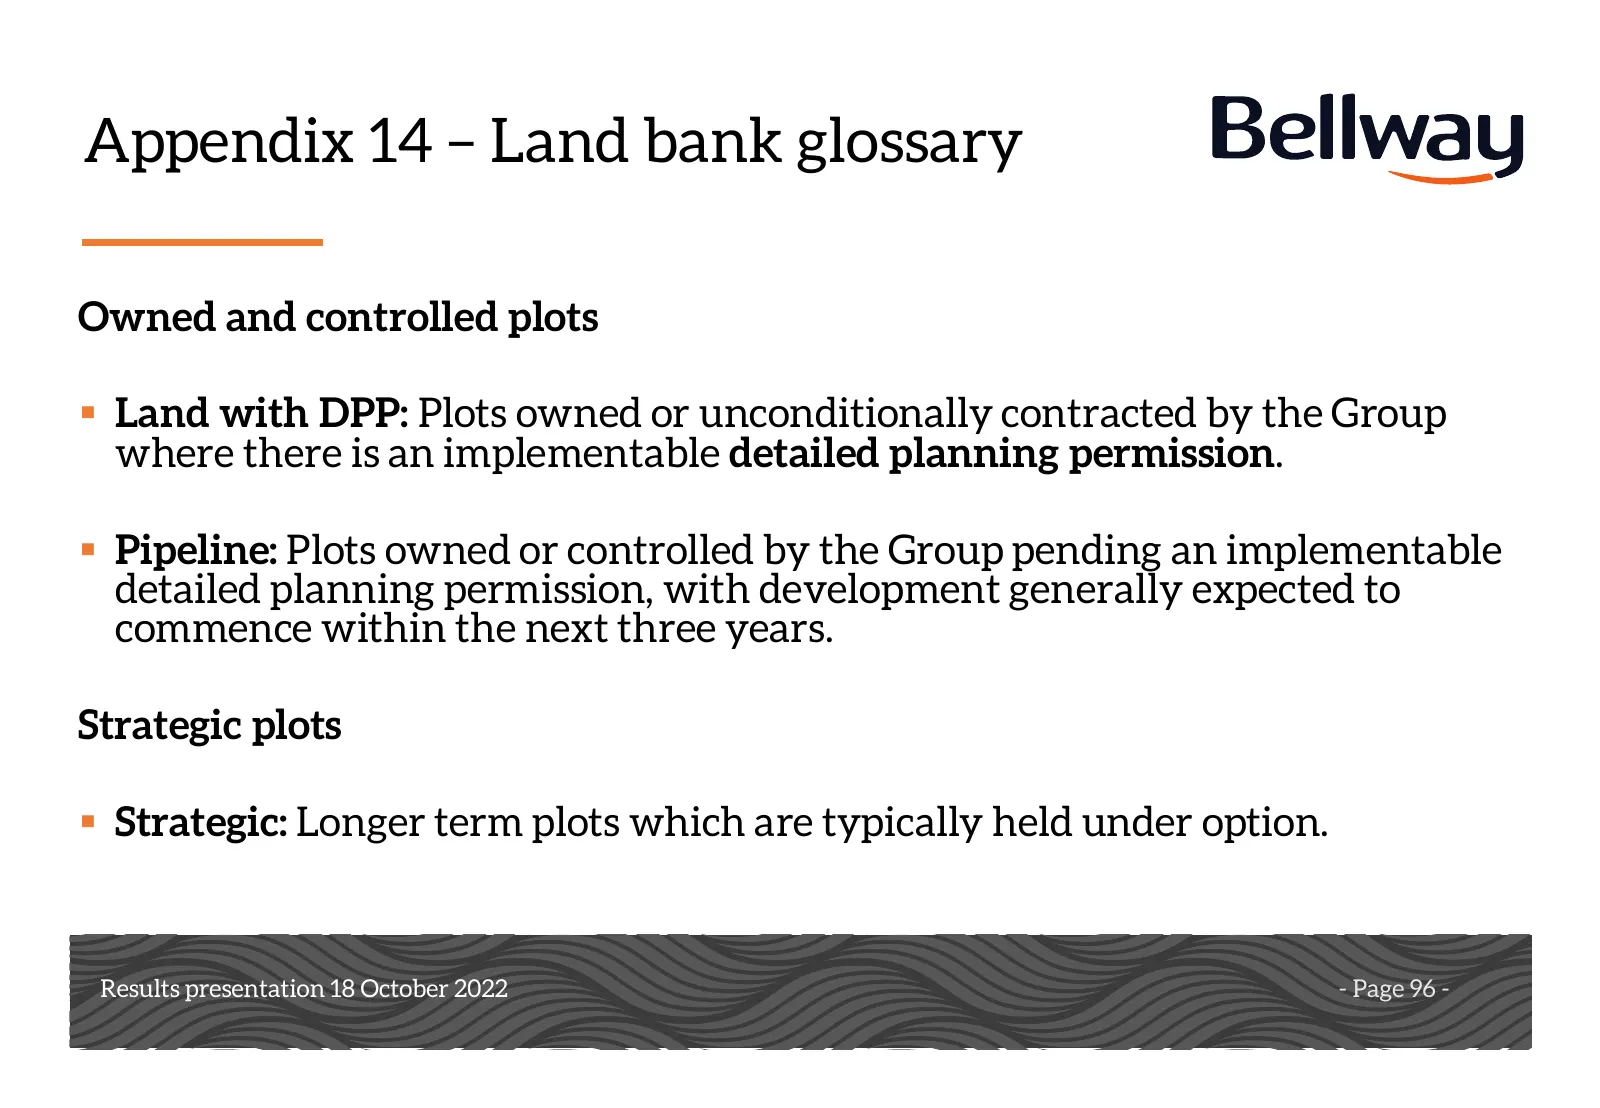
Slide 96: Appendix 14 – Land bank glossary
Appendix 14 – Land bank glossary Owned and controlled plots Land with DPP: Plots owned or unconditionally contracted by the Group where there is an implementable detailed planning permission. Pipeline: Plots owned or controlled by the Group pending an implementable detailed planning permission,

Slide 97: Notes
Notes Results presentation Results presentation1816 October 2022 October 2018 - Page 97 -
Slide 98: Disclaimer
Disclaimer This presentation is not intended to, and does not constitute or form part of, any offer, invitation or the solicitation of an offer to purchase, otherwise acquire, subscribe for, sell or otherwise dispose of, any securities in Bellway p.l.c. or any other invitation or inducement to engag

Slide 99: Results presentation
Results presentation Results presentation1816 October 2022 October 2018 - Page 99 -
Source: Internet Archive copy of bellwayplc.co.uk
More decks from Bellway p.l.c.
 FY2026 Earnings Presentation39 slides · Oct 13, 2026
 H1 2026 Earnings Presentation34 slides · Mar 24, 2026
 FY2025 Earnings Presentation40 slides · Oct 14, 2025
 H1 2024 Earnings Presentation45 slides · Jan 31, 2024
 H1 2023 Earnings Presentation97 slides · Mar 28, 2023
 FY2022 Earnings Presentation52 slides · October 2022