Bellway p.l.c. · LSE:BWY
Bellway p.l.c — H1 2026 Earnings Presentation
34 slides from Bellway p.l.c's earnings presentation, Mar 24, 2026

Slide 1: Interim Results Presentation
Interim Results Presentation 24 March 2026
Slide 2: Today’s agenda
Today’s agenda 1. Introduction 2. Finance review 3. Operating review and outlook 4. Q&A 5. Appendices Results presentation for the half year ended 31 January 2026 02

Slide 3: Introduction
Introduction Jason Honeyman Chief Executive Results presentation for the half year ended 31 January 2026 03
Slide 4: Robust first half performance
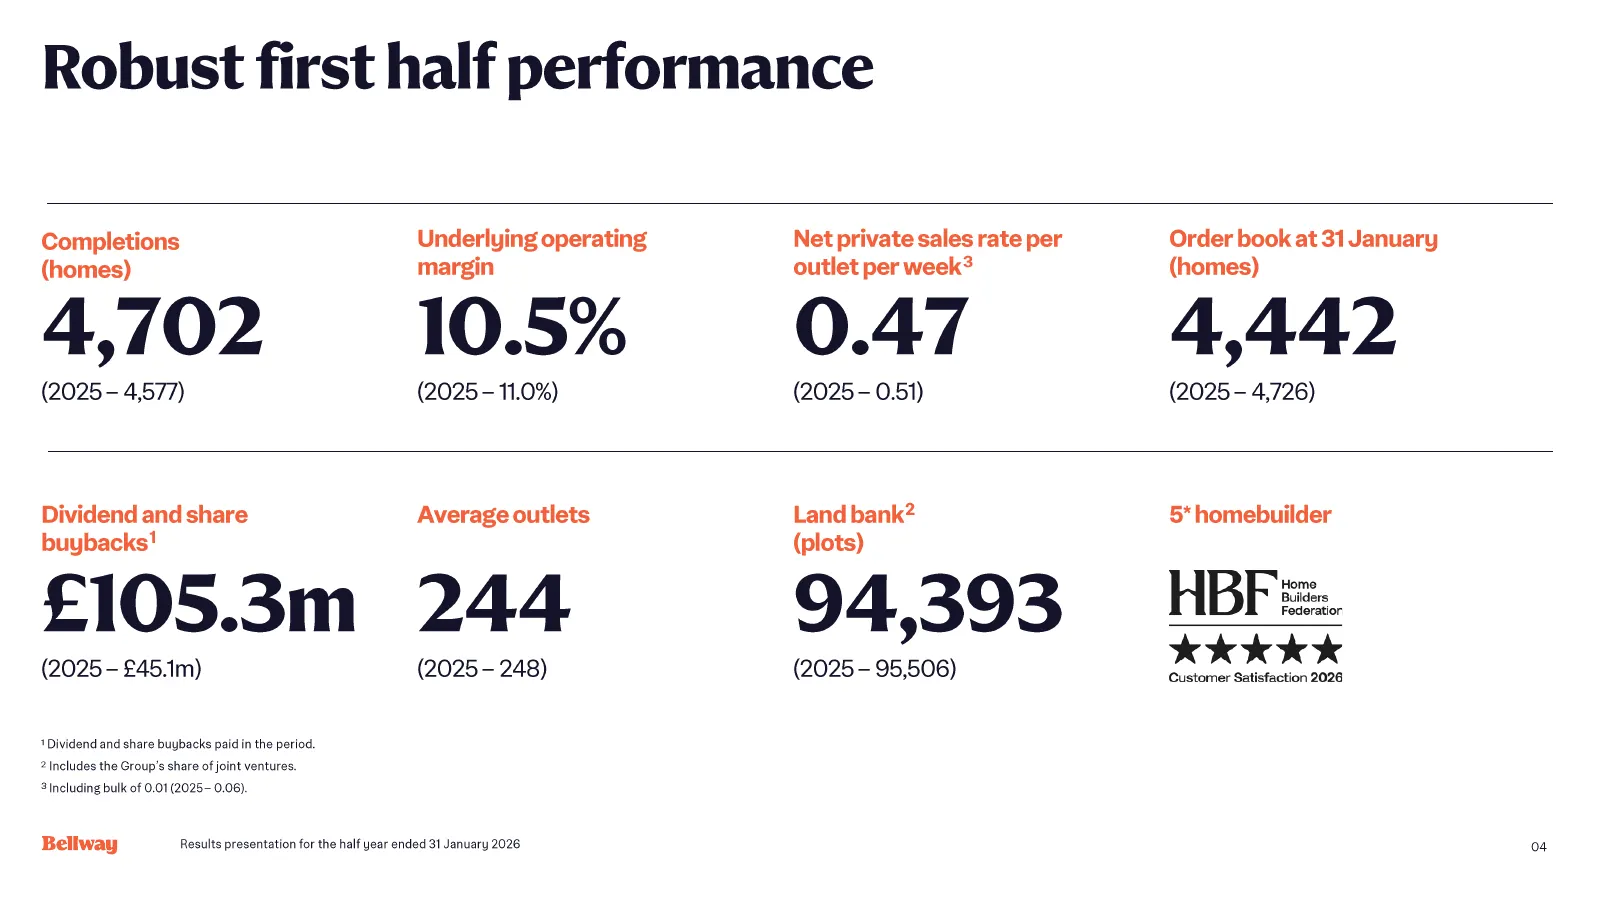
Robust first half performance Completions Underlying operating Net private sales rate per Order book at 31 January (homes) margin outlet per week 3 (homes) 4,702 10.5% 0.47 4,442 (2025 – 4,577) (2025 – 11.0%) (2025 – 0.51) (2025 – 4,726) Dividend and share Average outlets Land bank 2 5* homebuilder

Slide 5: Finance review
Finance review Shane Doherty Chief Financial Officer Results presentation for the half year ended 31 January 2026 05
Slide 6: Financial performance
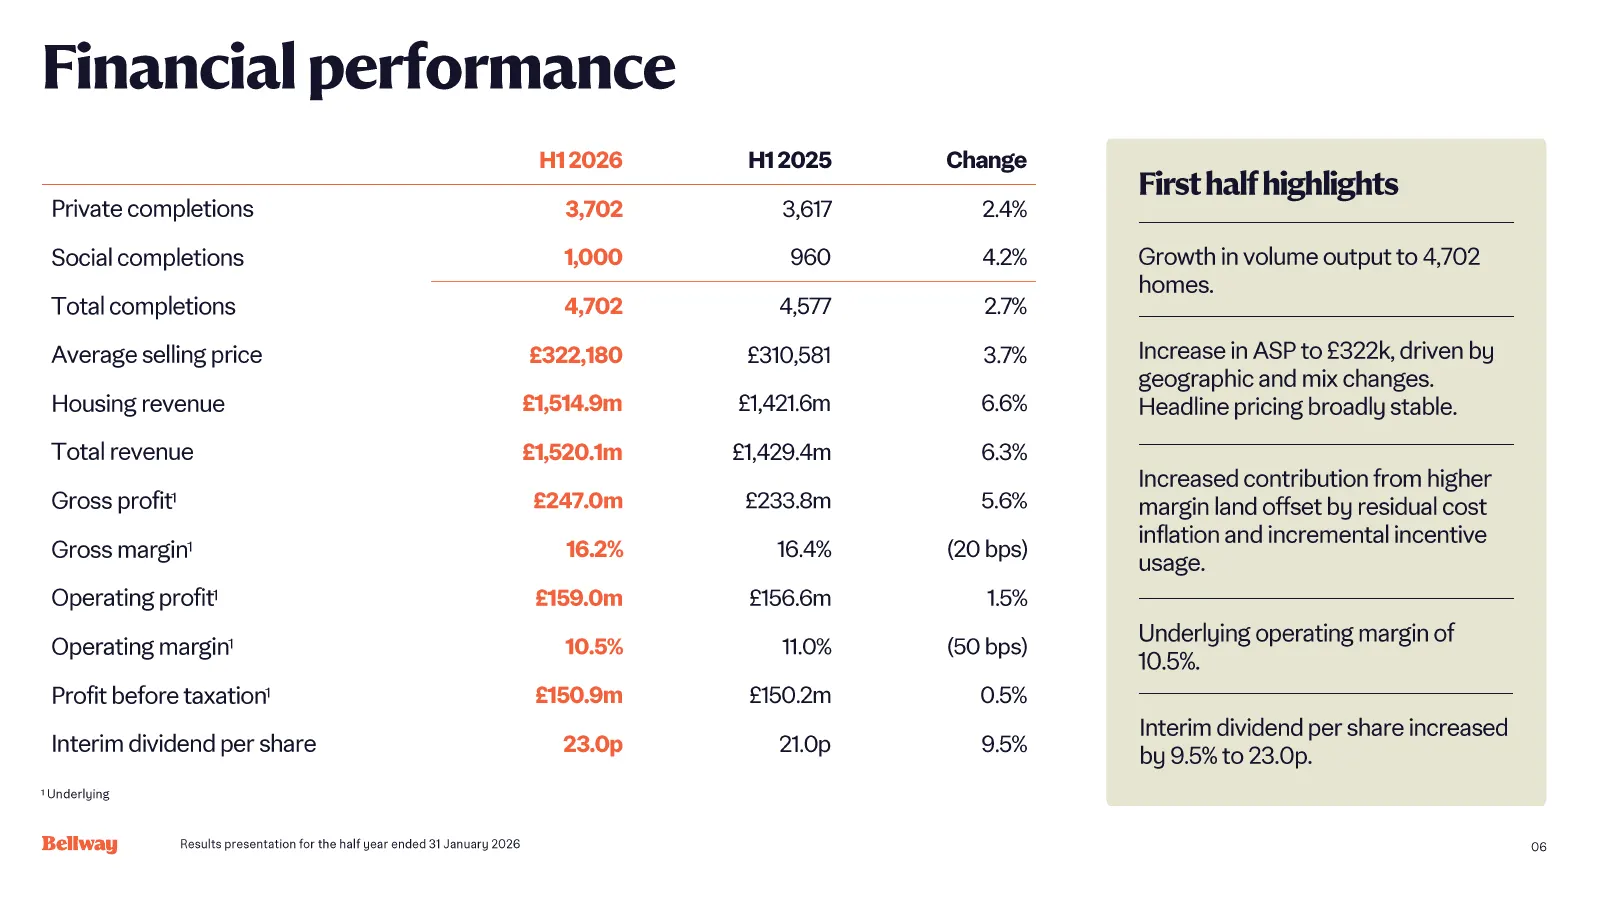
Financial performance H1 2026 H1 2025 Change First half highlights Private completions 3,702 3,617 2.4% Social completions 1,000 960 4.2% Growth in volume output to 4,702 homes. Total completions 4,702 4,577 2.7% Average selling price £322,180 £310,581 3.7% Increase in ASP to £322k, driven by geogra
Slide 7: A strong balance sheet
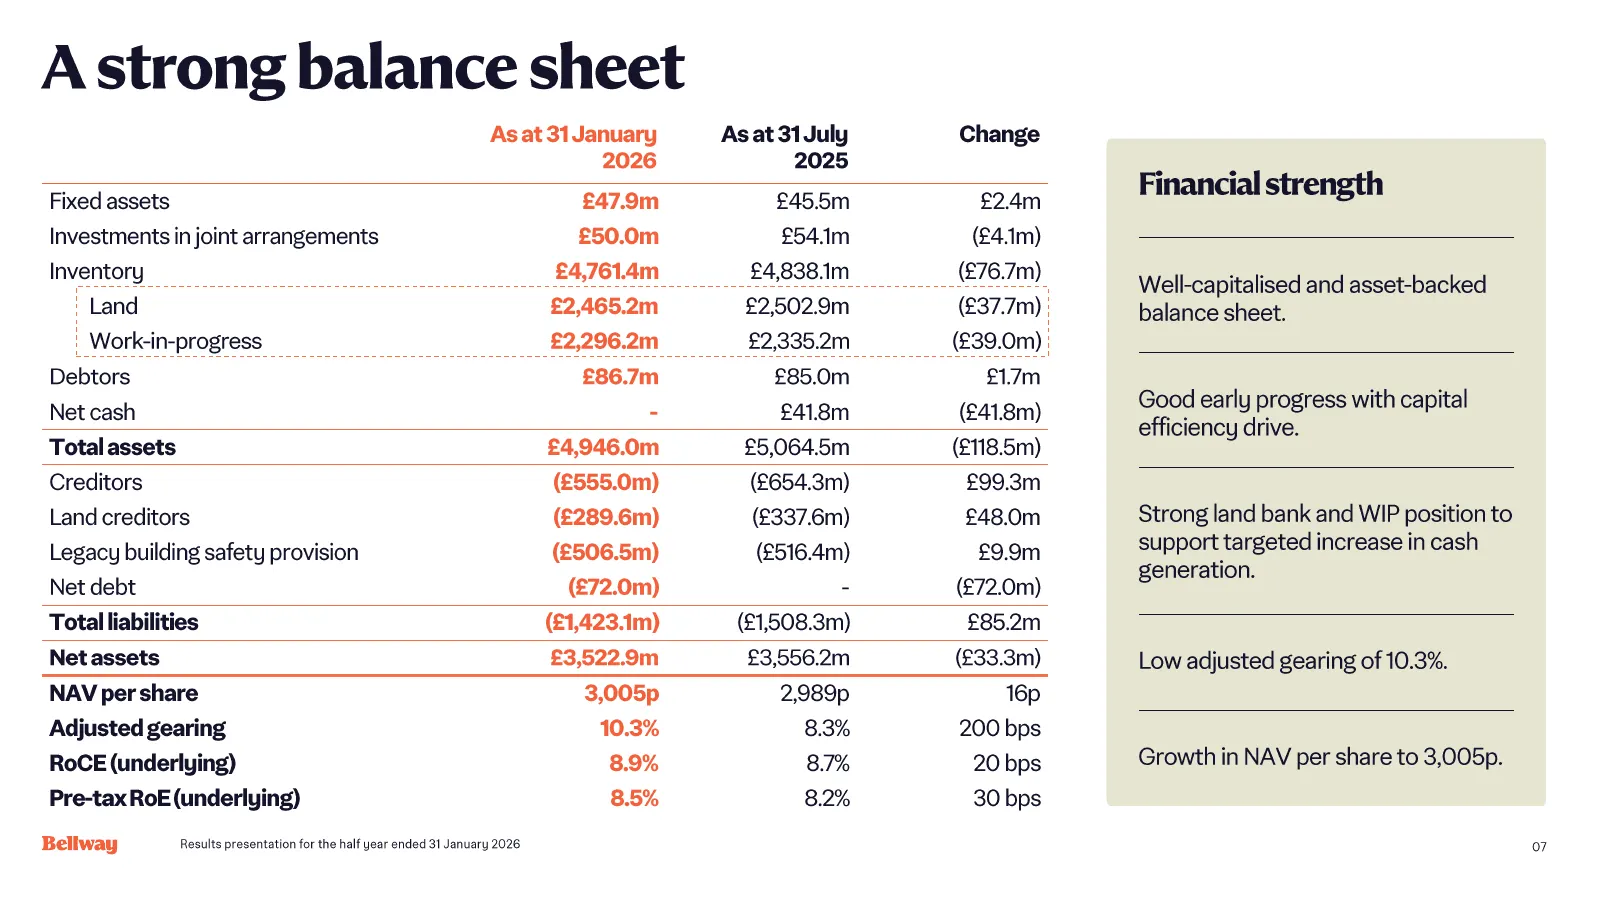
A strong balance sheet As at 31 January As at 31 July Change 2026 2025 Fixed assets £47.9m £45.5m £2.4m Financial strength Investments in joint arrangements £50.0m £54.1m (£4.1m) Inventory £4,761.4m £4,838.1m (£76.7m) Well-capitalised and asset -backed Land £2,465.2m £2,502.9m (£37.7m) balance sheet
Slide 8: Legacy building safety – stable provision
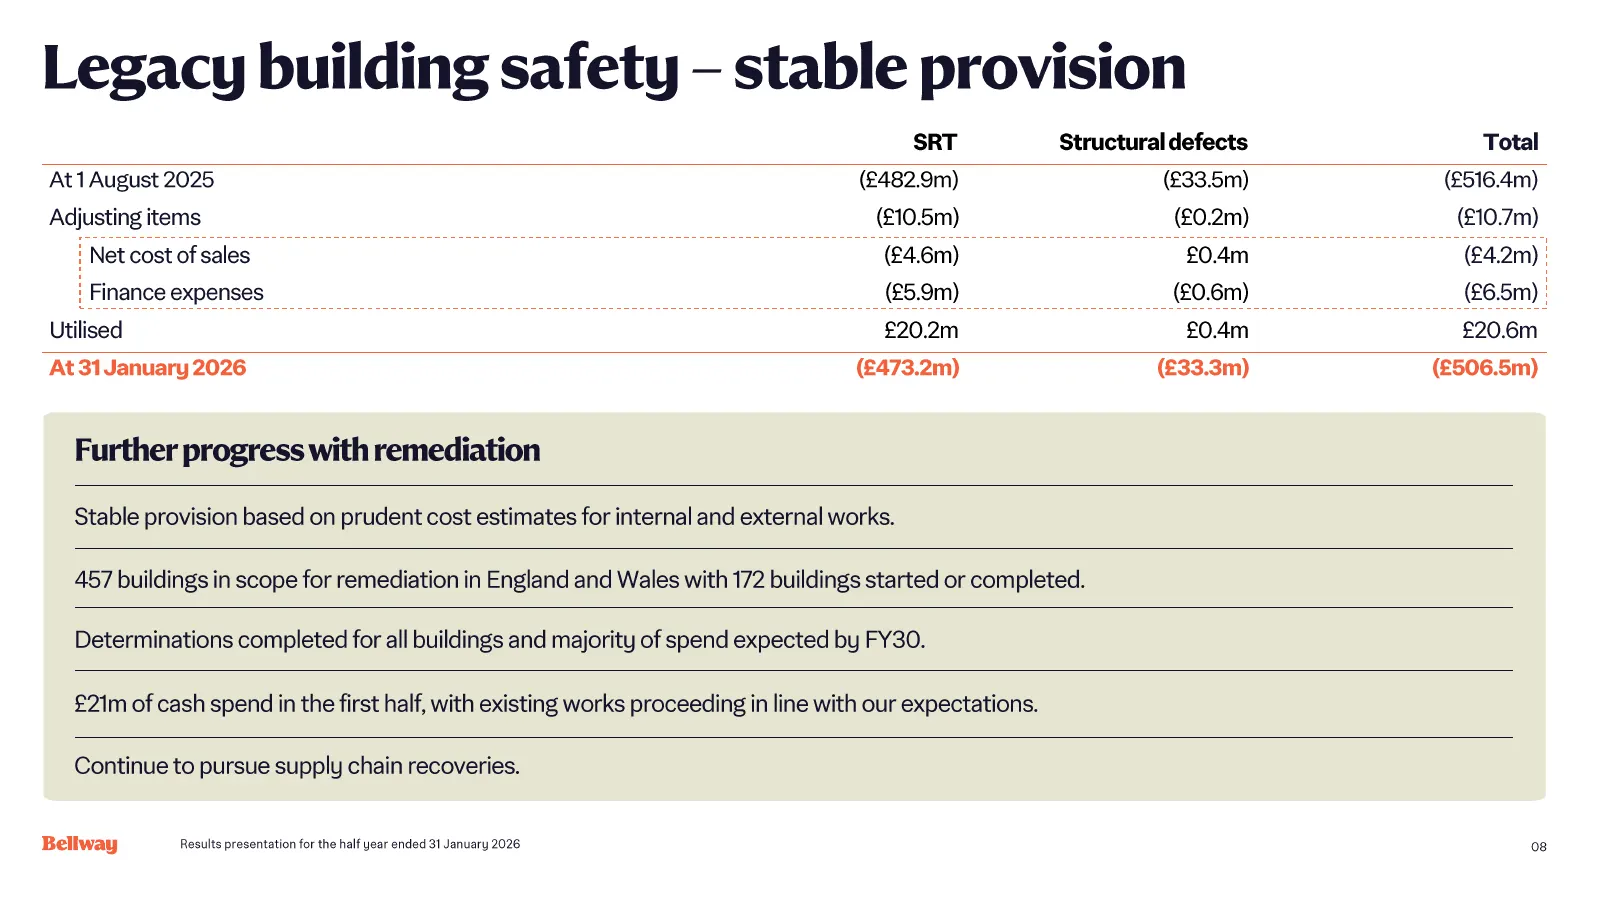
Legacy building safety – stable provision SRT Structural defects Total At 1 August 2025 (£482.9m) (£33.5m) (£516.4m) Adjusting items (£10.5m) (£0.2m) (£10.7m) Net cost of sales (£4.6m) £0.4m (£4.2m) Finance expenses (£5.9m) (£0.6m) (£6.5m) Utilised £20.2m £0.4m £20.6m At 31 January 2026 (£473.2m) (£
Slide 9: Clear priorities for capital allocation
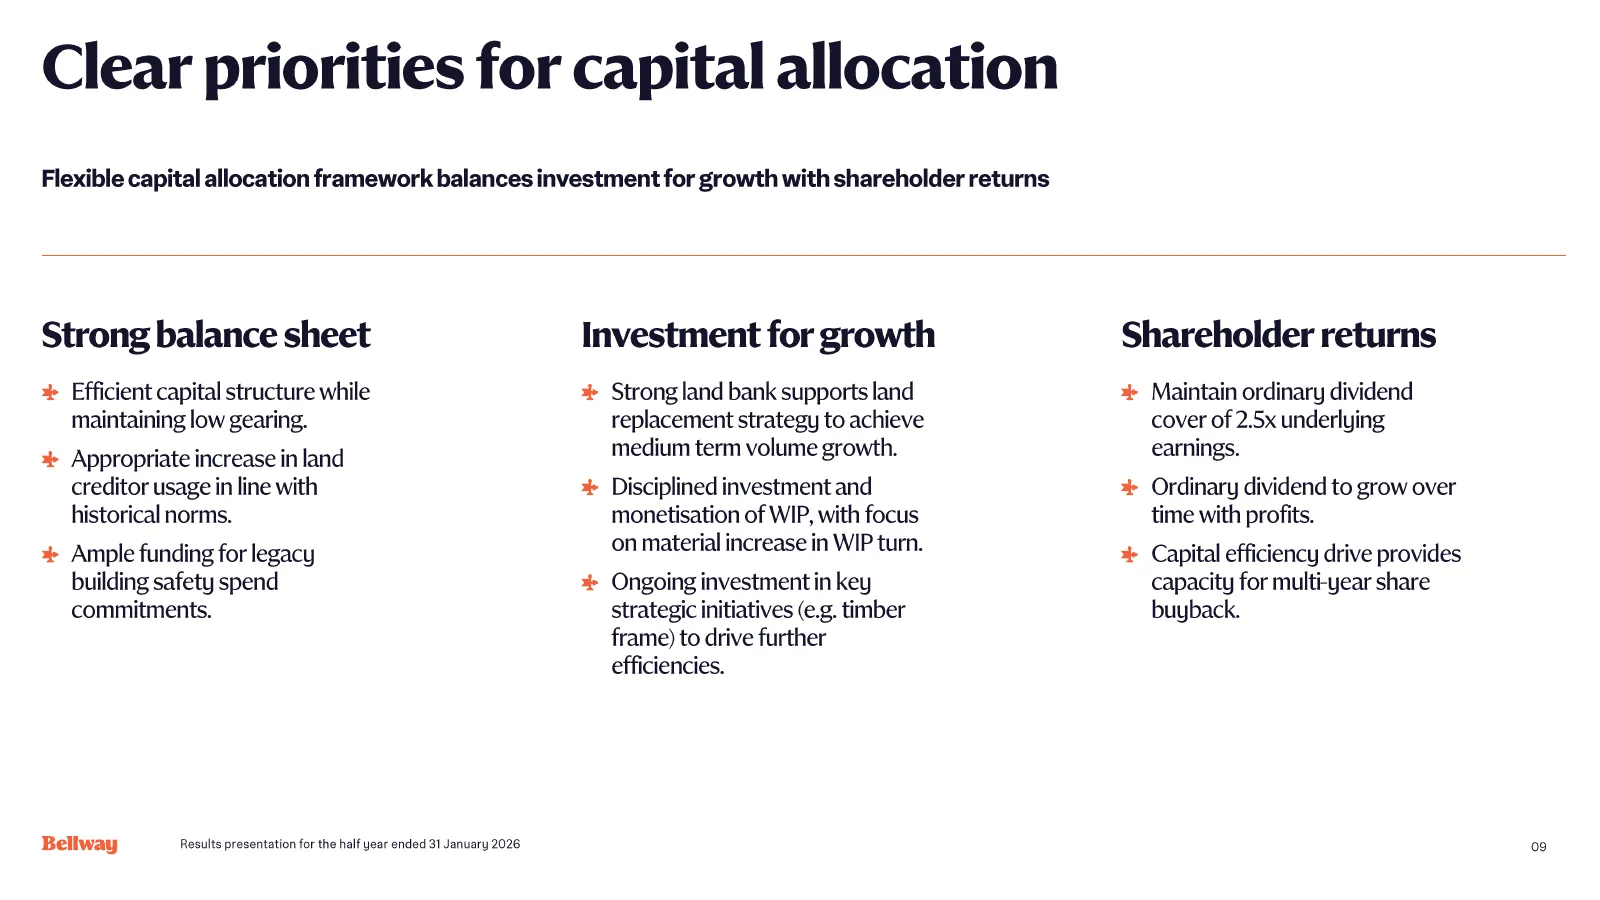
Clear priorities for capital allocation Flexible capital allocation framework balances investment for growth with shareholder returns Strong balance sheet Investment for growth Shareholder returns Efficient capital structure while Strong land bank supports land Maintain ordinary dividend maintaining
Slide 10: Operating cash generation
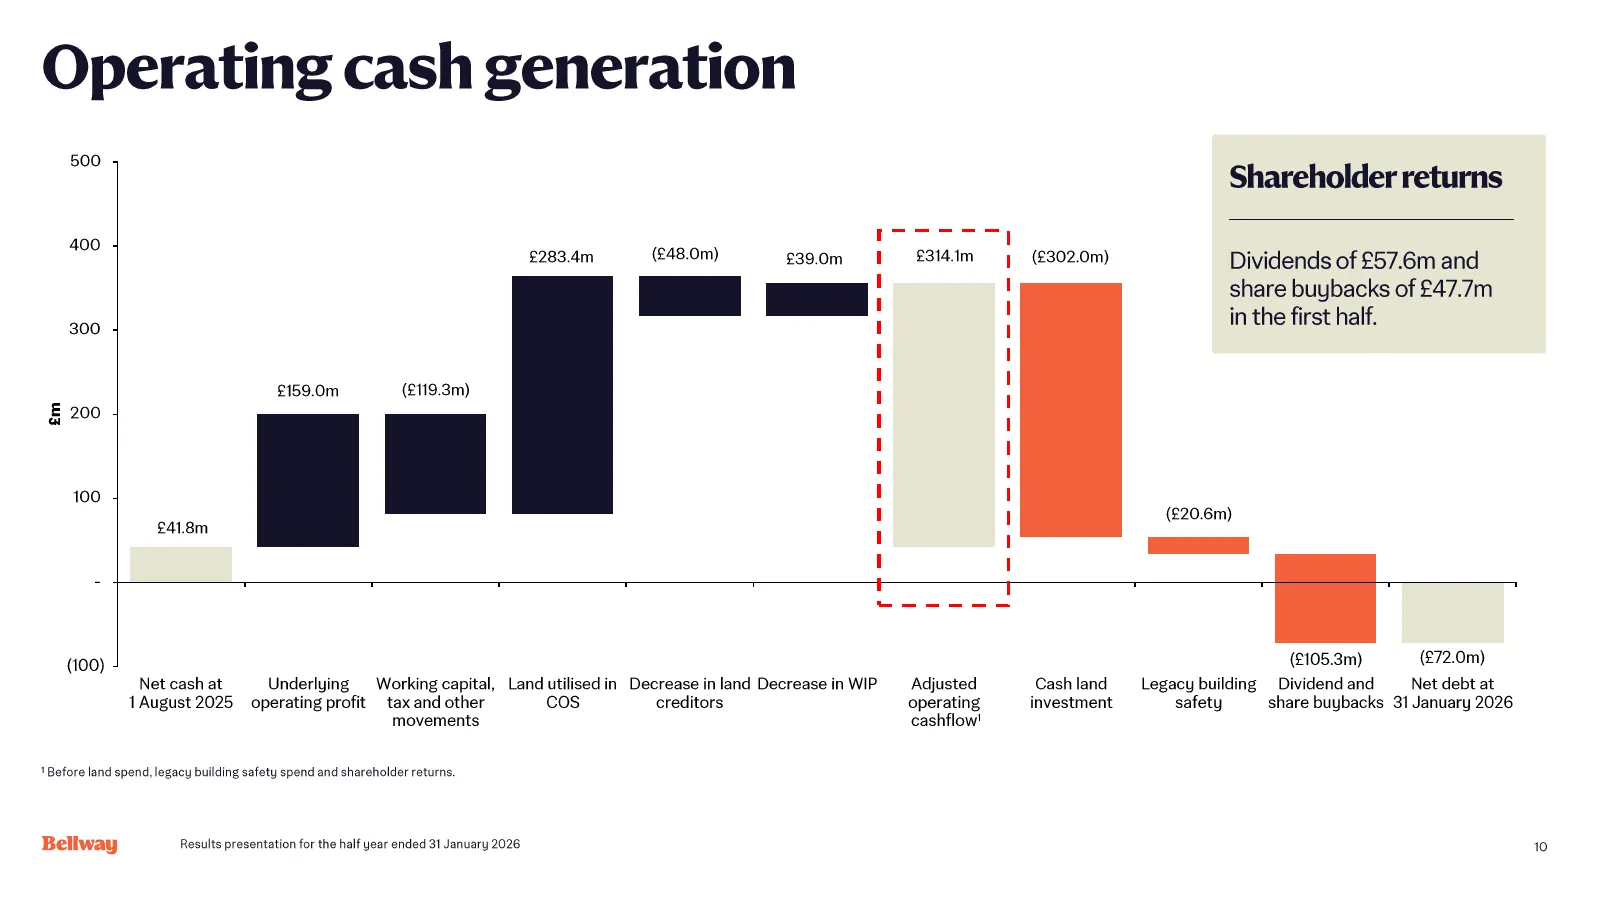
Operating cash generation 500 Shareholder returns 400 £283.4m (£48.0m) £314.1m (£302.0m) £39.0m Dividends of £57.6m and share buybacks of £47.7m 300 in the first half. £159.0m (£119.3m) £m 200 100 (£20.6m) £41.8m - (£105.3m) (£72.0m) (100) Net cash at Underlying Working capital, Land utilised in Dec
Slide 11: Execution of capital allocation strategy
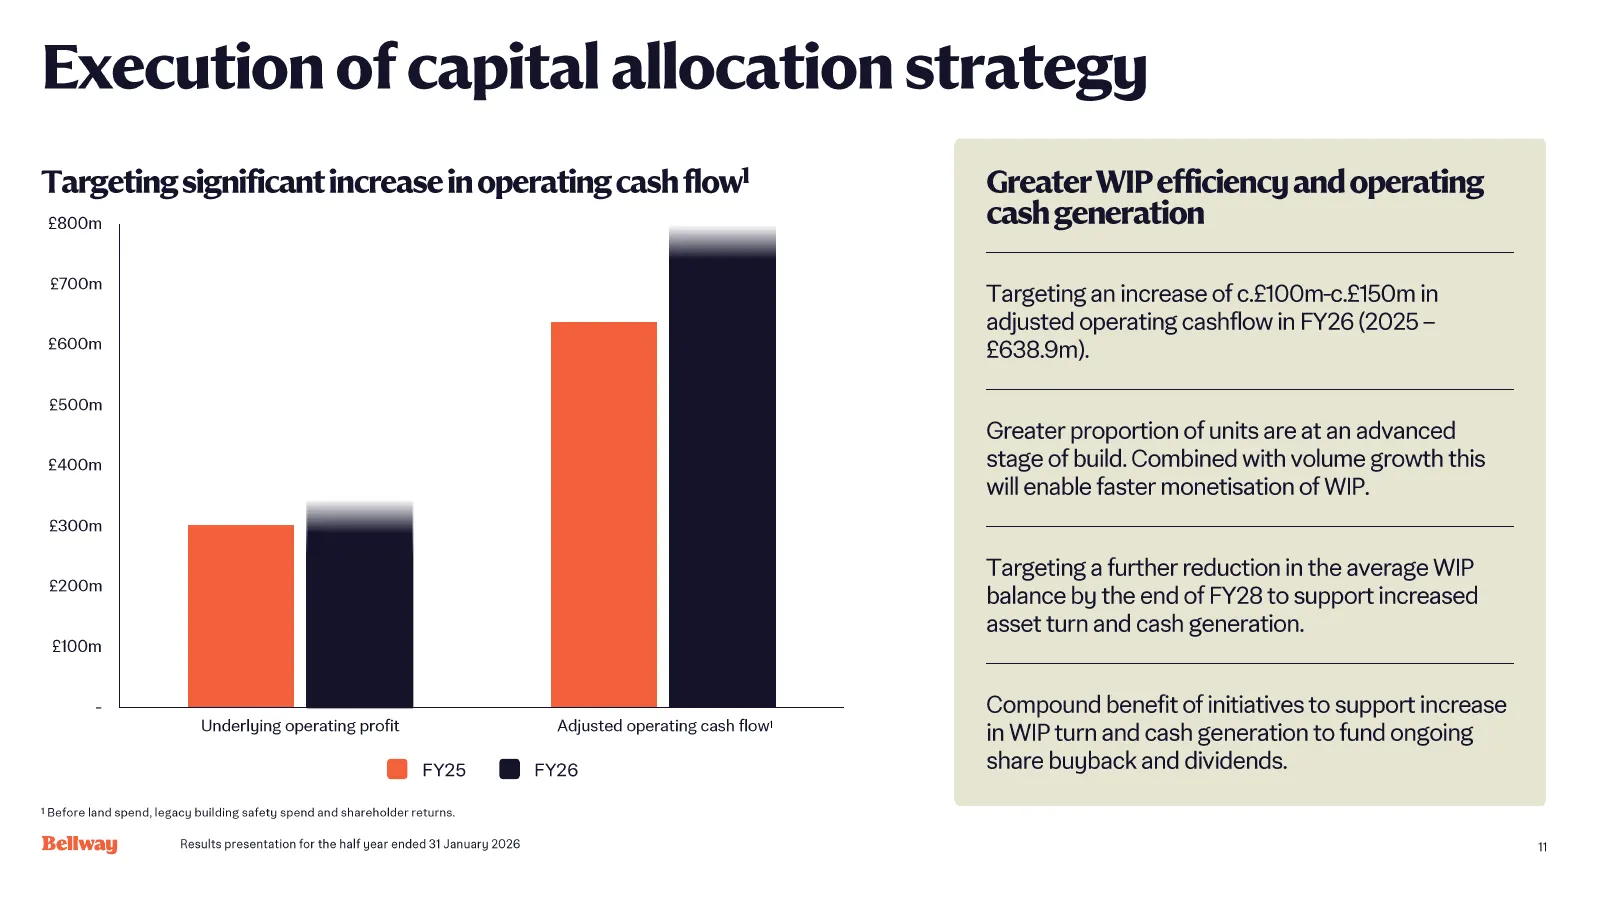
Execution of capital allocation strategy Targeting significant increase in operating cash flow 1 Greater WIP efficiency and operating £800m cash generation £700m Targeting an increase of c.£100m -c.£150m in adjusted operating cashflow in FY26 (2025 – £600m £638.9m). £500m Greater proportion of units
Slide 12: Guidance
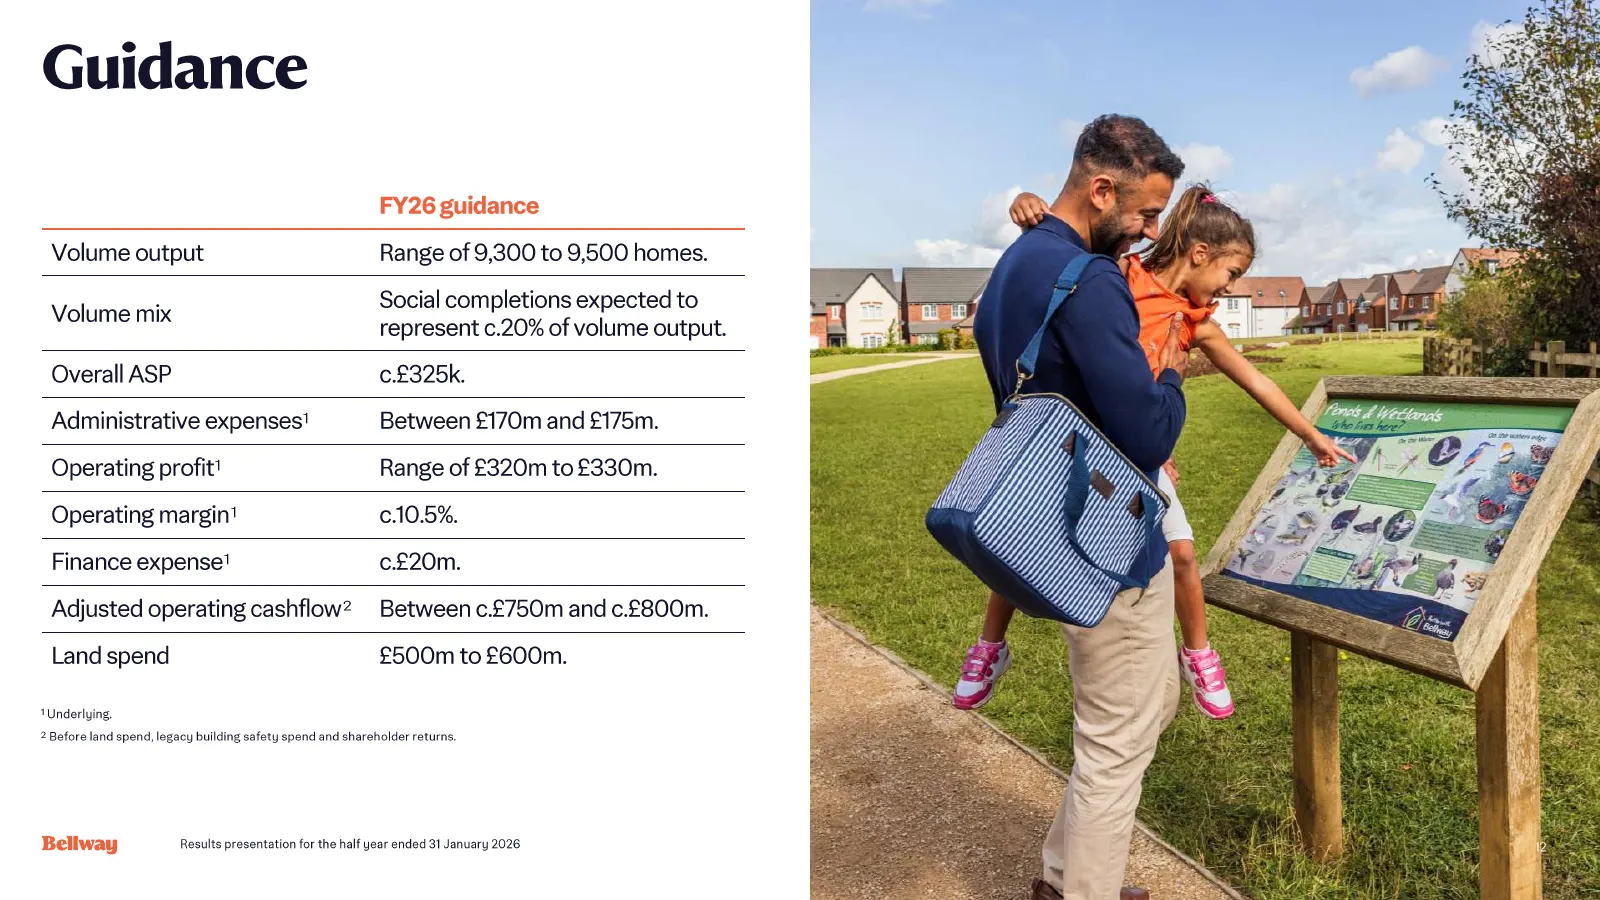
Guidance FY26 guidance Volume output Range of 9,300 to 9,500 homes. Social completions expected to Volume mix represent c.20% of volume output . Overall ASP c.£325k. Administrative expenses 1 Between £170m and £175m. Operating profit 1 Range of £320m to £330m. Operating margin 1 c.10.5%. Finance exp

Slide 13: Operating review and outlook
Operating review and outlook Jason Honeyman Chief Executive Results presentation for the half year ended 31 January 2026 13
Slide 14: Trading review and mortgage market
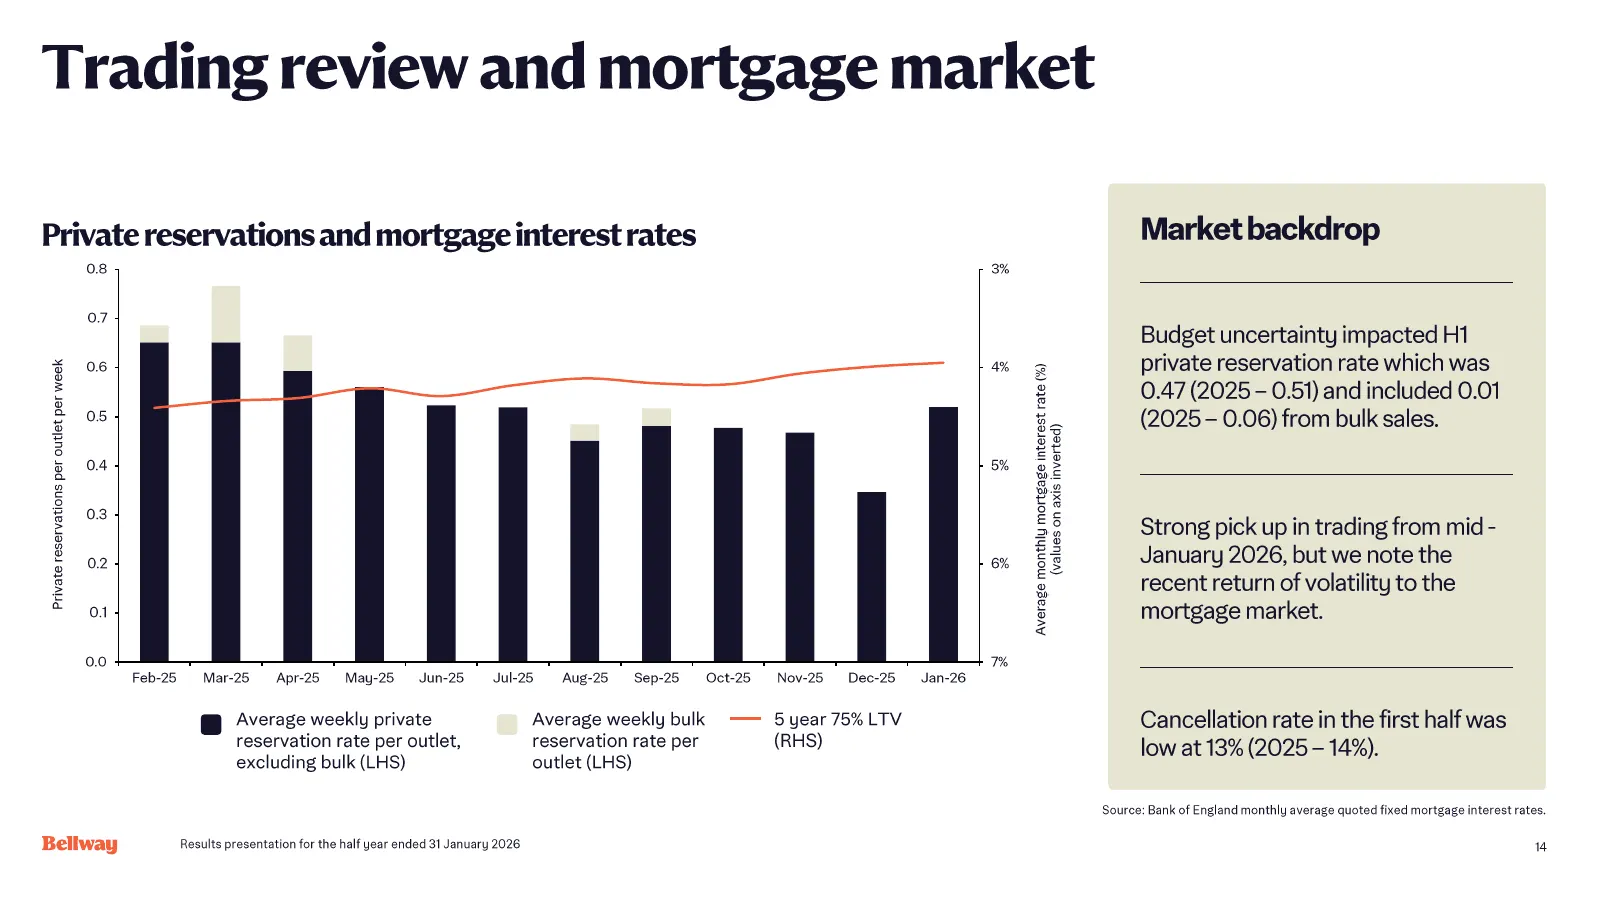
Trading review and mortgage market Private reservations and mortgage interest rates Market backdrop 0.8 3% 0.7 Budget uncertainty impacted H1 0.6 4% private reservation rate which was 0.47 (2025 – 0.51) and included 0.01 Private reservations per outlet per week Average monthly mortgage interest rate
Slide 15: Recent trading and order book
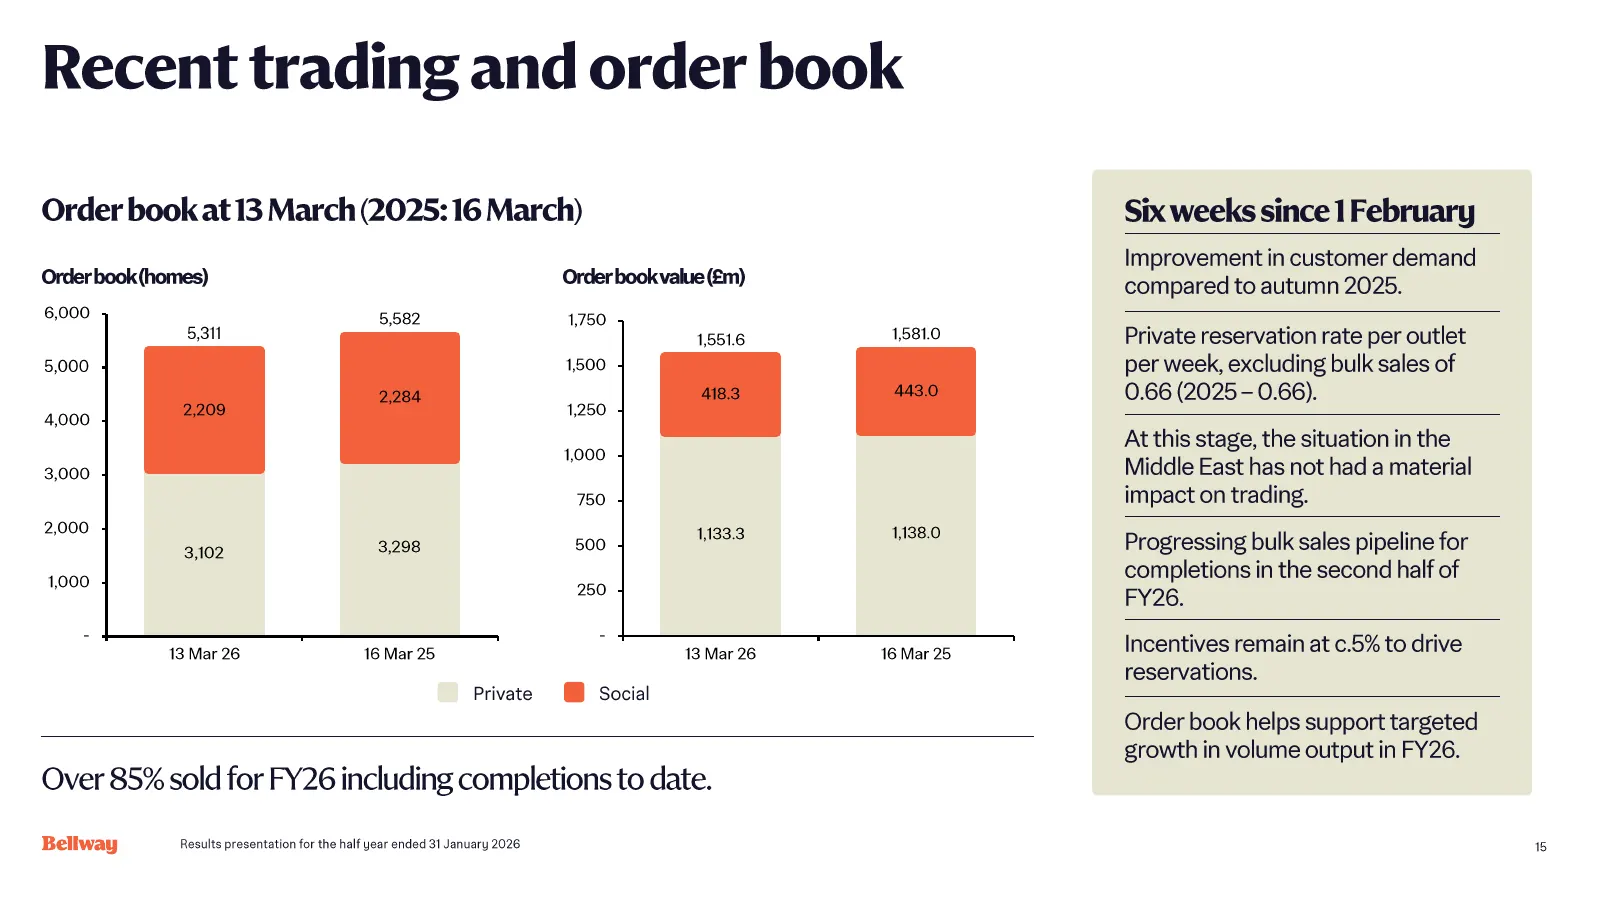
Recent trading and order book Order book at 13 March (2025: 16 March) Six weeks since 1 February Improvement in customer demand Order book (homes) Order book value (£m) compared to autumn 2025. 6,000 5,582 1,750 5,311 1,551.6 1,581.0 Private reservation rate per outlet 5,000 1,500 per week, excludin
Slide 16: High quality land bank
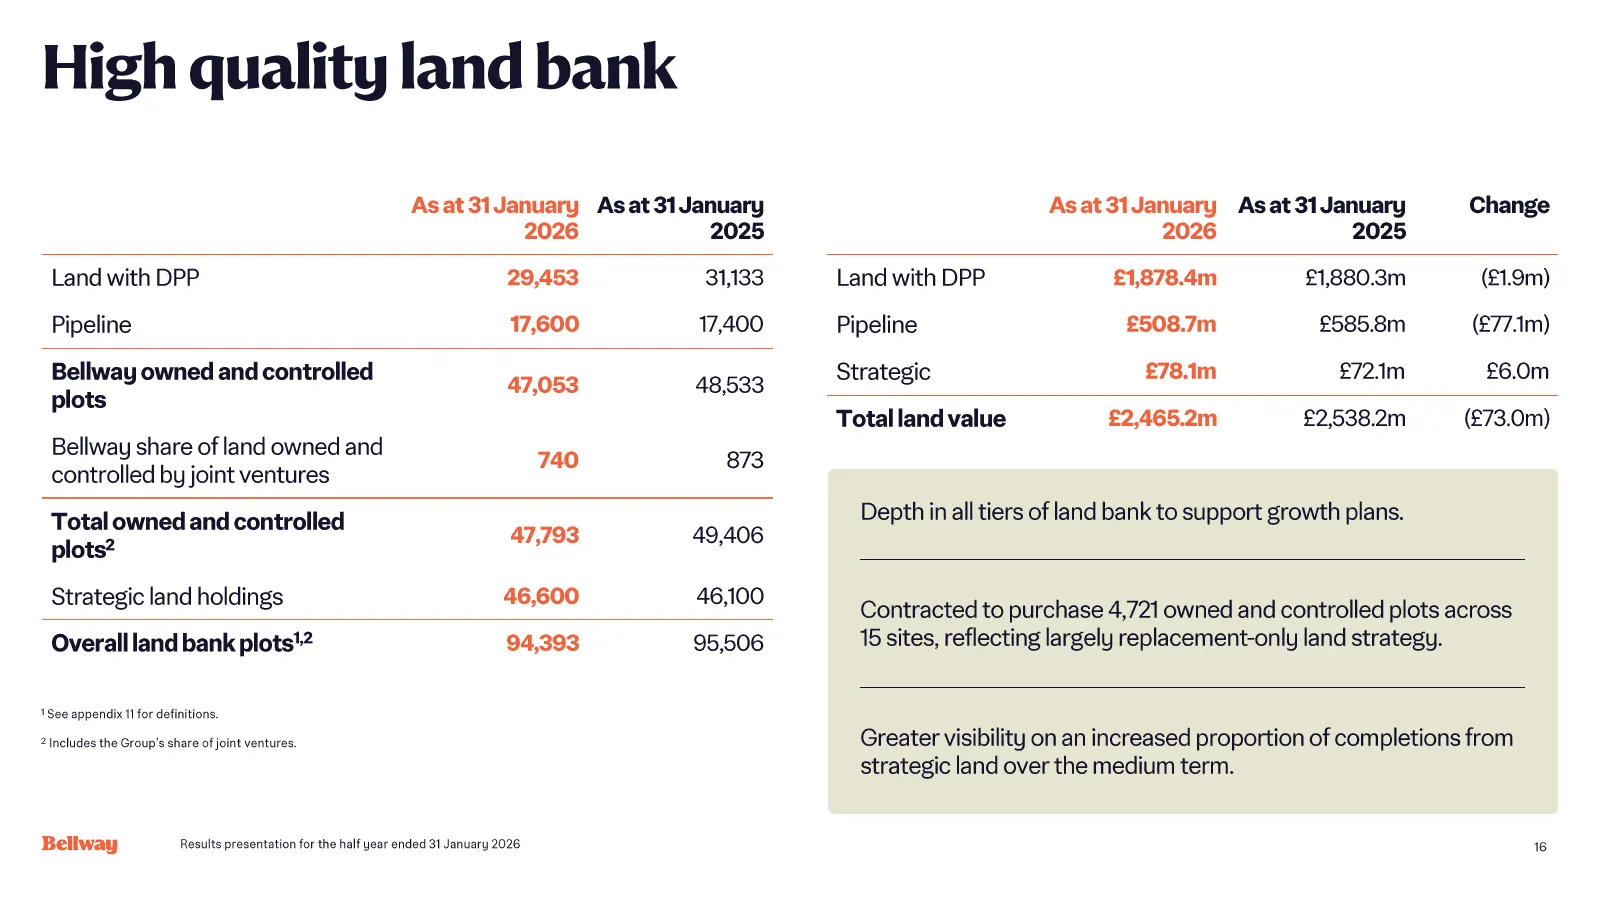
High quality land bank As at 31 January As at 31 January As at 31 January As at 31 January Change 2026 2025 2026 2025 Land with DPP 29,453 31,133 Land with DPP £1,878.4m £1,880.3m (£1.9m) Pipeline 17,600 17,400 Pipeline £508.7m £585.8m (£77.1m) Bellway owned and controlled Strategic £78.1m £72.1m £6
Slide 17: Outlets, planning and strategic land
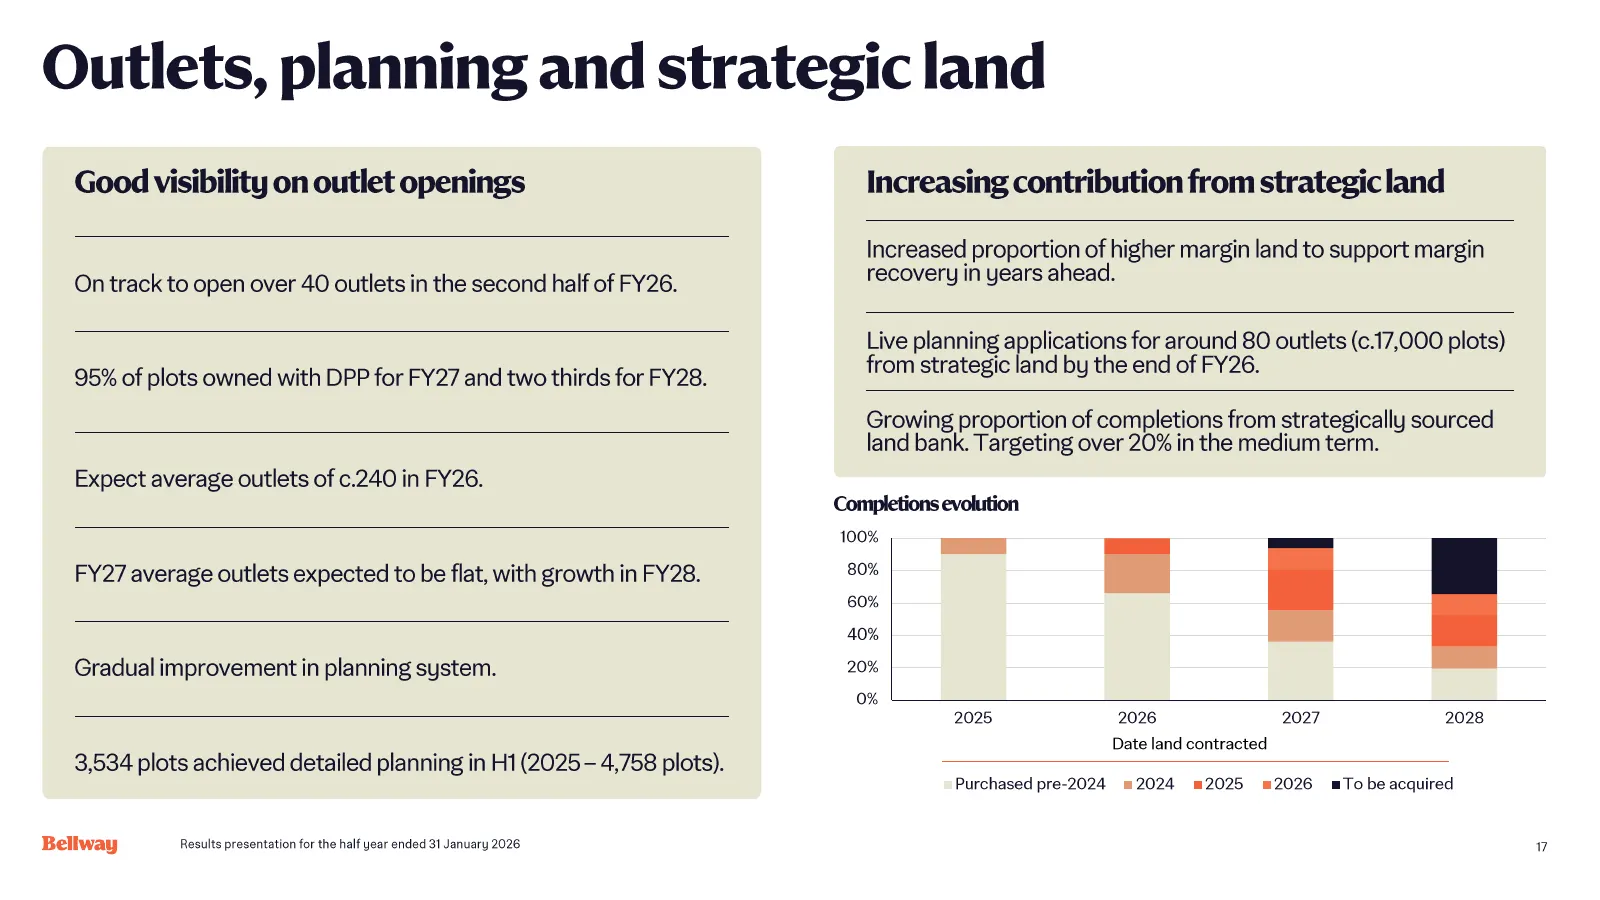
Outlets, planning and strategic land Good visibility on outlet openings Increasing contribution from strategic land Increased proportion of higher margin land to support margin On track to open over 40 outlets in the second half of FY26. recovery in years ahead. Live planning applications for around
Slide 18: Production and cost control
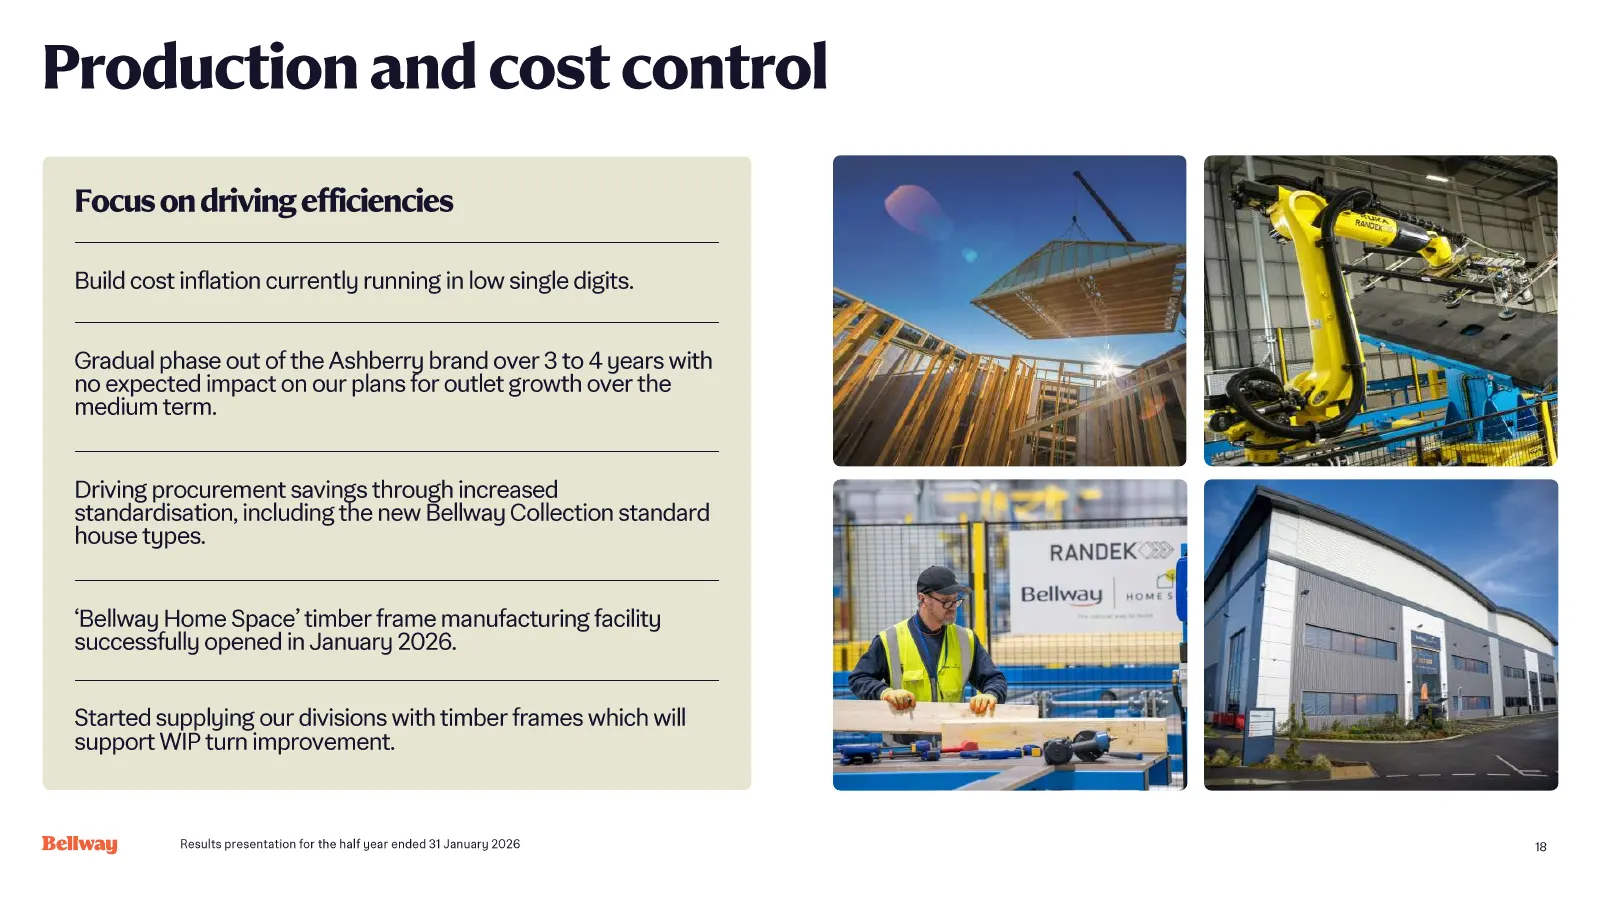
Production and cost control Focus on driving efficiencies Build cost inflation currently running in low single digits. Gradual phase out of the Ashberry brand over 3 to 4 years with no expected impact on our plans for outlet growth over the medium term. Driving procurement savings through increased
Slide 19: Outlook
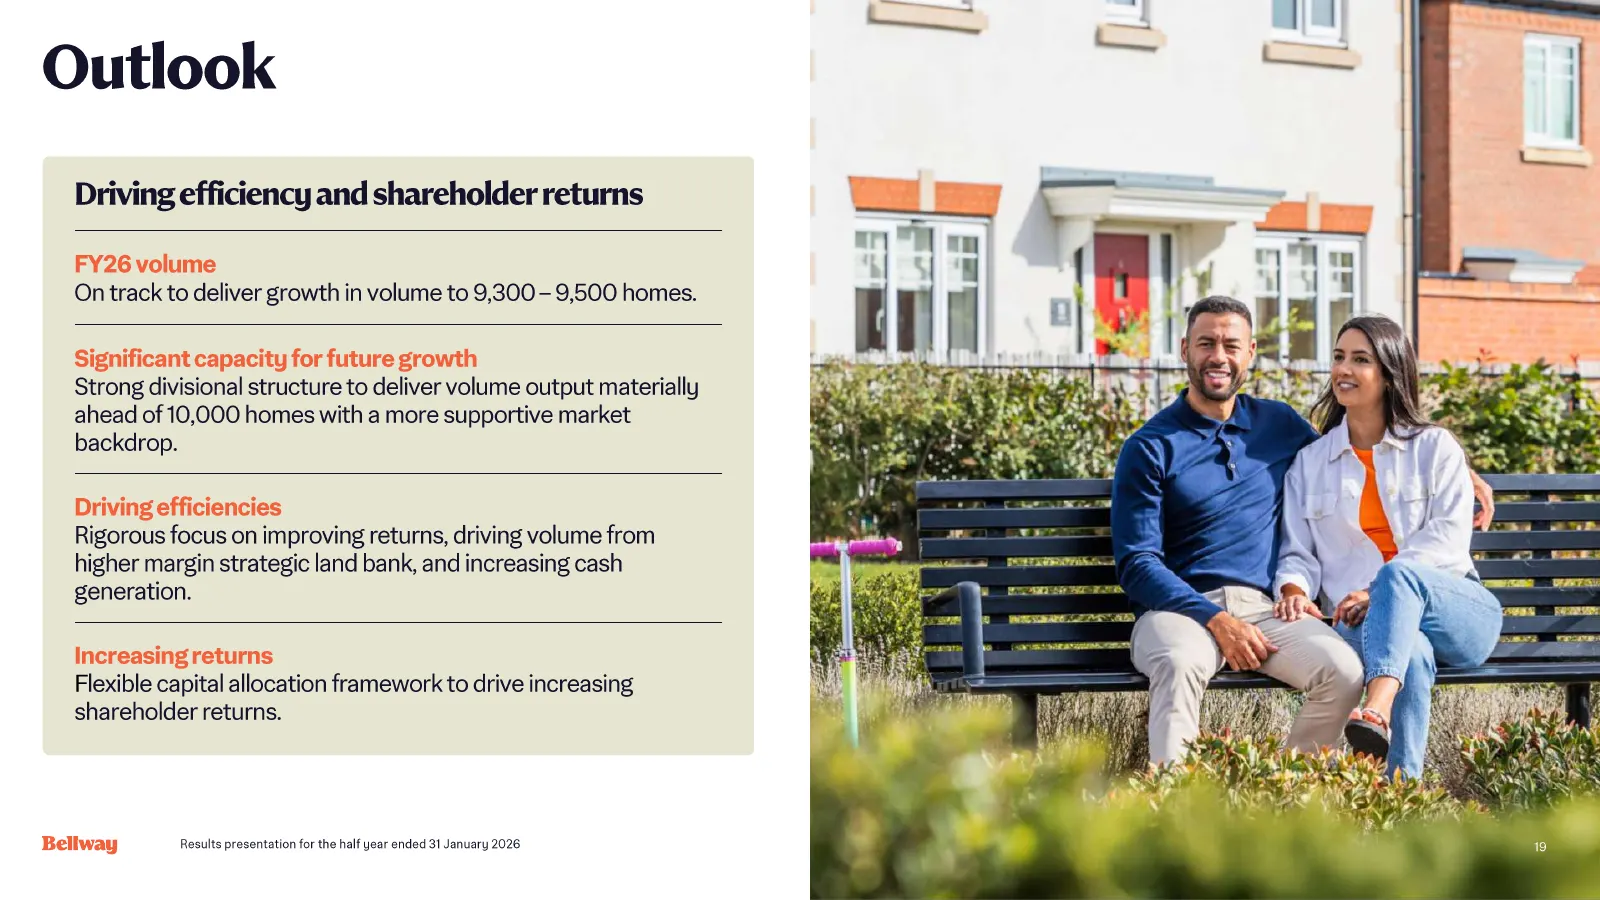
Outlook Driving efficiency and shareholder returns FY26 volume On track to deliver growth in volume to 9,300 – 9,500 homes. Significant capacity for future growth Strong divisional structure to deliver volume output materially ahead of 10,000 homes with a more supportive market backdrop. Driving eff
Slide 20: Q&A
Q&A Results presentation for the half year ended 31 January 2026 20
Slide 21: Appendices
Appendices 1. Income statement 2. Net finance expenses 3. Housing revenue 4. Reservations 5. Product analysis 6. Completions 7. Order book at 31 January 8. Land with DPP 9. Land investment 10. Land creditors 11. Land bank glossary Results presentation for the half year ended 31 January 2026 21
Slide 22: Appendix – Income statement
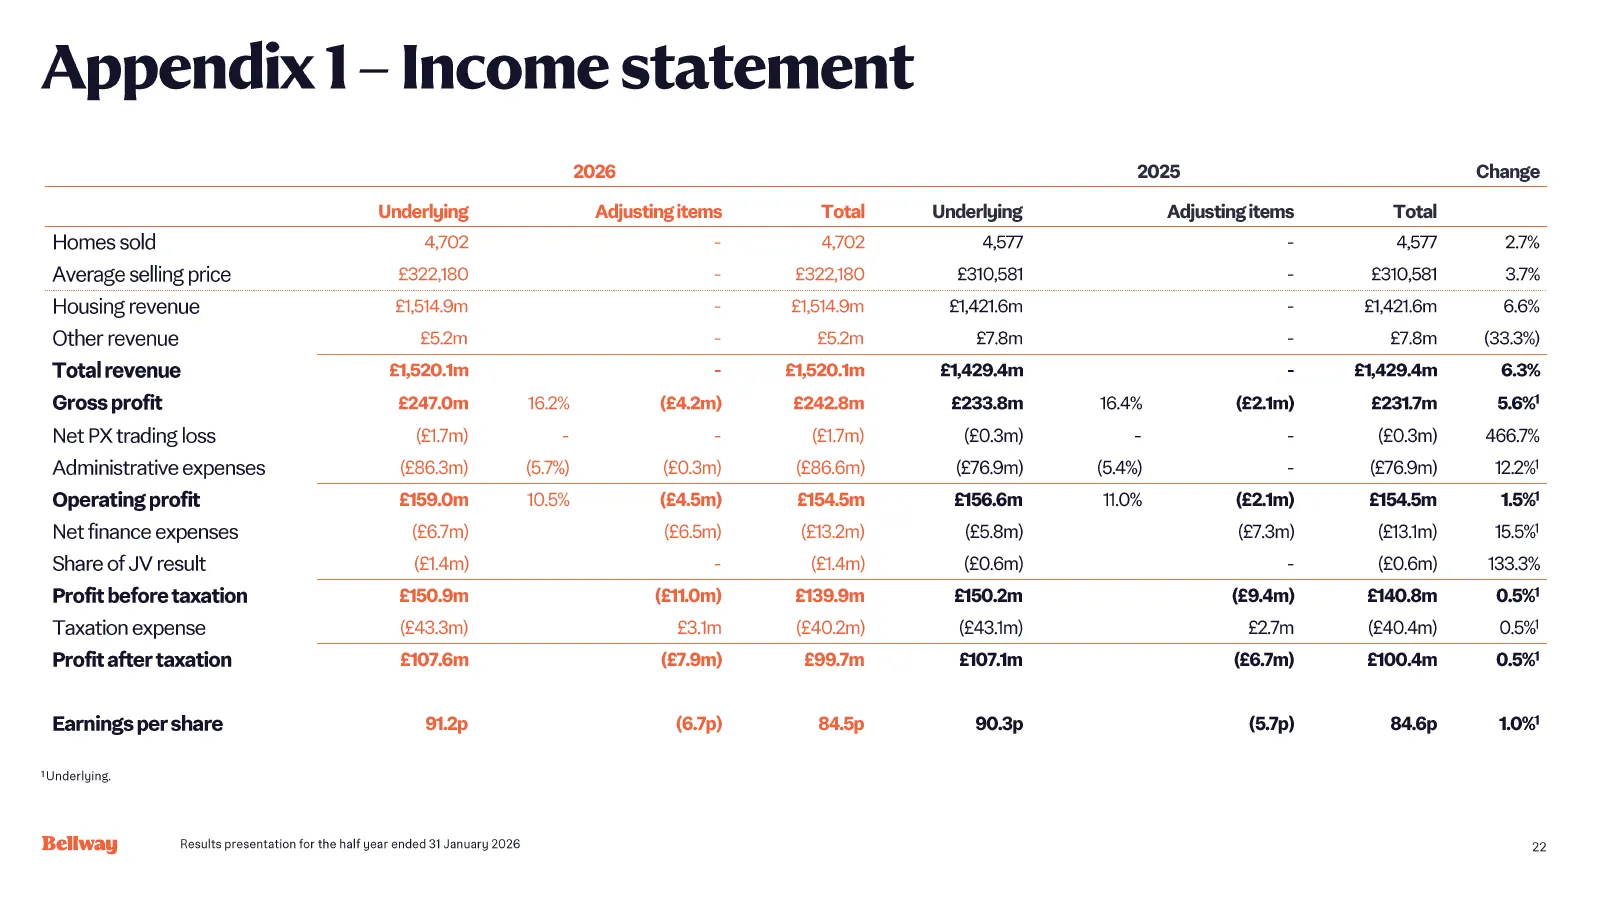
Appendix 1 – Income statement 2026 2025 Change Underlying Adjusting items Total Underlying Adjusting items Total Homes sold 4,702 - 4,702 4,577 - 4,577 2.7% Average selling price £322,180 - £322,180 £310,581 - £310,581 3.7% Housing revenue £1,514.9m - £1,514.9m £1,421.6m - £1,421.6m 6.6% Other reven
Slide 23: Appendix – Net finance expenses
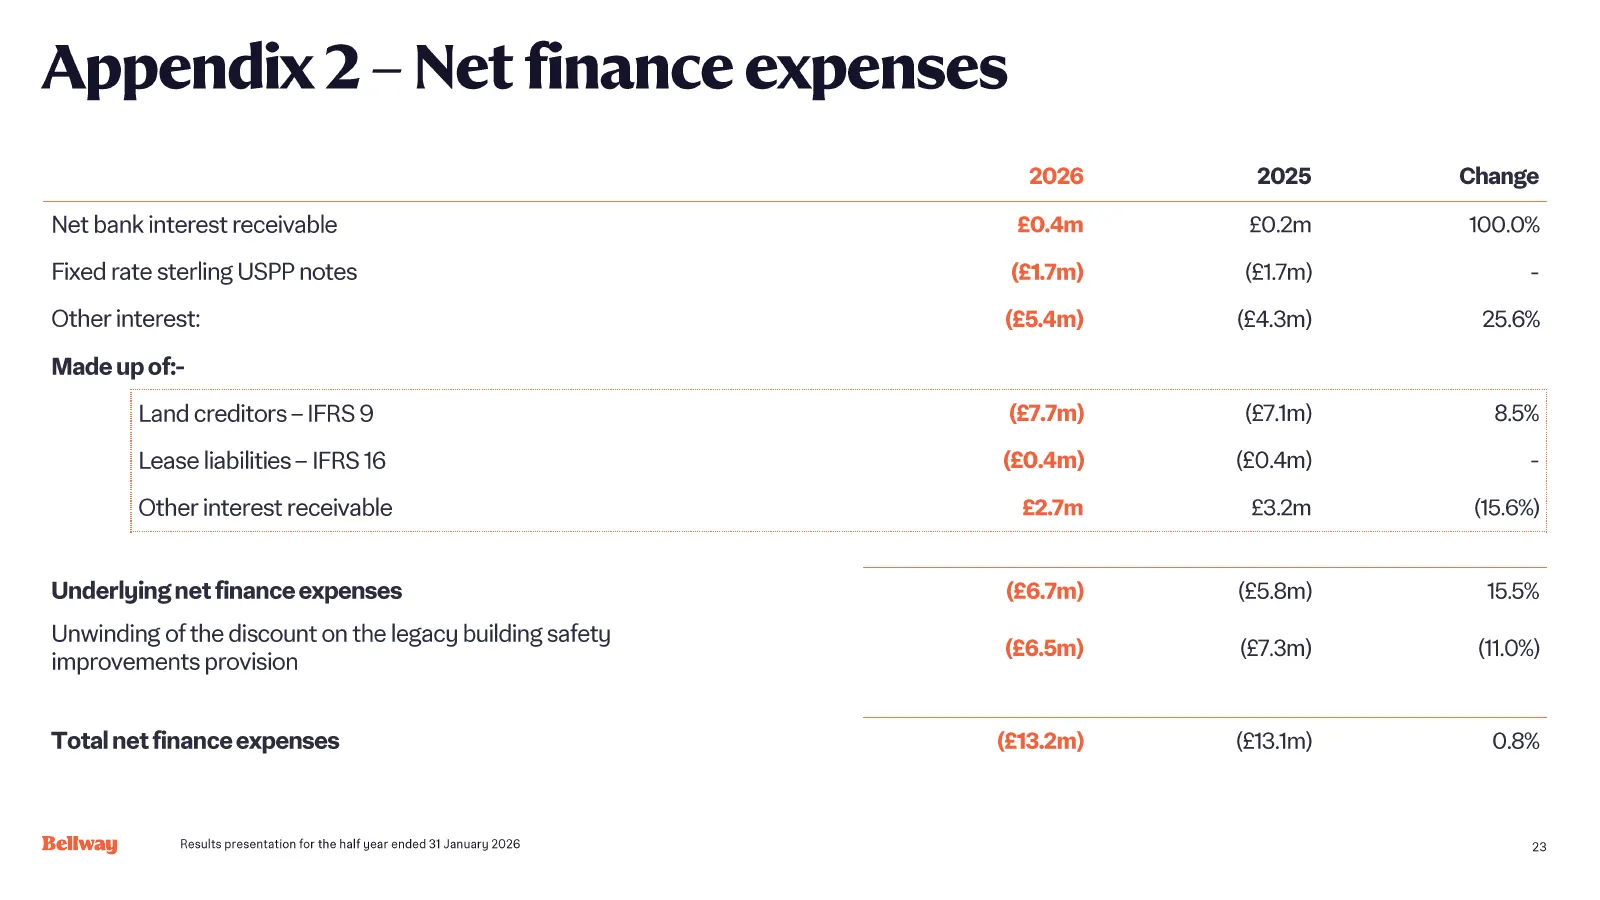
Appendix 2 – Net finance expenses 2026 2025 Change Net bank interest receivable £0.4m £0.2m 100.0% Fixed rate sterling USPP notes (£1.7m) (£1.7m) - Other interest: (£5.4m) (£4.3m) 25.6% Made up of: - Land creditors – IFRS 9 (£7.7m) (£7.1m) 8.5% Lease liabilities – IFRS 16 (£0.4m) (£0.4m) - Other int
Slide 24: Appendix – Housing revenue
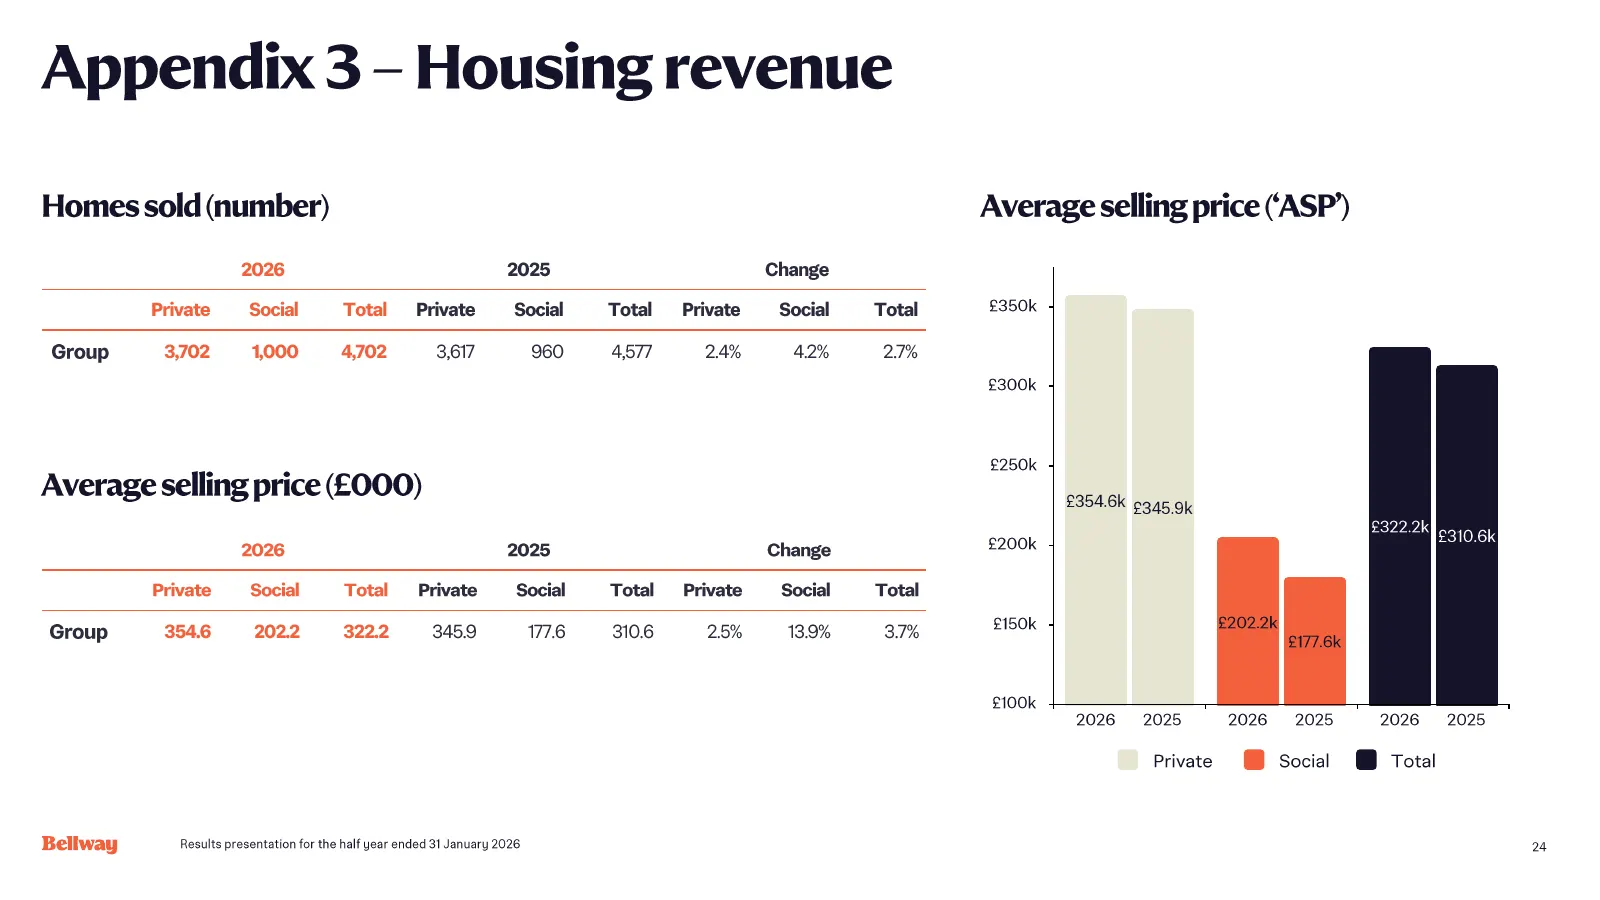
Appendix 3 – Housing revenue Homes sold (number) Average selling price (‘ASP’) 2026 2025 Change Private Social Total Private Social Total Private Social Total £350k Group 3,702 1,000 4,702 3,617 960 4,577 2.4% 4.2% 2.7% £300k £250k Average selling price (£000) £354.6k £345.9k £322.2k £310.6k 2026 20
Slide 25: Appendix – Reservations
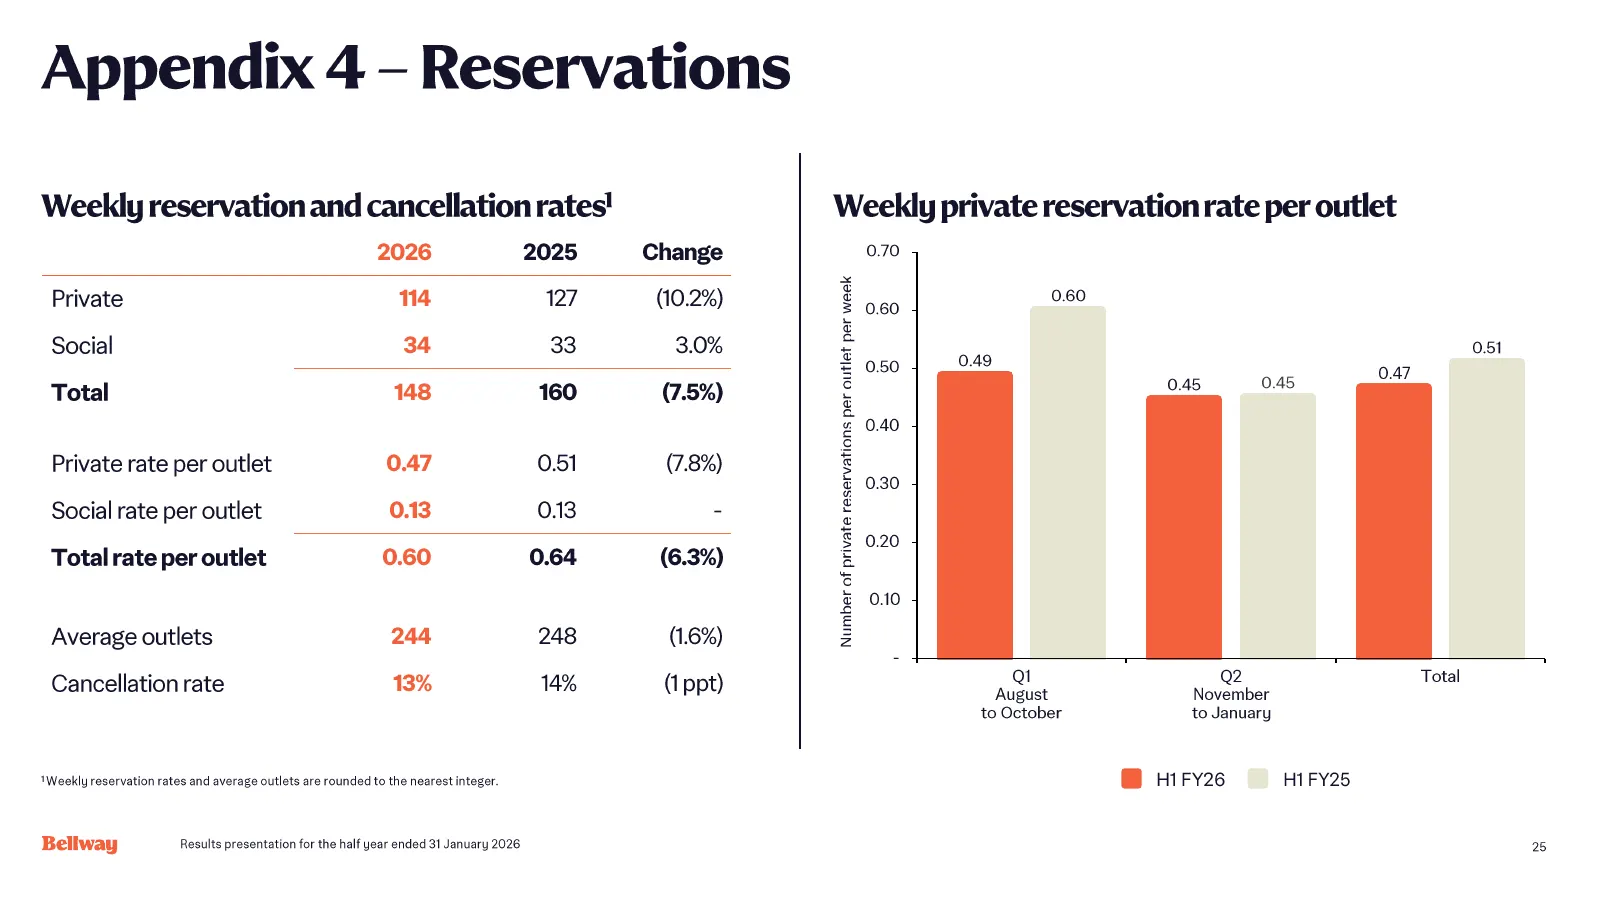
Appendix 4 – Reservations Weekly reservation and cancellation rates 1 Weekly private reservation rate per outlet 2026 2025 Change 0.70 Private 114 127 (10.2%) 0.60 0.60 Number of private reservations per outlet per week Social 34 33 3.0% 0.51 0.50 0.49 0.47 0.45 0.45 Total 148 160 (7.5%) 0.40 Privat
Slide 26: Appendix – Product analysis
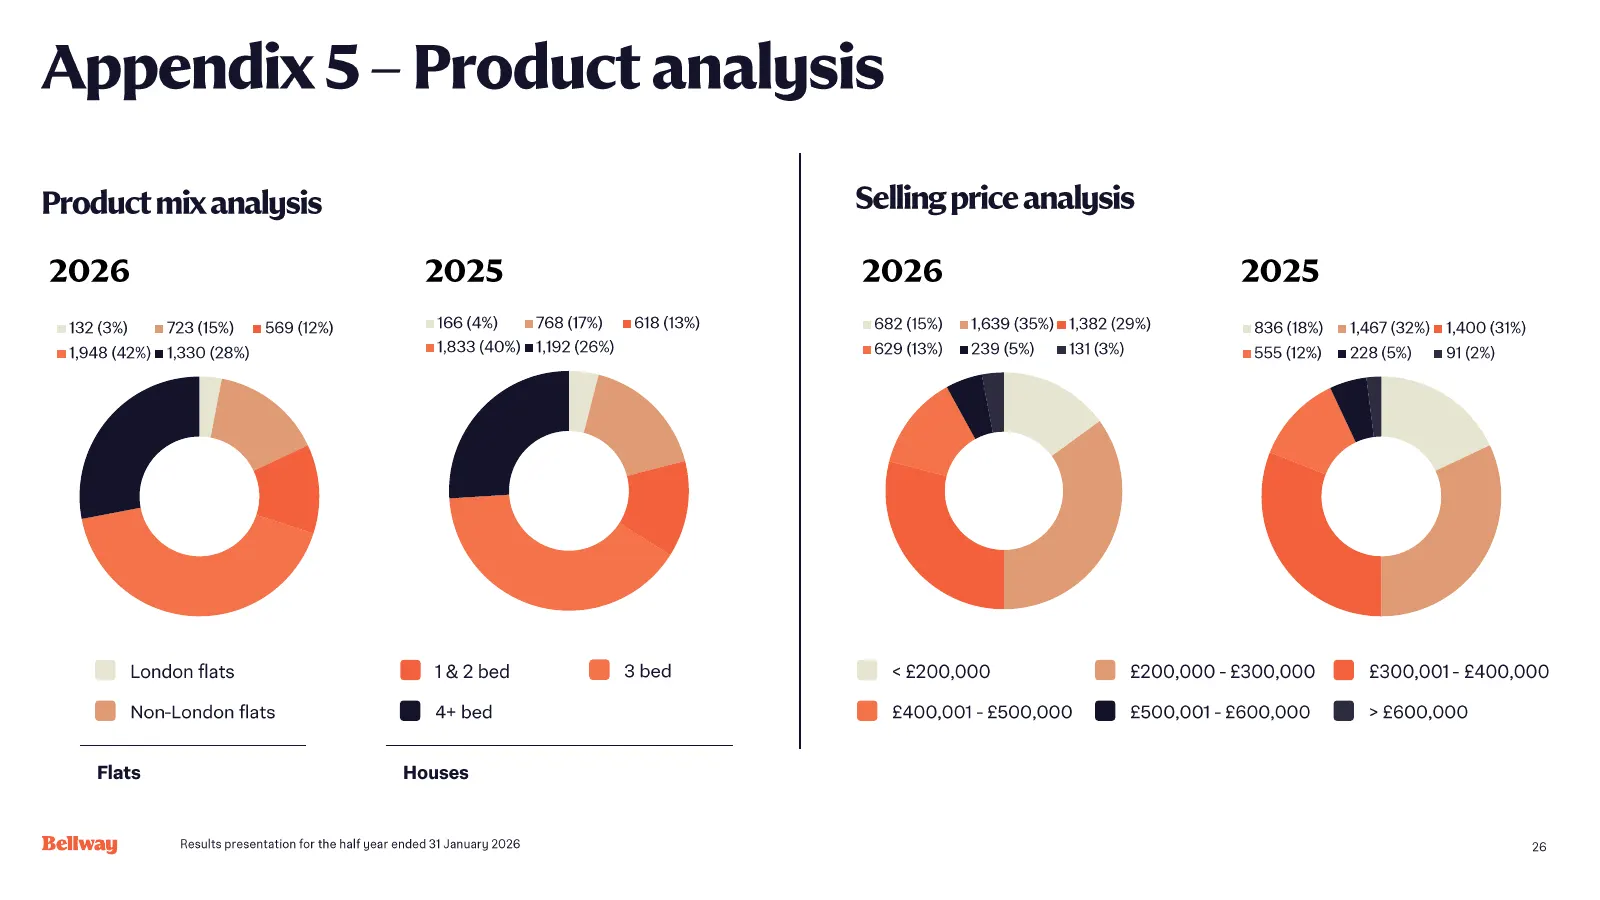
Appendix 5 – Product analysis Product mix analysis Selling price analysis 2026 2025 2026 2025 132 (3%) 723 (15%) 569 (12%) 166 (4%) 768 (17%) 618 (13%) 682 (15%) 1,639 (35%) 1,382 (29%) 836 (18%) 1,467 (32%) 1,400 (31%) 1,948 (42%) 1,330 (28%) 1,833 (40%) 1,192 (26%) 629 (13%) 239 (5%) 131 (3%) 555
Slide 27: Appendix – Completions
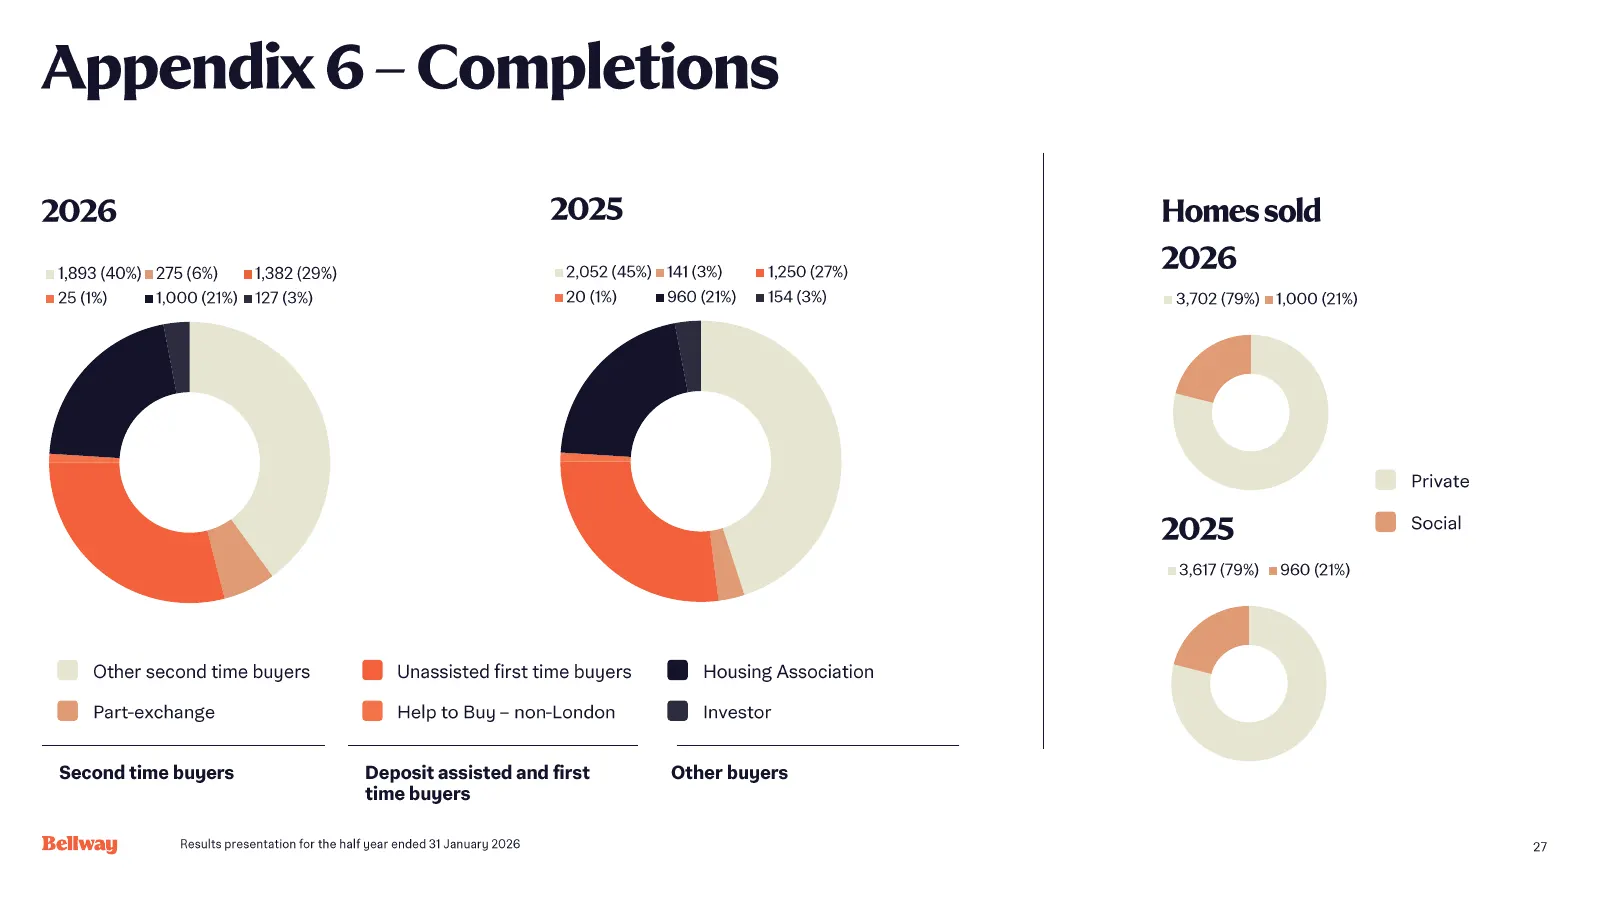
Appendix 6 – Completions 2026 2025 Homes sold 1,893 (40%) 275 (6%) 1,382 (29%) 2,052 (45%) 141 (3%) 1,250 (27%) 2026 25 (1%) 1,000 (21%) 127 (3%) 20 (1%) 960 (21%) 154 (3%) 3,702 (79%) 1,000 (21%) Private Social 2025 3,617 (79%) 960 (21%) Other second time buyers Unassisted first time buyers Housing
Slide 28: Appendix – Order book at 31 January
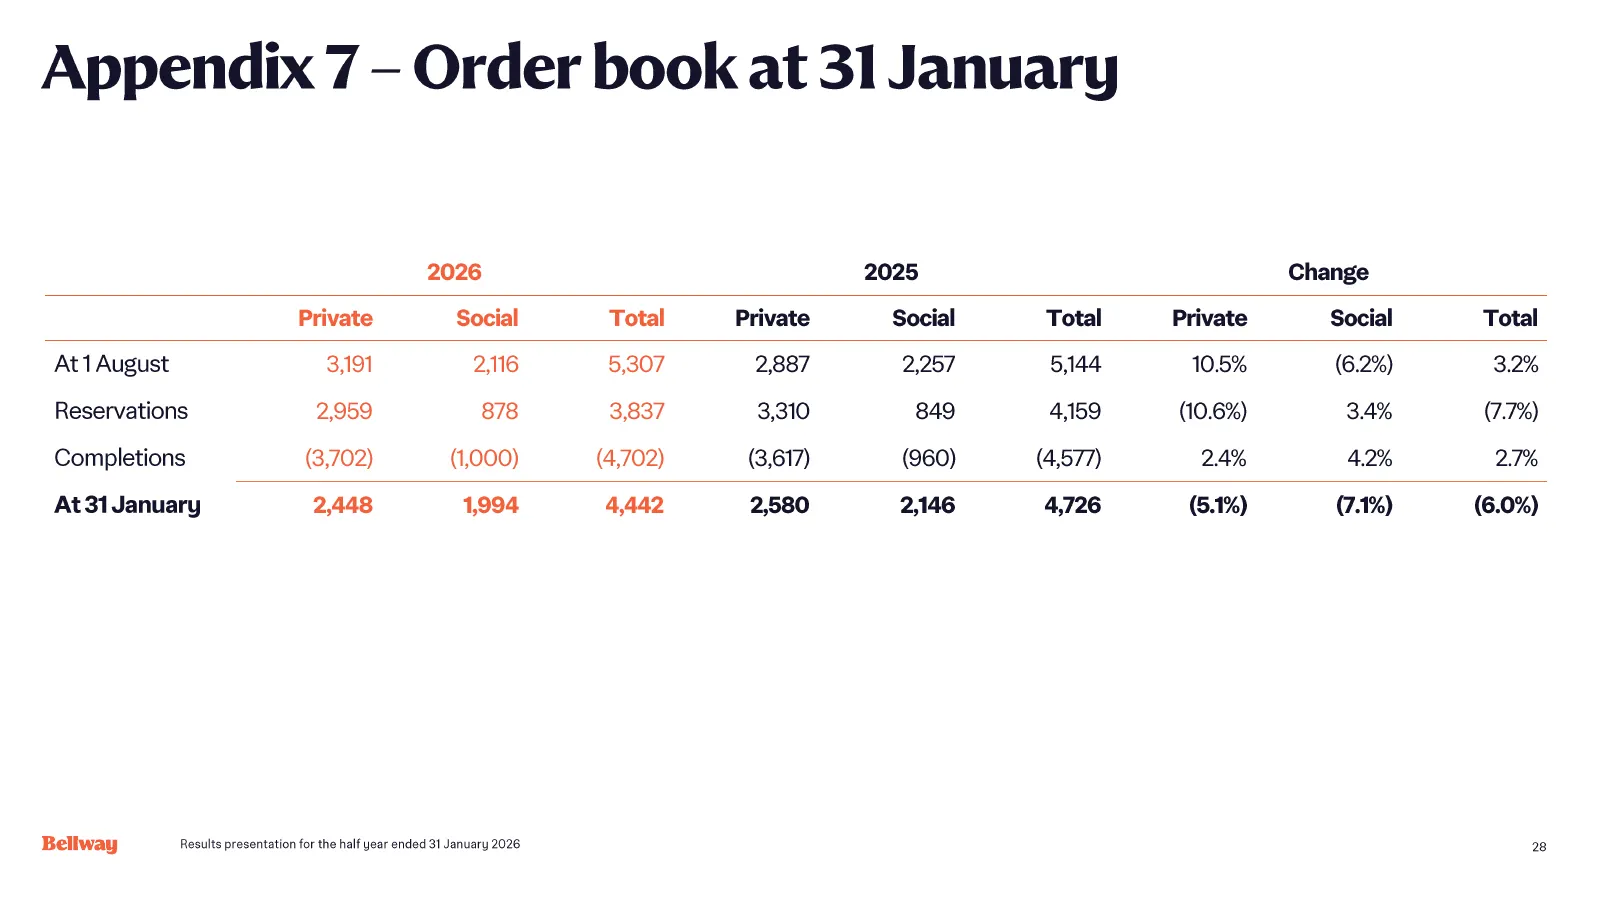
Appendix 7 – Order book at 31 January 2026 2025 Change Private Social Total Private Social Total Private Social Total At 1 August 3,191 2,116 5,307 2,887 2,257 5,144 10.5% (6.2%) 3.2% Reservations 2,959 878 3,837 3,310 849 4,159 (10.6%) 3.4% (7.7%) Completions (3,702) (1,000) (4,702) (3,617) (960) (
Slide 29: Appendix - Land with DPP
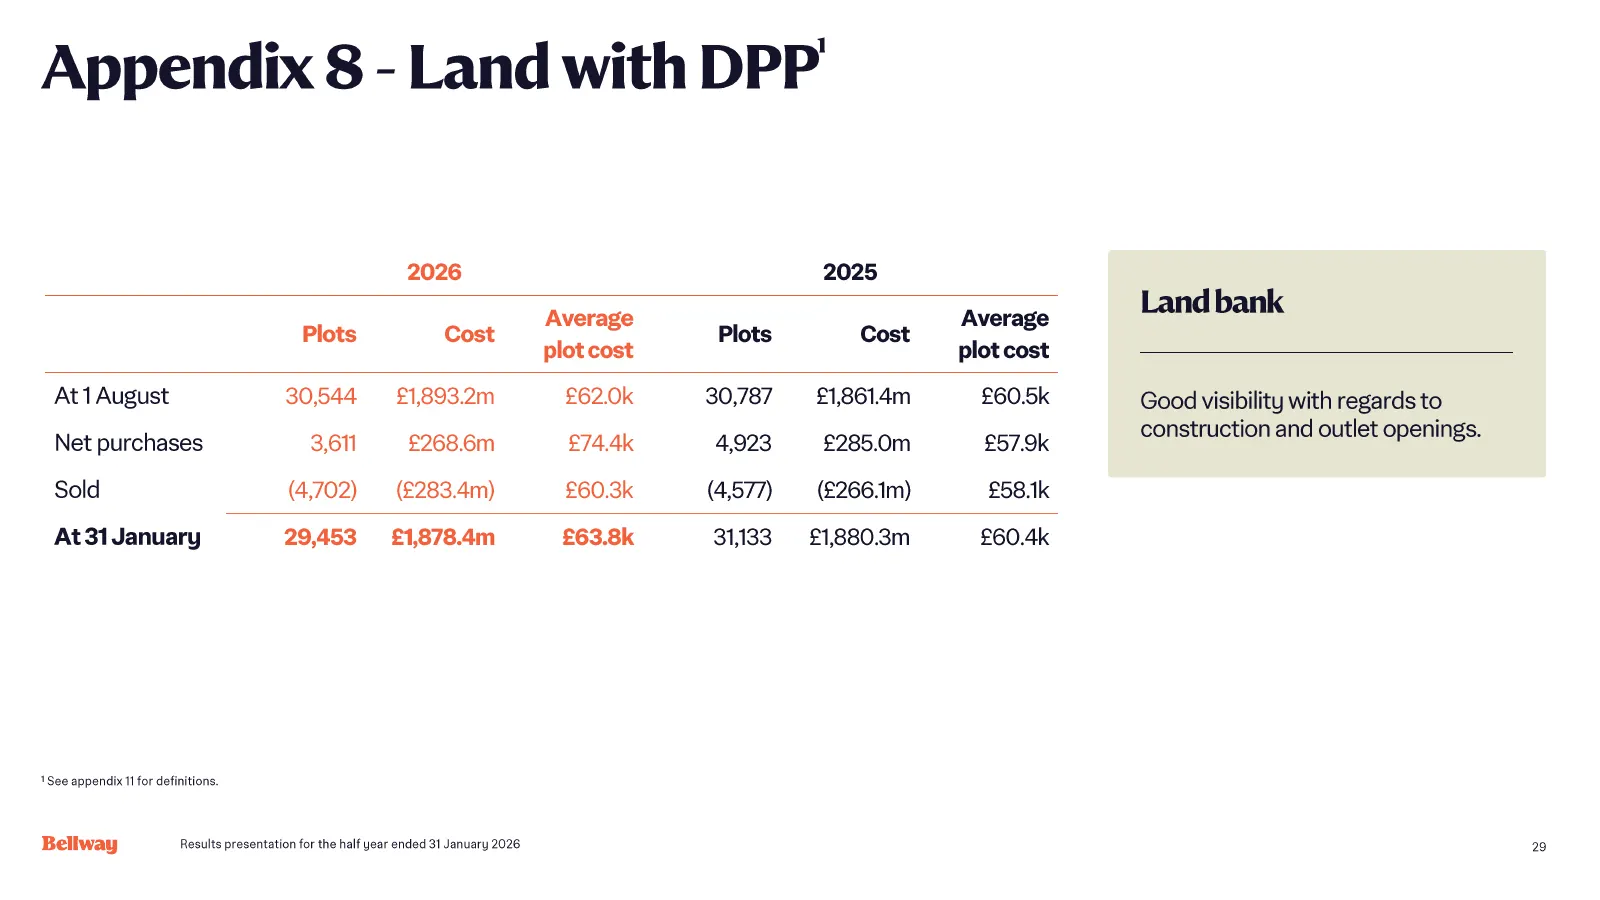
Appendix 8 - Land with DPP ¹ 2026 2025 Average Average Land bank Plots Cost Plots Cost plot cost plot cost At 1 August 30,544 £1,893.2m £62.0k 30,787 £1,861.4m £60.5k Good visibility with regards to construction and outlet openings. Net purchases 3,611 £268.6m £74.4k 4,923 £285.0m £57.9k Sold (4,702
Slide 30: Appendix – Land investment
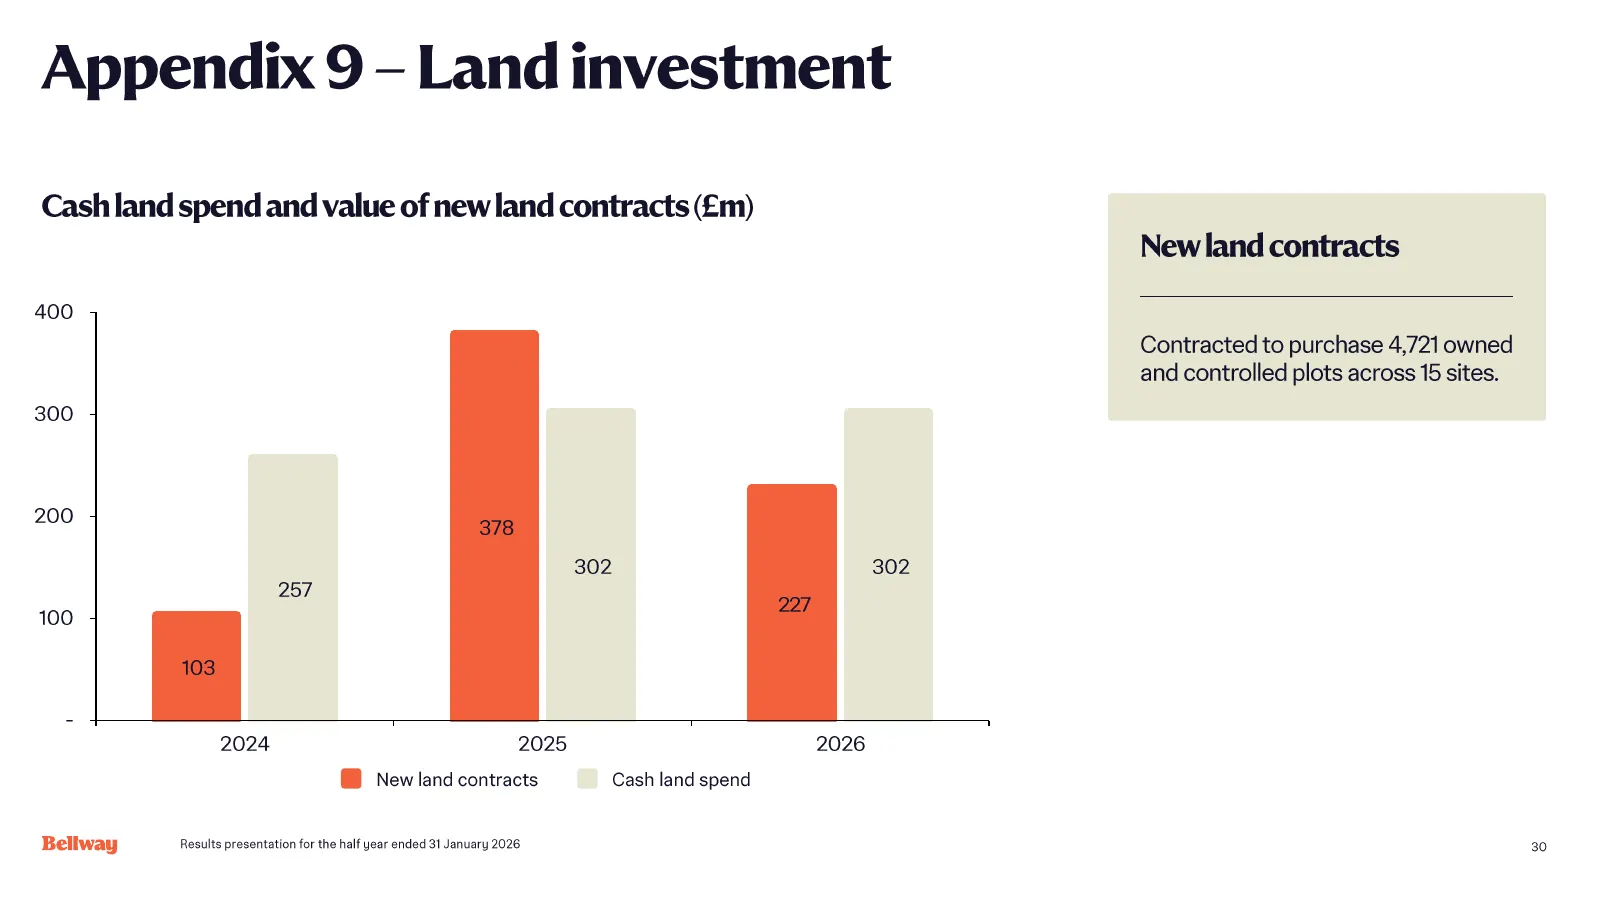
Appendix 9 – Land investment Cash land spend and value of new land contracts (£m) New land contracts 400 Contracted to purchase 4,721 owned and controlled plots across 15 sites. 300 200 378 302 302 257 227 100 103 - 2024 2025 2026 New land contracts Cash land spend Results presentation for the half
Slide 31: Appendix – Land creditors
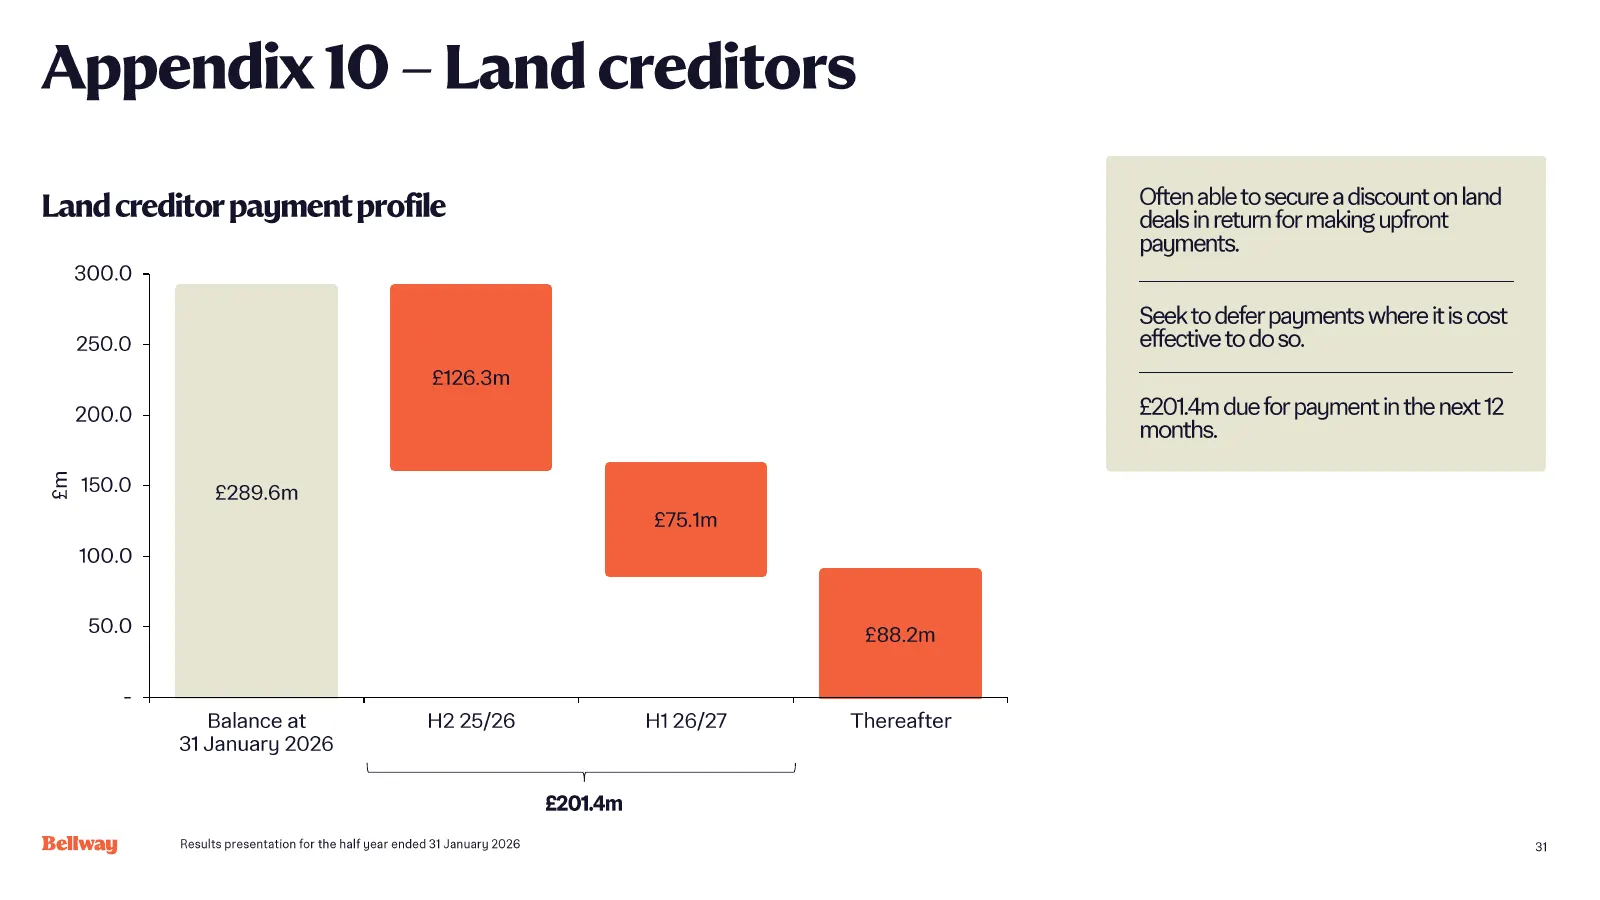
Appendix 10 – Land creditors Often able to secure a discount on land Land creditor payment profile deals in return for making upfront payments. 300.0 Seek to defer payments where it is cost 250.0 effective to do so. £126.3m 200.0 £201.4m due for payment in the next 12 months. £m 150.0 £289.6m £75.1m
Slide 32: Appendix – Land bank glossary
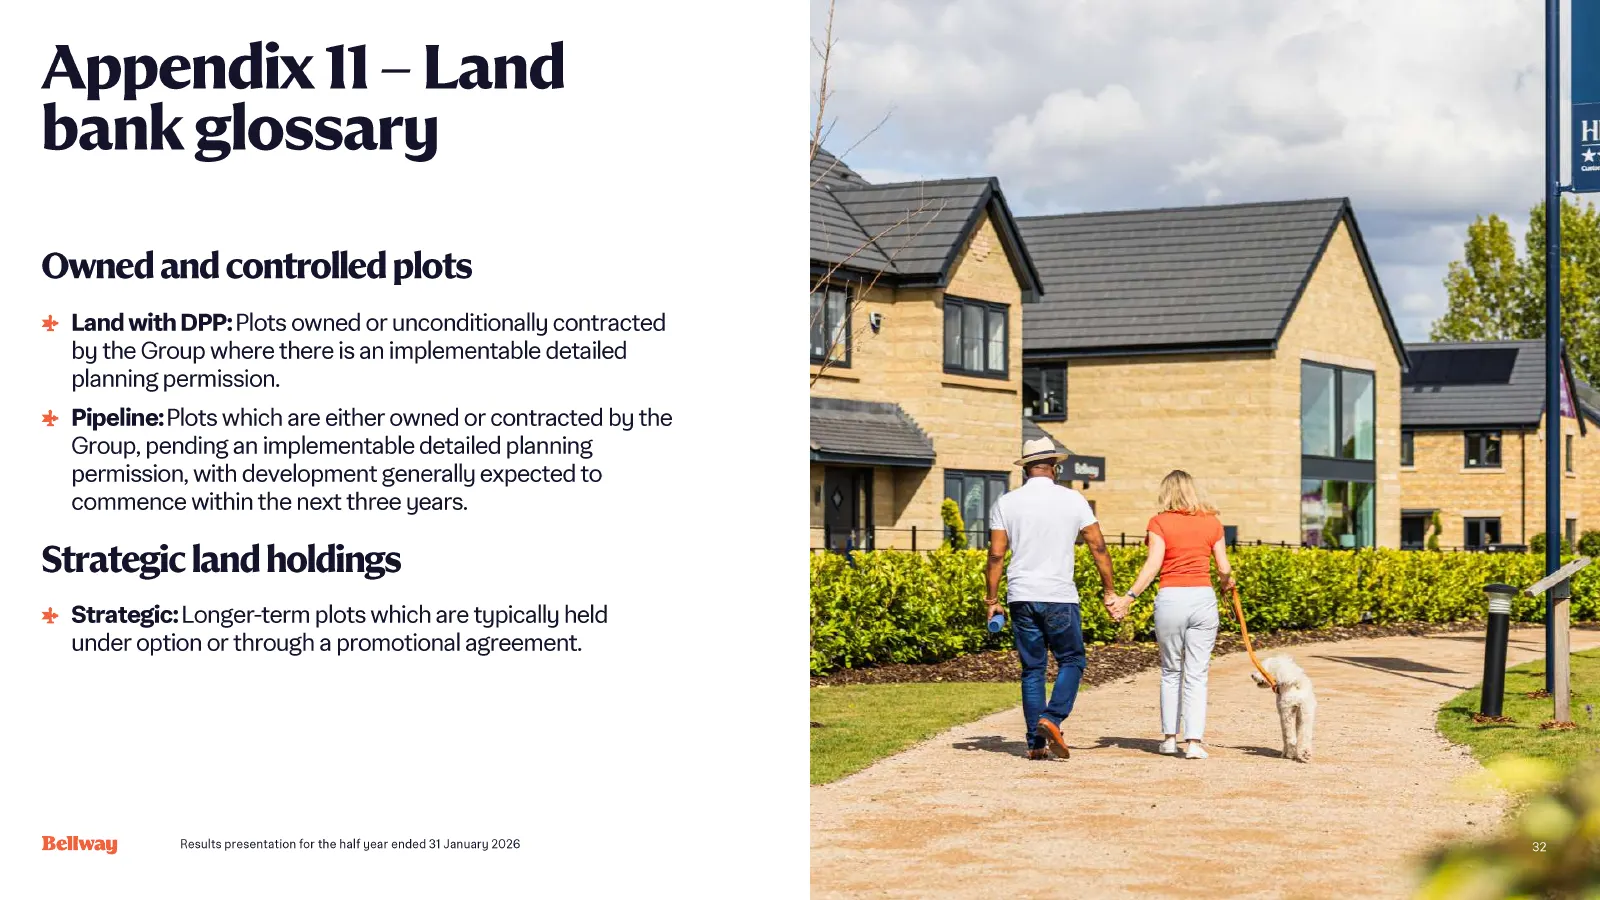
Appendix 11 – Land bank glossary Owned and controlled plots Land with DPP: Plots owned or unconditionally contracted by the Group where there is an implementable detailed planning permission. Pipeline: Plots which are either owned or contracted by the Group, pending an implementable detailed plannin
Slide 33: Disclaimer
Disclaimer This presentation is not intended to, and does not, constitute or form part of, any offer, invitation or the solicitation of an offer to purchase, otherwise acquire, subscribe for, sell or otherwise dispose of, any securities in Bellway p.l.c. or any other invitation or inducement to enga

Slide 34: Bellway
Bellway
Source: 6ix earnings call
More decks from Bellway p.l.c.
 FY2026 Earnings Presentation39 slides · Oct 13, 2026
 FY2025 Earnings Presentation40 slides · Oct 14, 2025
 H1 2024 Earnings Presentation45 slides · Jan 31, 2024
 H1 2023 Earnings Presentation97 slides · Mar 28, 2023
 FY2022 Earnings Presentation99 slides · October 2022
 FY2022 Earnings Presentation52 slides · October 2022