Rexel SA · EURONEXT:RXL
Rexel SA — Q1 2015 Earnings Presentation
46 slides from Rexel SA's earnings presentation, Apr 30, 2015
Slide 1: Q1 2015 Results (Unaudited)
Q1 2015 RESULTS (UNAUDITED) April 30, 2015 Consolidated financial statements as of March 31, 2015 were authorized for issue by the Board of Directors held on April 29, 2015
Slide 2: Q1 2015 highlights
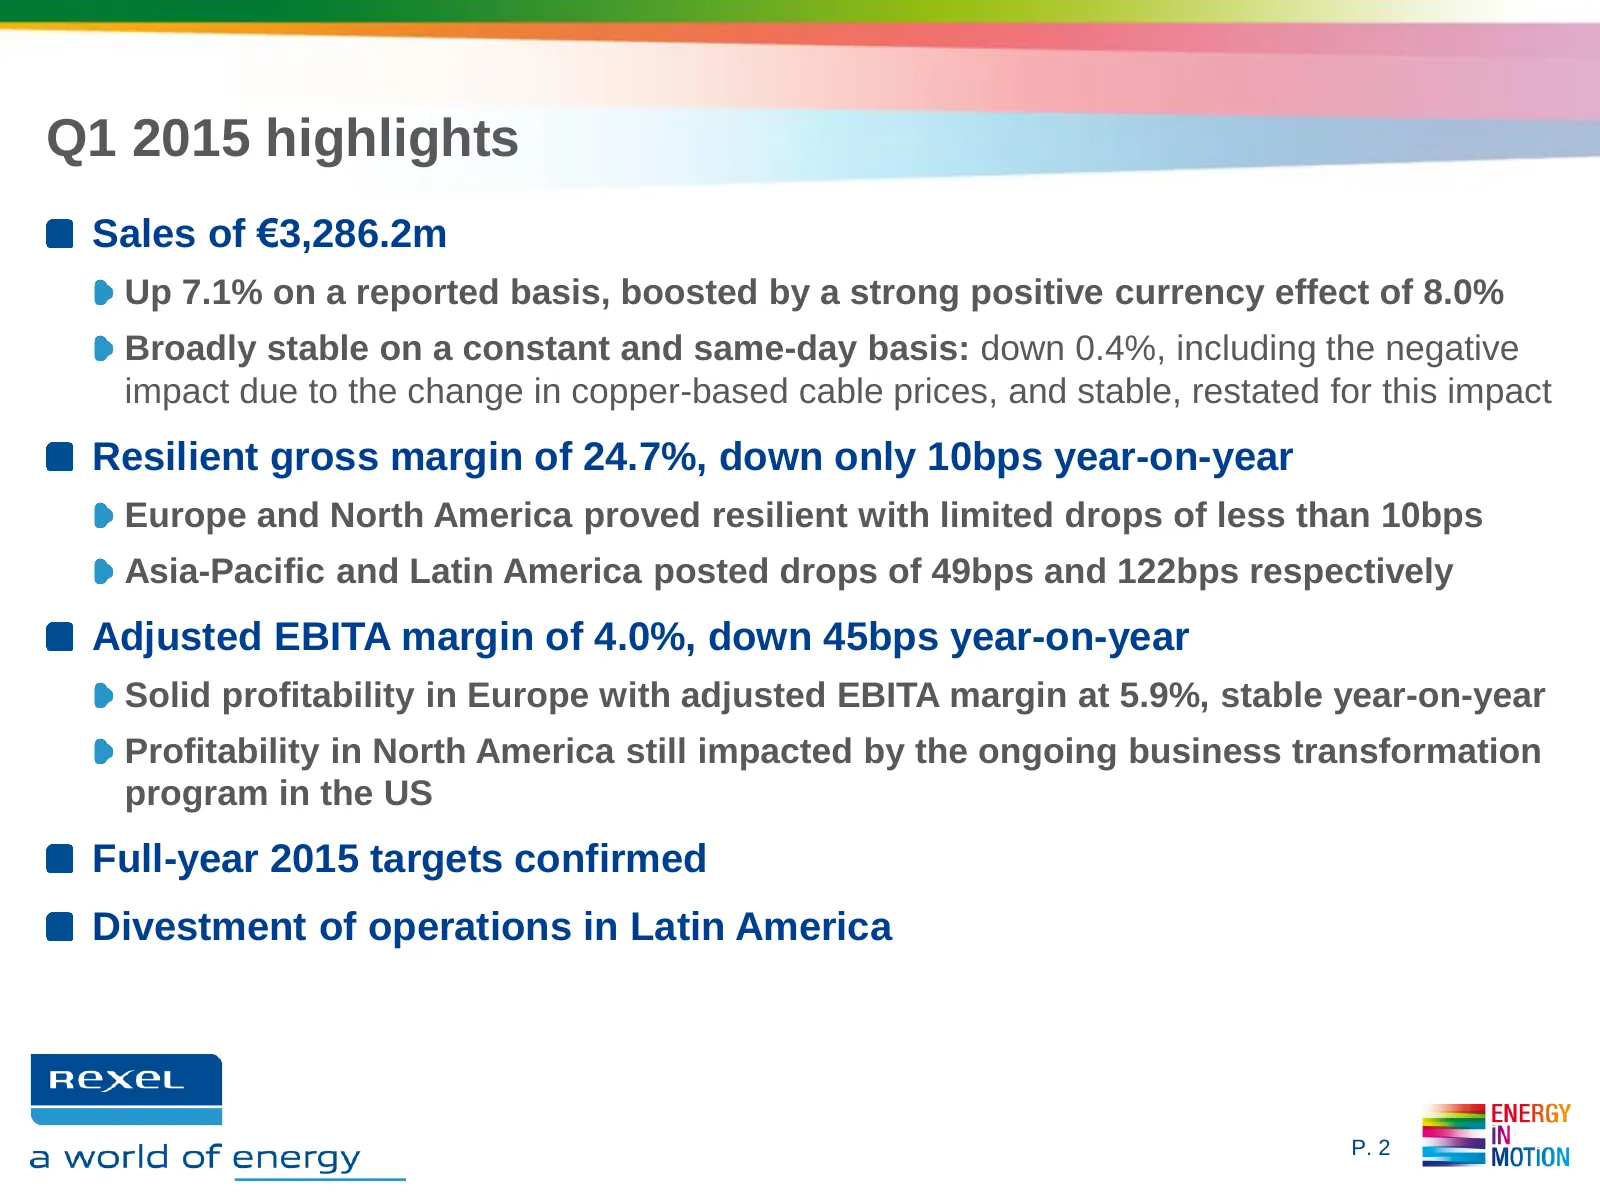
Q1 2015 highlights Sales of €3,286.2m Up 7.1% on a reported basis, boosted by a strong positive currency effect of 8.0% Broadly stable on a constant and same-day basis: down 0.4%, including the negative impact due to the change in copper-based cable prices, and stable, restated for this impact Resil
Slide 3: Results by Geography
RESULTS BY GEOGRAPHY Rexel bn a world of energy ENERG) IN MOTION
Slide 4: Europe: Broadly stable organic sales
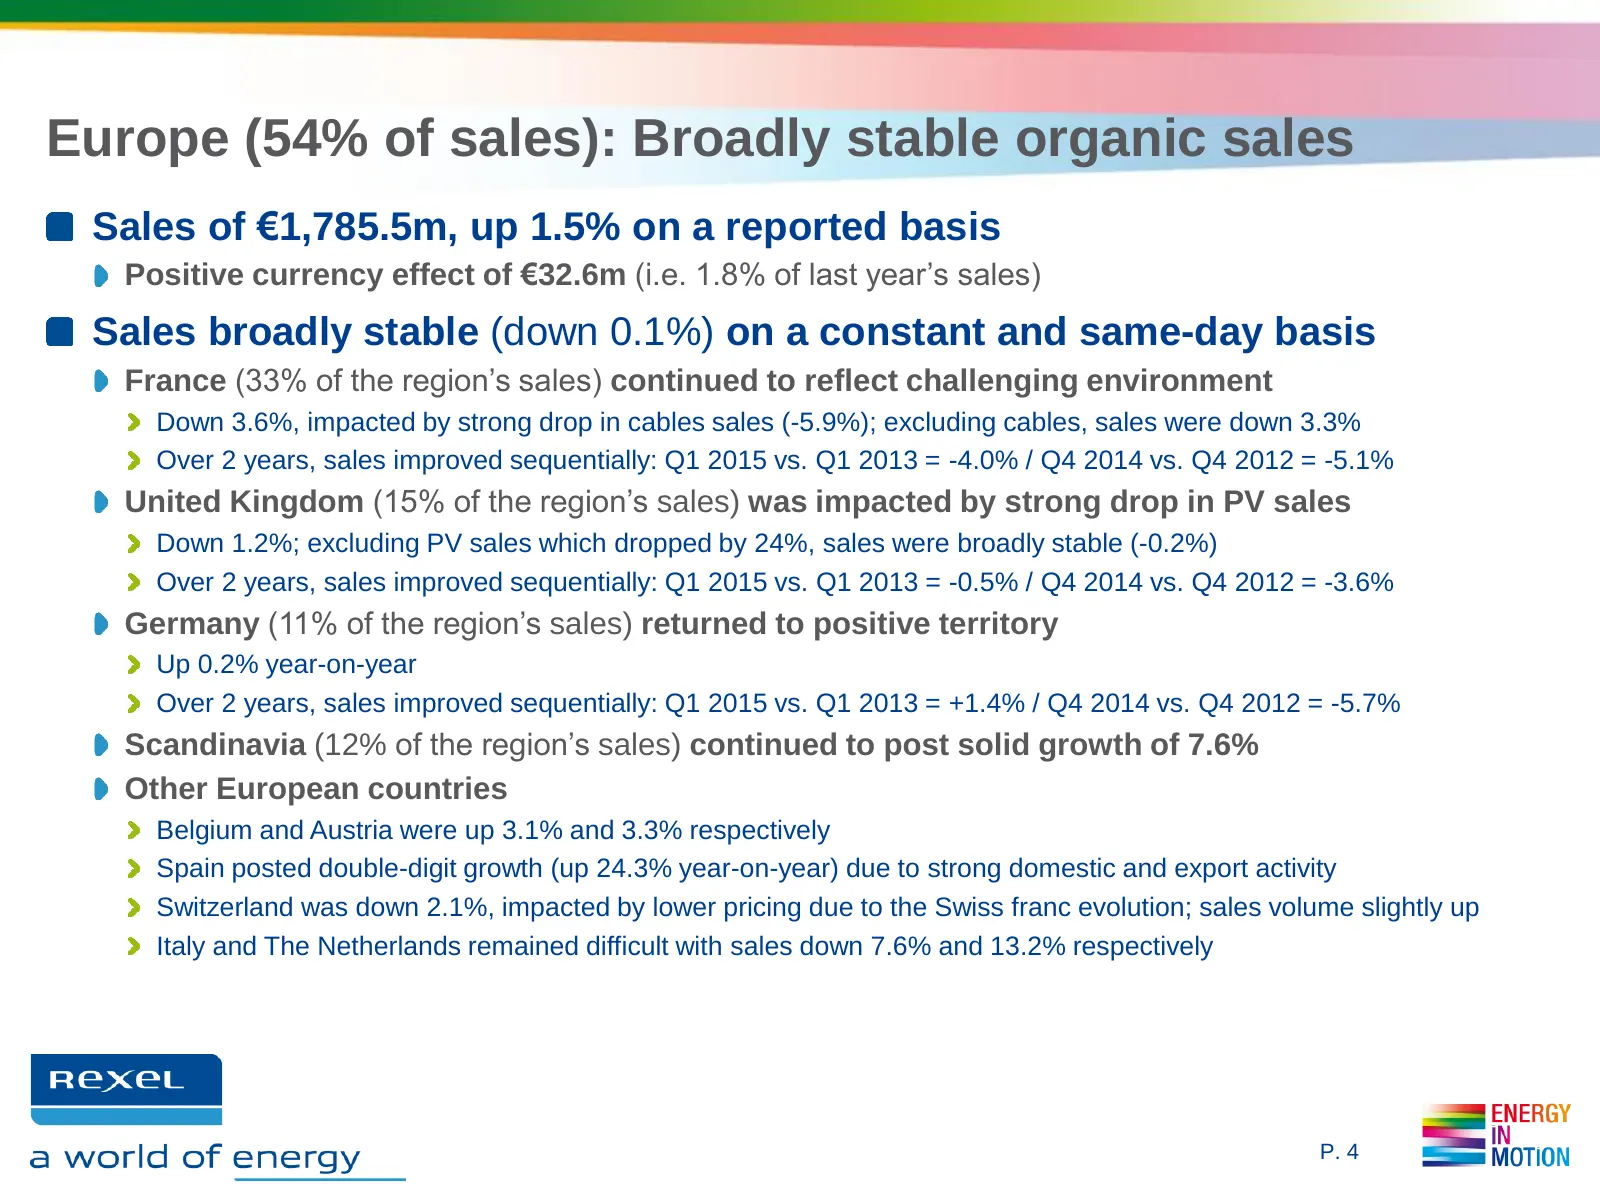
Europe (54% of sales): Broadly stable organic sales Sales of €1,785.5m, up 1.5% on a reported basis Positive currency effect of €32.6m (i.e. 1.8% of last year’s sales) Sales broadly stable (down 0.1%) on a constant and same-day basis France (33% of the region’s sales) continued to reflect challengin
Slide 5: Europe: Solid profitability
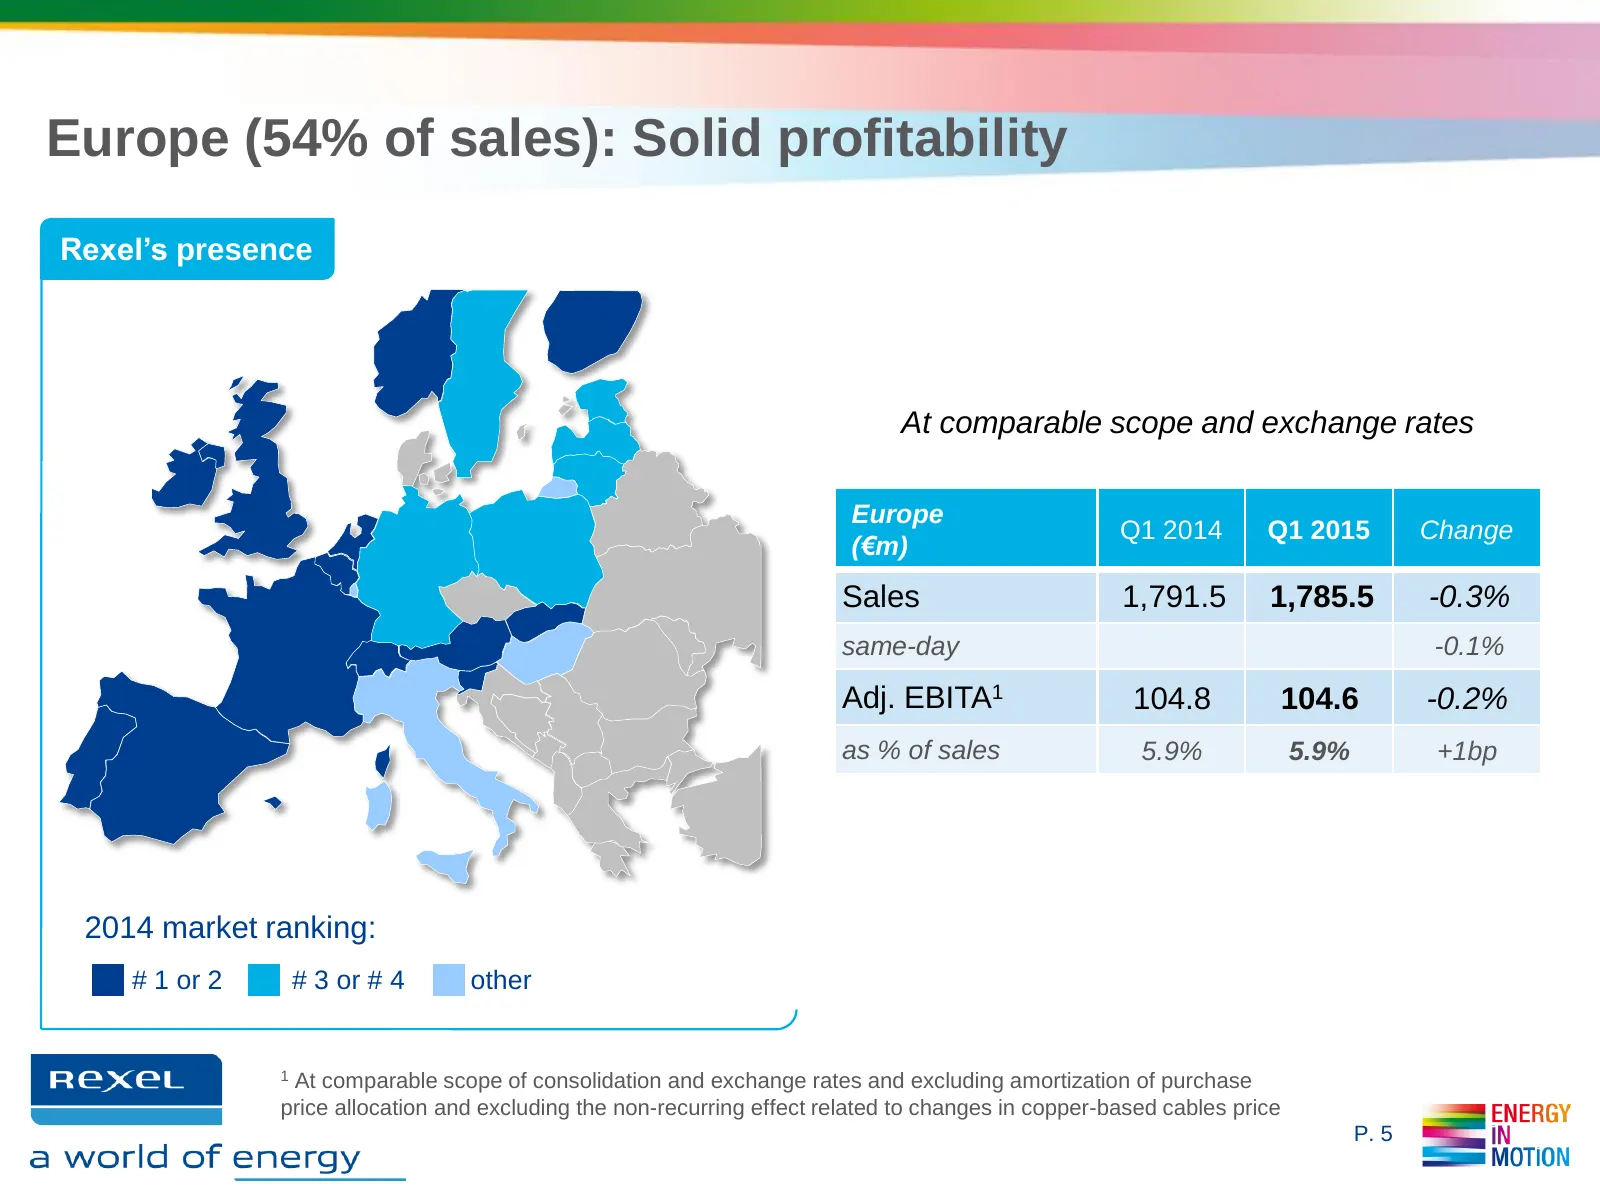
Europe (54% of sales): Solid profitability Rexel’s presence At comparable scope and exchange rates Europe Q1 2014 Q1 2015 Change (€m) Sales 1,791.5 1,785.5 -0.3% same-day -0.1% Adj. EBITA1 104.8 104.6 -0.2% as % of sales 5.9% 5.9% +1bp 2014 market ranking: # 1 or 2 # 3 or # 4 other 1 At comparable s
Slide 6: North America: Broadly stable organic sales
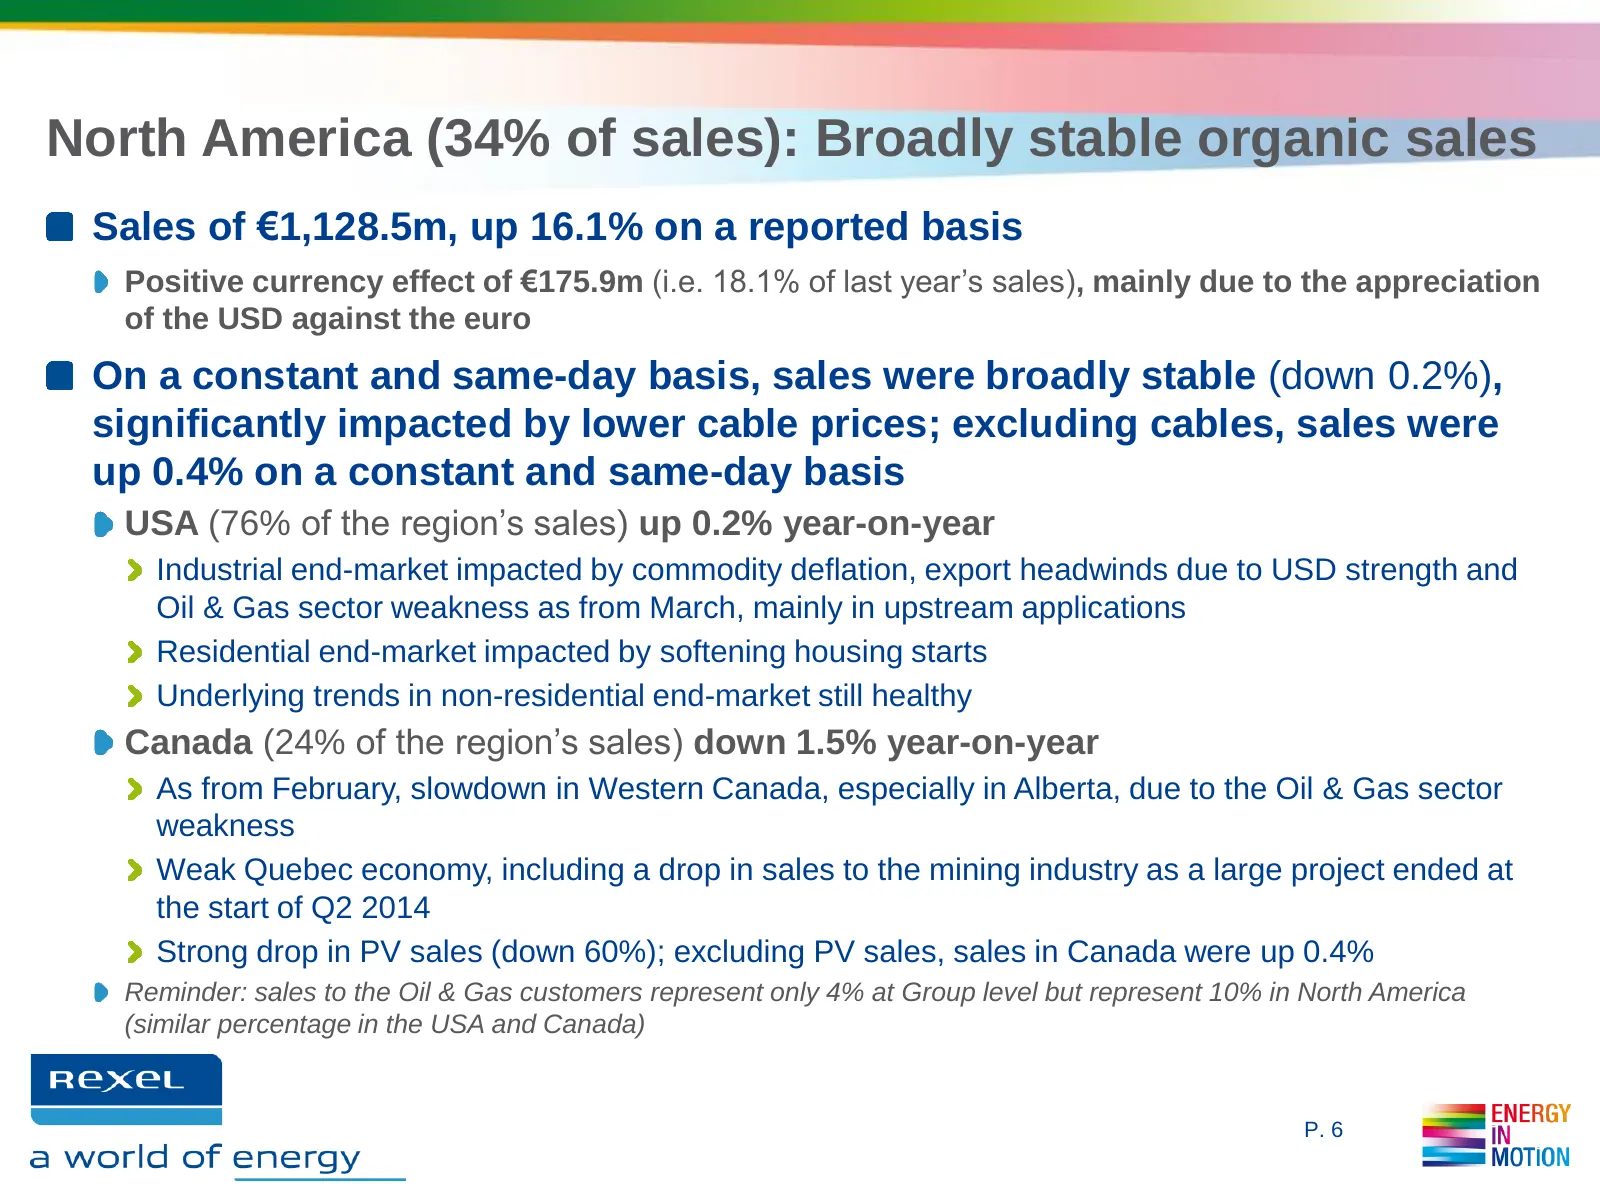
North America (34% of sales): Broadly stable organic sales Sales of €1,128.5m, up 16.1% on a reported basis Positive currency effect of €175.9m (i.e. 18.1% of last year’s sales), mainly due to the appreciation of the USD against the euro On a constant and same-day basis, sales were broadly stable (d
Slide 7: North America: Profitability still impacted by transformational projects in the US
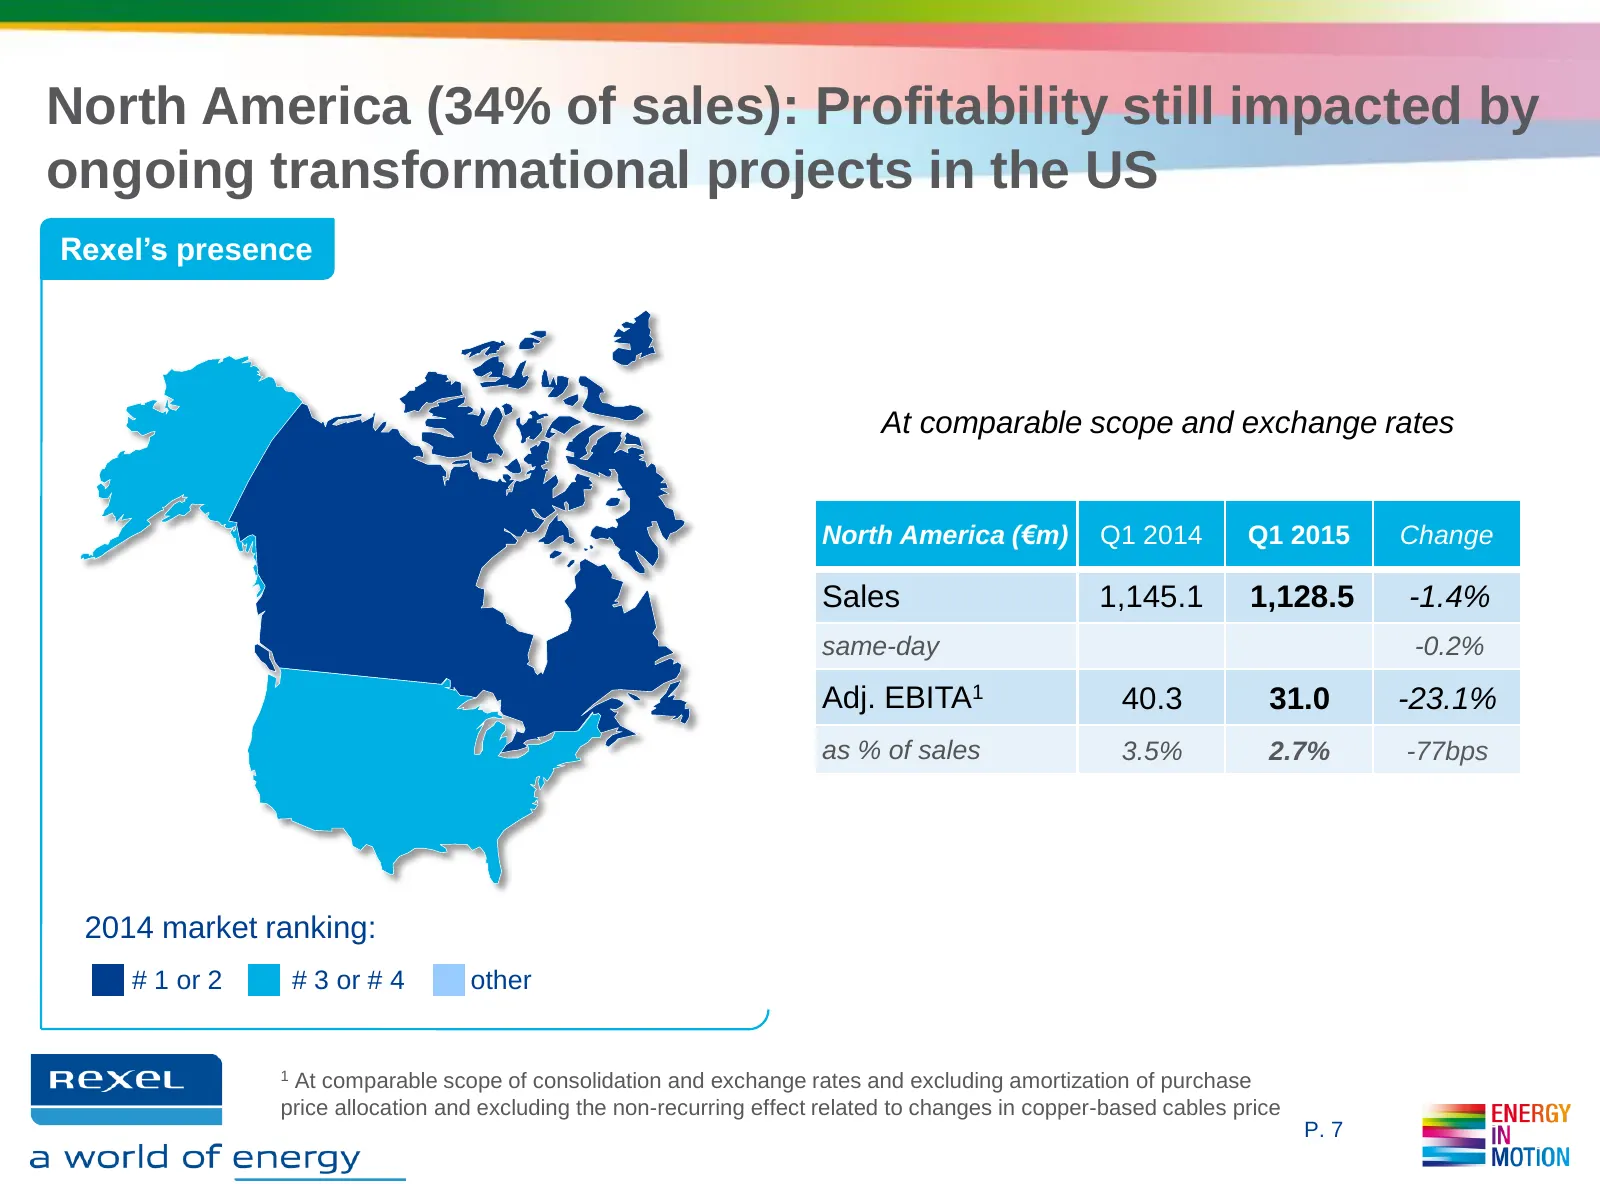
North America (34% of sales): Profitability still impacted by ongoing transformational projects in the US Rexel’s presence At comparable scope and exchange rates North America (€m) Q1 2014 Q1 2015 Change Sales 1,145.1 1,128.5 -1.4% same-day -0.2% Adj. EBITA1 40.3 31.0 -23.1% as % of sales 3.5% 2.7%
Slide 8: Asia-Pacific: Sales growth in Asia, underperformance in Pacific
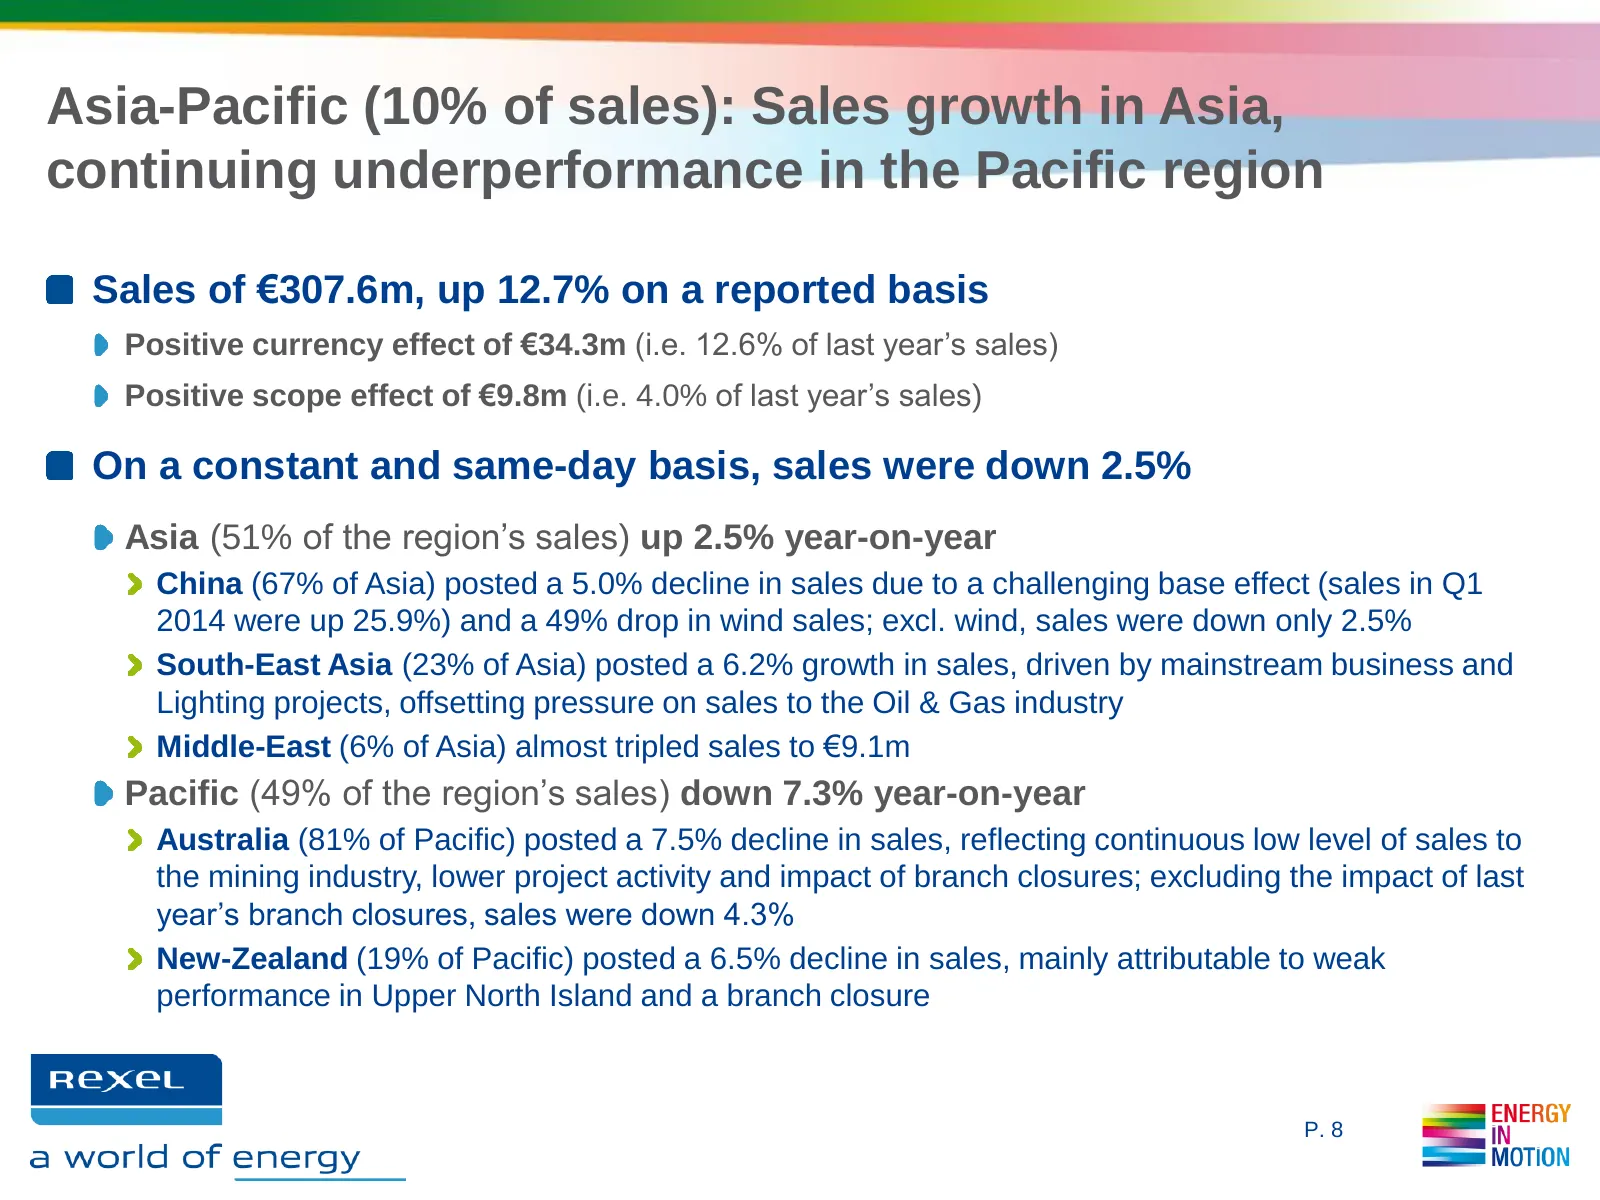
Asia-Pacific (10% of sales): Sales growth in Asia, continuing underperformance in the Pacific region Sales of €307.6m, up 12.7% on a reported basis Positive currency effect of €34.3m (i.e. 12.6% of last year’s sales) Positive scope effect of €9.8m (i.e. 4.0% of last year’s sales) On a constant and s
Slide 9: Asia-Pacific: Profitability impacted by weak Pacific sales
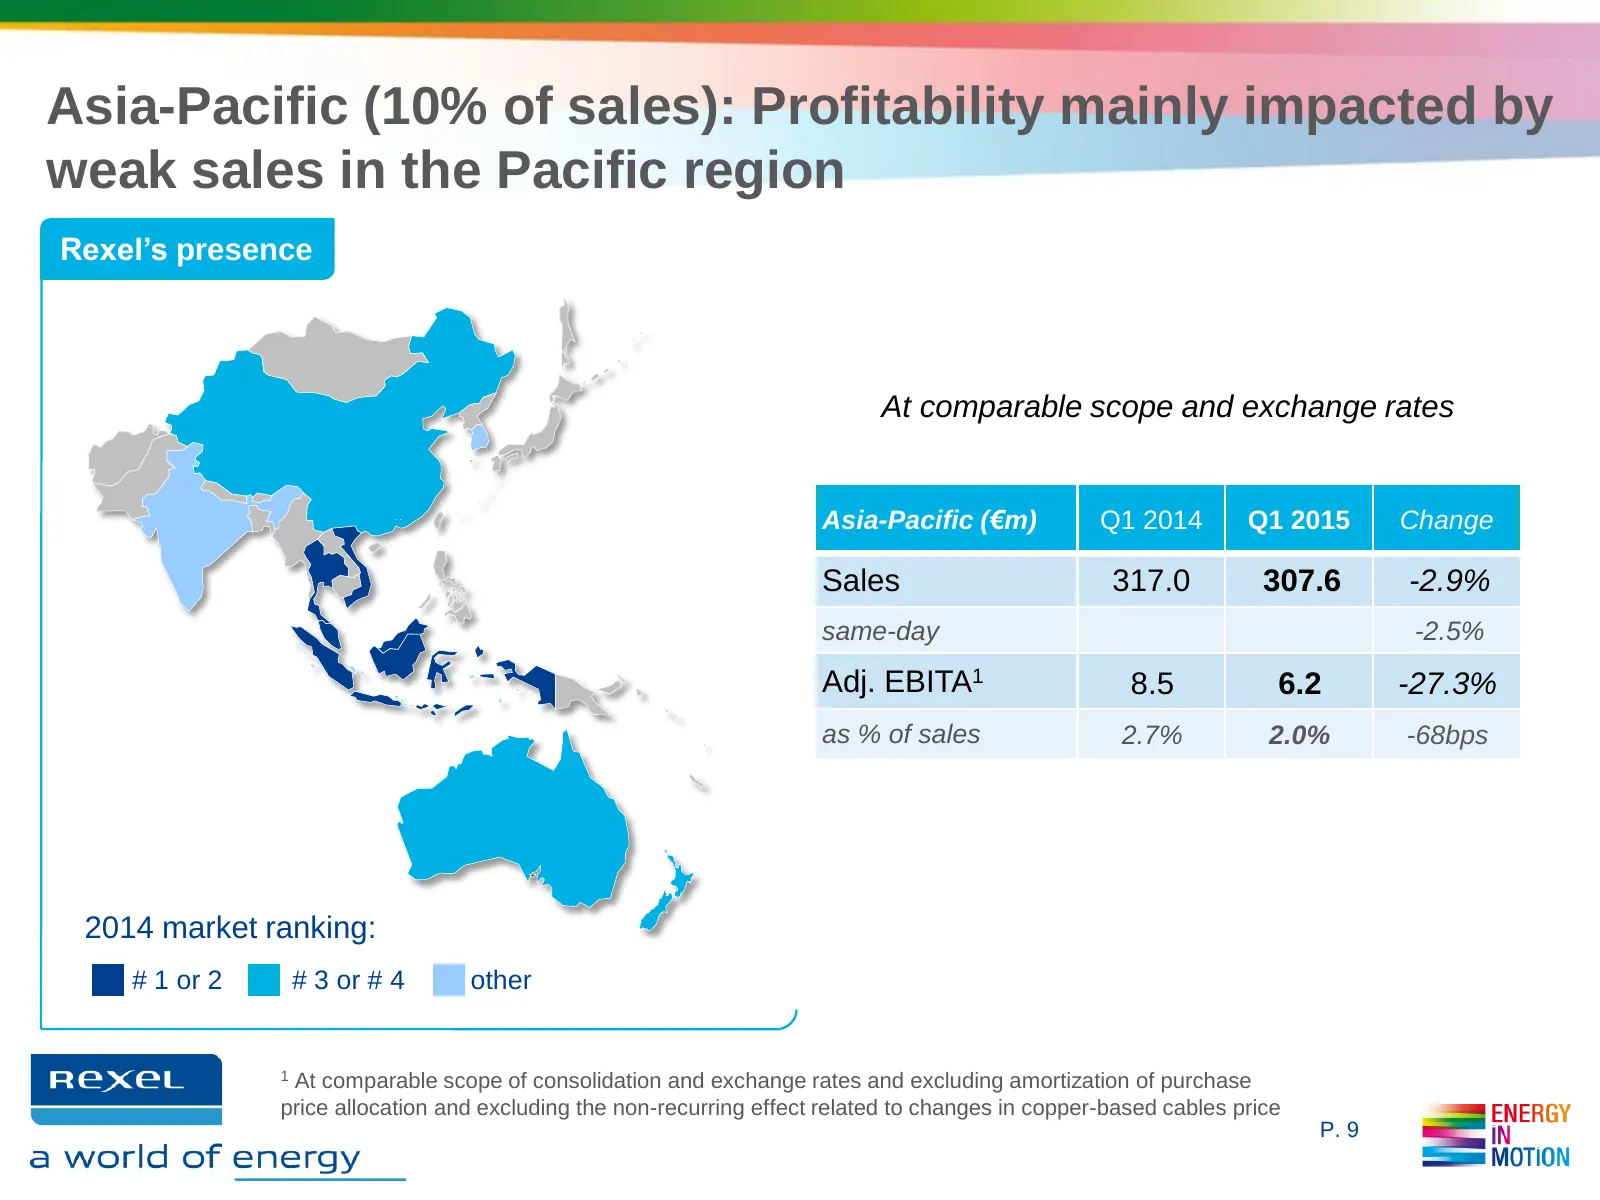
Asia-Pacific (10% of sales): Profitability mainly impacted by weak sales in the Pacific region Rexel’s presence At comparable scope and exchange rates Asia-Pacific (€m) Q1 2014 Q1 2015 Change Sales 317.0 307.6 -2.9% same-day -2.5% Adj. EBITA1 8.5 6.2 -27.3% as % of sales 2.7% 2.0% -68bps 2014 market
Slide 10: Entering the datacenter market in China through acquisition of Shanghai Maxqueen
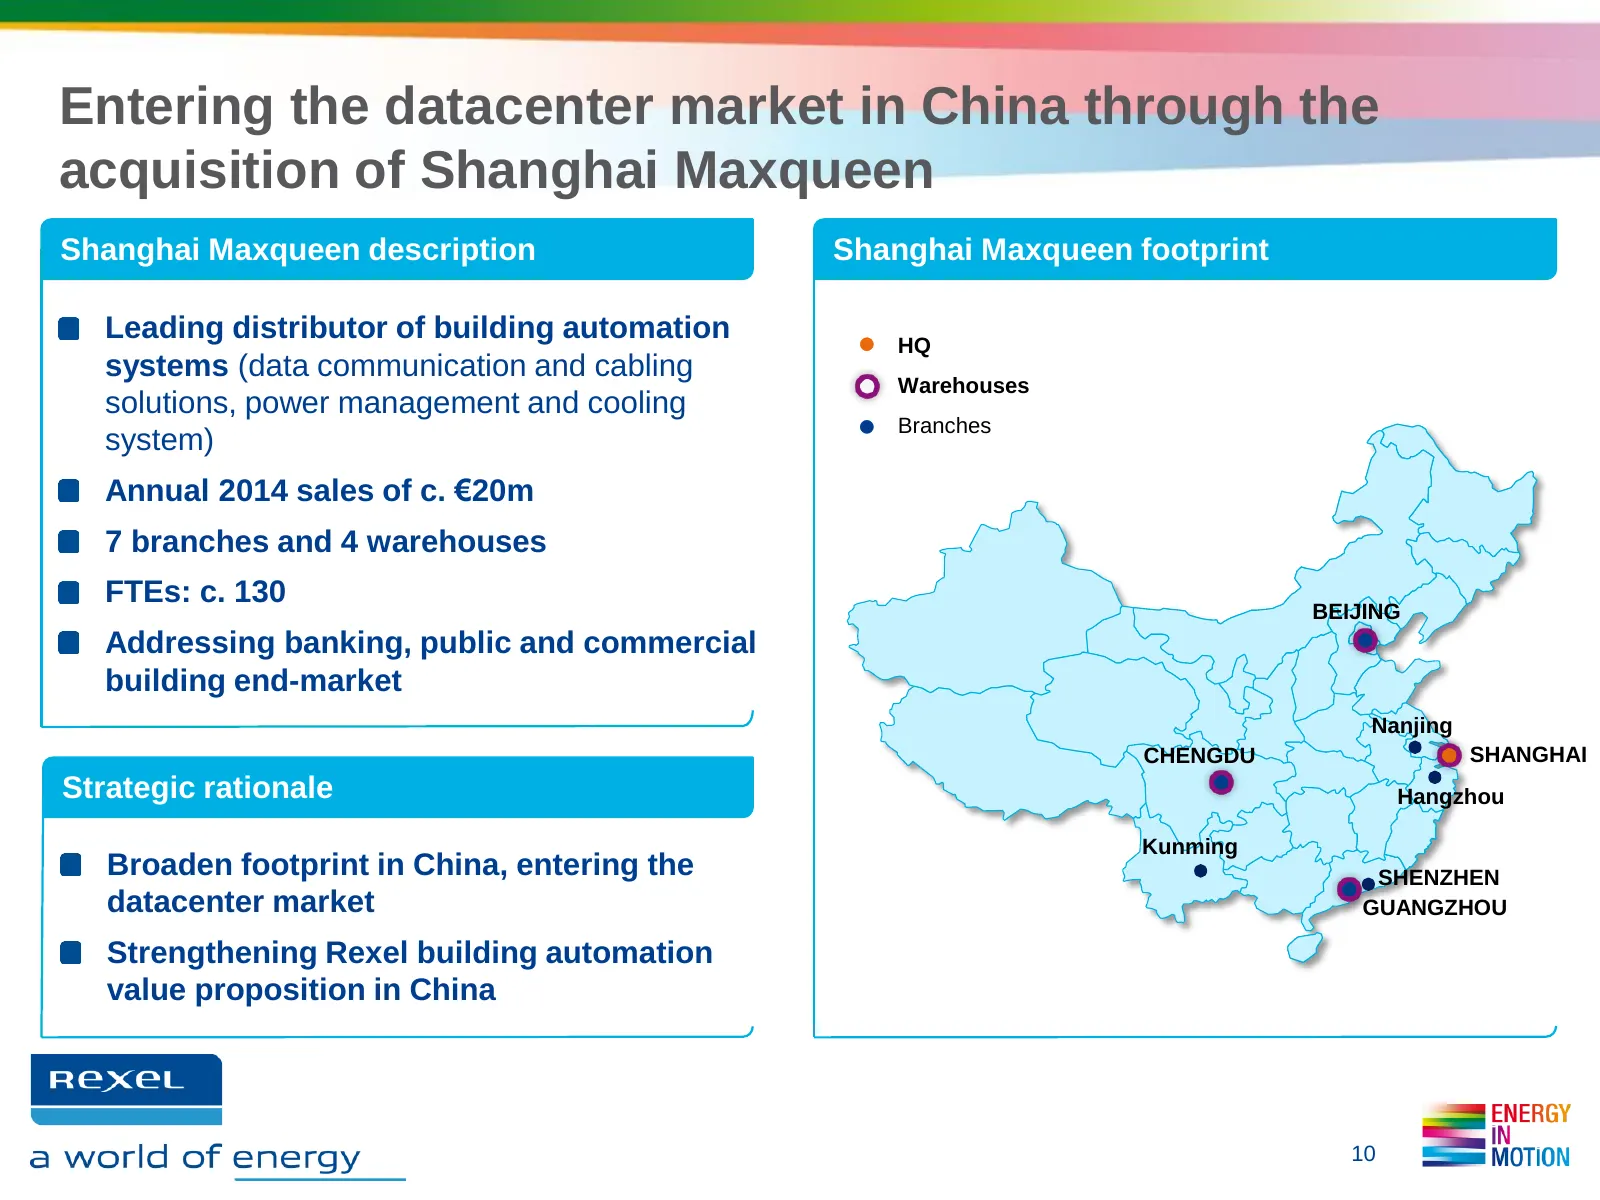
Entering the datacenter market in China through the acquisition of Shanghai Maxqueen Shanghai Maxqueen description Shanghai Maxqueen footprint Leading distributor of building automation HQ systems (data communication and cabling Warehouses solutions, power management and cooling Branches system) Ann
Slide 11: Latin America: Slight organic sales decline, strong Peru
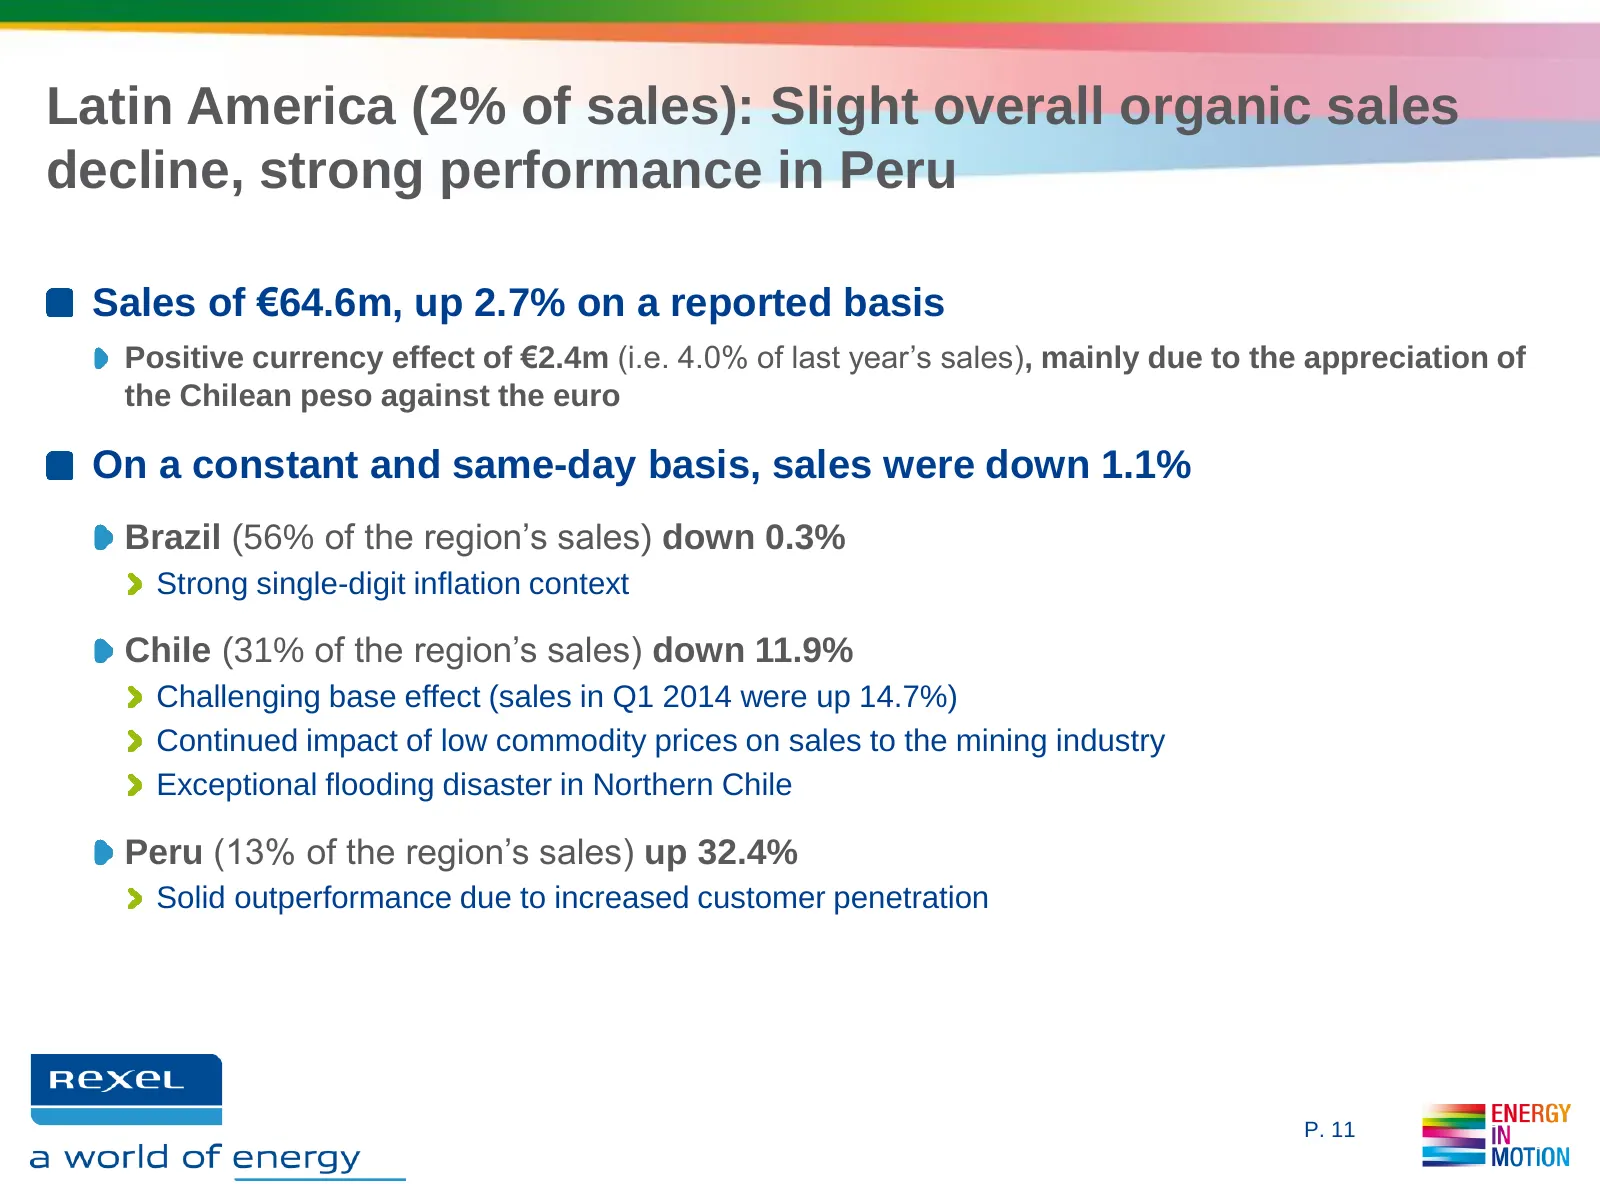
Latin America (2% of sales): Slight overall organic sales decline, strong performance in Peru Sales of €64.6m, up 2.7% on a reported basis Positive currency effect of €2.4m (i.e. 4.0% of last year’s sales), mainly due to the appreciation of the Chilean peso against the euro On a constant and same-da
Slide 12: Latin America: Profitability impacted by Chile
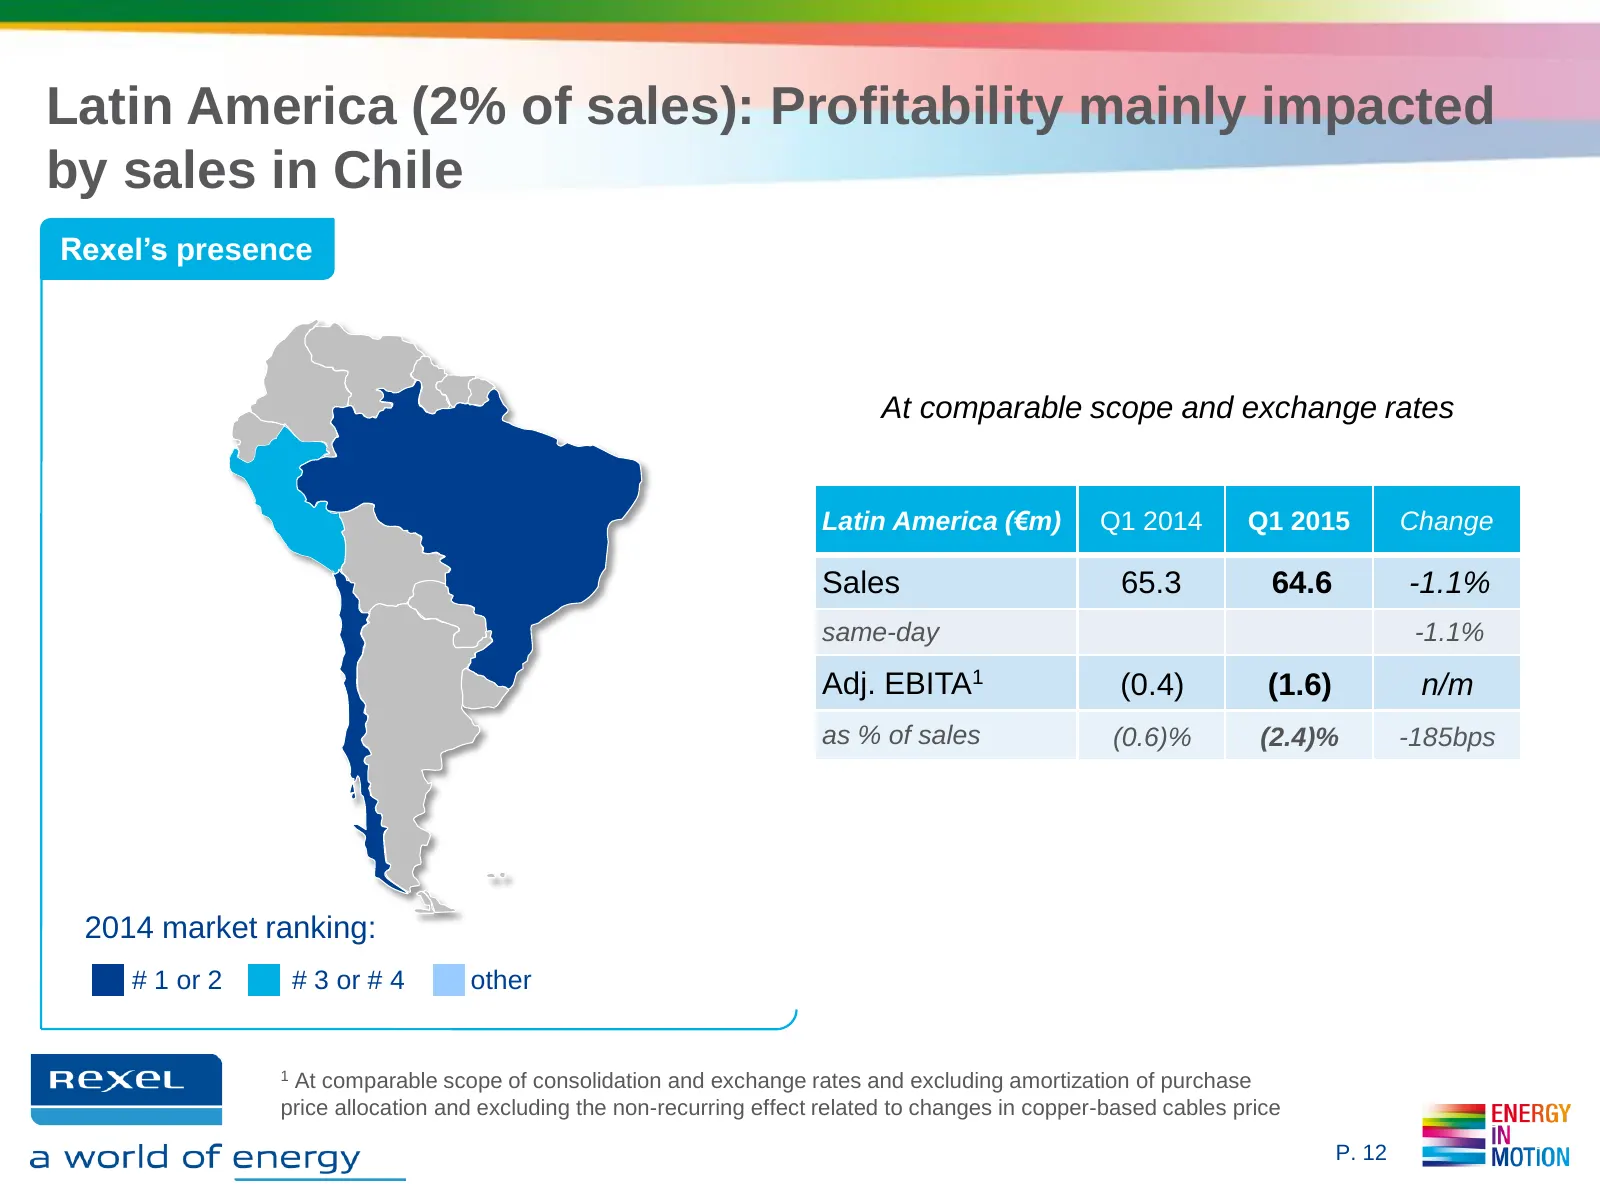
Latin America (2% of sales): Profitability mainly impacted by sales in Chile Rexel’s presence At comparable scope and exchange rates Latin America (€m) Q1 2014 Q1 2015 Change Sales 65.3 64.6 -1.1% same-day -1.1% Adj. EBITA1 (0.4) (1.6) n/m as % of sales (0.6)% (2.4)% -185bps 2014 market ranking: # 1
Slide 13: Financial Review
FINANCIAL REVIEW Rexel bn a world of energy
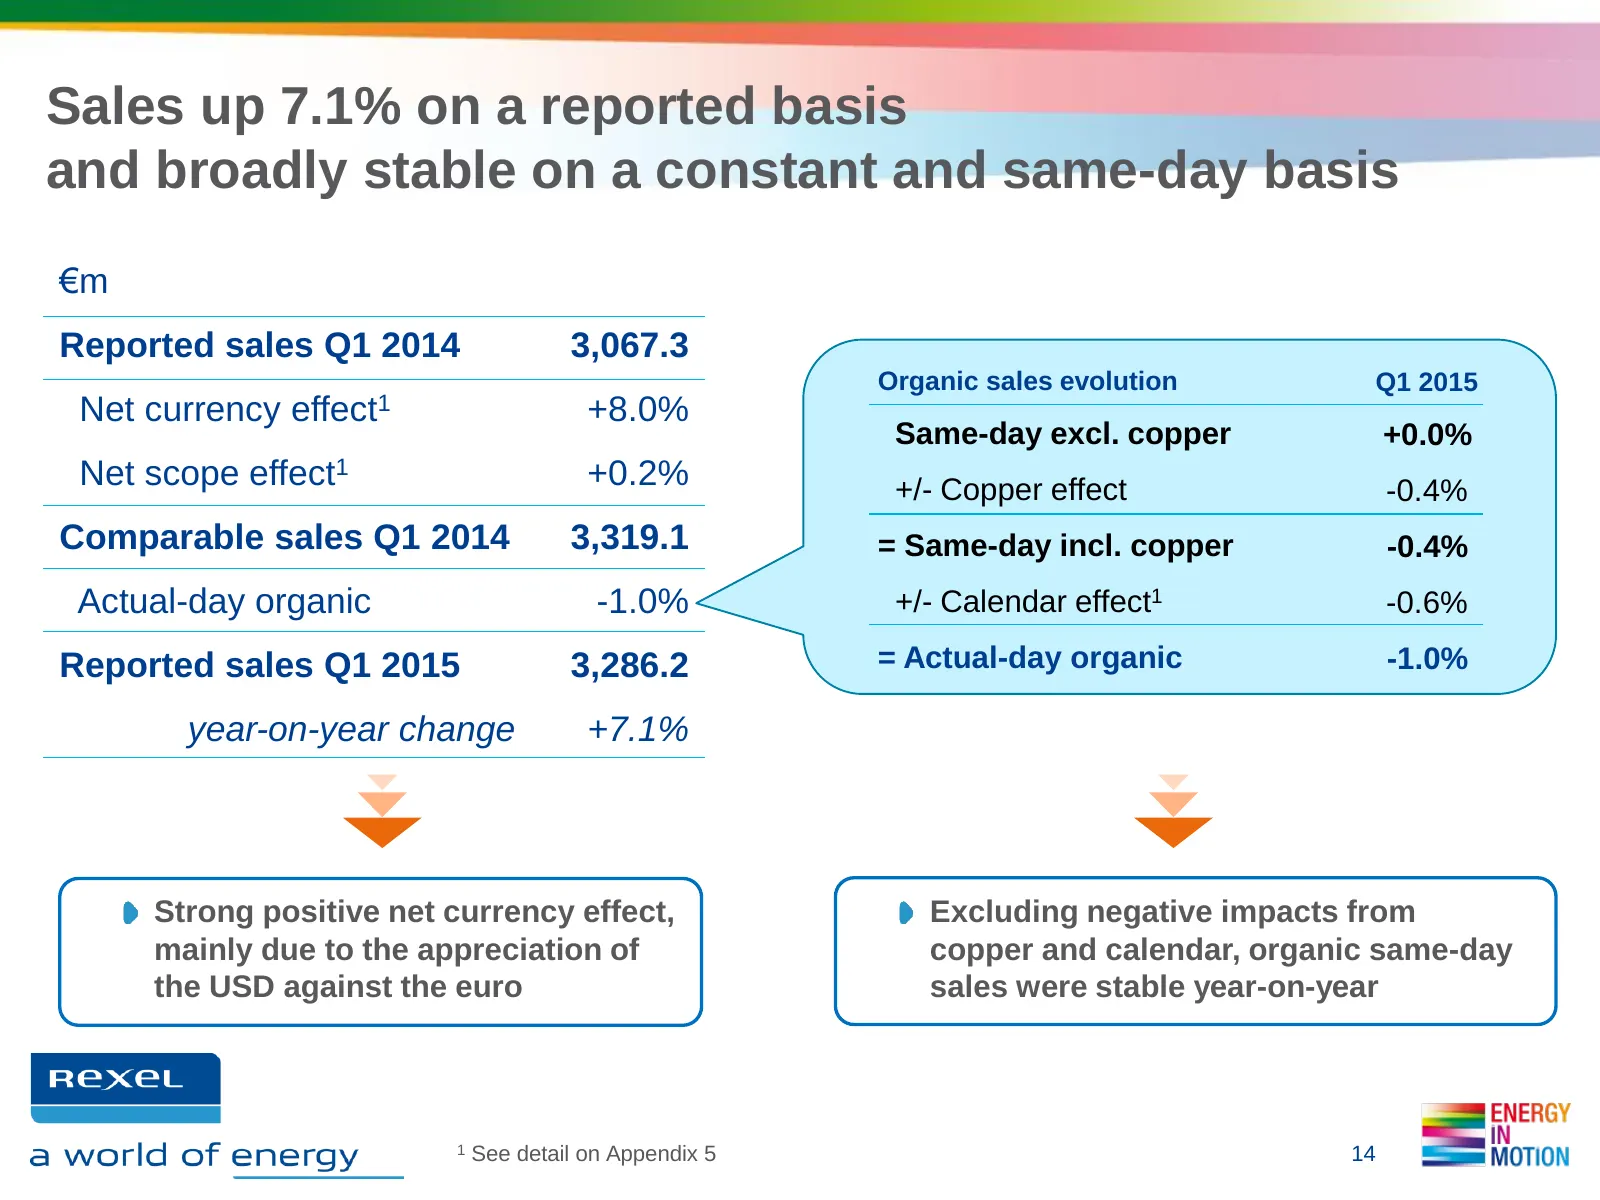
Slide 14: Sales up 7.1% reported, broadly stable on constant and same-day basis
Sales up 7.1% on a reported basis and broadly stable on a constant and same-day basis €m Reported sales Q1 2014 3,067.3 Organic sales evolution Q1 2015 Net currency effect1 +8.0% Same-day excl. copper +0.0% Net scope effect1 +0.2% +/- Copper effect -0.4% Comparable sales Q1 2014 3,319.1 = Same-day i
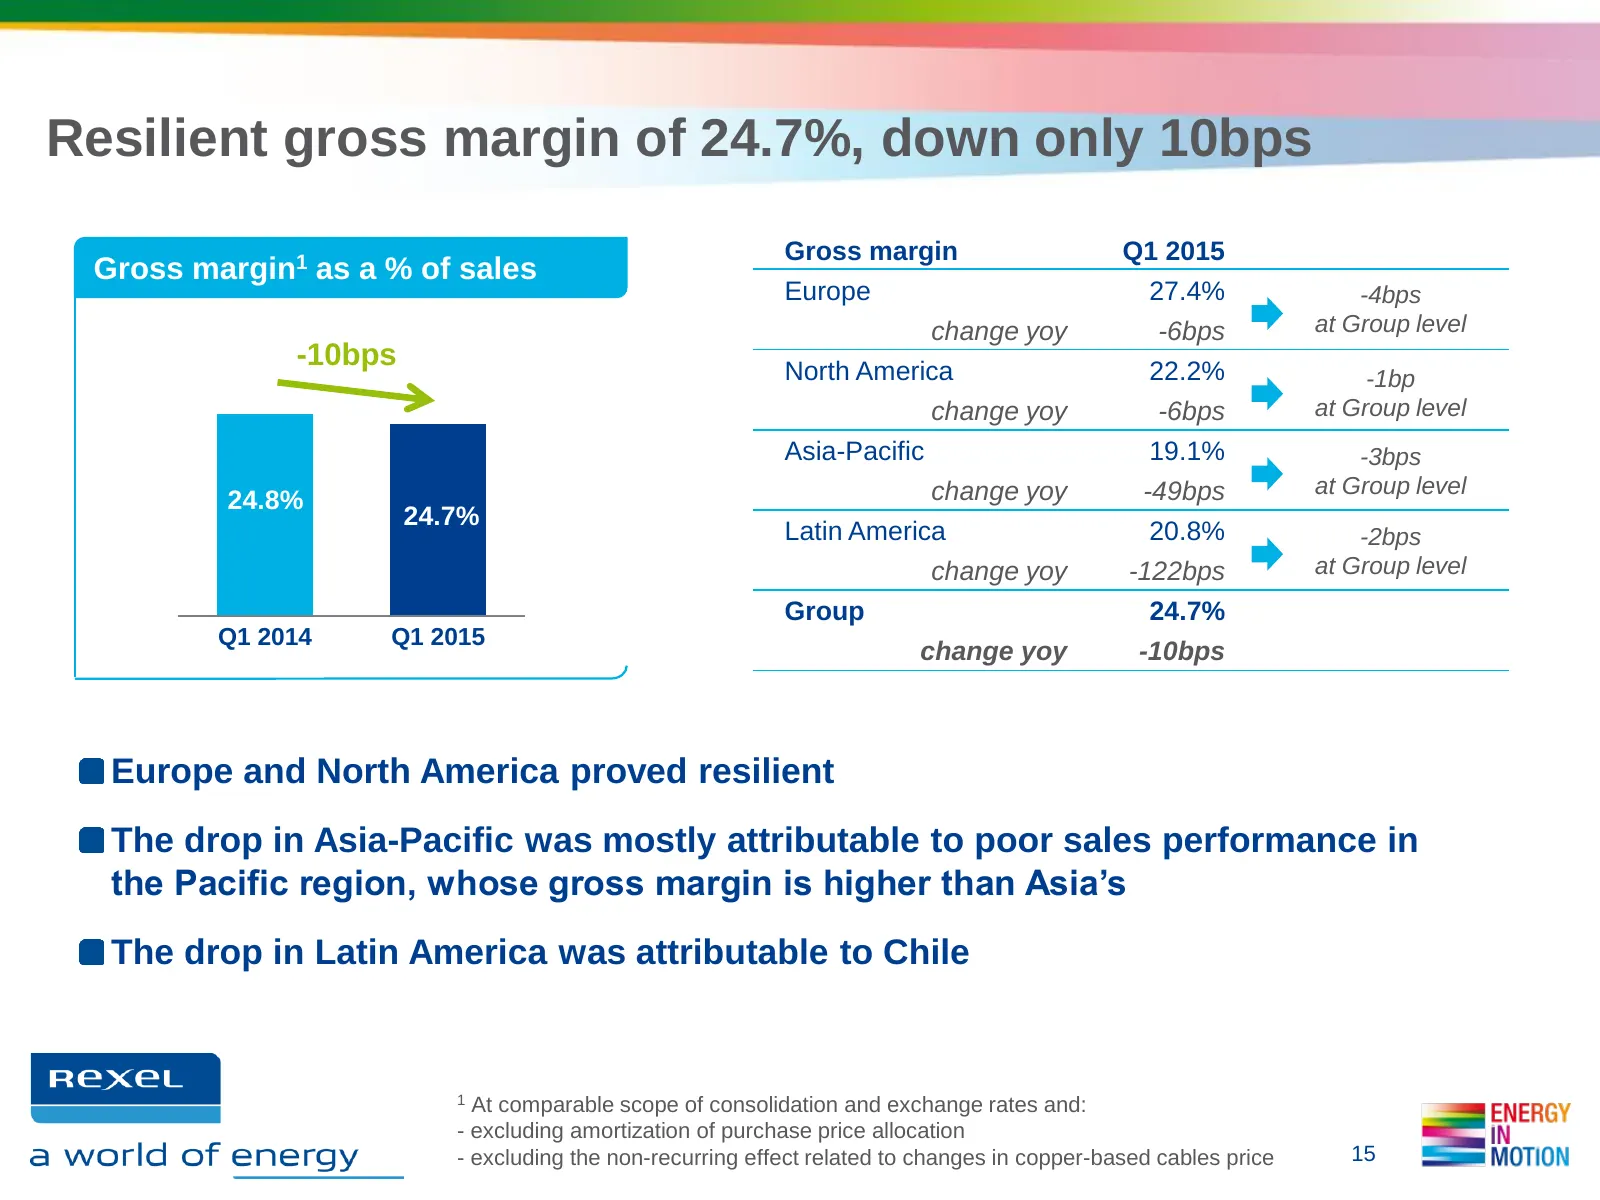
Slide 15: Resilient gross margin of 24.7%, down only 10bps
Resilient gross margin of 24.7%, down only 10bps Gross margin Q1 2015 Gross margin1 as a % of sales Europe 27.4% -4bps change yoy -6bps at Group level -10bps North America 22.2% -1bp change yoy -6bps at Group level Asia-Pacific 19.1% -3bps change yoy -49bps at Group level 24.8% 24.7% Latin America 2
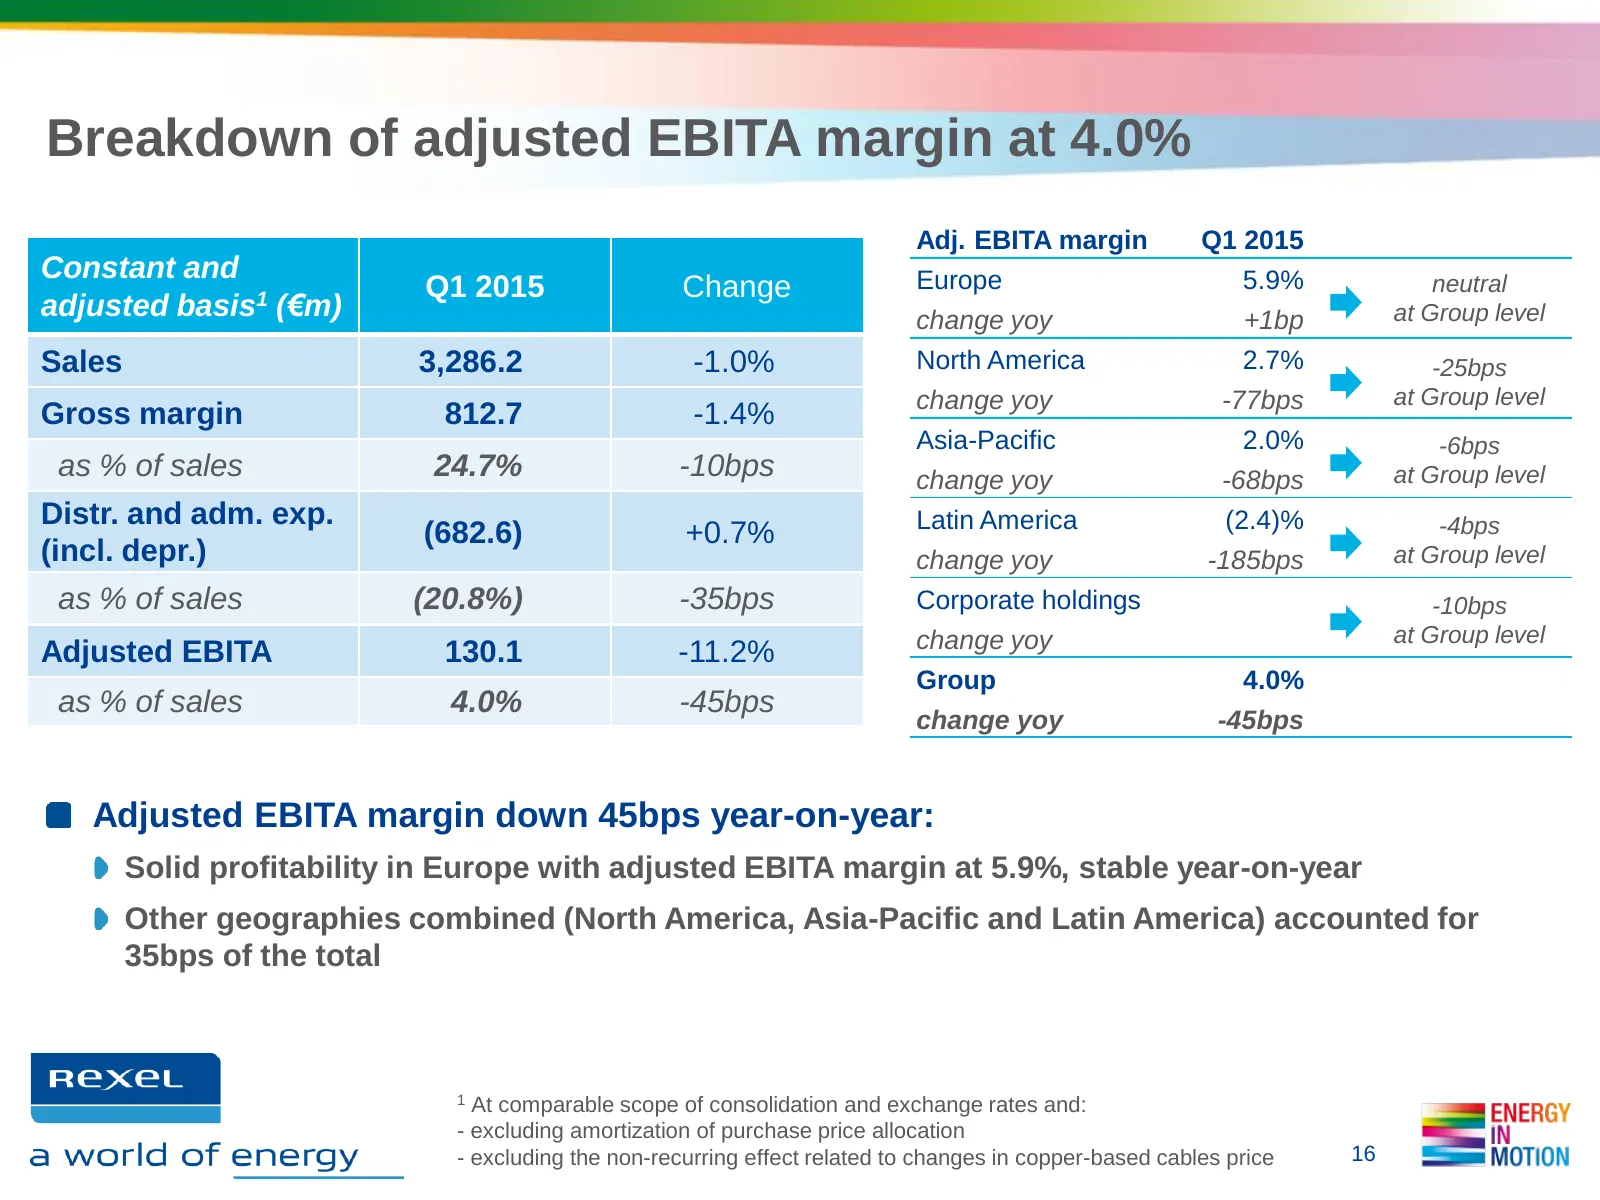
Slide 16: Breakdown of adjusted EBITA margin at 4.0%
Breakdown of adjusted EBITA margin at 4.0% Adj. EBITA margin Q1 2015 Constant and Europe 5.9% neutral Q1 2015 Change adjusted basis1 (€m) change yoy +1bp at Group level Sales 3,286.2 -1.0% North America 2.7% -25bps change yoy -77bps at Group level Gross margin 812.7 -1.4% Asia-Pacific 2.0% -6bps as
Slide 17: Net income impacted by one-off financing optimization costs
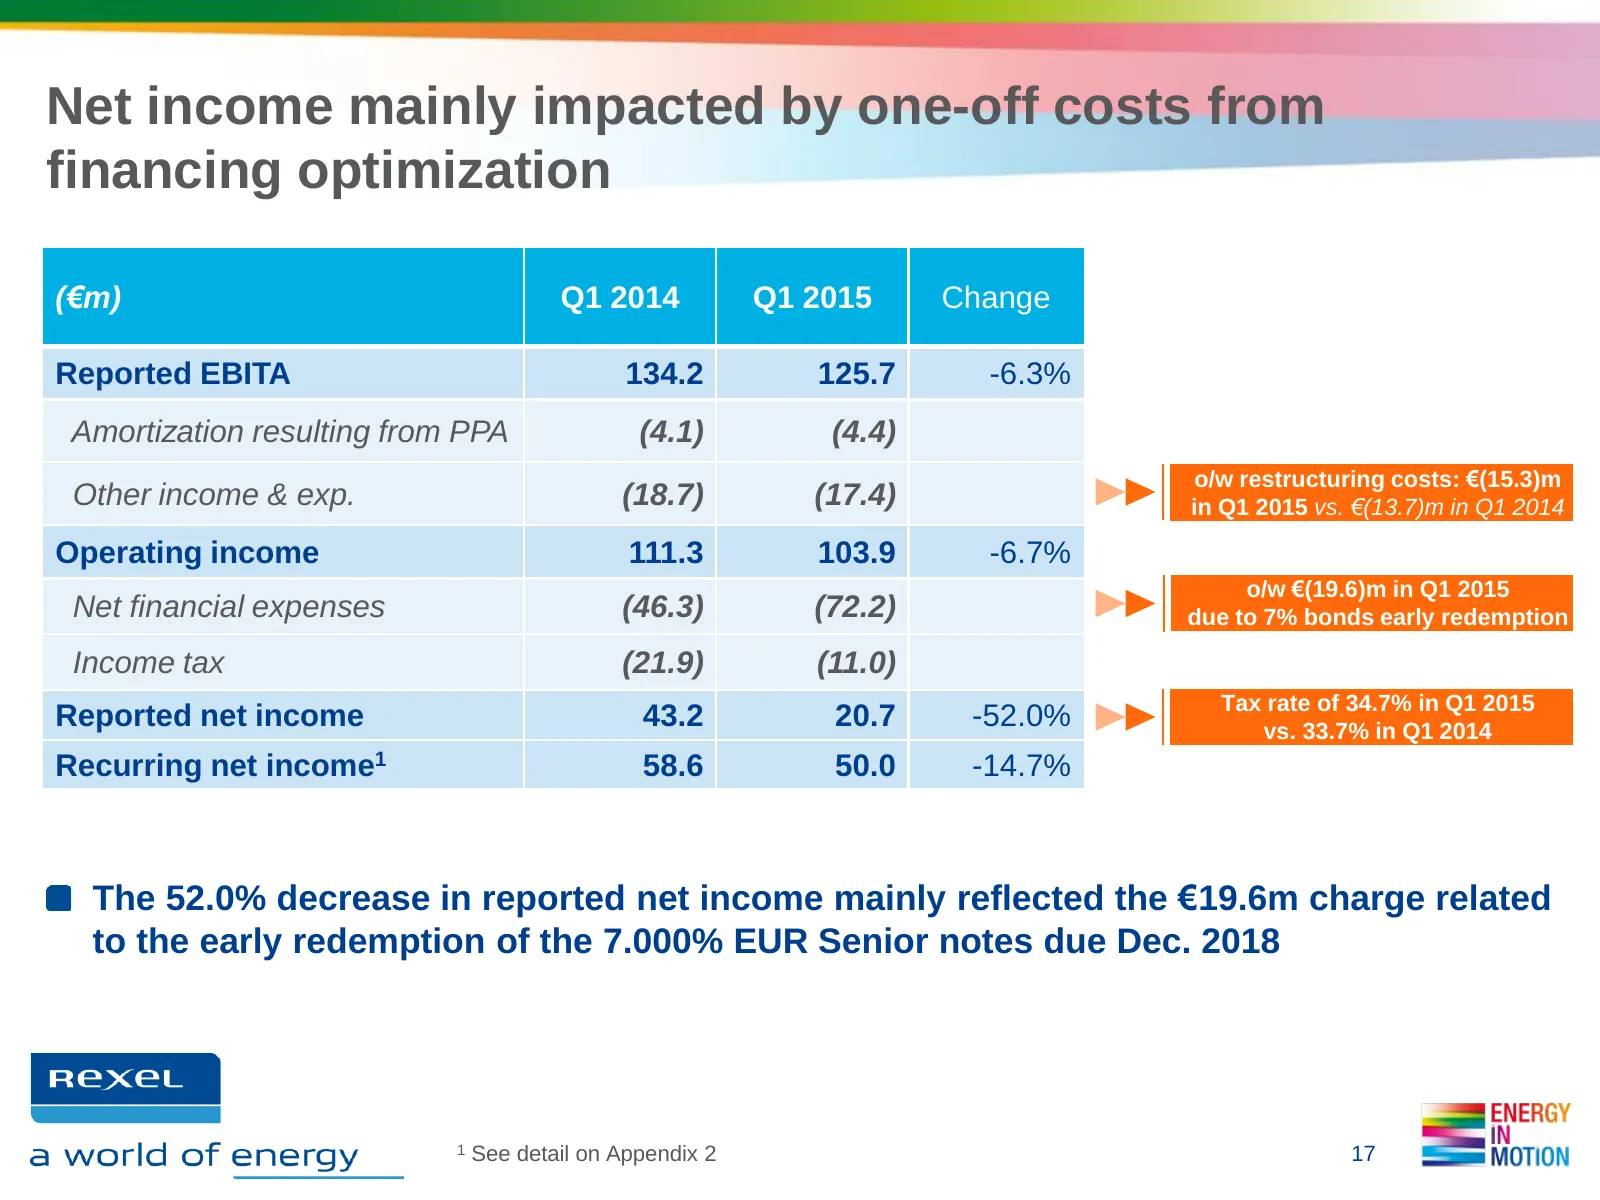
Net income mainly impacted by one-off costs from financing optimization (€m) Q1 2014 Q1 2015 Change Reported EBITA 134.2 125.7 -6.3% Amortization resulting from PPA (4.1) (4.4) o/w restructuring costs: €(15.3)m Other income & exp. (18.7) (17.4) in Q1 2015 vs. €(13.7)m in Q1 2014 Operating income 111
Slide 18: FCF before I&T impacted by seasonality on WCR
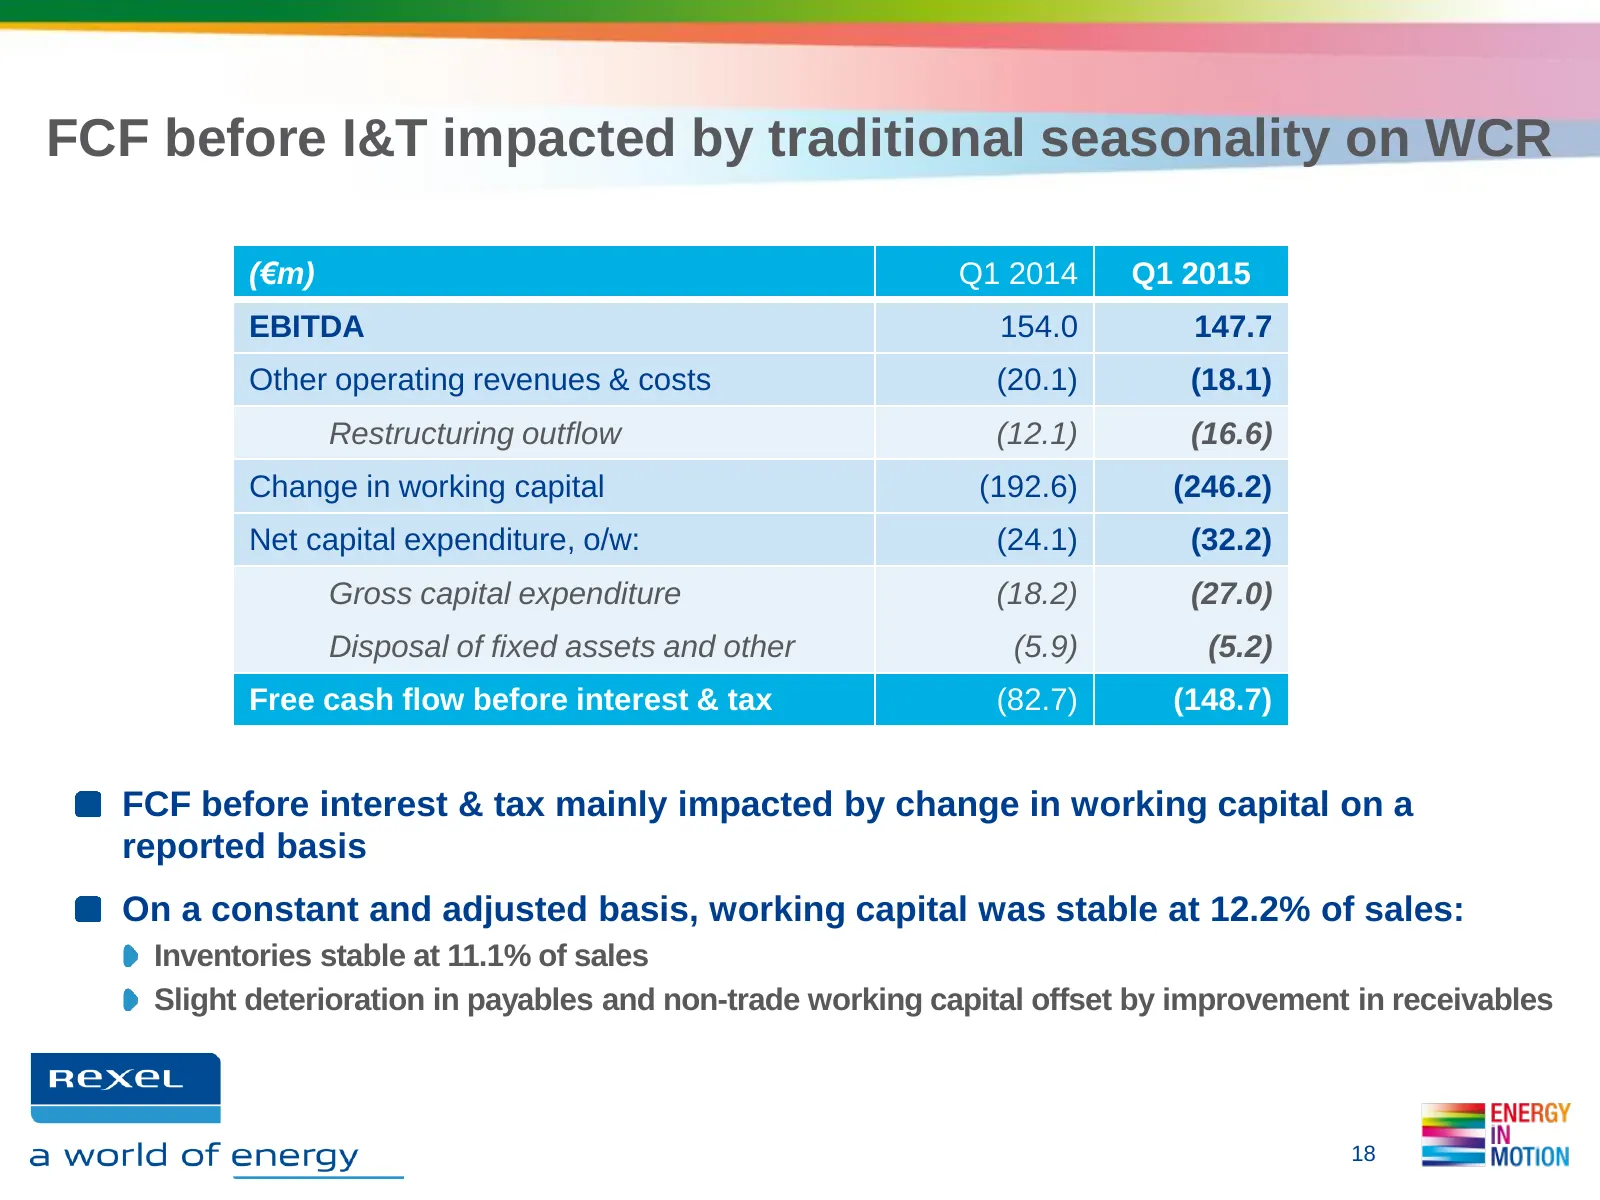
FCF before I&T impacted by traditional seasonality on WCR (€m) Q1 2014 Q1 2015 EBITDA 154.0 147.7 Other operating revenues & costs (20.1) (18.1) Restructuring outflow (12.1) (16.6) Change in working capital (192.6) (246.2) Net capital expenditure, o/w: (24.1) (32.2) Gross capital expenditure (18.2)
Slide 19: Net debt impacted by seasonality and unfavorable currency effect
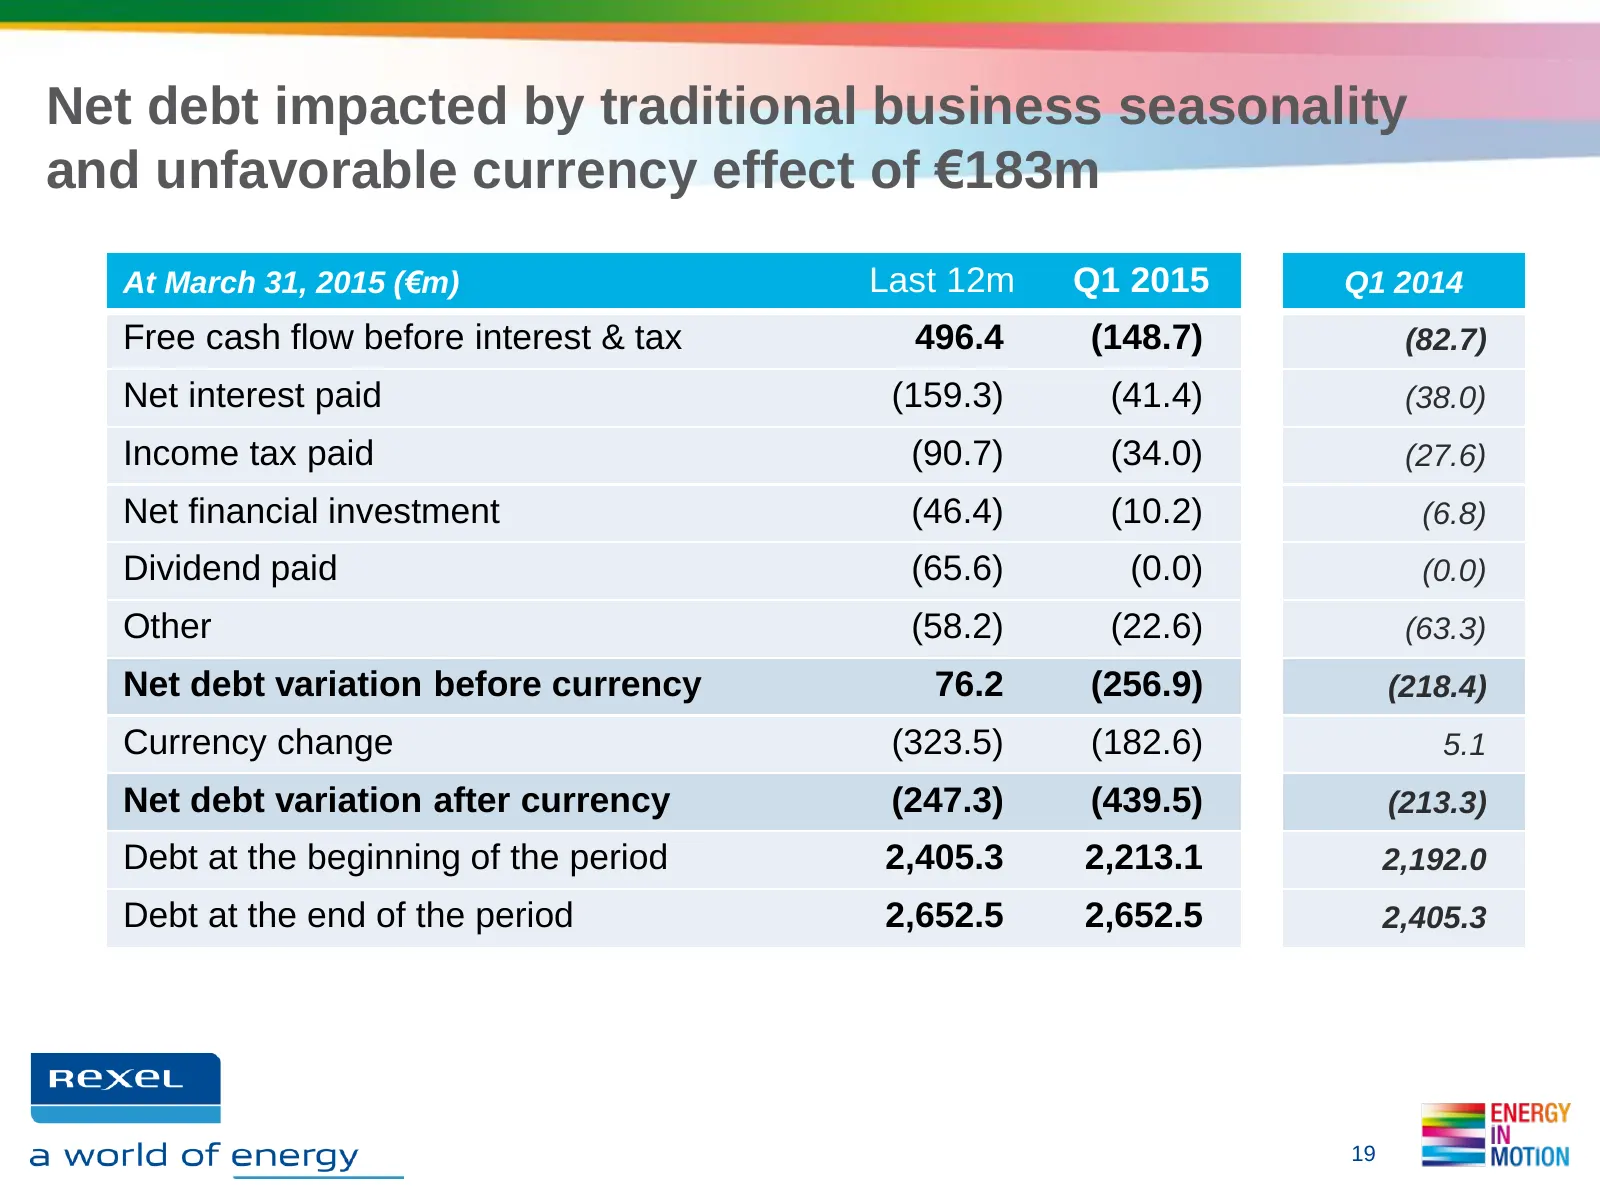
Net debt impacted by traditional business seasonality and unfavorable currency effect of €183m At March 31, 2015 (€m) Last 12m Q1 2015 Q1 2014 Free cash flow before interest & tax 496.4 (148.7) (82.7) Net interest paid (159.3) (41.4) (38.0) Income tax paid (90.7) (34.0) (27.6) Net financial investme
Slide 20: Sound financial structure
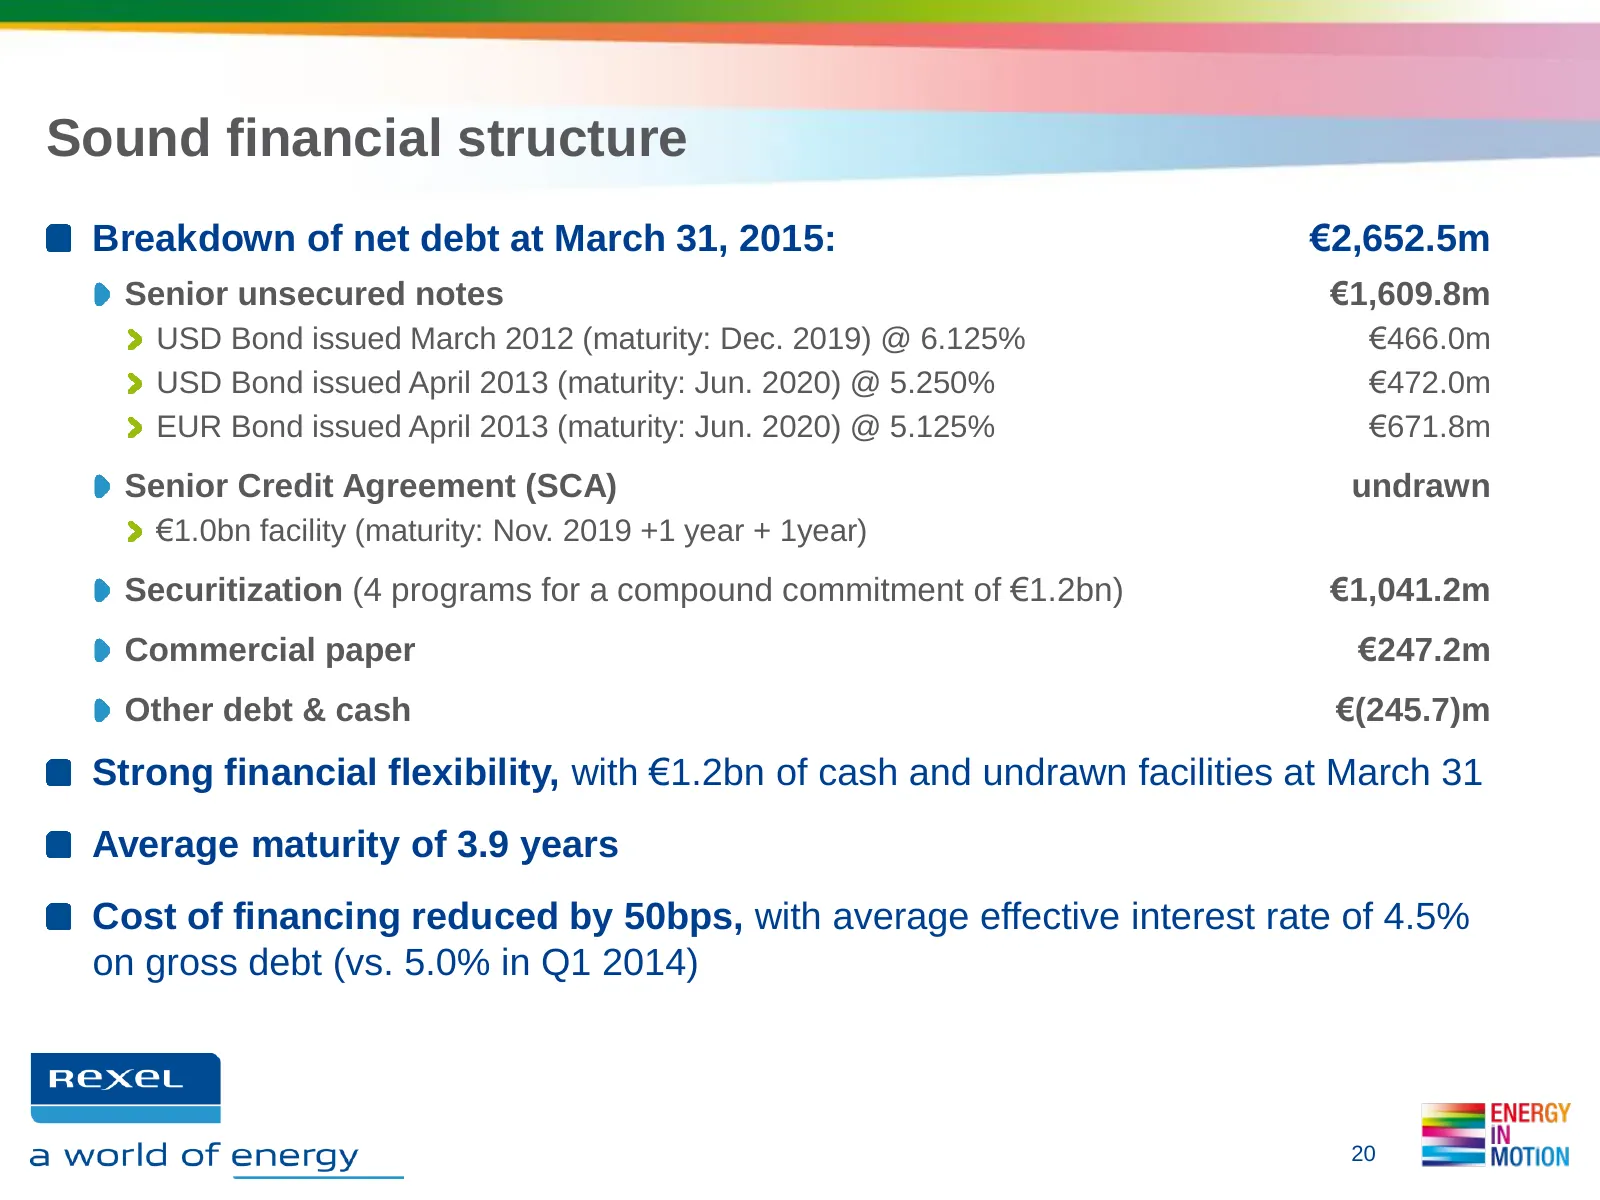
Sound financial structure Breakdown of net debt at March 31, 2015: €2,652.5m Senior unsecured notes €1,609.8m USD Bond issued March 2012 (maturity: Dec. 2019) @ 6.125% €466.0m USD Bond issued April 2013 (maturity: Jun. 2020) @ 5.250% €472.0m EUR Bond issued April 2013 (maturity: Jun. 2020) @ 5.125%
Slide 21: Active balance-sheet management
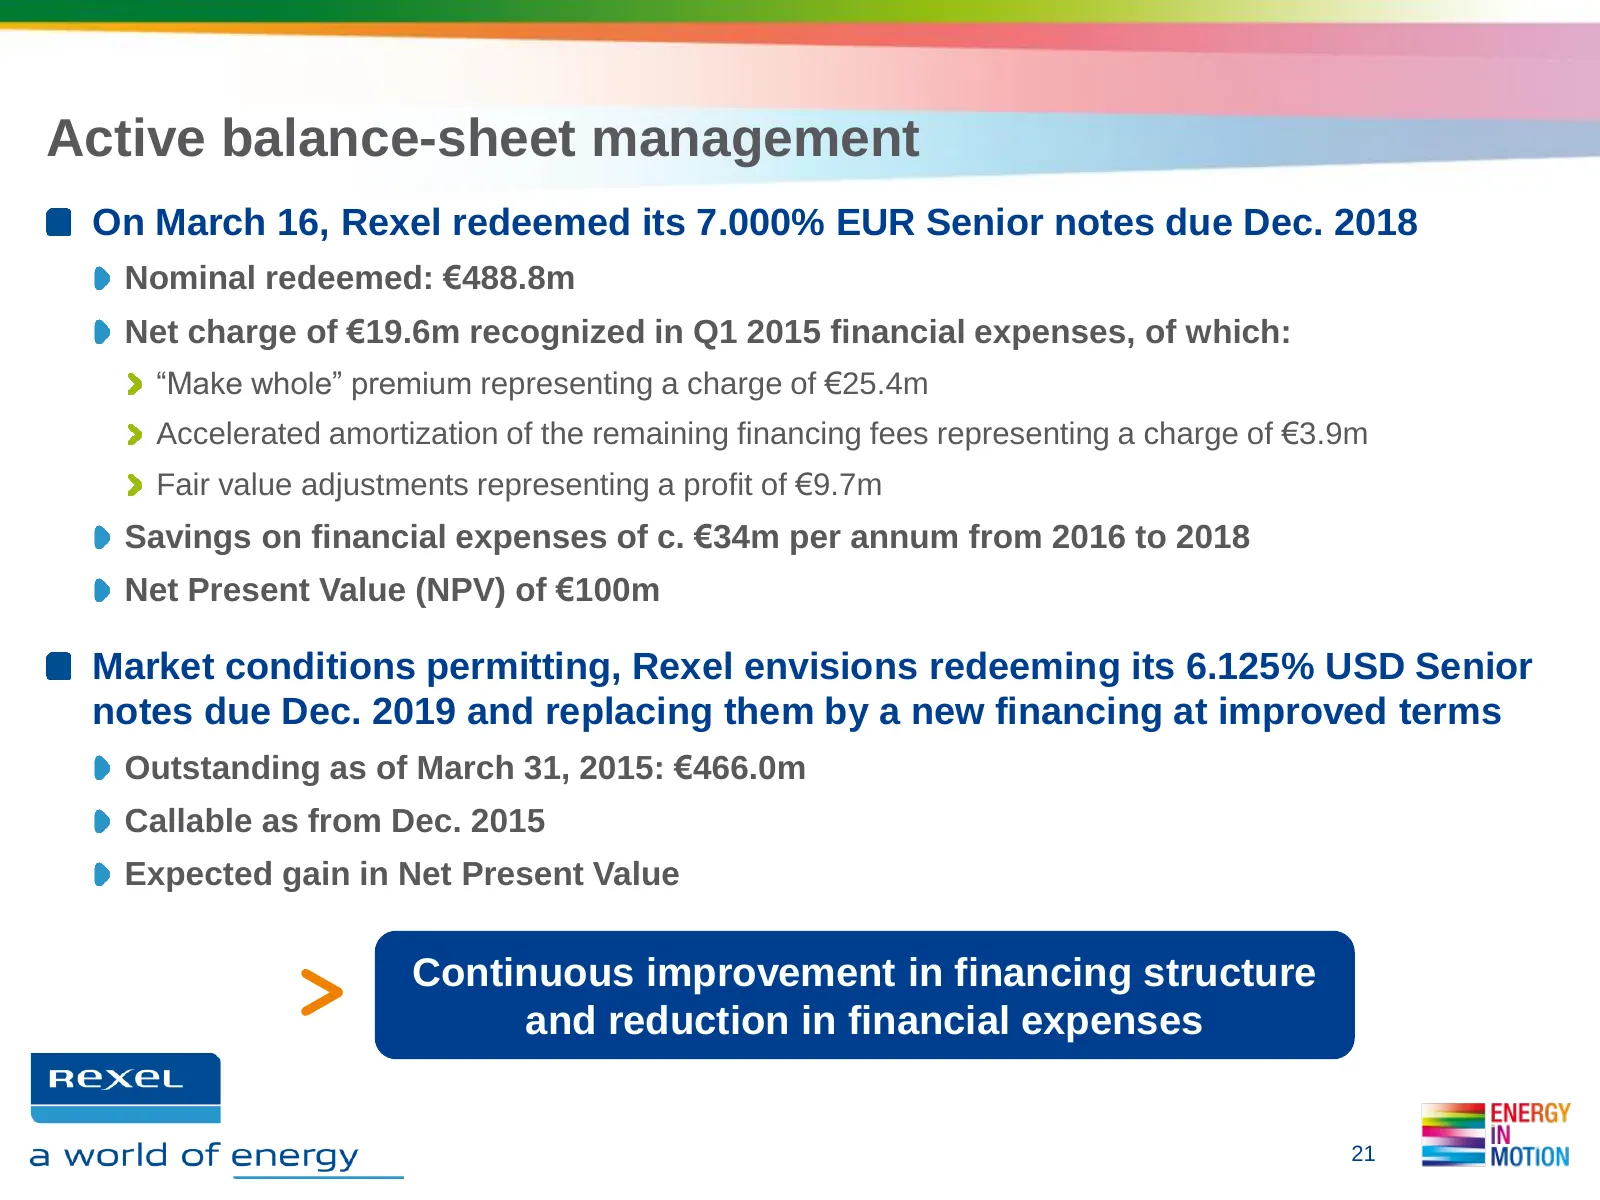
Active balance-sheet management On March 16, Rexel redeemed its 7.000% EUR Senior notes due Dec. 2018 Nominal redeemed: €488.8m Net charge of €19.6m recognized in Q1 2015 financial expenses, of which: “Make whole” premium representing a charge of €25.4m Accelerated amortization of the remaining fina
Slide 22: Divestment of Latin America
DIVESTMENT OF LATIN AMERICA Rexel bn a world of energy ENERG) IN MOTION
Slide 23: Divestment of operations in Latin America
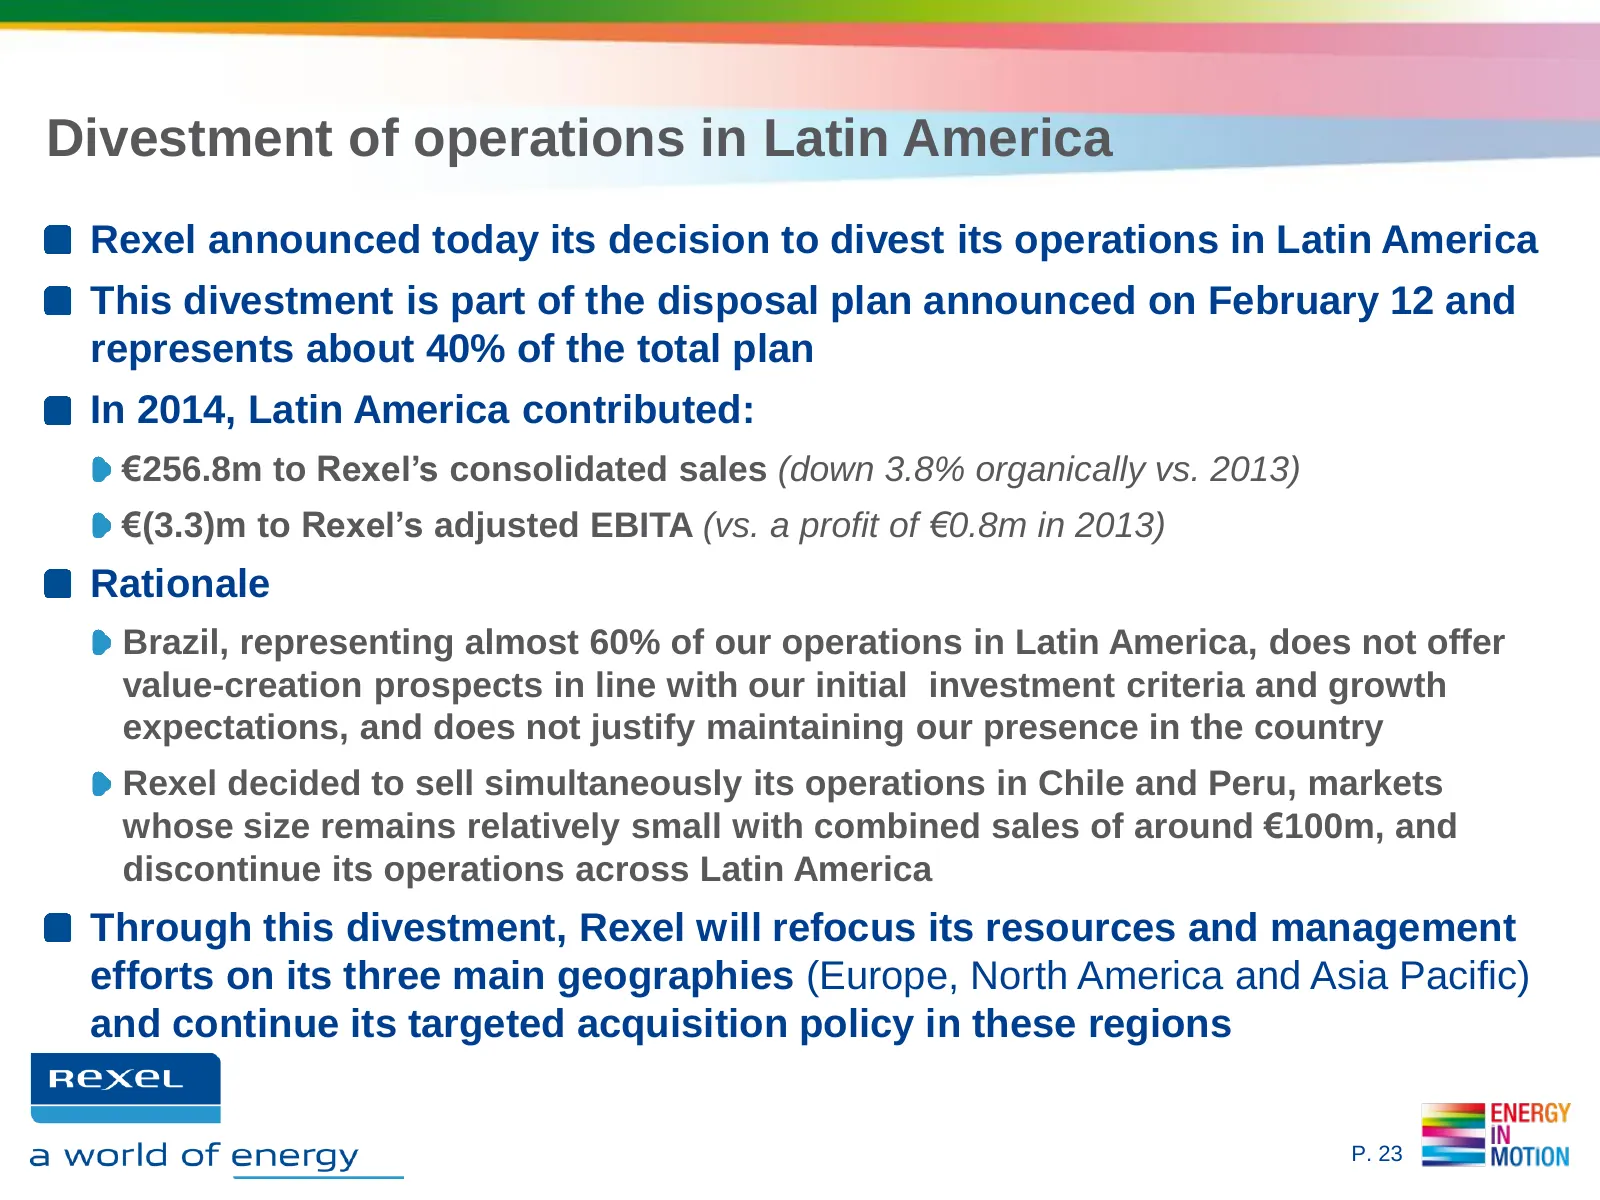
Divestment of operations in Latin America Rexel announced today its decision to divest its operations in Latin America This divestment is part of the disposal plan announced on February 12 and represents about 40% of the total plan In 2014, Latin America contributed: €256.8m to Rexel’s consolidated
Slide 24: Expected financial impacts
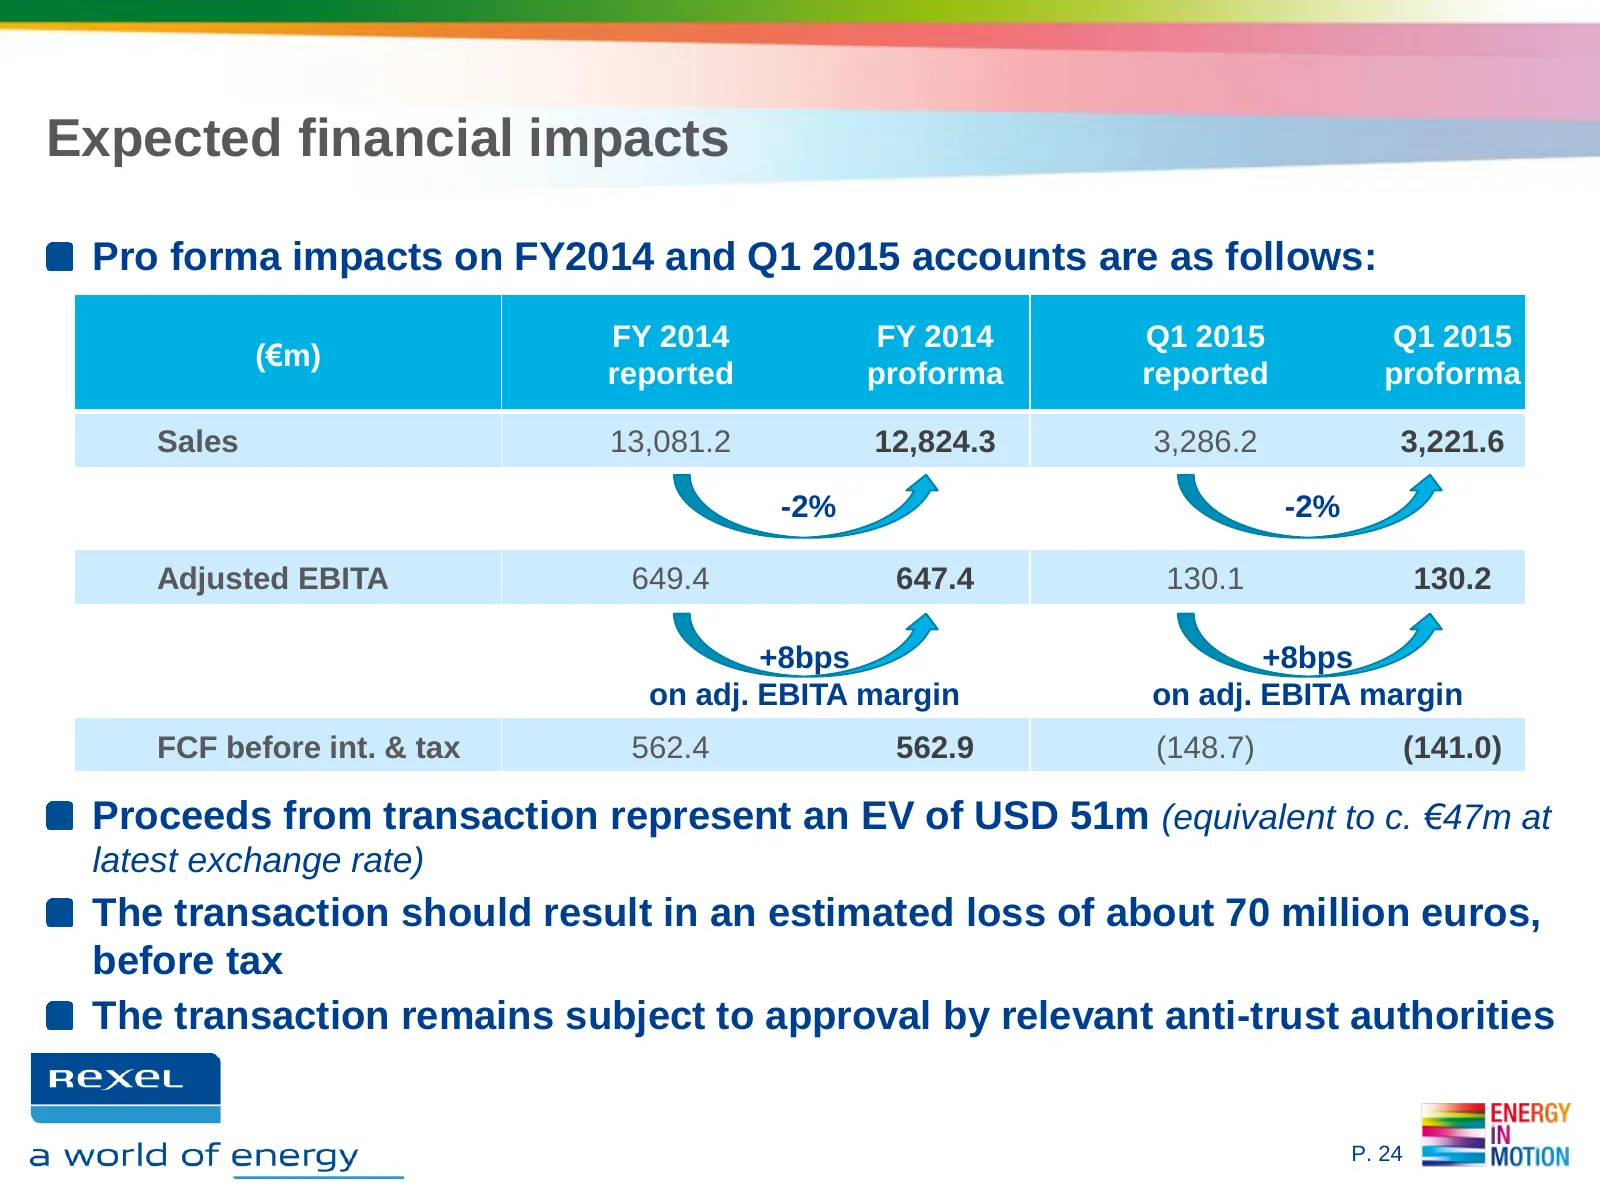
Expected financial impacts Pro forma impacts on FY2014 and Q1 2015 accounts are as follows: FY 2014 FY 2014 Q1 2015 Q1 2015 (€m) reported proforma reported proforma Sales 13,081.2 12,824.3 3,286.2 3,221.6 -2% -2% Adjusted EBITA 649.4 647.4 130.1 130.2 +8bps +8bps on adj. EBITA margin on adj. EBITA m
Slide 25: Outlook
OUTLOOK Rexel bn a world of energy ENERGY IN MOTION
Slide 26: Full-year 2015 financial targets confirmed
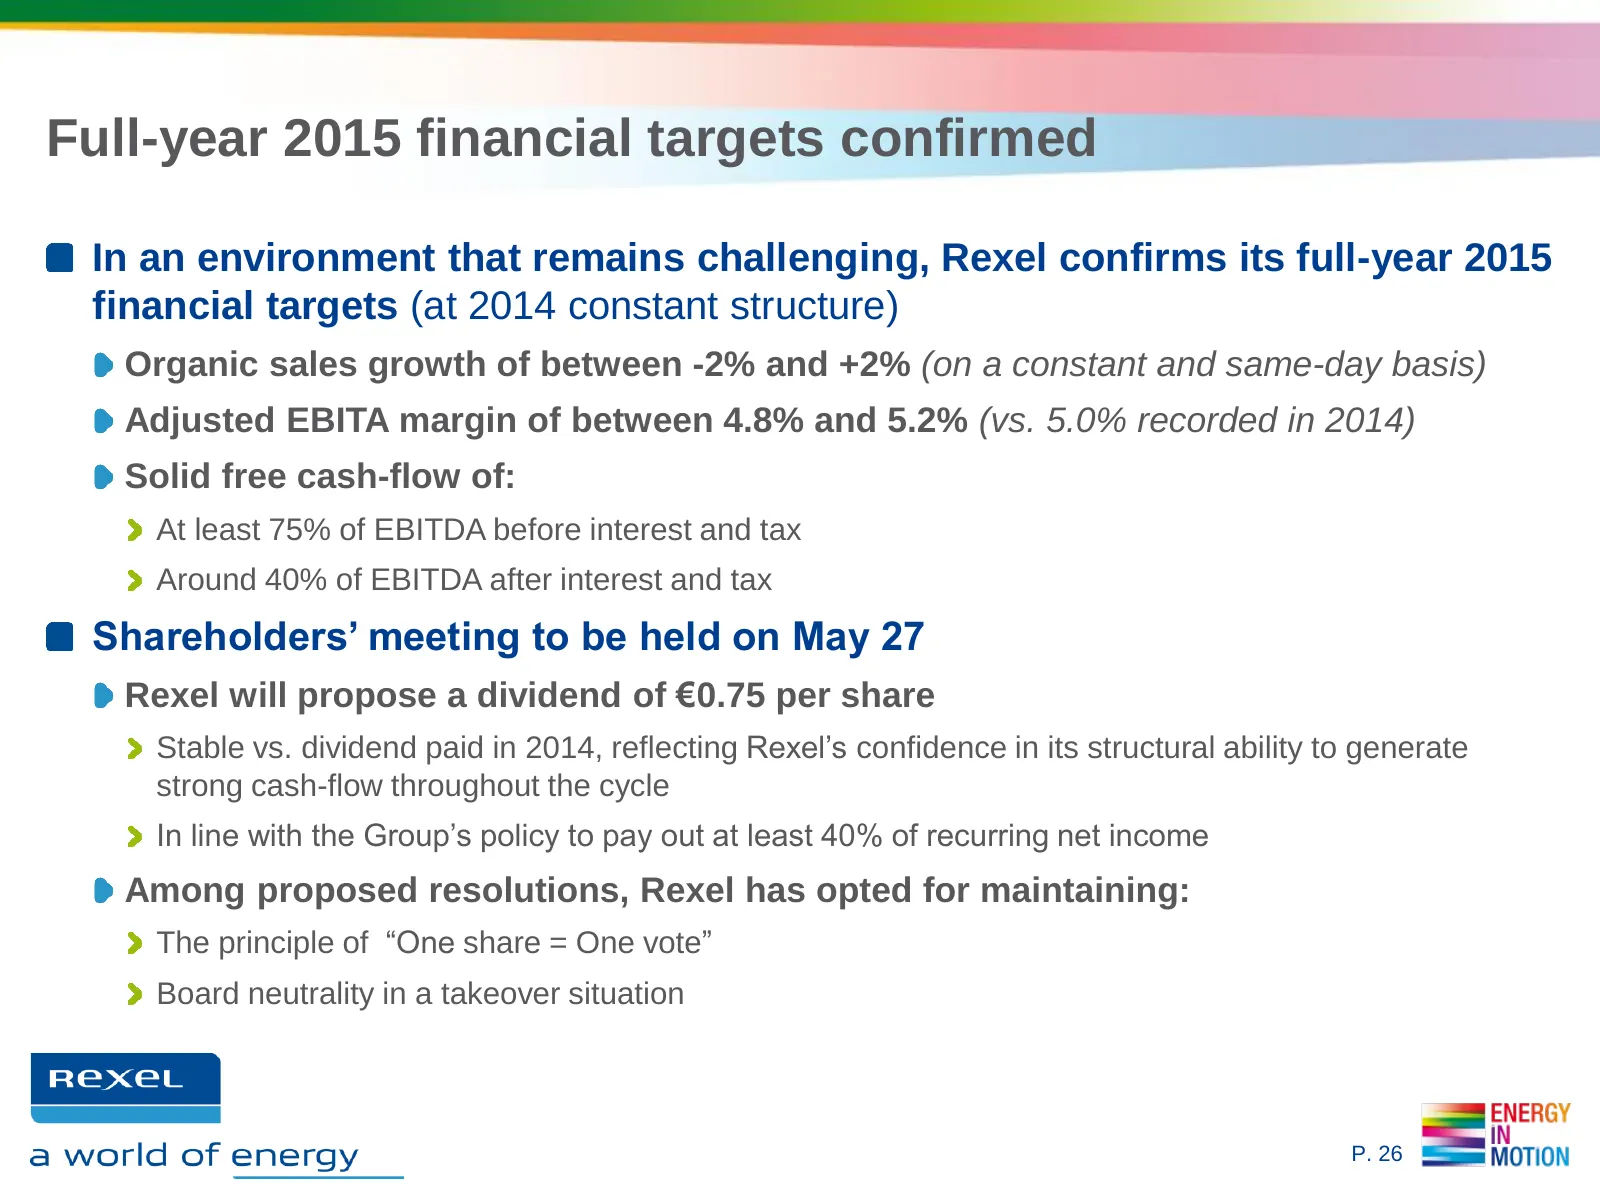
Full-year 2015 financial targets confirmed In an environment that remains challenging, Rexel confirms its full-year 2015 financial targets (at 2014 constant structure) Organic sales growth of between -2% and +2% (on a constant and same-day basis) Adjusted EBITA margin of between 4.8% and 5.2% (vs. 5
Slide 27: Appendices
APPENDICES Rexel bn a world of energy
Slide 28: Appendix 1: Segment reporting - Group
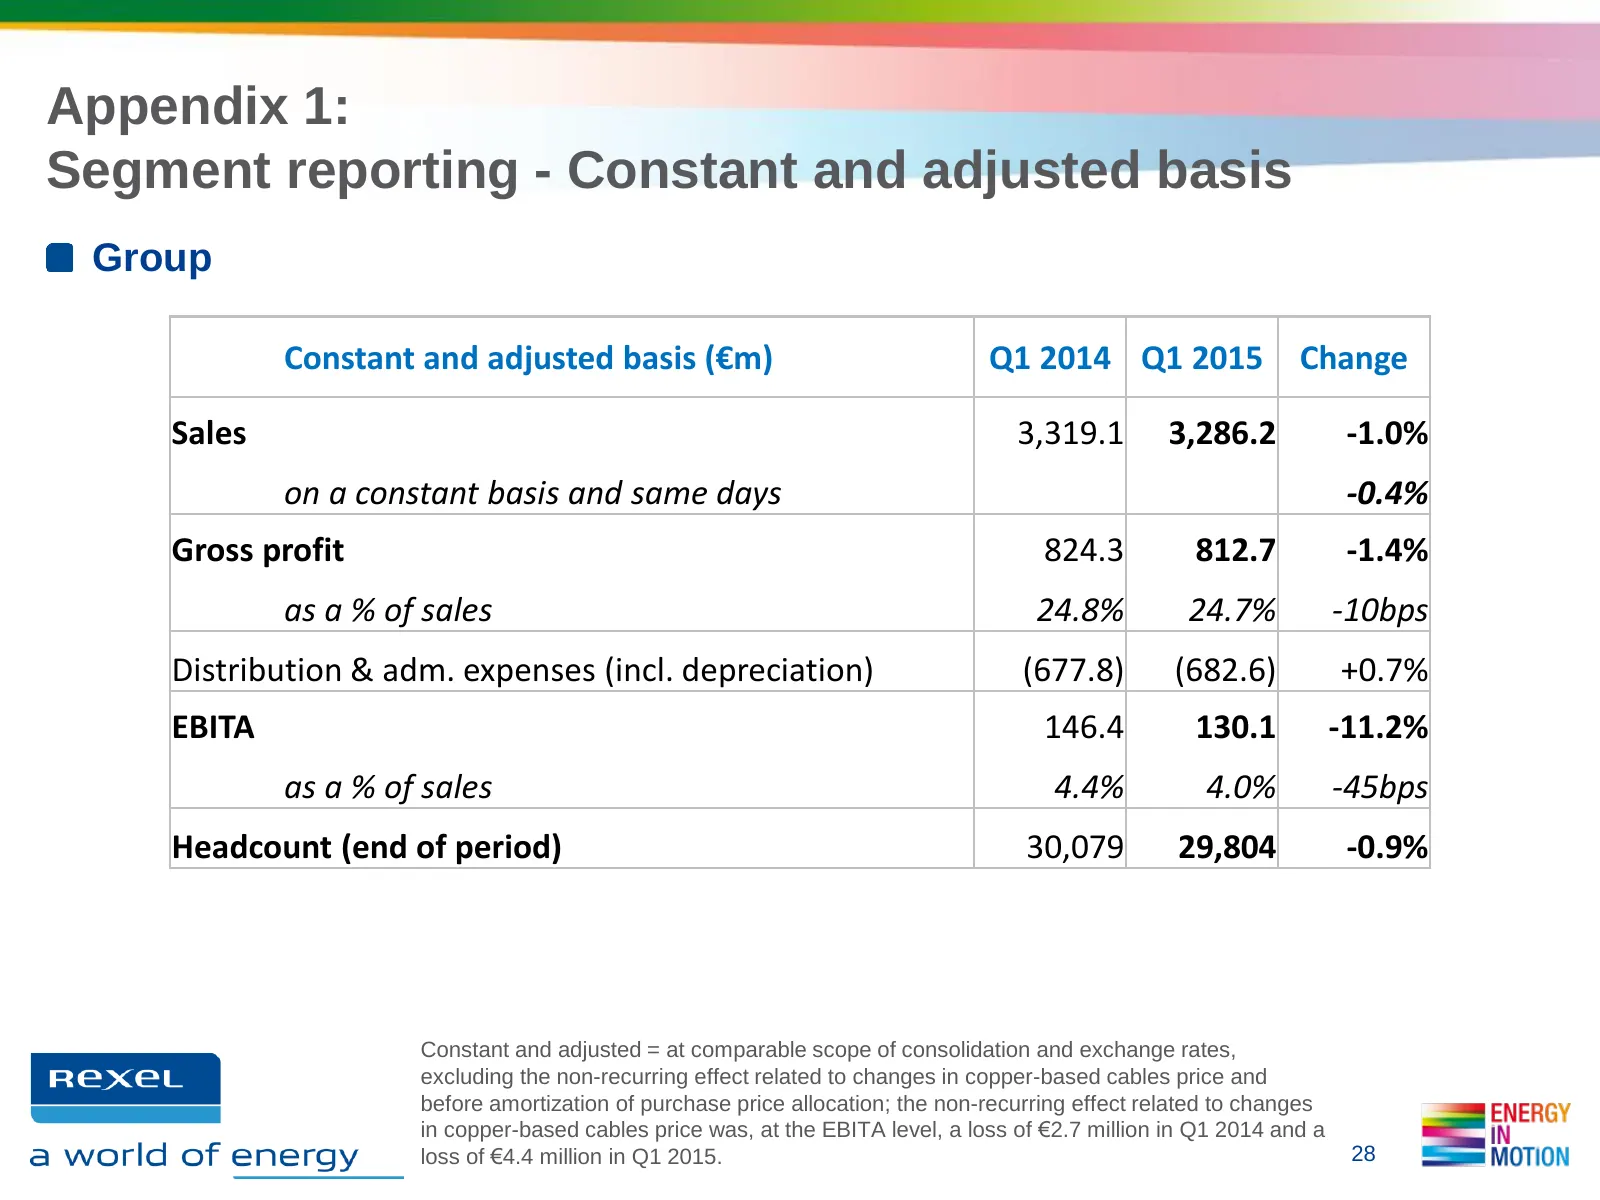
Appendix 1: Segment reporting - Constant and adjusted basis Group Constant and adjusted basis (€m) Q1 2014 Q1 2015 Change Sales 3,319.1 3,286.2 -1.0% on a constant basis and same days -0.4% Gross profit 824.3 812.7 -1.4% as a % of sales 24.8% 24.7% -10bps Distribution & adm. expenses (incl. deprecia
Slide 29: Appendix 1: Segment reporting - Europe
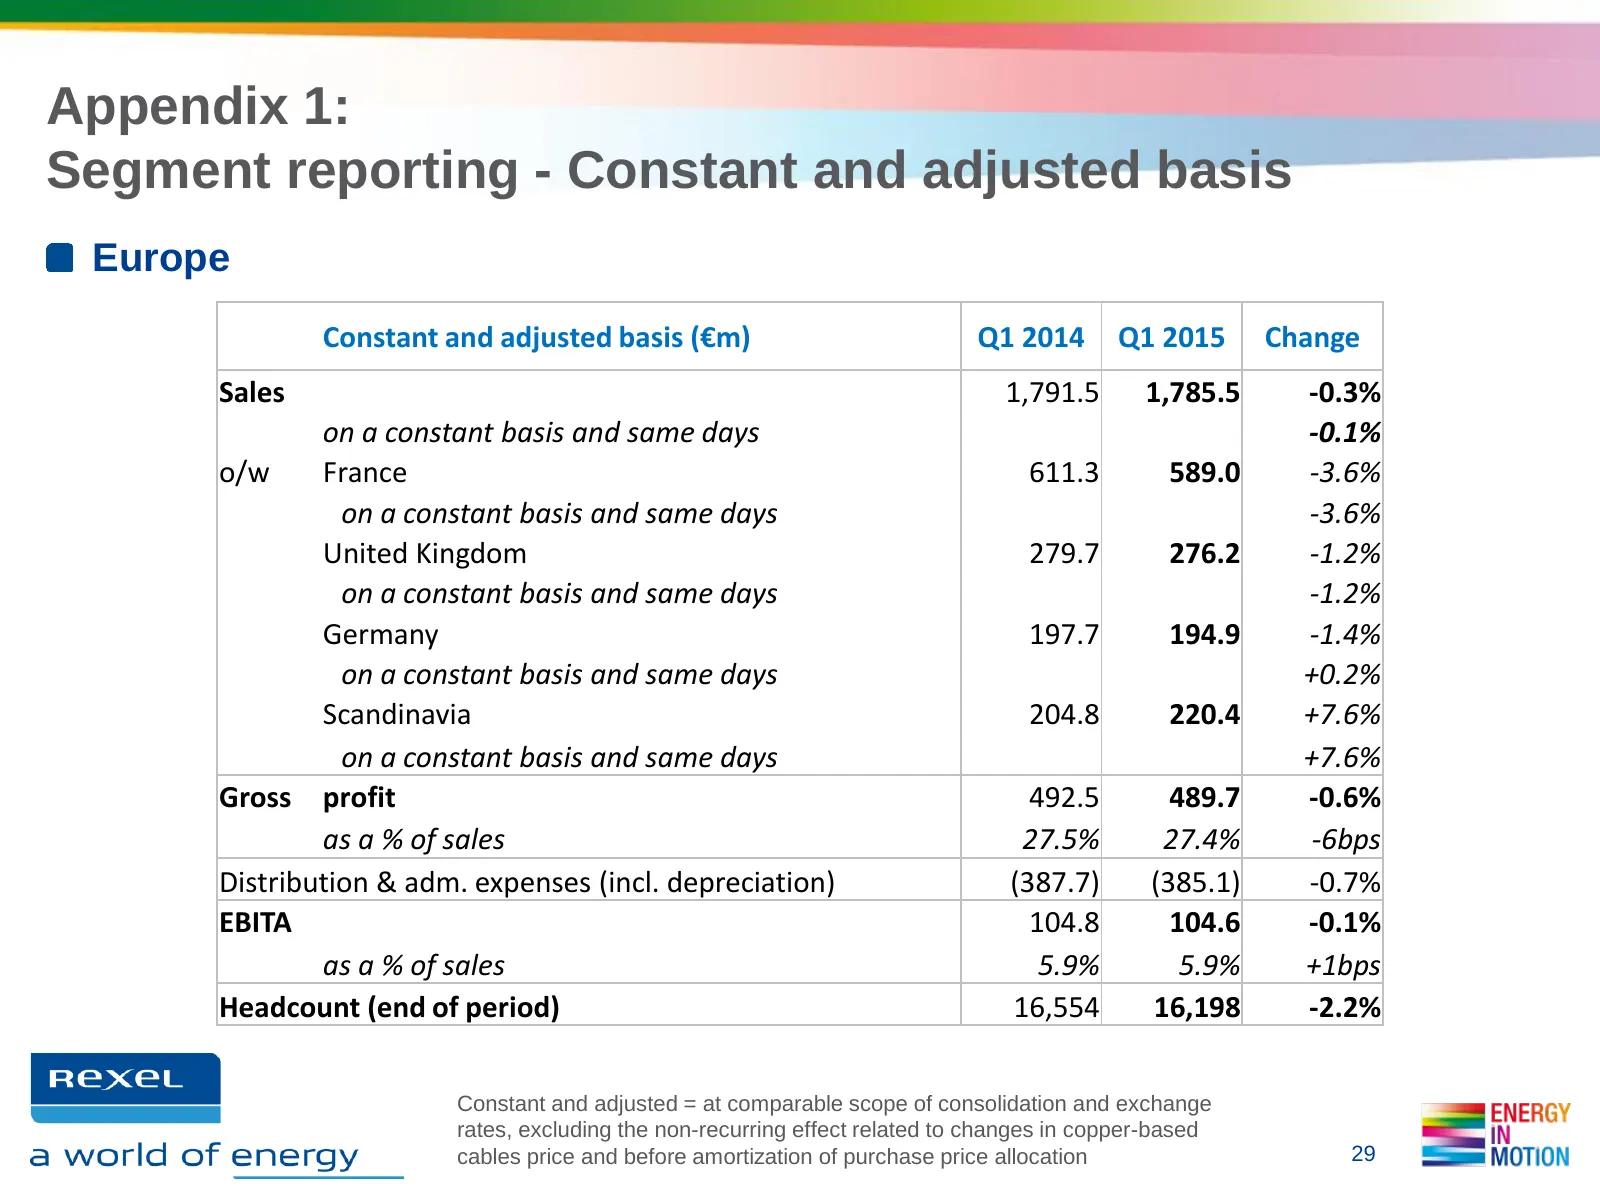
Appendix 1: Segment reporting - Constant and adjusted basis Europe Constant and adjusted basis (€m) Q1 2014 Q1 2015 Change Sales 1,791.5 1,785.5 -0.3% on a constant basis and same days -0.1% o/w France 611.3 589.0 -3.6% on a constant basis and same days -3.6% United Kingdom 279.7 276.2 -1.2% on a co
Slide 30: Appendix 1: Segment reporting - North America
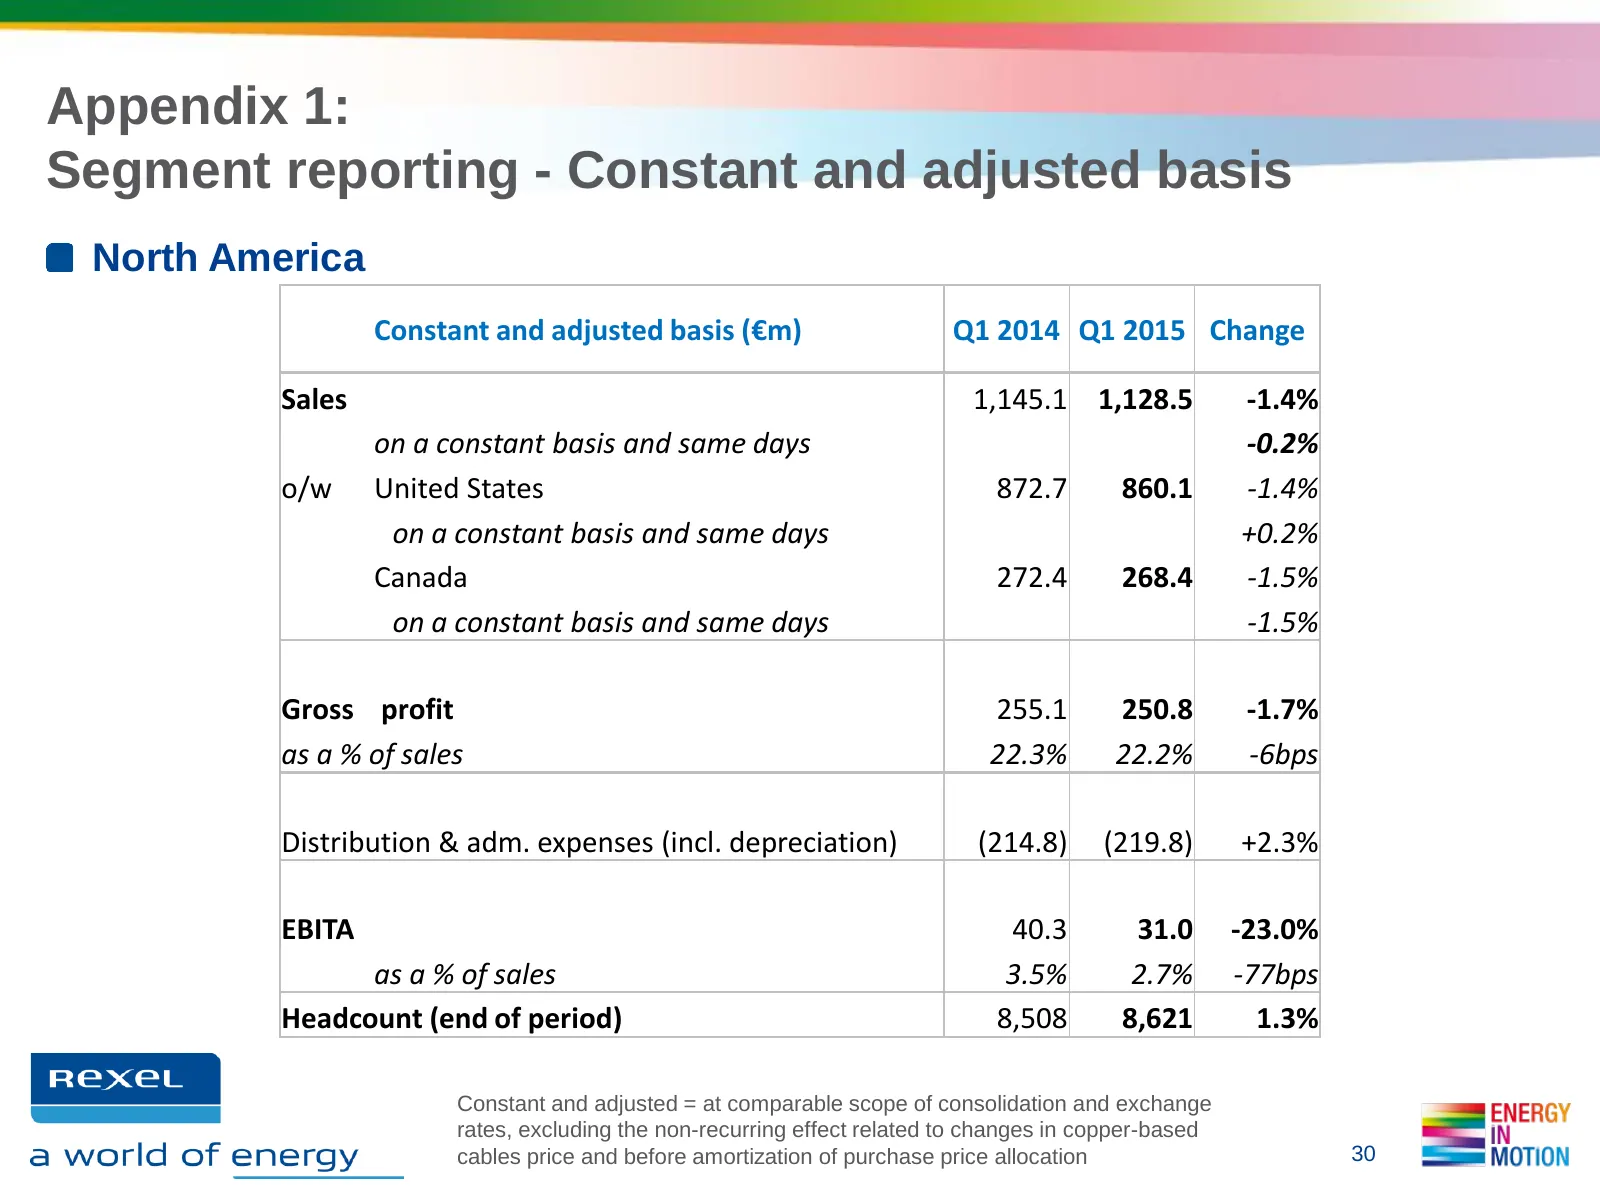
Appendix 1: Segment reporting - Constant and adjusted basis North America Constant and adjusted basis (€m) Q1 2014 Q1 2015 Change Sales 1,145.1 1,128.5 -1.4% on a constant basis and same days -0.2% o/w United States 872.7 860.1 -1.4% on a constant basis and same days +0.2% Canada 272.4 268.4 -1.5% o
Slide 31: Appendix 1: Segment reporting - Asia-Pacific
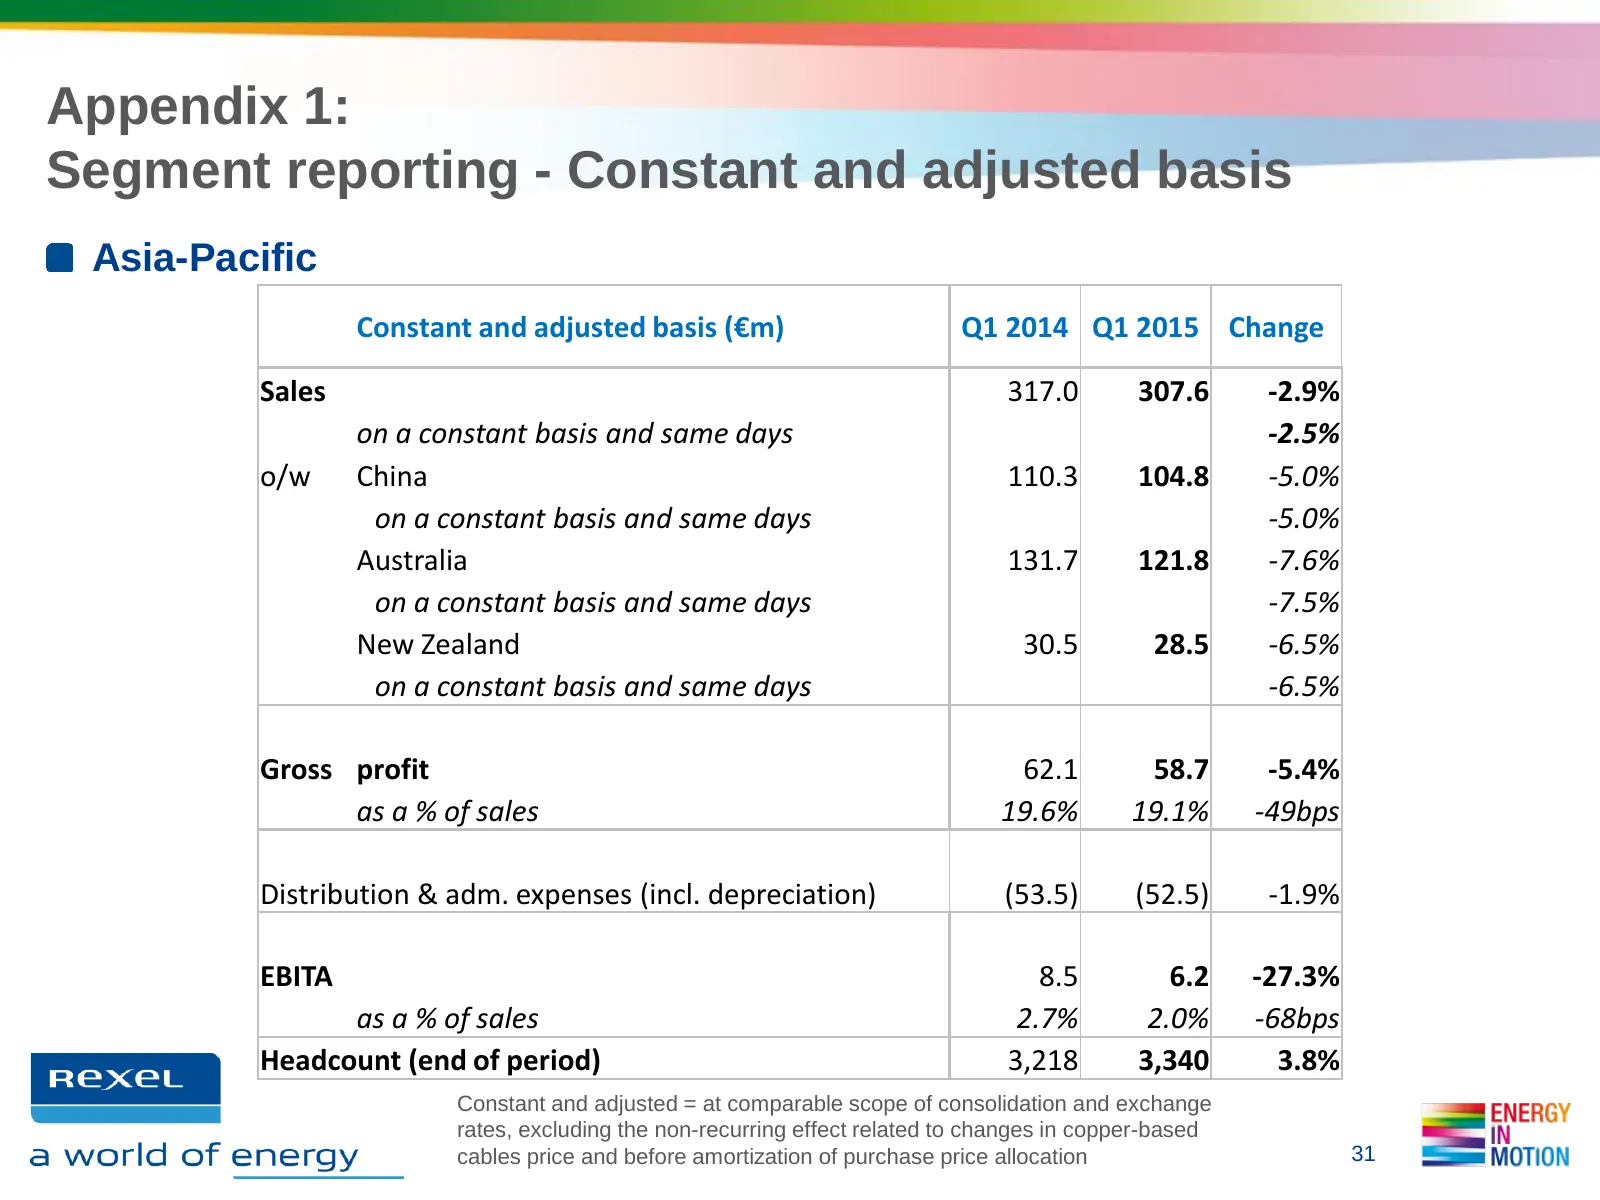
Appendix 1: Segment reporting - Constant and adjusted basis Asia-Pacific Constant and adjusted basis (€m) Q1 2014 Q1 2015 Change Sales 317.0 307.6 -2.9% on a constant basis and same days -2.5% o/w China 110.3 104.8 -5.0% on a constant basis and same days -5.0% Australia 131.7 121.8 -7.6% on a consta
Slide 32: Appendix 1: Segment reporting - Latin America
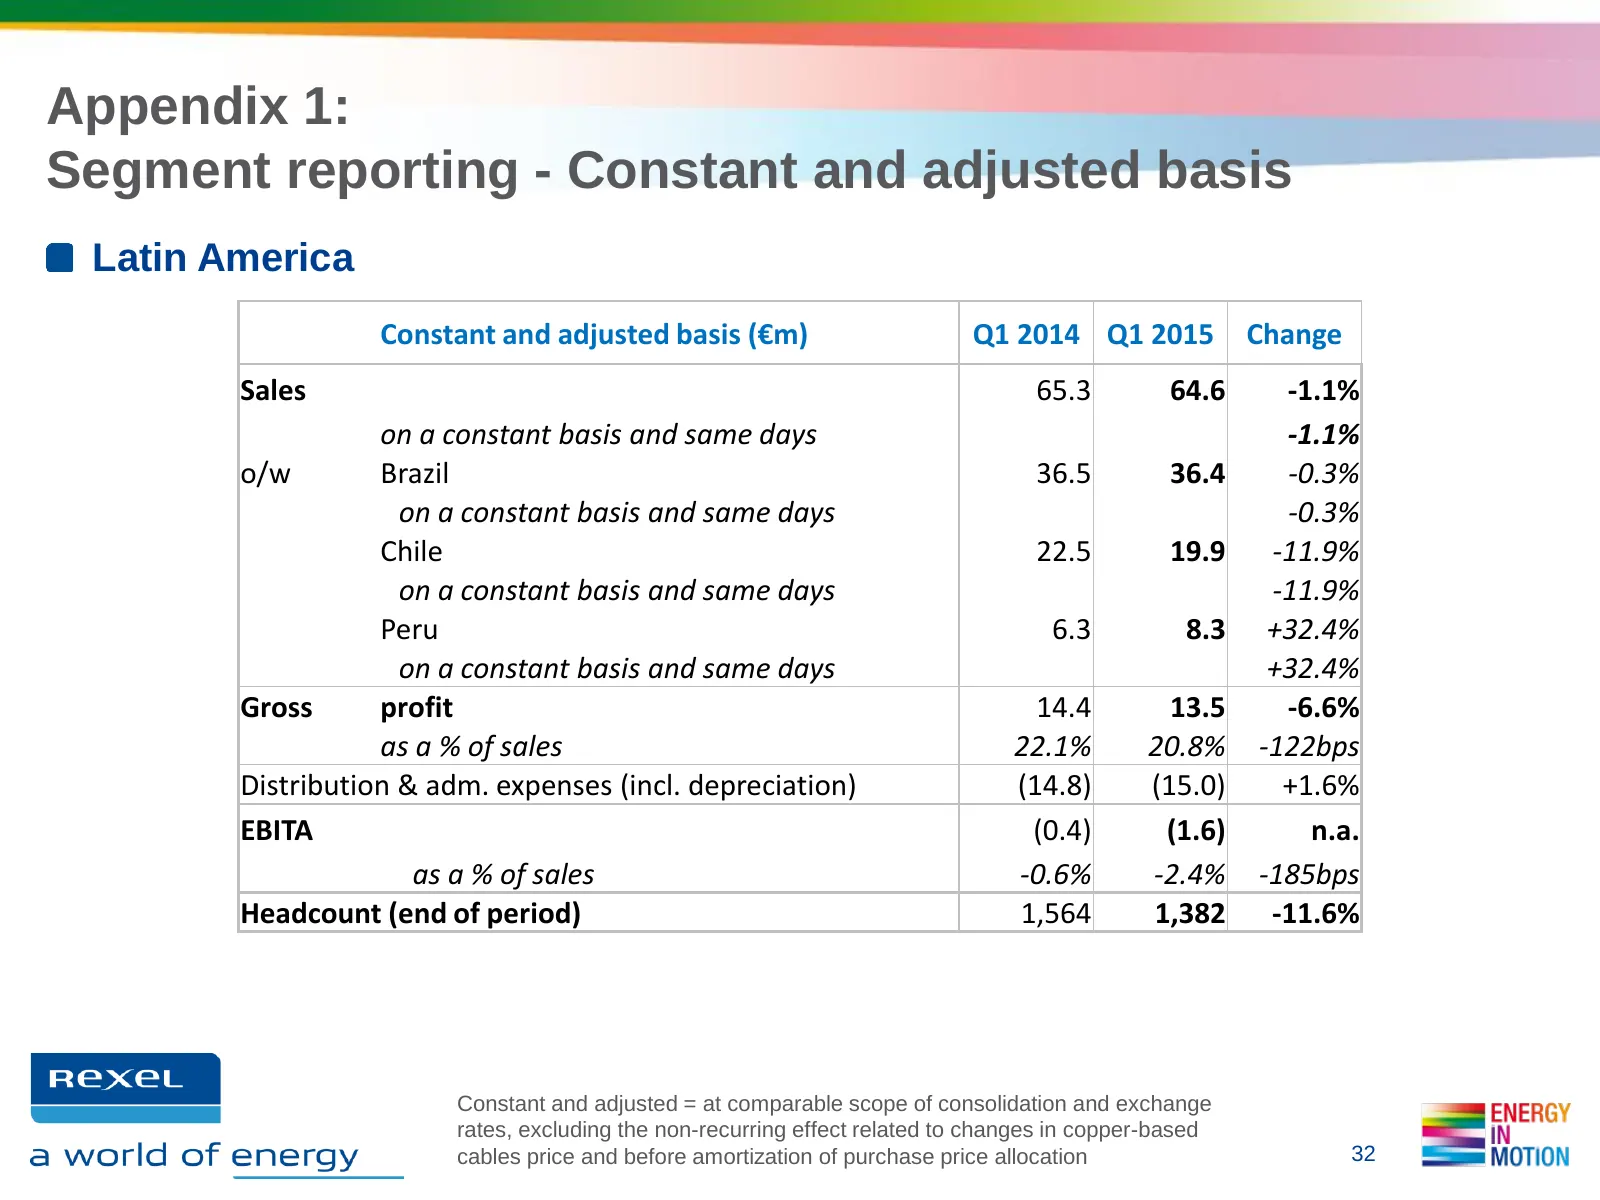
Appendix 1: Segment reporting - Constant and adjusted basis Latin America Constant and adjusted basis (€m) Q1 2014 Q1 2015 Change Sales 65.3 64.6 -1.1% on a constant basis and same days -1.1% o/w Brazil 36.5 36.4 -0.3% on a constant basis and same days -0.3% Chile 22.5 19.9 -11.9% on a constant basi
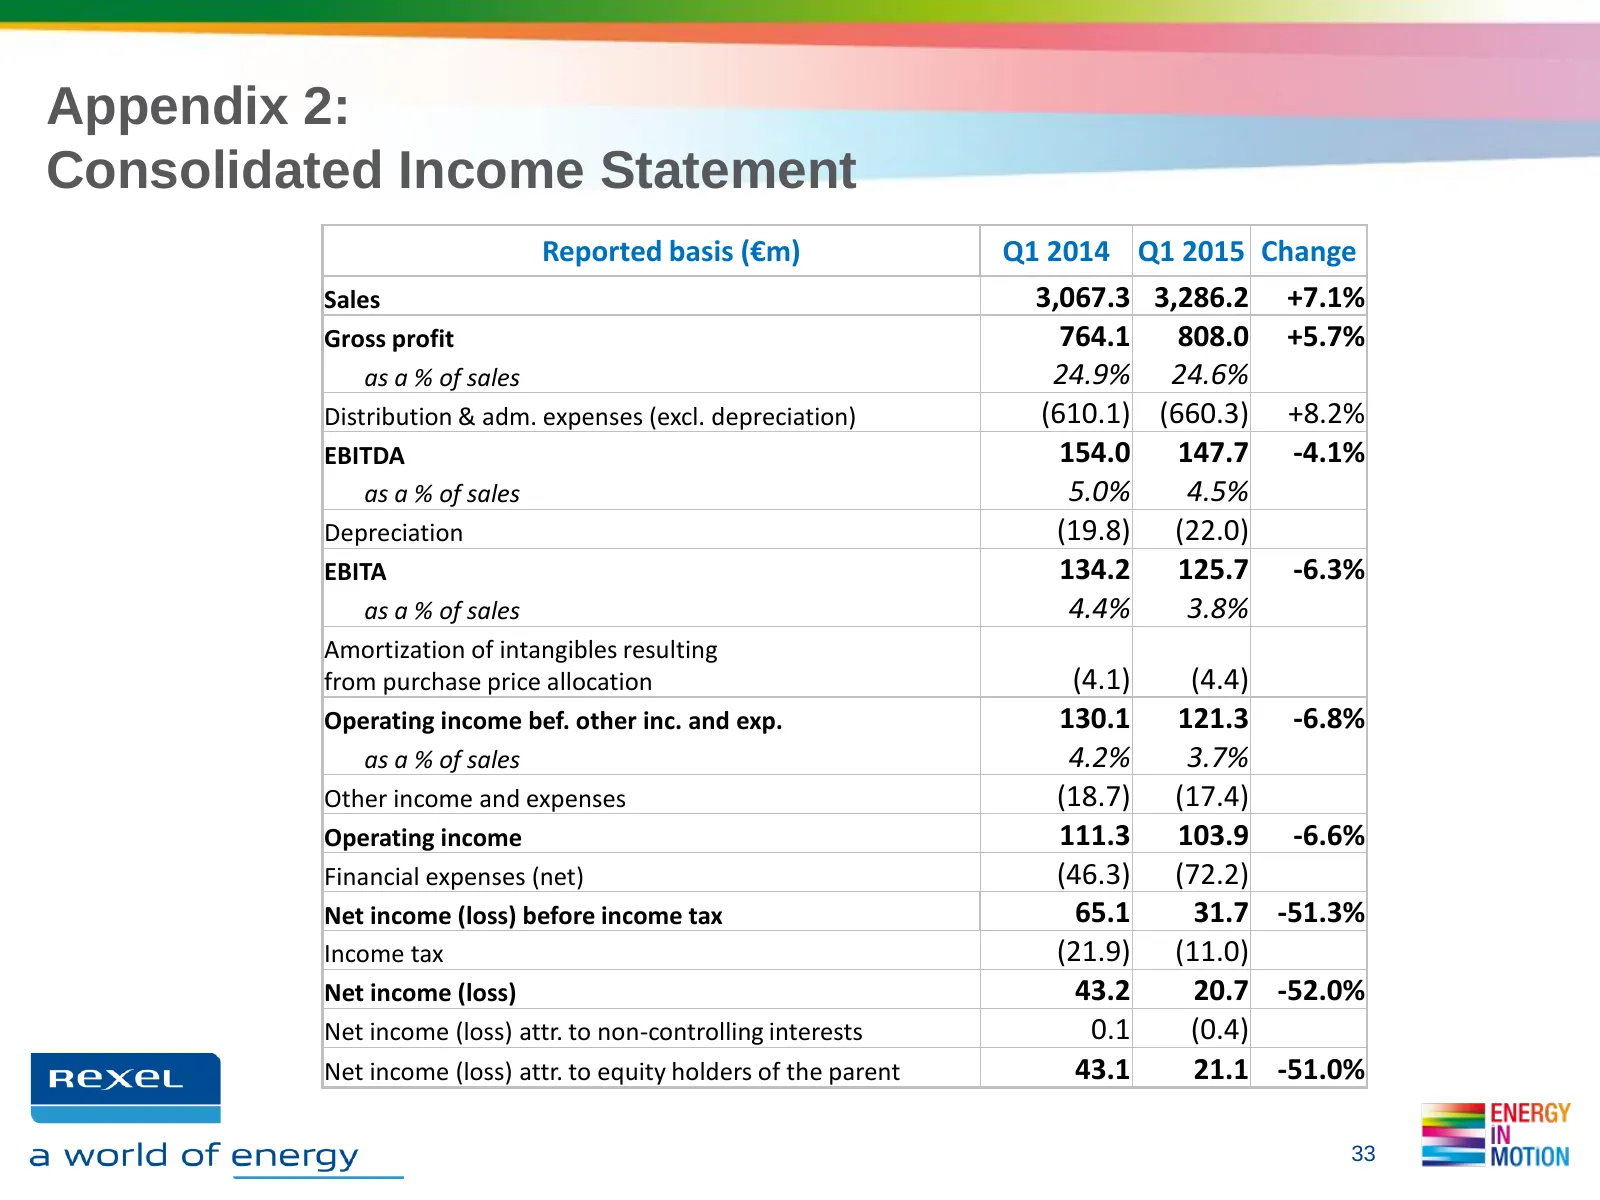
Slide 33: Appendix 2: Consolidated Income Statement
Appendix 2: Consolidated Income Statement Reported basis (€m) Q1 2014 Q1 2015 Change Sales 3,067.3 3,286.2 +7.1% Gross profit 764.1 808.0 +5.7% as a % of sales 24.9% 24.6% Distribution & adm. expenses (excl. depreciation) (610.1) (660.3) +8.2% EBITDA 154.0 147.7 -4.1% as a % of sales 5.0% 4.5% Depre
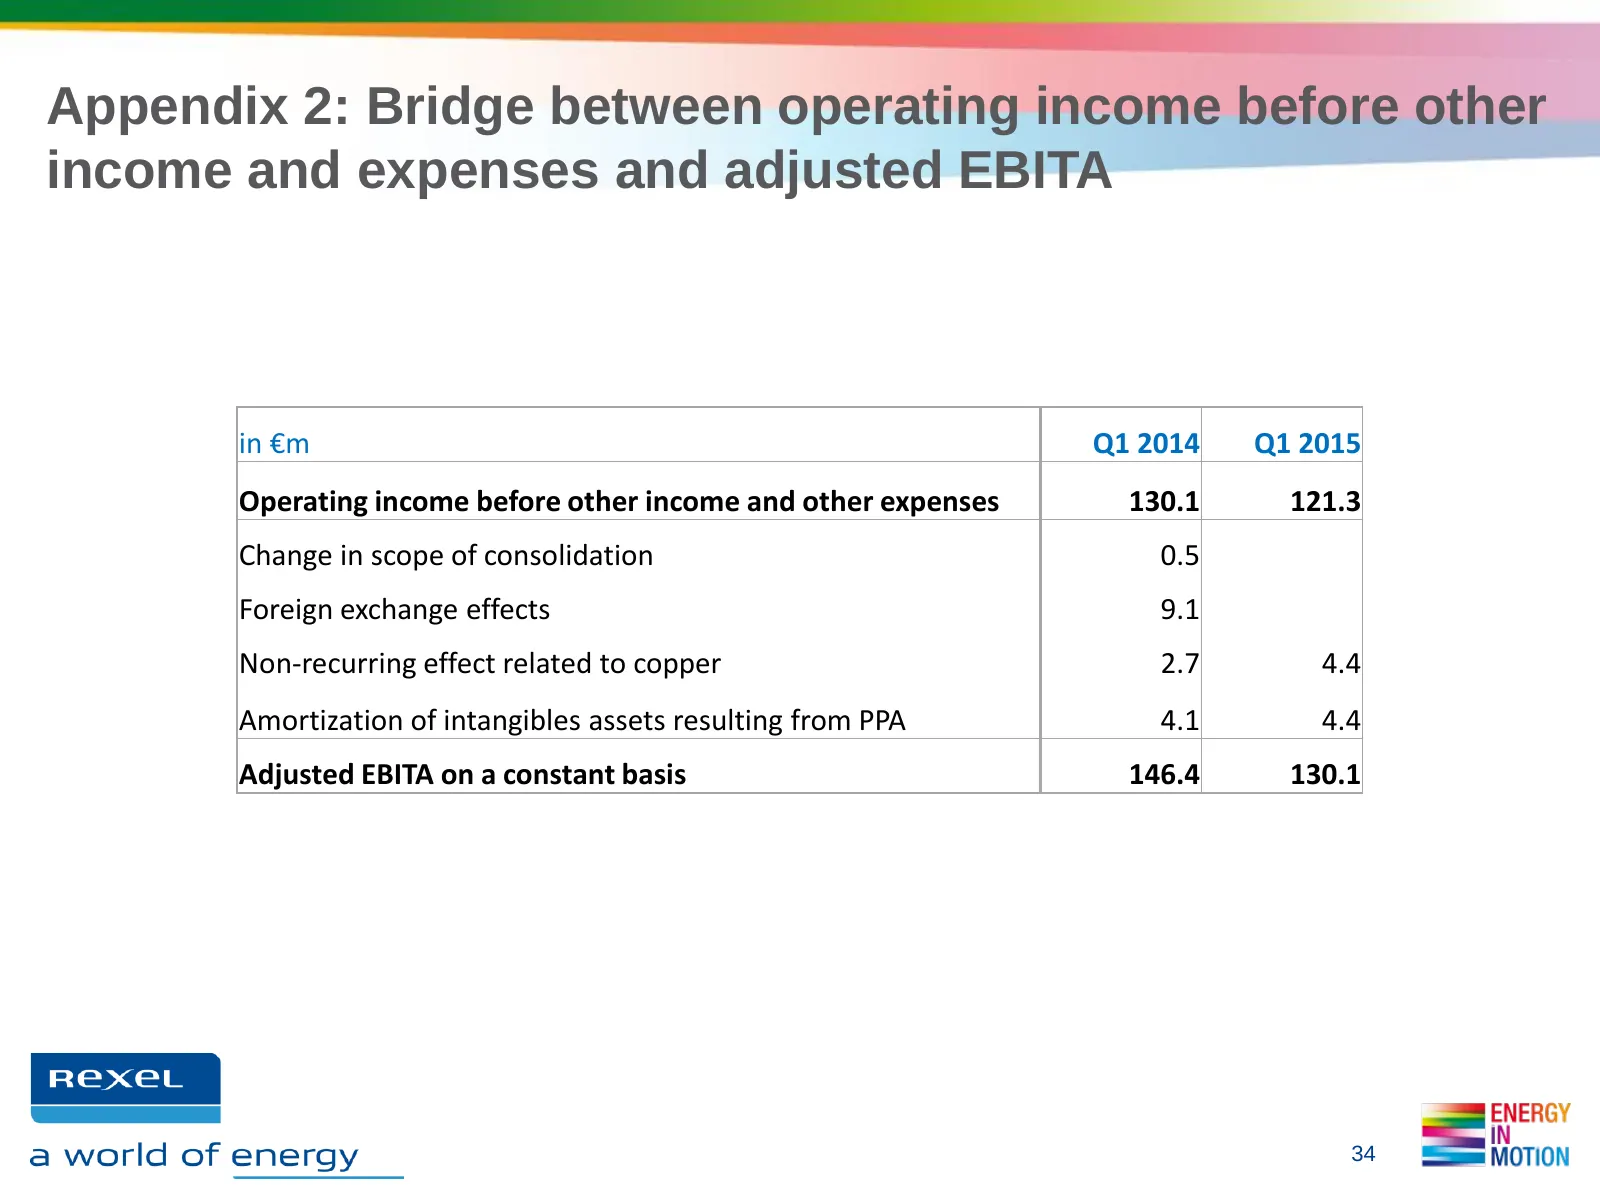
Slide 34: Appendix 2: Bridge to adjusted EBITA
Appendix 2: Bridge between operating income before other income and expenses and adjusted EBITA in €m Q1 2014 Q1 2015 Operating income before other income and other expenses 130.1 121.3 Change in scope of consolidation 0.5 Foreign exchange effects 9.1 Non-recurring effect related to copper 2.7 4.4 A
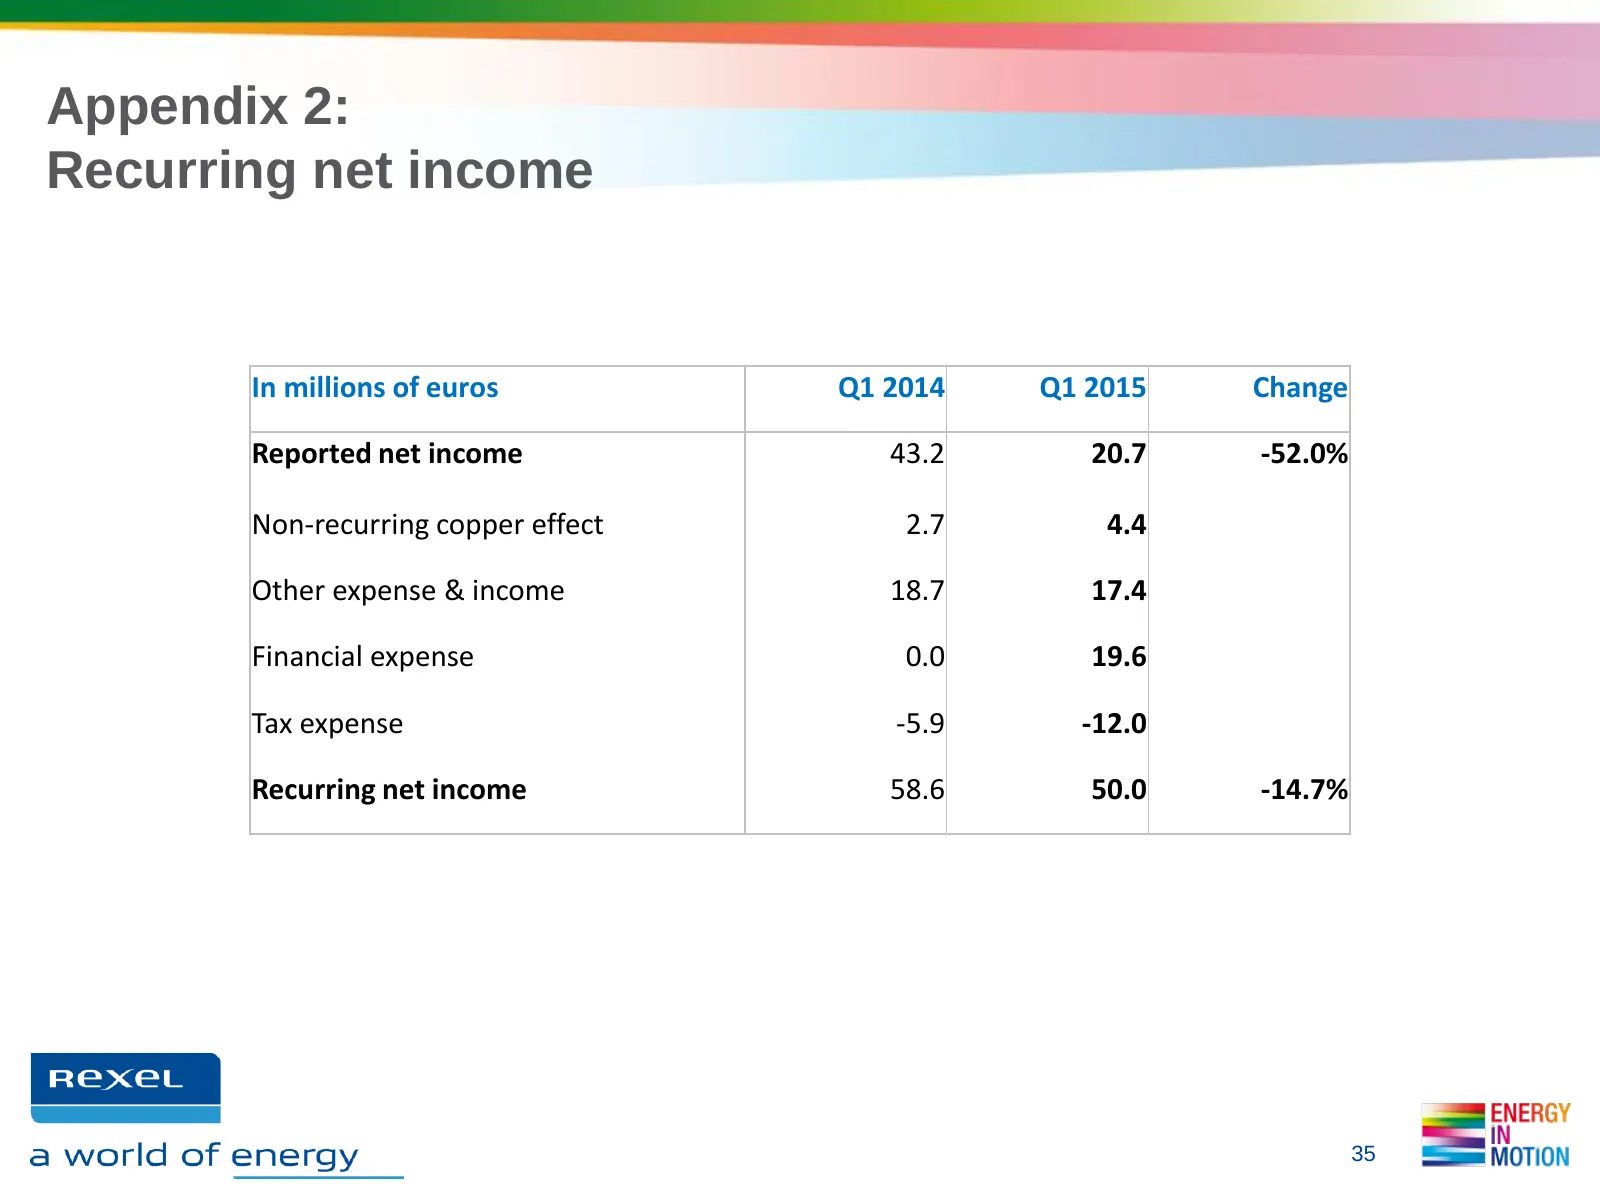
Slide 35: Appendix 2: Recurring net income
Appendix 2: Recurring net income In millions of euros Q1 2014 Q1 2015 Change Reported net income 43.2 20.7 -52.0% Non-recurring copper effect 2.7 4.4 Other expense & income 18.7 17.4 Financial expense 0.0 19.6 Tax expense -5.9 -12.0 Recurring net income 58.6 50.0 -14.7% 35
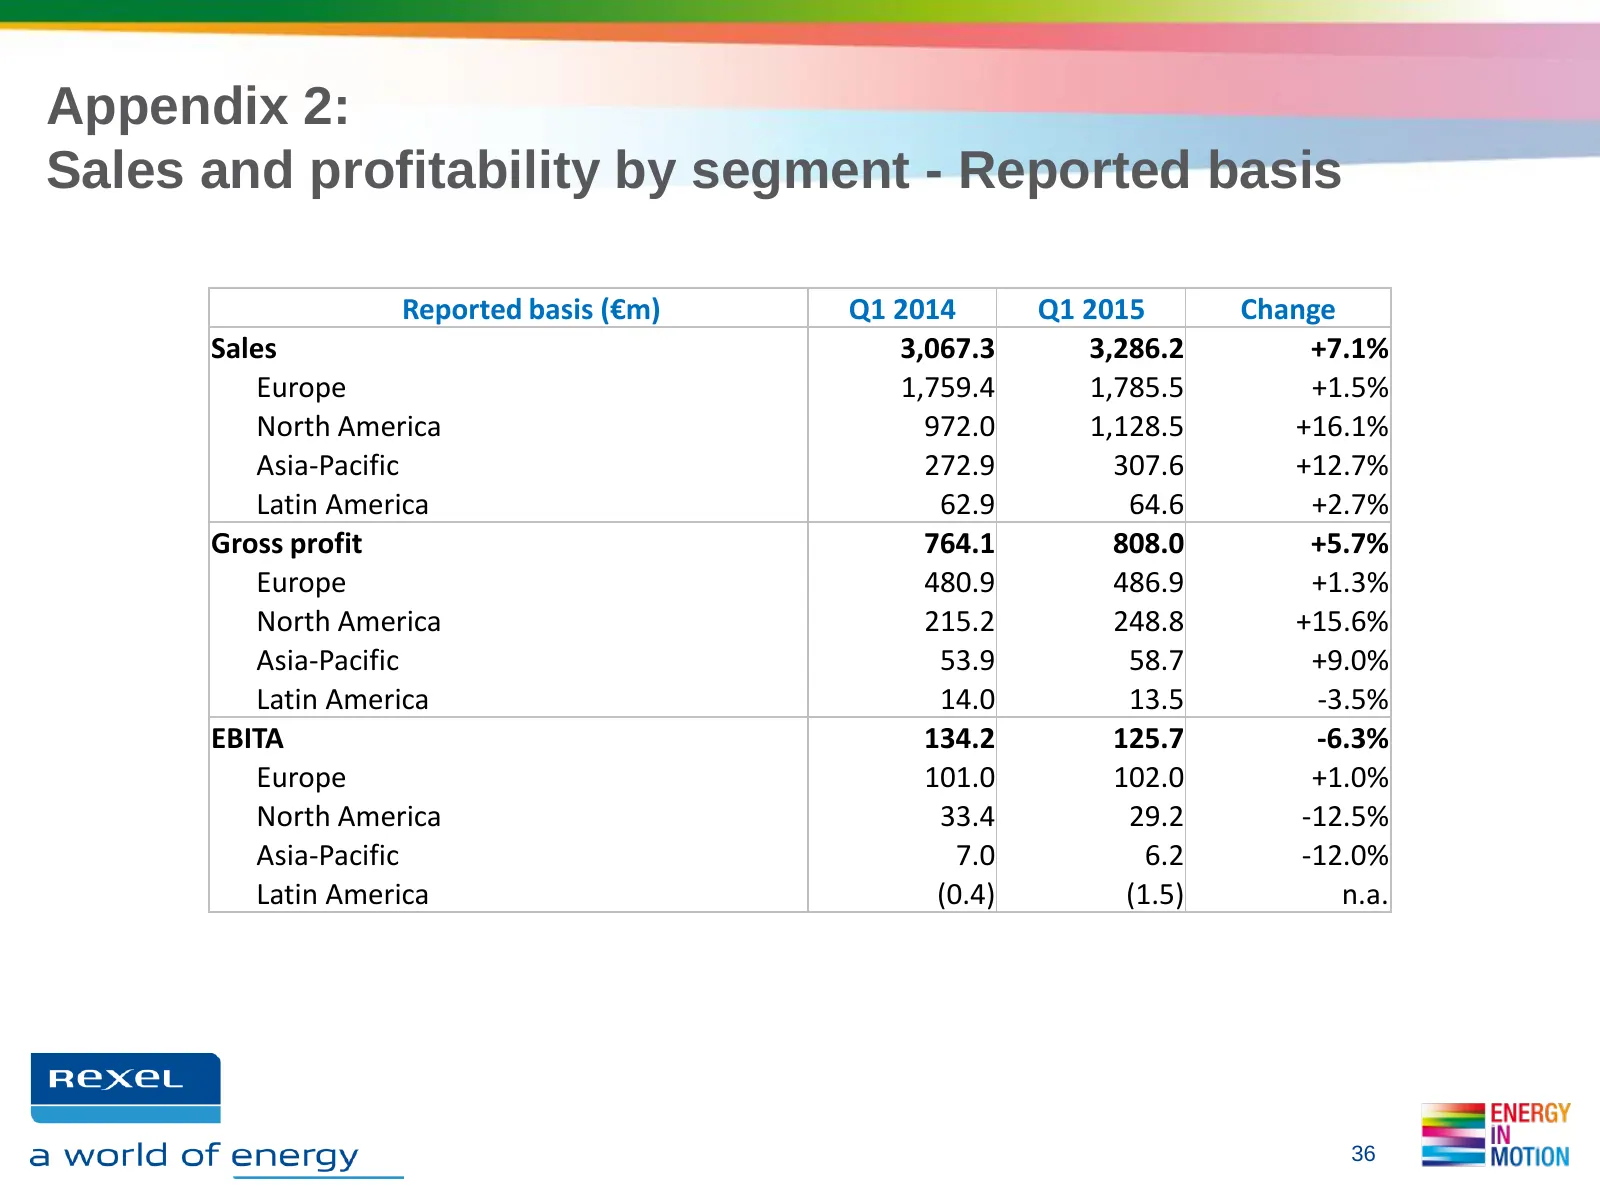
Slide 36: Appendix 2: Sales and profitability by segment - Reported basis
Appendix 2: Sales and profitability by segment - Reported basis Reported basis (€m) Q1 2014 Q1 2015 Change Sales 3,067.3 3,286.2 +7.1% Europe 1,759.4 1,785.5 +1.5% North America 972.0 1,128.5 +16.1% Asia-Pacific 272.9 307.6 +12.7% Latin America 62.9 64.6 +2.7% Gross profit 764.1 808.0 +5.7% Europe 4
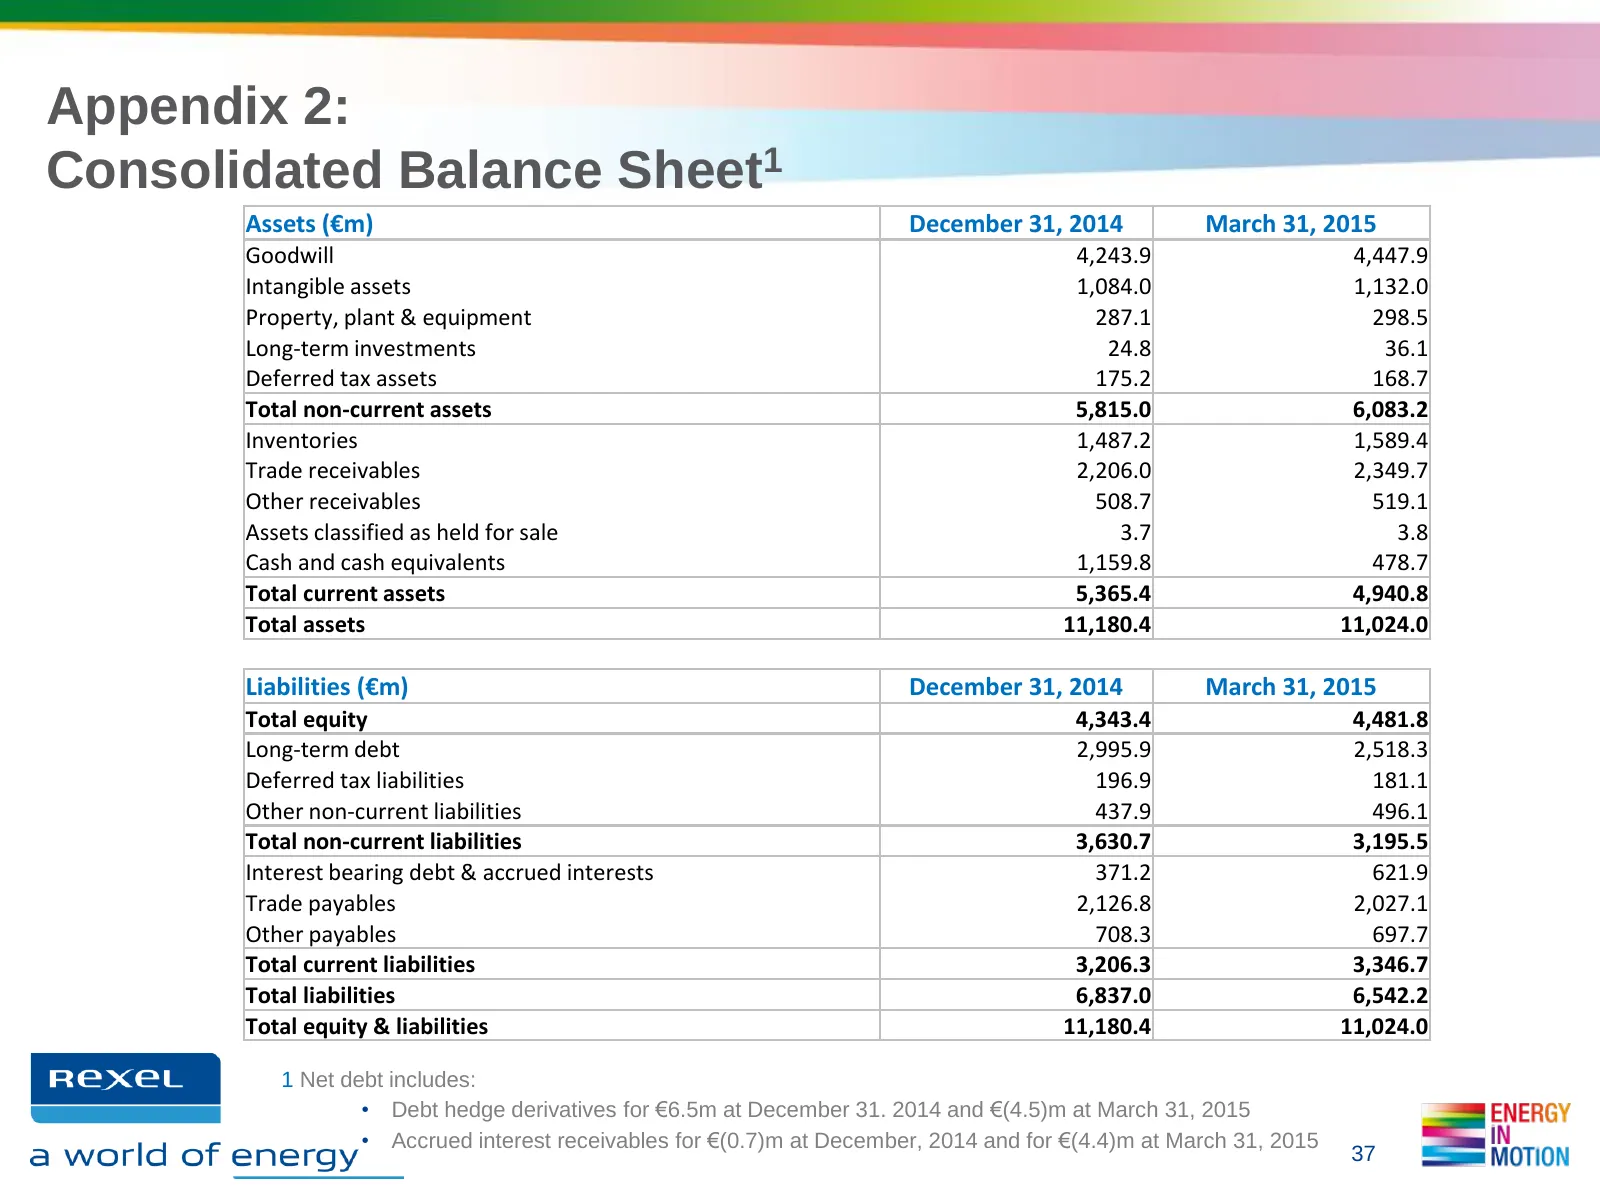
Slide 37: Appendix 2: Consolidated Balance Sheet
Appendix 2: Consolidated Balance Sheet1 Assets (€m) December 31, 2014 March 31, 2015 Goodwill 4,243.9 4,447.9 Intangible assets 1,084.0 1,132.0 Property, plant & equipment 287.1 298.5 Long-term investments 24.8 36.1 Deferred tax assets 175.2 168.7 Total non-current assets 5,815.0 6,083.2 Inventories
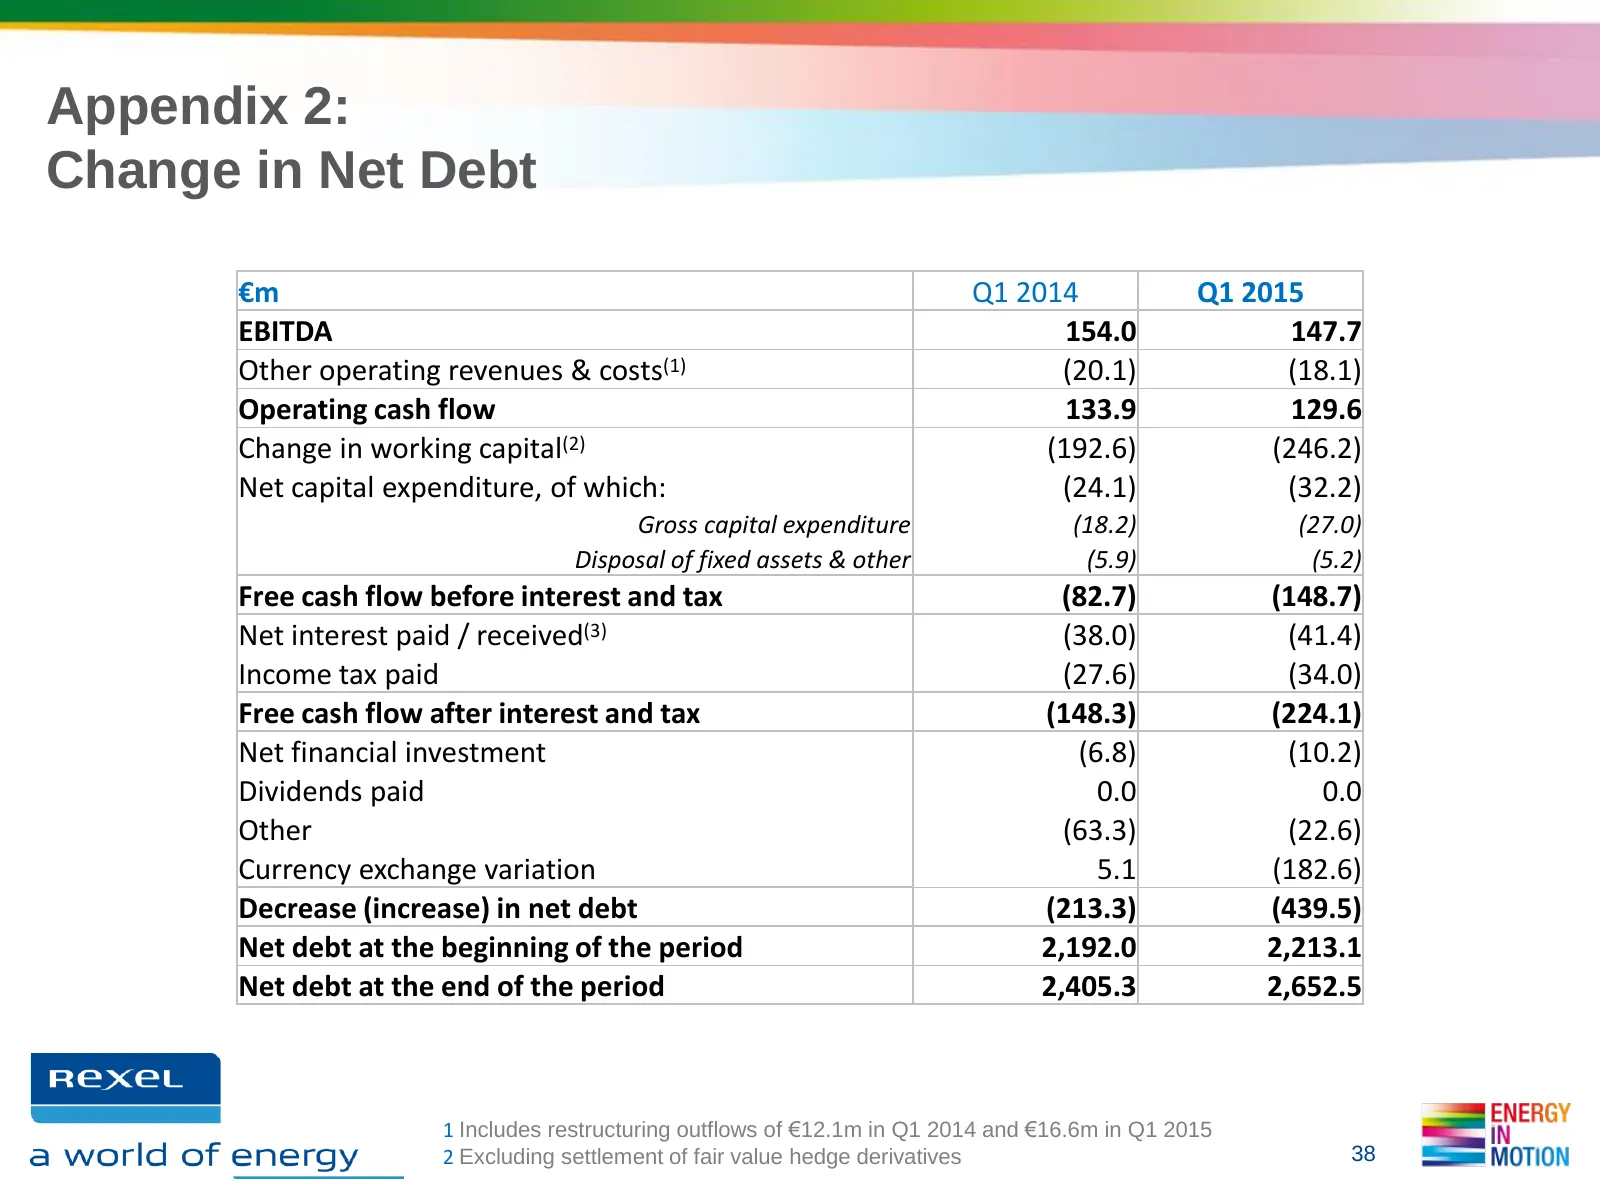
Slide 38: Appendix 2: Change in Net Debt
Appendix 2: Change in Net Debt €m Q1 2014 Q1 2015 EBITDA 154.0 147.7 Other operating revenues & costs(1) (20.1) (18.1) Operating cash flow 133.9 129.6 Change in working capital(2) (192.6) (246.2) Net capital expenditure, of which: (24.1) (32.2) Gross capital expenditure (18.2) (27.0) Disposal of fix
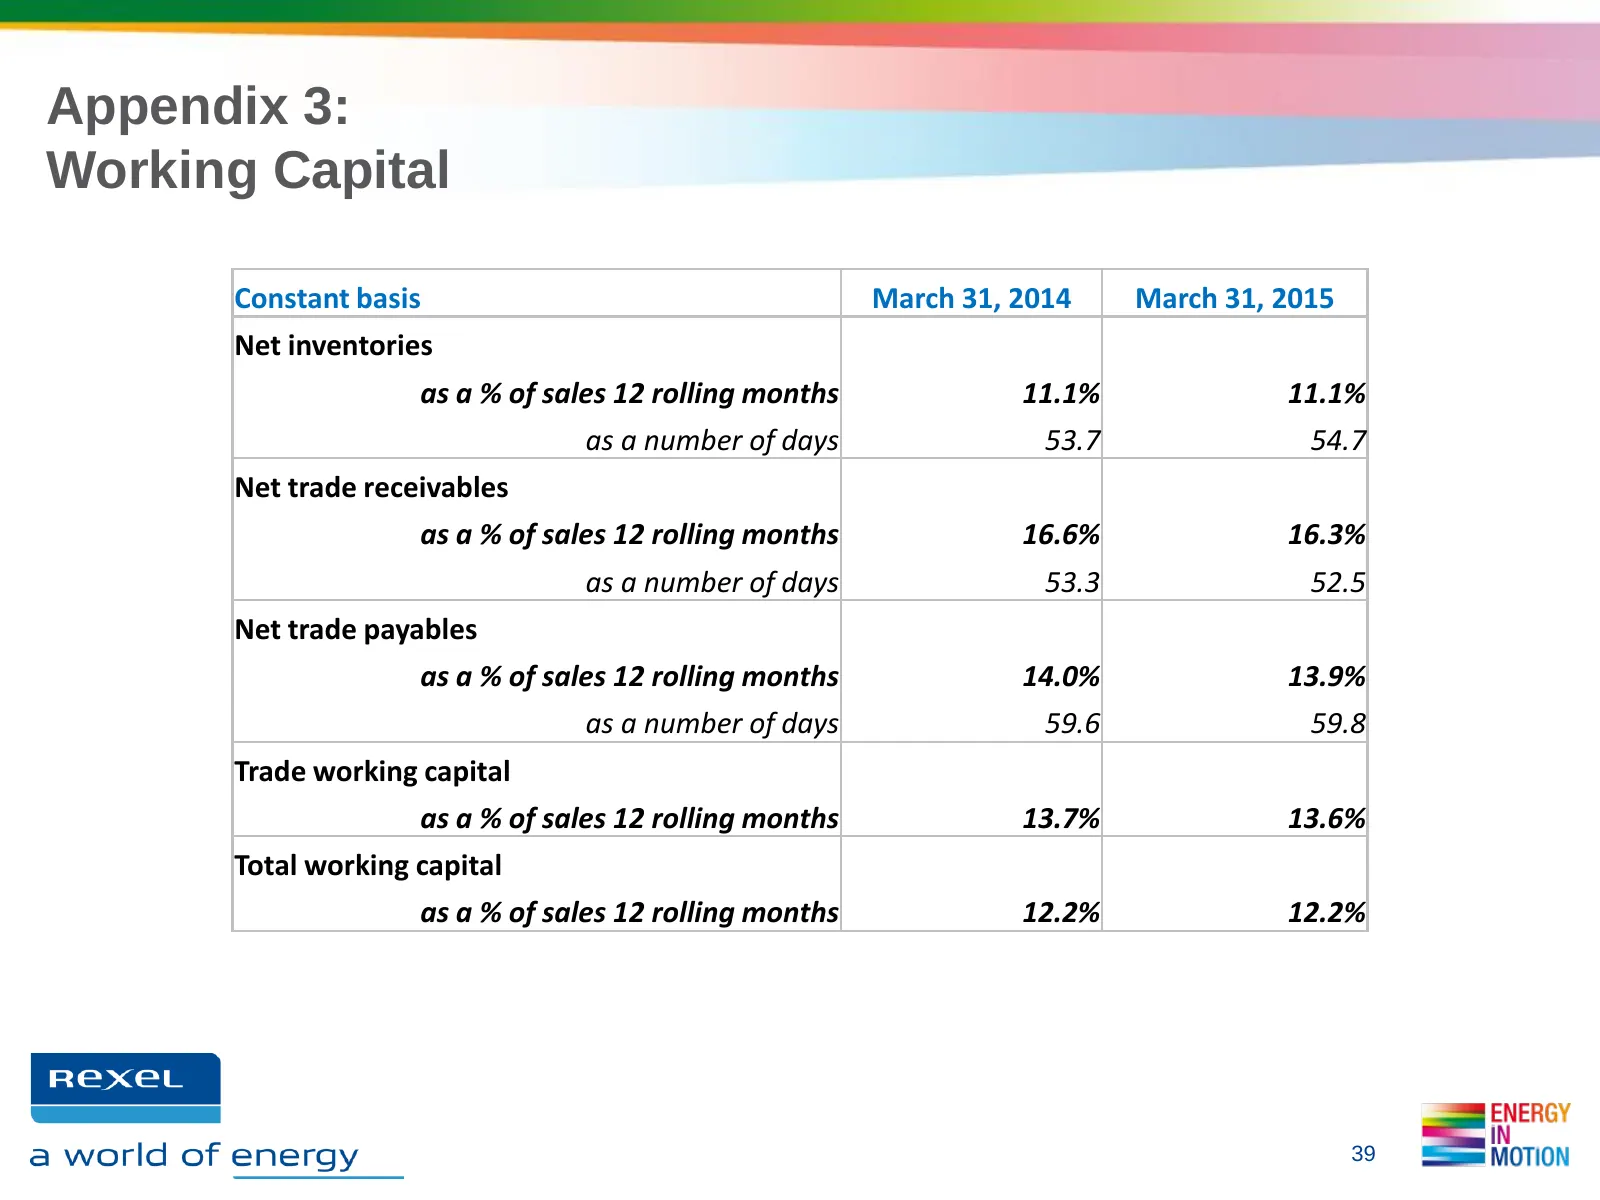
Slide 39: Appendix 3: Working Capital
Appendix 3: Working Capital Constant basis March 31, 2014 March 31, 2015 Net inventories as a % of sales 12 rolling months 11.1% 11.1% as a number of days 53.7 54.7 Net trade receivables as a % of sales 12 rolling months 16.6% 16.3% as a number of days 53.3 52.5 Net trade payables as a % of sales 12
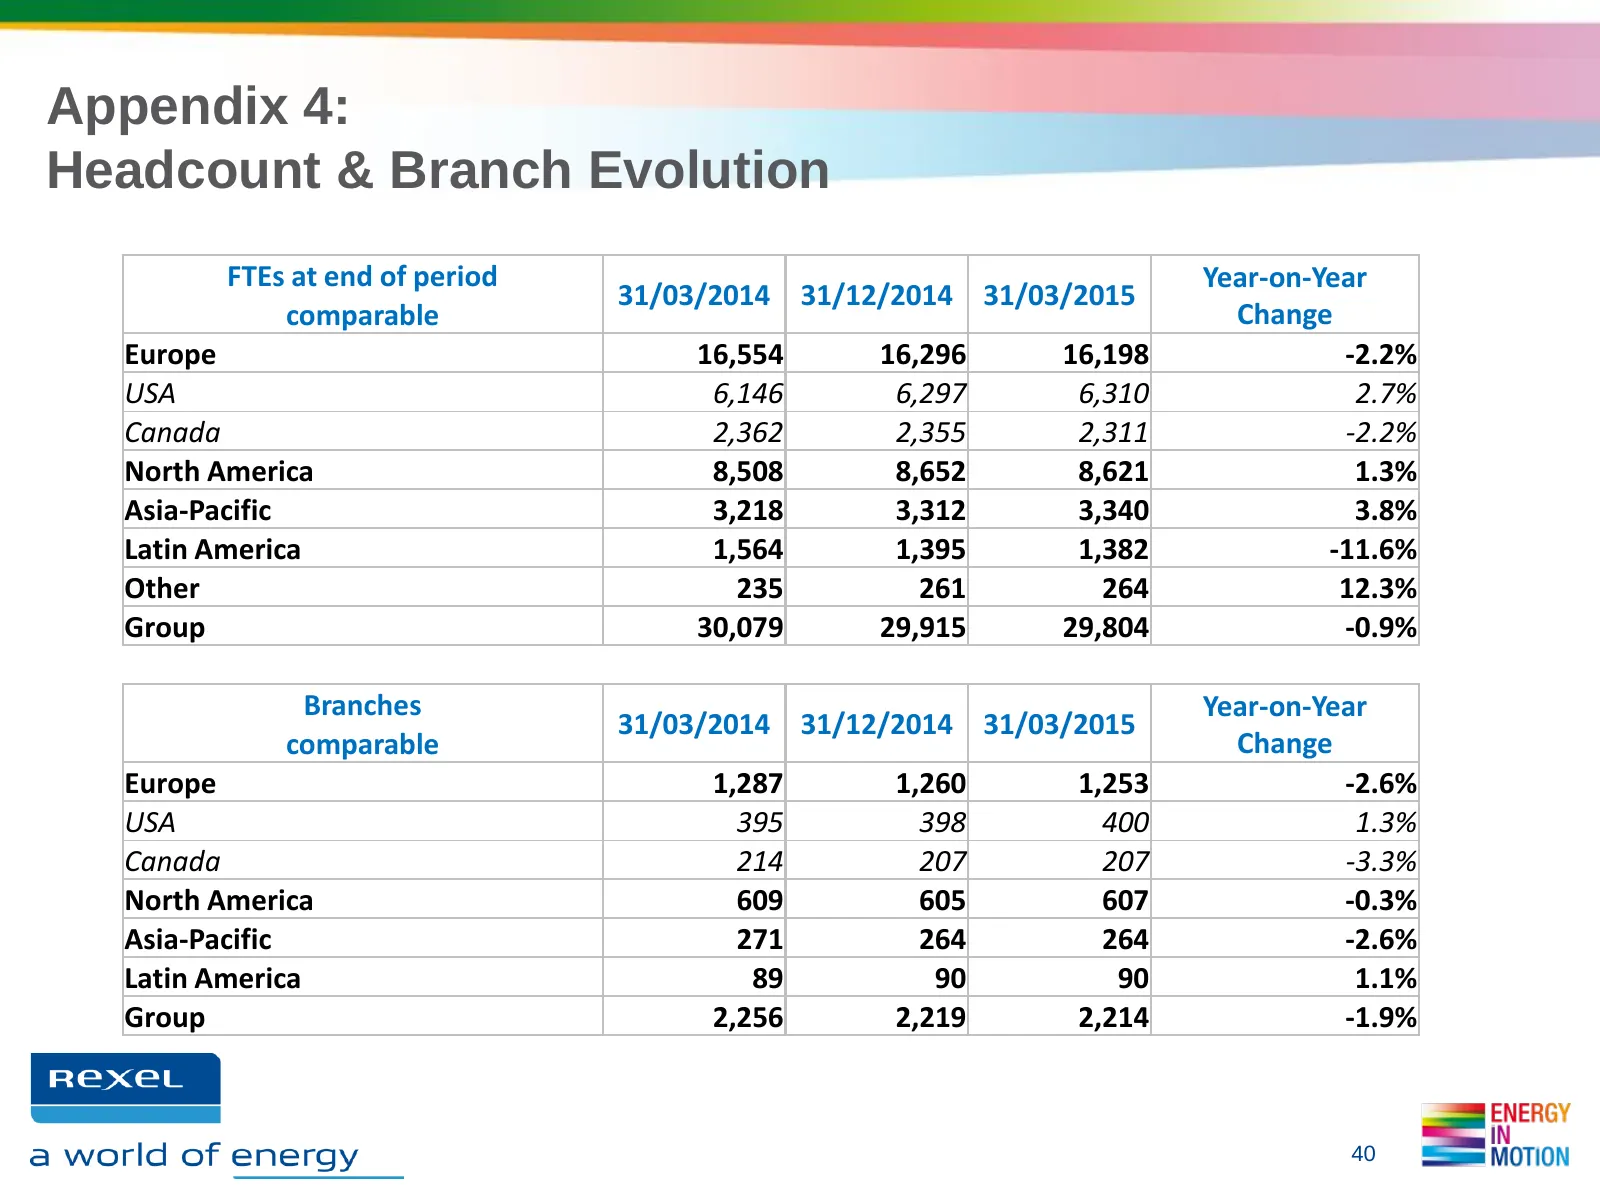
Slide 40: Appendix 4: Headcount & Branch Evolution
Appendix 4: Headcount & Branch Evolution FTEs at end of period Year-on-Year 31/03/2014 31/12/2014 31/03/2015 comparable Change Europe 16,554 16,296 16,198 -2.2% USA 6,146 6,297 6,310 2.7% Canada 2,362 2,355 2,311 -2.2% North America 8,508 8,652 8,621 1.3% Asia-Pacific 3,218 3,312 3,340 3.8% Latin Am
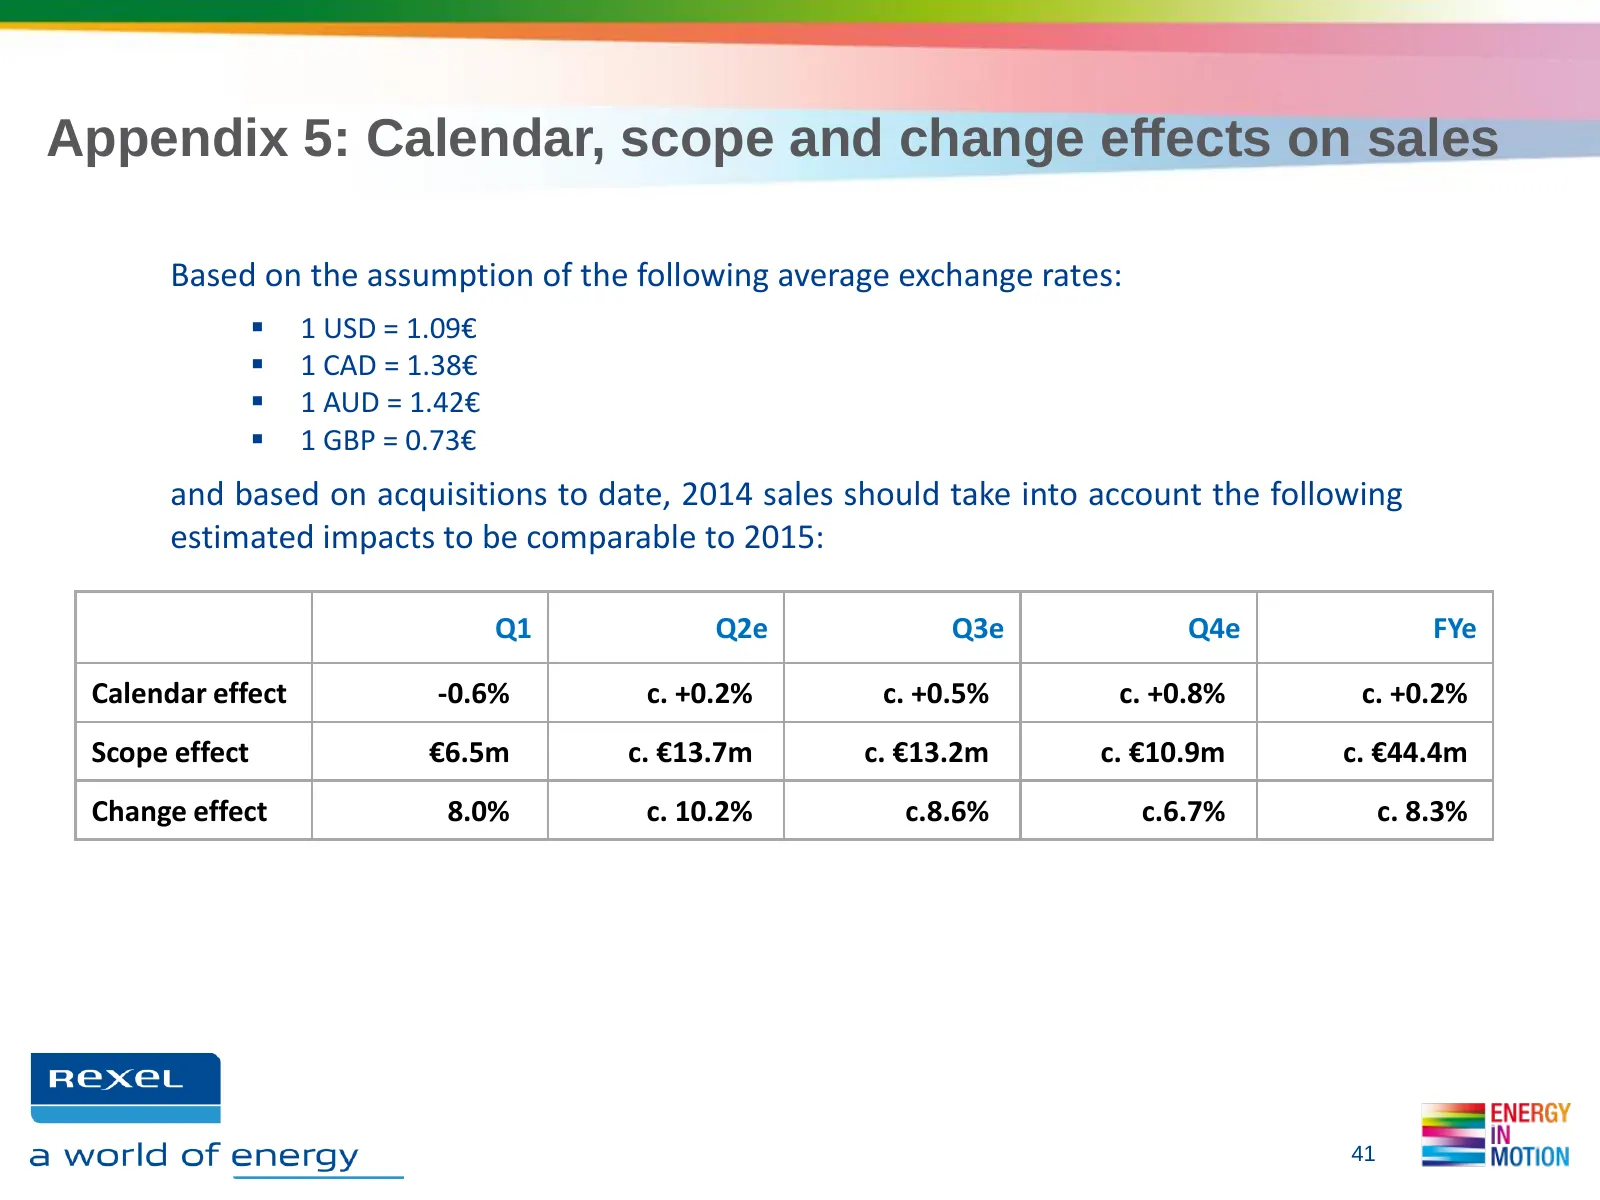
Slide 41: Appendix 5: Calendar, scope and change effects on sales
Appendix 5: Calendar, scope and change effects on sales Based on the assumption of the following average exchange rates: 1 USD = 1.09€ 1 CAD = 1.38€ 1 AUD = 1.42€ 1 GBP = 0.73€ and based on acquisitions to date, 2014 sales should take into account the following estimated impacts to be compar
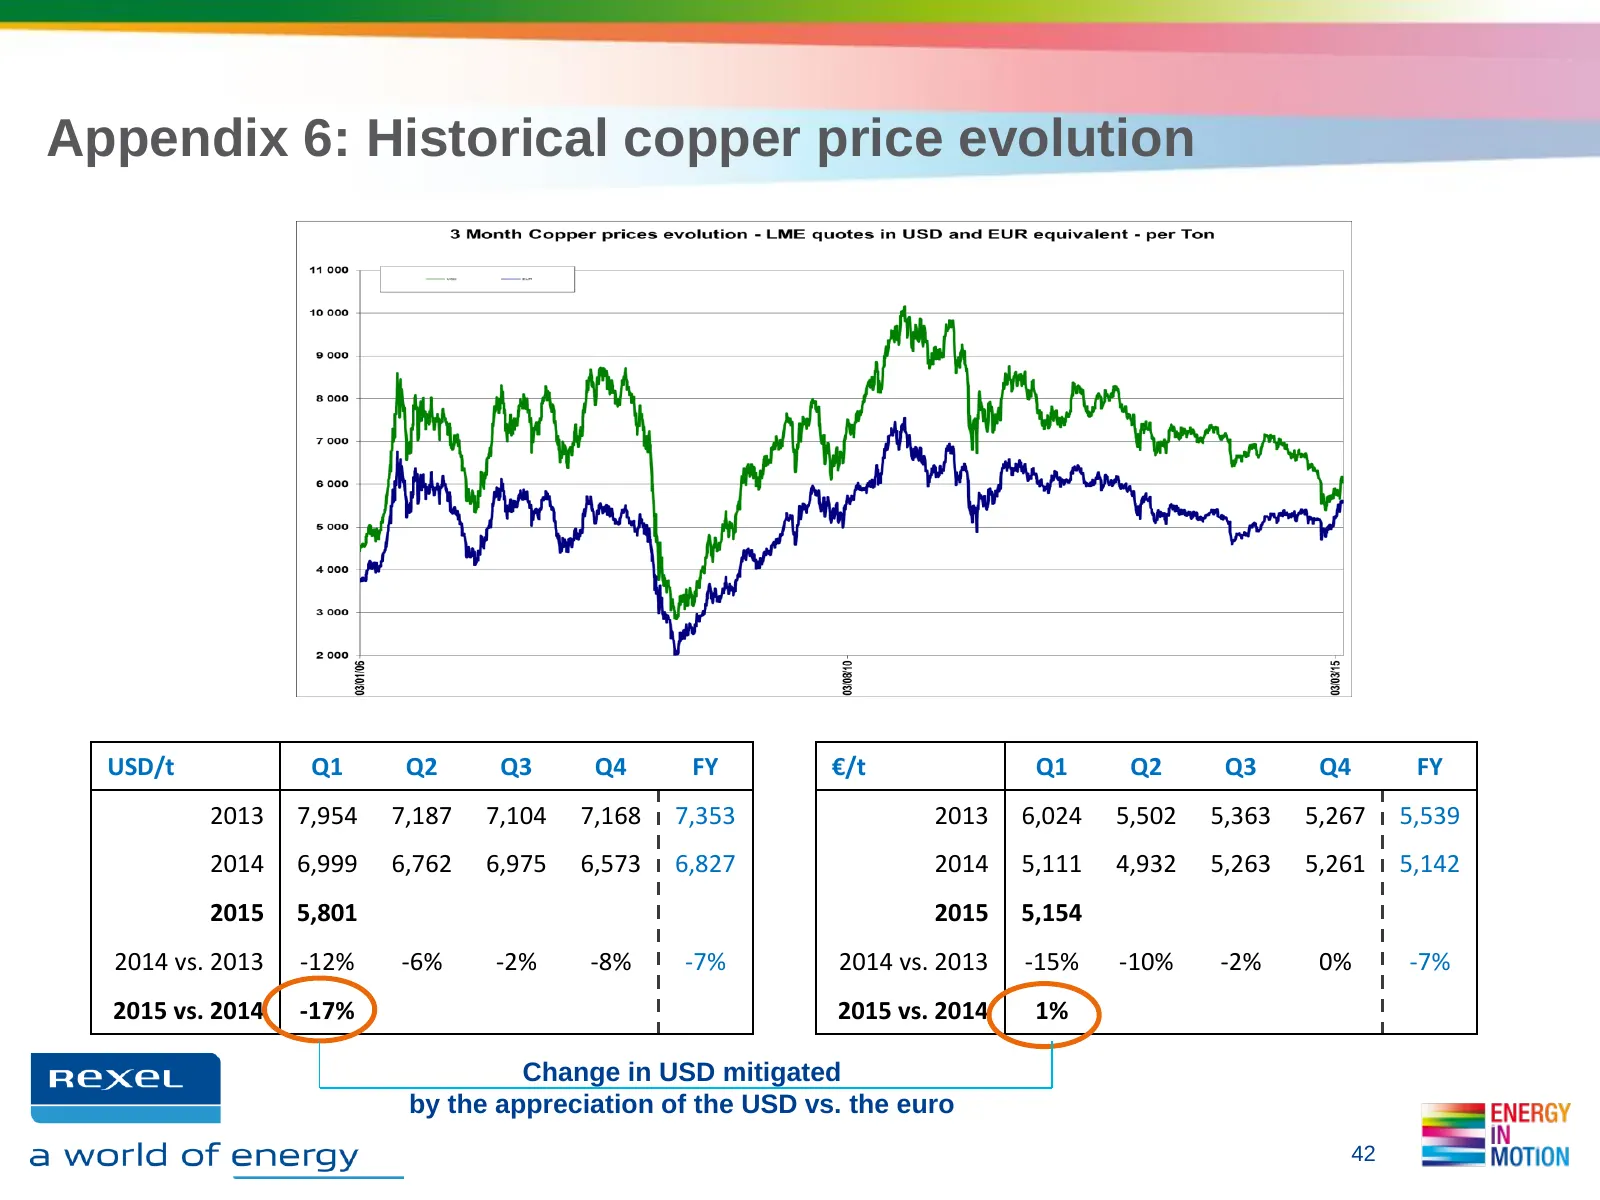
Slide 42: Appendix 6: Historical copper price evolution
Appendix 6: Historical copper price evolution USD/t Q1 Q2 Q3 Q4 FY €/t Q1 Q2 Q3 Q4 FY 2013 7,954 7,187 7,104 7,168 7,353 2013 6,024 5,502 5,363 5,267 5,539 2014 6,999 6,762 6,975 6,573 6,827 2014 5,111 4,932 5,263 5,261 5,142 2015 5,801 2015 5,154 2014 vs. 2013 -12% -6% -2% -8% -7% 2014 vs. 2013 -15
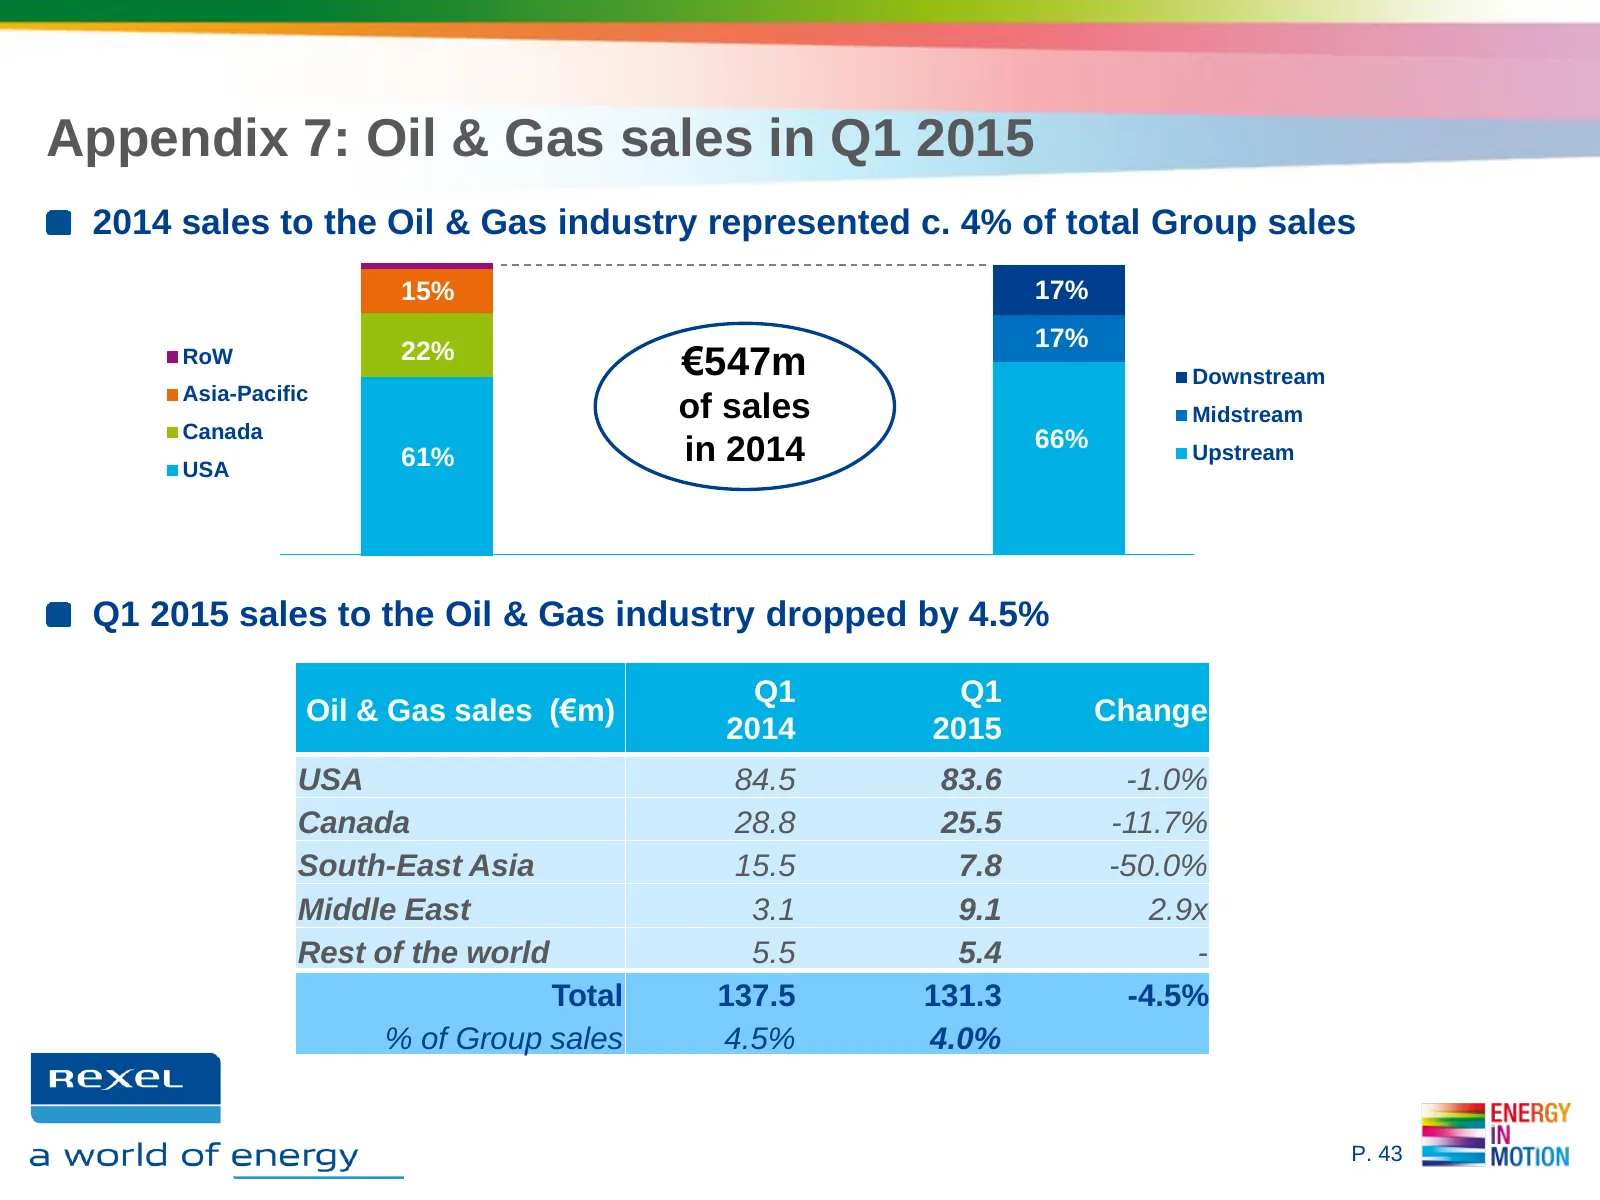
Slide 43: Appendix 7: Oil & Gas sales in Q1 2015
Appendix 7: Oil & Gas sales in Q1 2015 2014 sales to the Oil & Gas industry represented c. 4% of total Group sales 15% 17% 17% RoW 22% €547m Downstream Asia-Pacific of sales Midstream Canada 66% USA 61% in 2014 Upstream Q1 2015 sales to the Oil & Gas industry dropped by 4.5% Q1 Q1 Oil & Gas sales (€
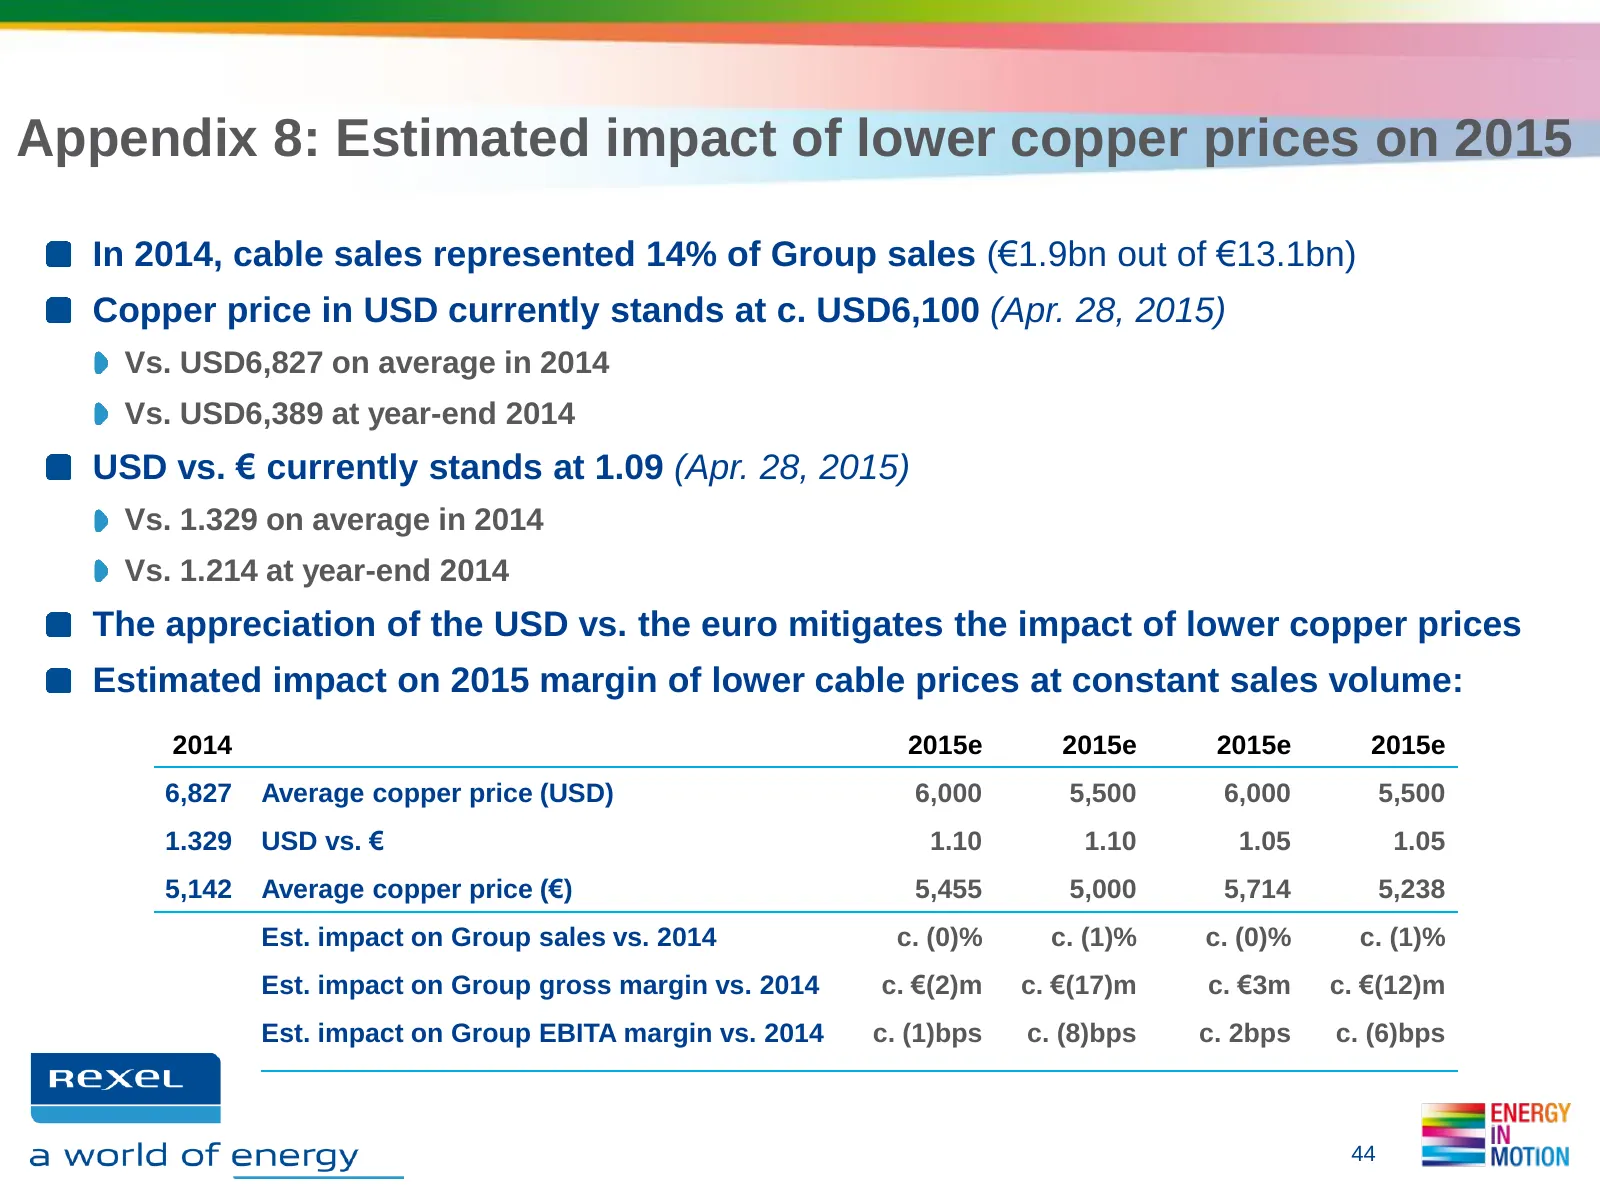
Slide 44: Appendix 8: Estimated impact of lower copper prices on 2015
Appendix 8: Estimated impact of lower copper prices on 2015 In 2014, cable sales represented 14% of Group sales (€1.9bn out of €13.1bn) Copper price in USD currently stands at c. USD6,100 (Apr. 28, 2015) Vs. USD6,827 on average in 2014 Vs. USD6,389 at year-end 2014 USD vs. € currently stands at 1.09
Slide 45: Financial Calendar and contacts
Financial Calendar and contacts Financial Calendar Contacts • May 27, 2015 • Investors & Analysts Shareholders’ meeting Marc MAILLET Tel: +33 1 42 85 76 12 • July 29, 2015 Email: marc.maillet@rexel.com Q2 and H1 results Florence MEILHAC • October 29, 2015 Tel: +33 1 42 85 57 61 Q3 and 9m results Ema
Slide 46: Disclaimer
Disclaimer The Group is exposed to fluctuations in copper prices in connection with its distribution of cable products. Cables accounted for approximately 14% of the Group's sales, and copper accounts for approximately 60% of the composition of cables. This exposure is indirect since cable prices al
Source: Internet Archive copy of rexel.com
More decks from Rexel SA
 Q3 2026 Earnings Presentation13 slides · Oct 22, 2026
 Q2 2026 Earnings Presentation24 slides · Jul 27, 2026
 FY 2025 Earnings Presentation31 slides · Feb 11, 2026
 Q3 2025 Earnings Presentation15 slides · Oct 15, 2025
 Q2 2025 Earnings Presentation20 slides · Jul 28, 2025
 Q1 2025 Earnings Presentation16 slides · Apr 29, 2025