Heartland Financial USA — Investor Presentation (August 2012)
42 slides from Heartland Financial USA's investor presentation, Aug 3, 2012
Slide 1: Investor Presentation
Investor Presentation Trading Symbol: htlf | www.htlf.com Lynn B. Fuller Chairman President and CEO John K. Schmidt Chief Operating Officer Chief Financial Officer
Slide 2: Safe Harbor
July 30, 2012 Page 2 Safe Harbor This presentation may contain, and future oral and written statements of the Company and its management may contain, forward-looking statements within the meaning of the Private Securities Litigation Reform Act of 1995 with respect to the financial condition, results
Slide 3: Heartland By The Numbers
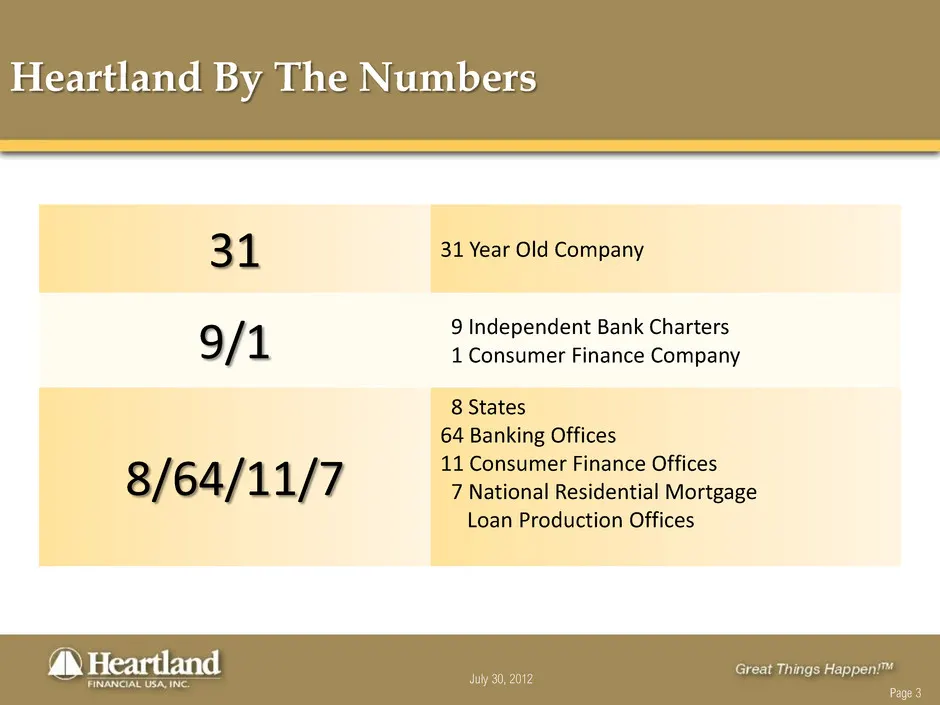
July 30, 2012 Page 3 Heartland By The Numbers 31 31 Year Old Company 9/1 9 Independent Bank Charters 1 Consumer Finance Company 8/64/11/7 8 States 64 Banking Offices 11 Consumer Finance Offices 7 National Residential Mortgage Loan Production Offices
Slide 4: An Expanding Franchise: Midwest to West
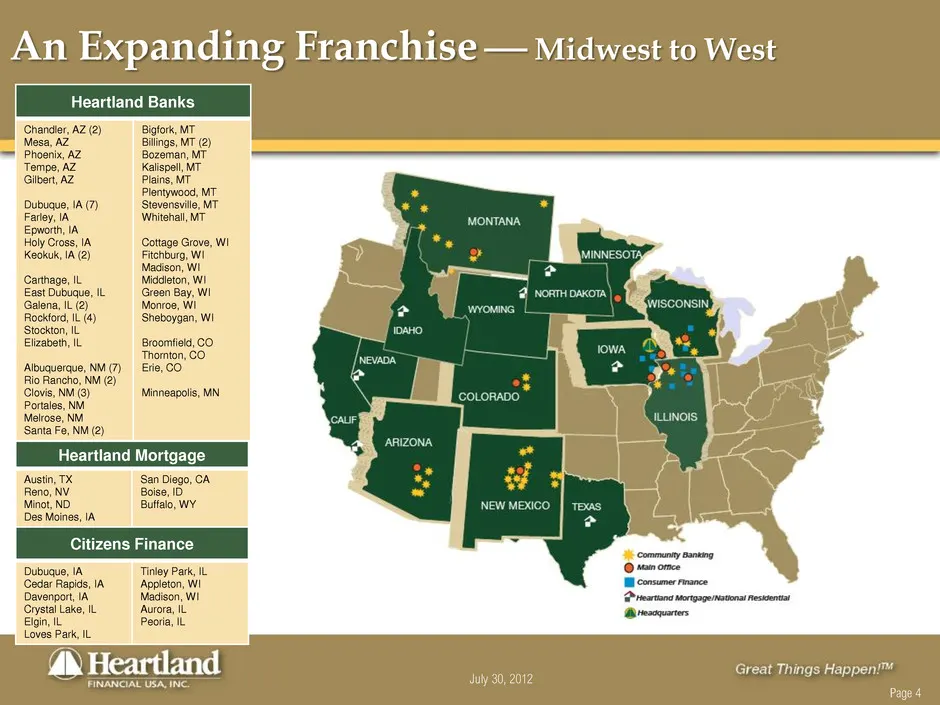
July 30, 2012 Page 4 An Expanding Franchise Midwest to West Heartland Banks Chandler, AZ (2) Mesa, AZ Phoenix, AZ Tempe, AZ Gilbert, AZ Dubuque, IA (7) Farley, IA Epworth, IA Holy Cross, IA Keokuk, IA (2) Carthage, IL East Dubuque, IL Galena, IL (2) Rockford, IL (4) Stockton, IL Elizabeth, IL Albu
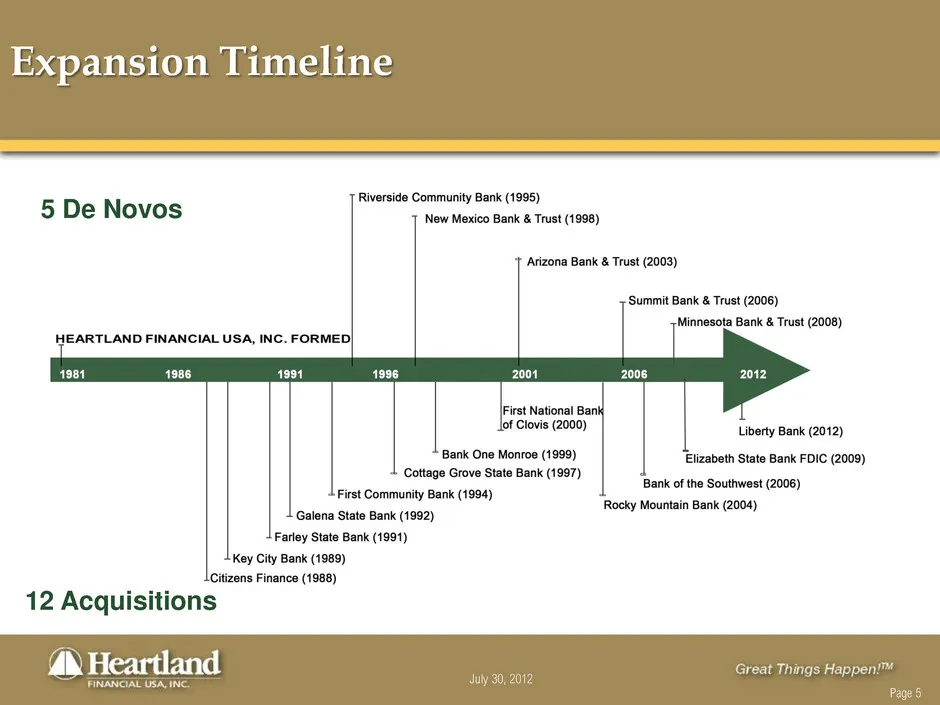
Slide 5: Expansion Timeline: De Novos and Acquisitions
July 30, 2012 Page 5 Expansion Timeline 5 De Novos 12 Acquisitions
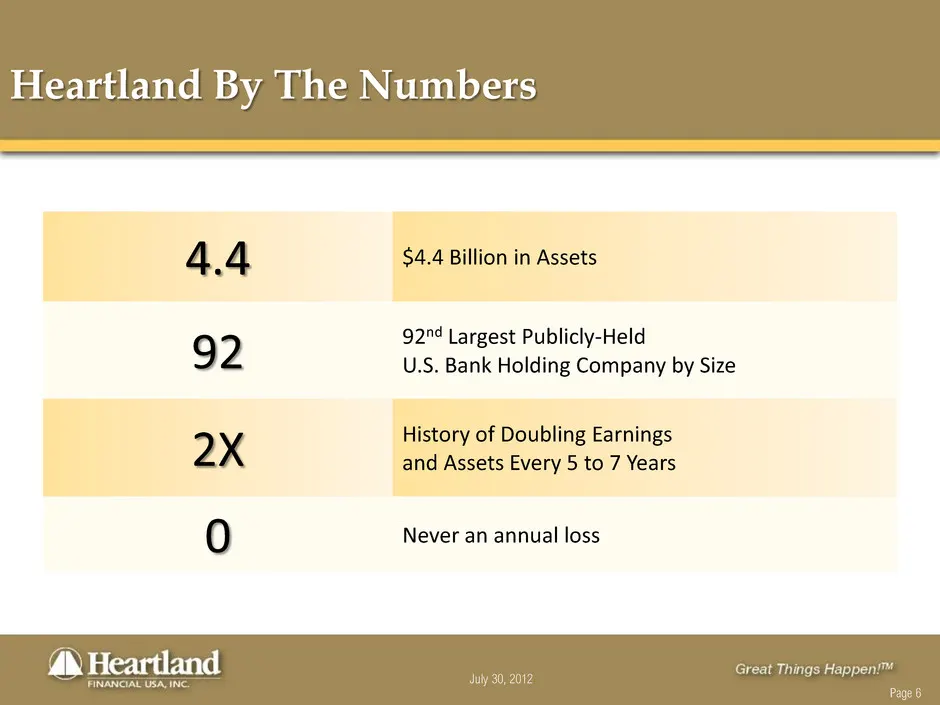
Slide 6: Heartland By The Numbers
July 30, 2012 Page 6 Heartland By The Numbers 4.4 $4.4 Billion in Assets 92 92 nd Largest Publicly-Held U.S. Bank Holding Company by Size 2X History of Doubling Earnings and Assets Every 5 to 7 Years 0 Never an annual loss
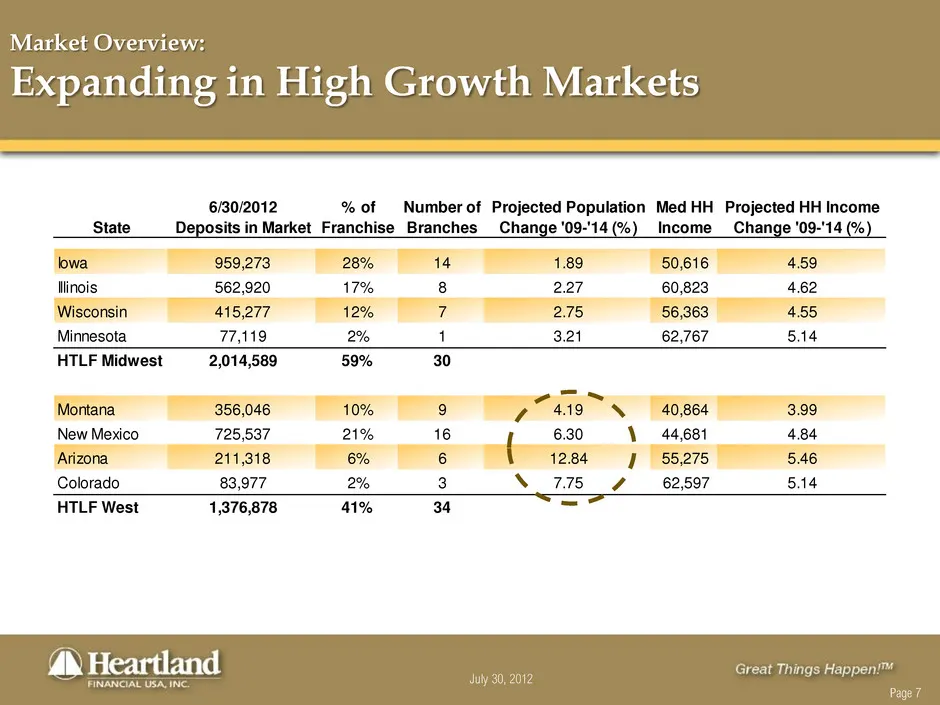
Slide 7: Market Overview: Expanding in High Growth Markets
July 30, 2012 Page 7 Market Overview: Expanding in High Growth Markets 6/30/2012 % of Number of Projected Population Med HH Projected HH Income State Deposits in Market Franchise Branches Change '09-'14 (%) Income Change '09-'14 (%) Iowa 959,273 28% 14 1.89 50,616 4.59 Illinois 562,920 17% 8 2.27 60
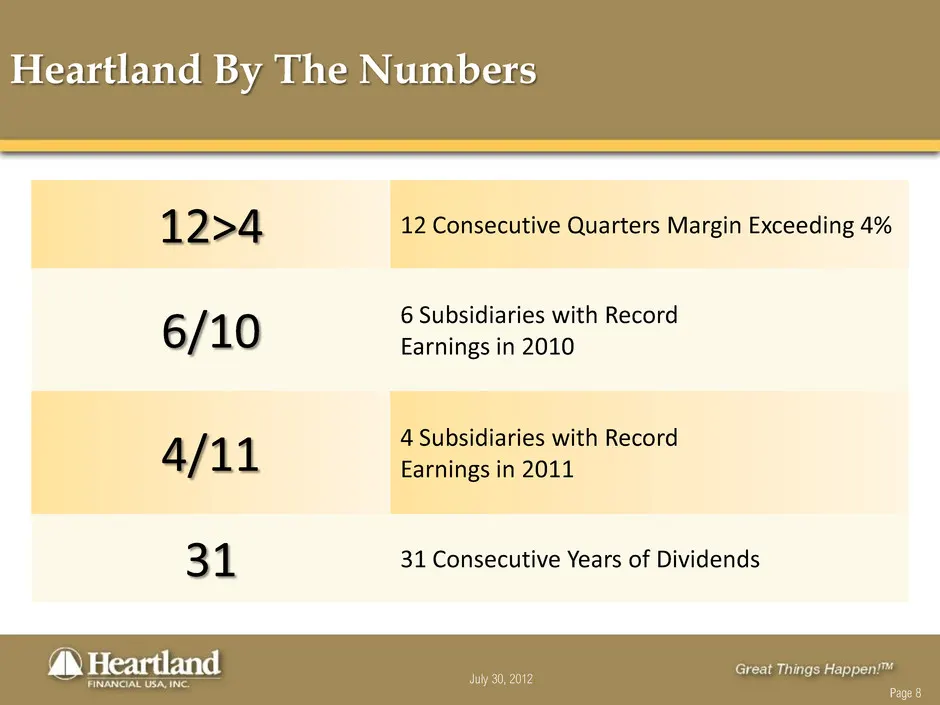
Slide 8: Heartland By The Numbers
July 30, 2012 Page 8 Heartland By The Numbers 12>4 12 Consecutive Quarters Margin Exceeding 4% 6/10 6 Subsidiaries with Record Earnings in 2010 4/11 4 Subsidiaries with Record Earnings in 2011 31 31 Consecutive Years of Dividends
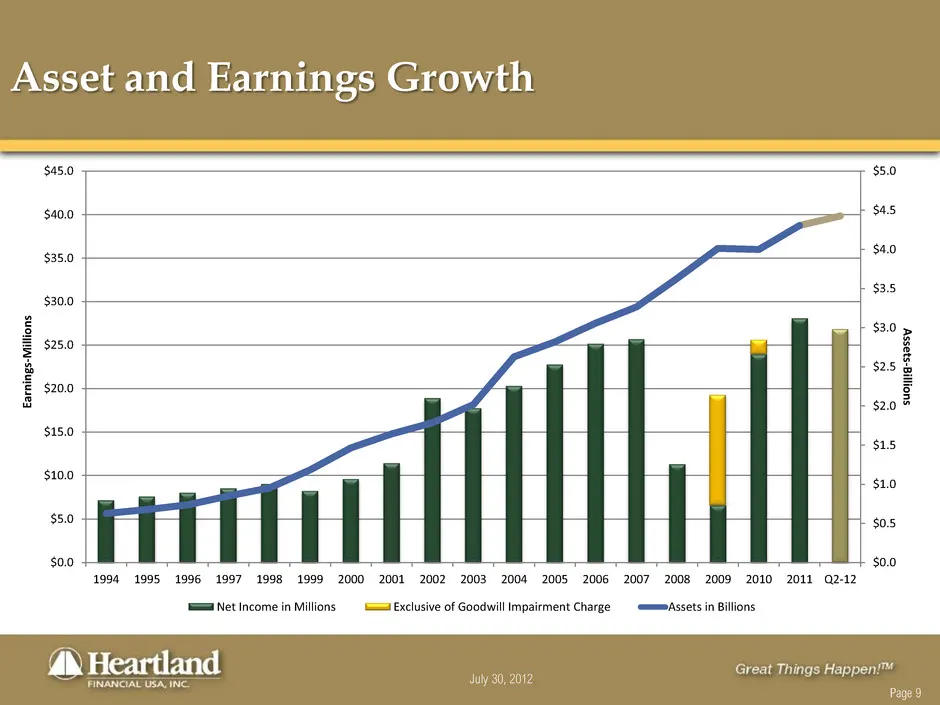
Slide 9: Asset and Earnings Growth
July 30, 2012 Page 9 Asset and Earnings Growth $0.0 $0.5 $1.0 $1.5 $2.0 $2.5 $3.0 $3.5 $4.0 $4.5 $5.0 $0.0 $5.0 $10.0 $15.0 $20.0 $25.0 $30.0 $35.0 $40.0 $45.0 1994 1995 1996 1997 1998 1999 2000 2001 2002 2003 2004 2005 2006 2007 2008 2009 2010 2011 Q2-12 A sse ts-B illio n s Ea rn in gs -M ill io n
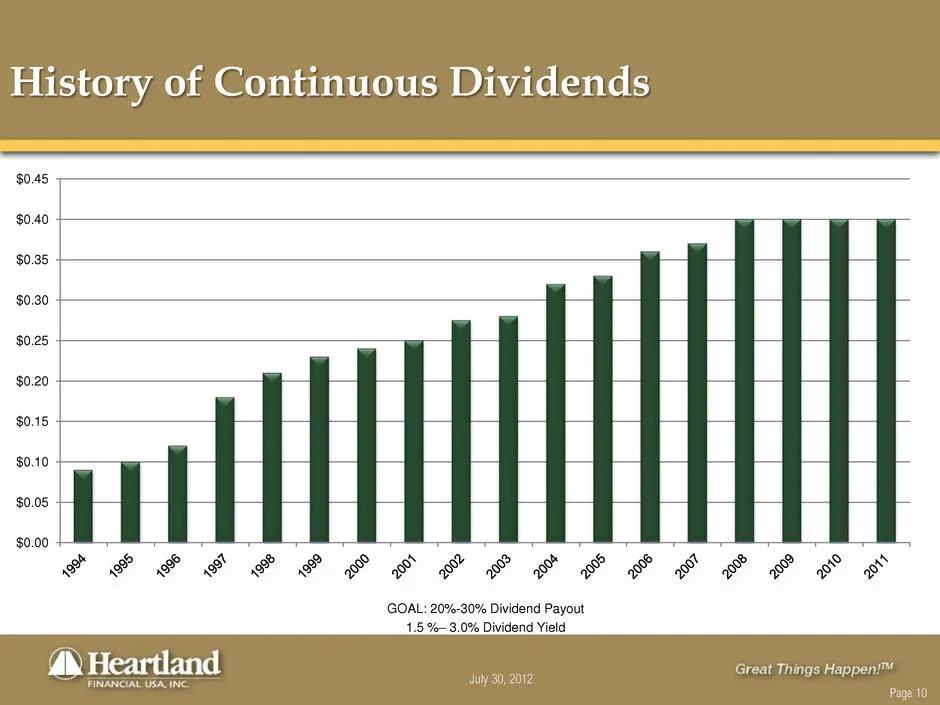
Slide 10: History of Continuous Dividends
July 30, 2012 Page 10 History of Continuous Dividends GOAL: 20%-30% Dividend Payout 1.5 %– 3.0% Dividend Yield $0.00 $0.05 $0.10 $0.15 $0.20 $0.25 $0.30 $0.35 $0.40 $0.45
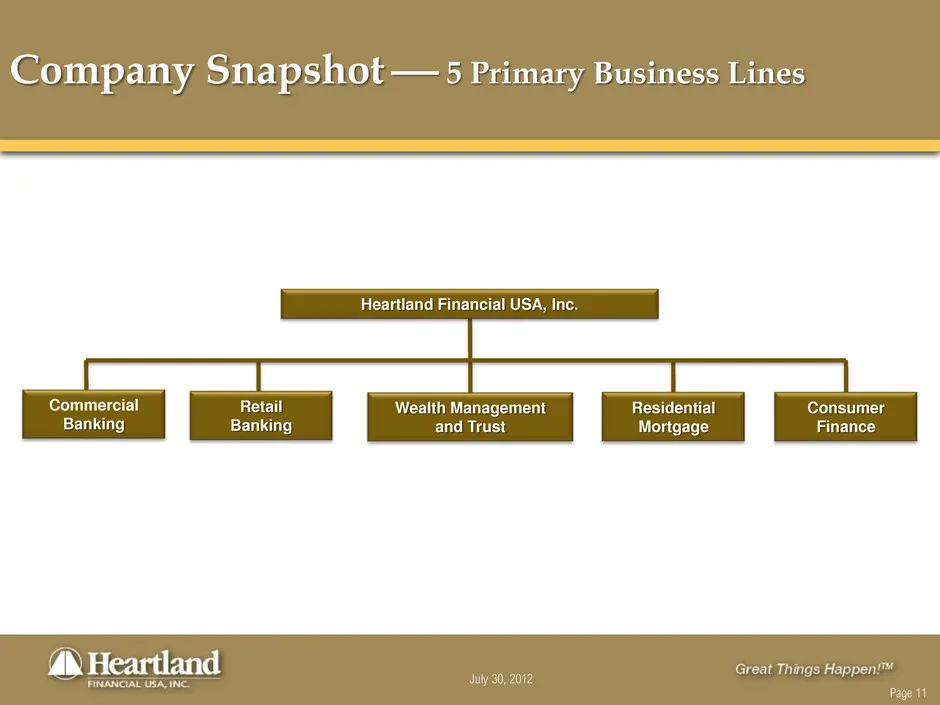
Slide 11: Company Snapshot: Primary Business Lines
July 30, 2012 Page 11 Company Snapshot 5 Primary Business Lines Heartland Financial USA, Inc. Commercial Banking Retail Banking Wealth Management and Trust Consumer Finance Residential Mortgage
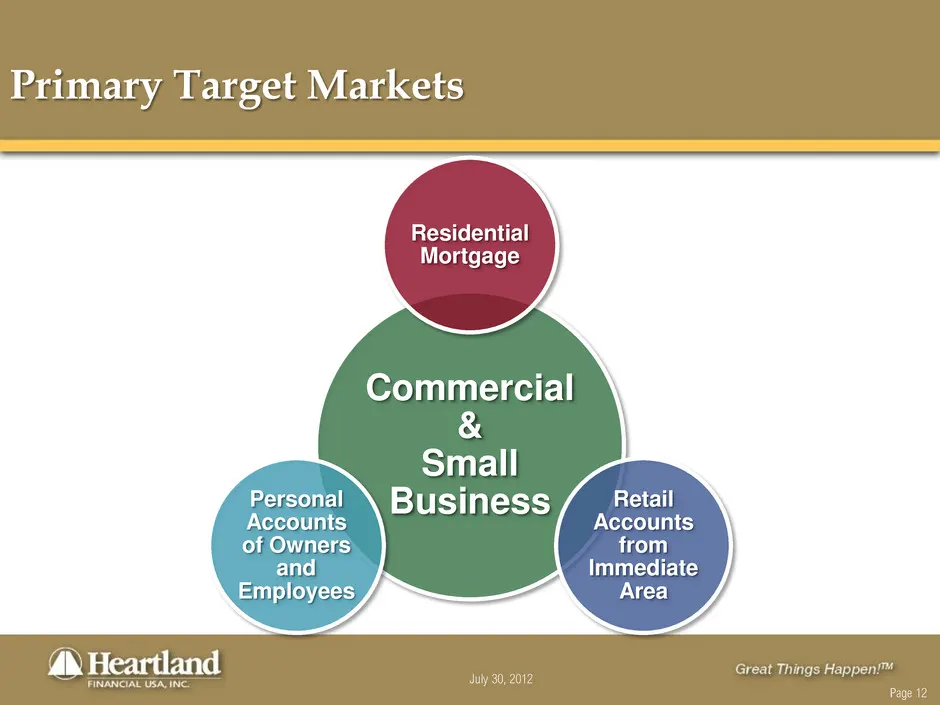
Slide 12: Primary Target Markets
July 30, 2012 Page 12 Primary Target Markets Commercial & Small Business Residential Mortgage Retail Accounts from Immediate Area Personal Accounts of Owners and Employees
Slide 13: Three Core Pillars of Success
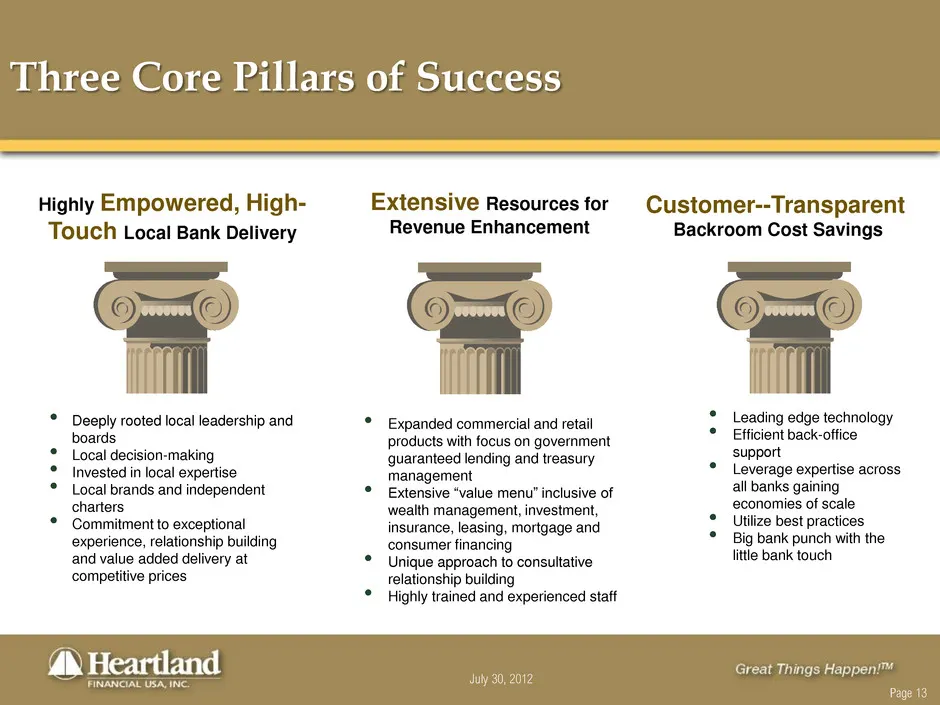
July 30, 2012 Page 13 Three Core Pillars of Success Highly Empowered, High- Touch Local Bank Delivery • Deeply rooted local leadership and boards • Local decision-making • Invested in local expertise • Local brands and independent charters • Commitment to exceptional experience, relationship buildin
Slide 14: Company Snapshot: Financial
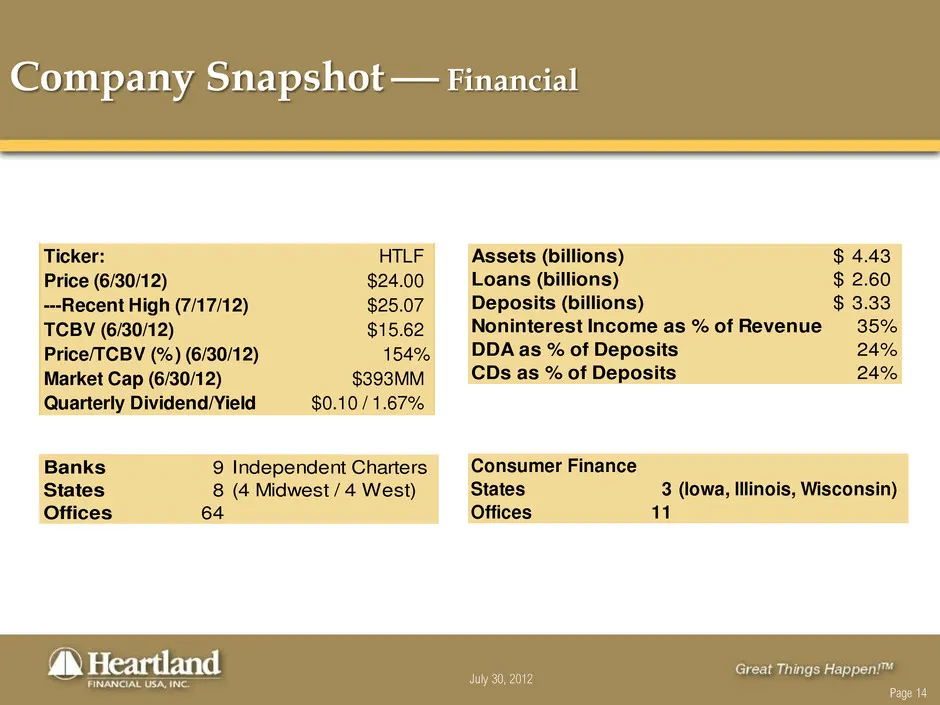
July 30, 2012 Page 14 Company Snapshot Financial Ticker: HTLF Price (6/30/12) $24.00 ---Recent High (7/17/12) $25.07 TCBV (6/30/12) $15.62 Price/TCBV (%) (6/30/12) 154% Market Cap (6/30/12) $393MM Quarterly Dividend/Yield $0.10 / 1.67% Assets (billions) 4.43$ Loans (billions) 2.60$ Deposits (billi
Slide 15: Solid Capital Ratios
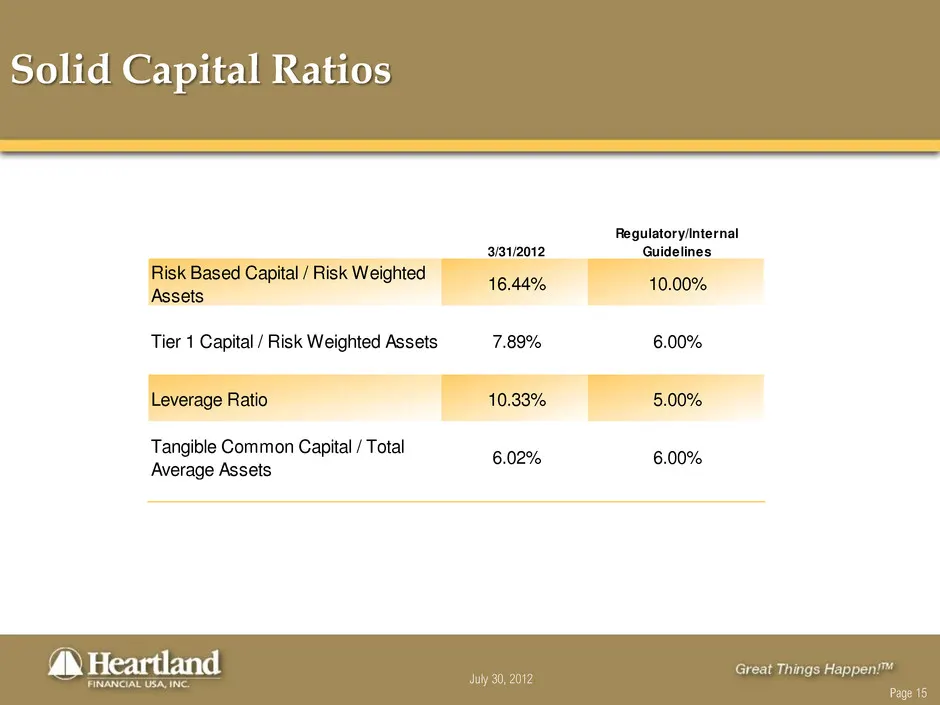
July 30, 2012 Page 15 Solid Capital Ratios 3/31/2012 Regulatory/Internal Guidelines Risk Based Capital / Risk Weighted Assets 16.44% 10.00% Tier 1 Capital / Risk Weighted Assets 7.89% 6.00% Leverage Ratio 10.33% 5.00% Tangible Common Capital / Total Average Assets 6.02% 6.00%
Slide 16: Small Business Loan Fund
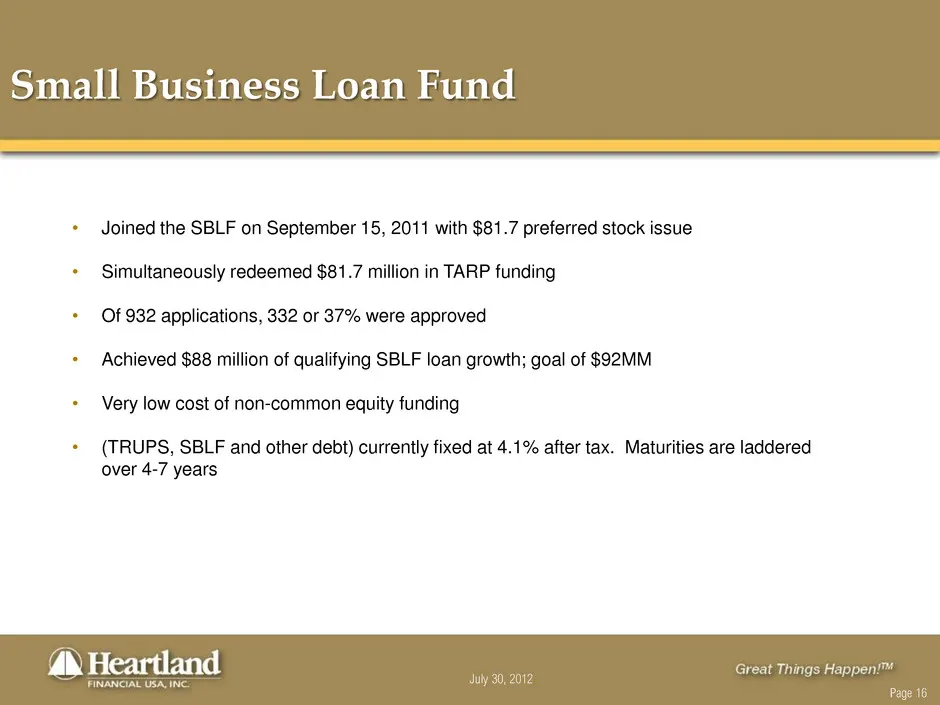
July 30, 2012 Page 16 Small Business Loan Fund • Joined the SBLF on September 15, 2011 with $81.7 preferred stock issue • Simultaneously redeemed $81.7 million in TARP funding • Of 932 applications, 332 or 37% were approved • Achieved $88 million of qualifying SBLF loan growth; goal of $92MM • Very
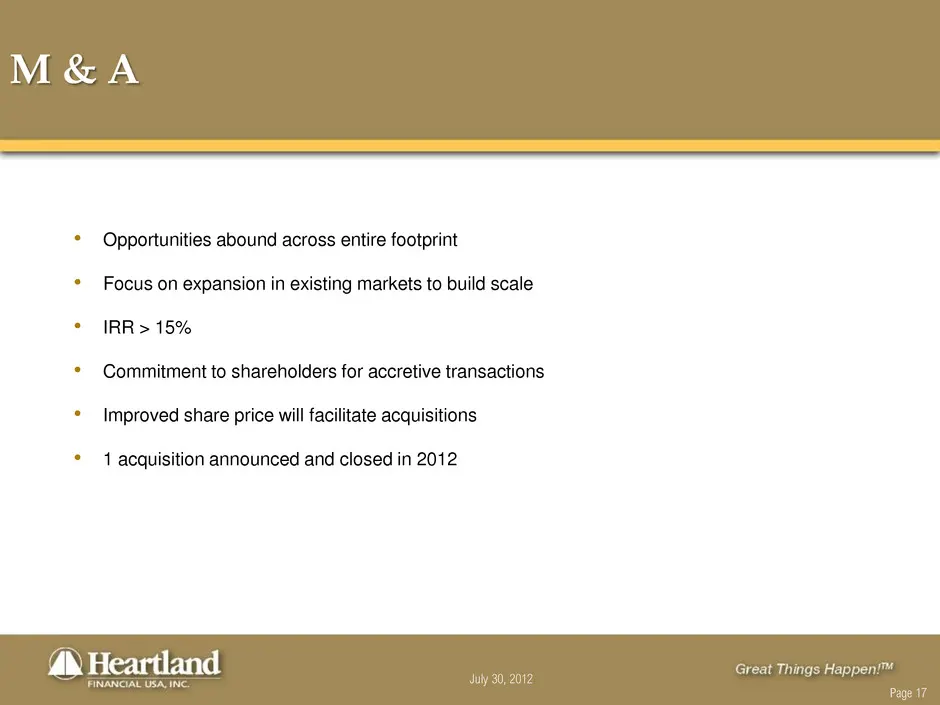
Slide 17: M & A
July 30, 2012 Page 17 M & A • Opportunities abound across entire footprint • Focus on expansion in existing markets to build scale • IRR > 15% • Commitment to shareholders for accretive transactions • Improved share price will facilitate acquisitions • 1 acquisition announced and closed in 2012
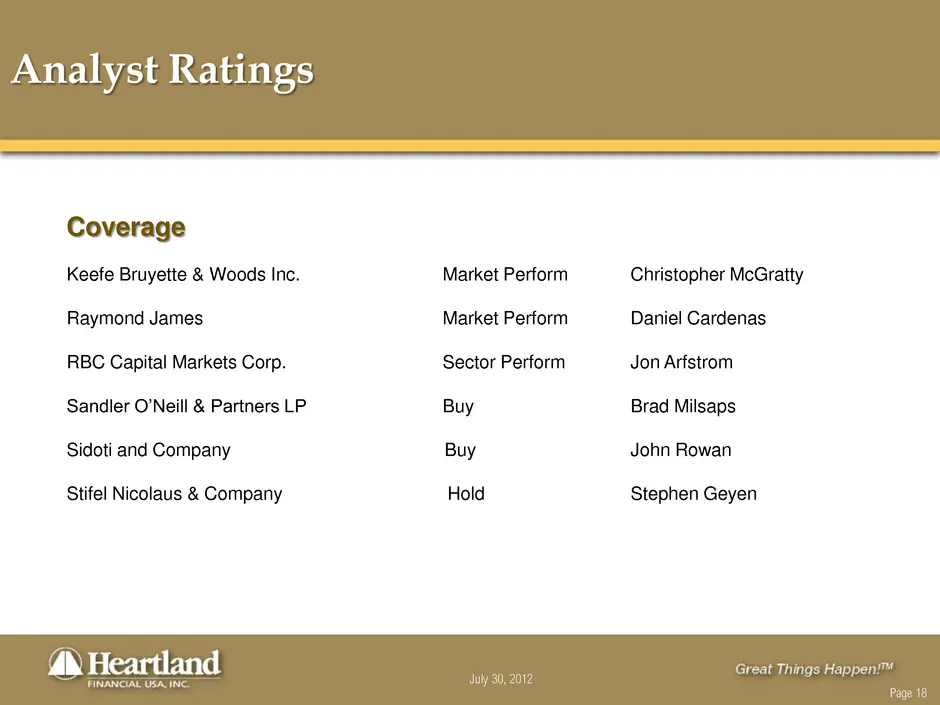
Slide 18: Analyst Coverage
July 30, 2012 Page 18 Coverage Keefe Bruyette & Woods Inc. Market Perform Christopher McGratty Raymond James Market Perform Daniel Cardenas RBC Capital Markets Corp. Sector Perform Jon Arfstrom Sandler O’Neill & Partners LP Buy Brad Milsaps Sidoti and Company Buy John Rowan Stifel Nicolaus & Company
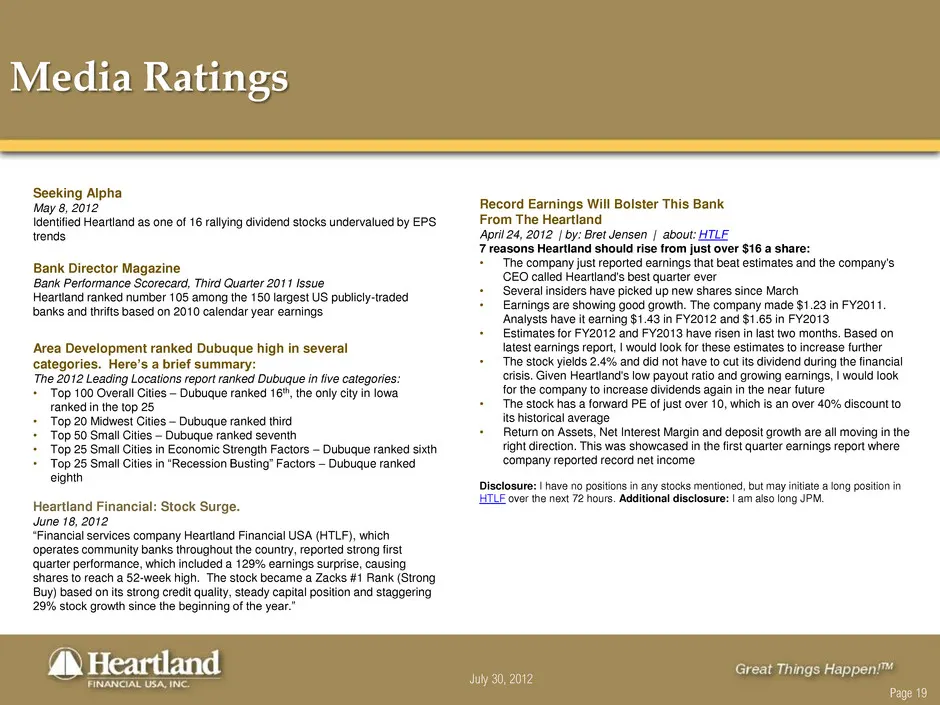
Slide 19: Media Ratings
July 30, 2012 Page 19 Media Ratings Seeking Alpha May 8, 2012 Identified Heartland as one of 16 rallying dividend stocks undervalued by EPS trends Bank Director Magazine Bank Performance Scorecard, Third Quarter 2011 Issue Heartland ranked number 105 among the 150 largest US publicly-traded banks an
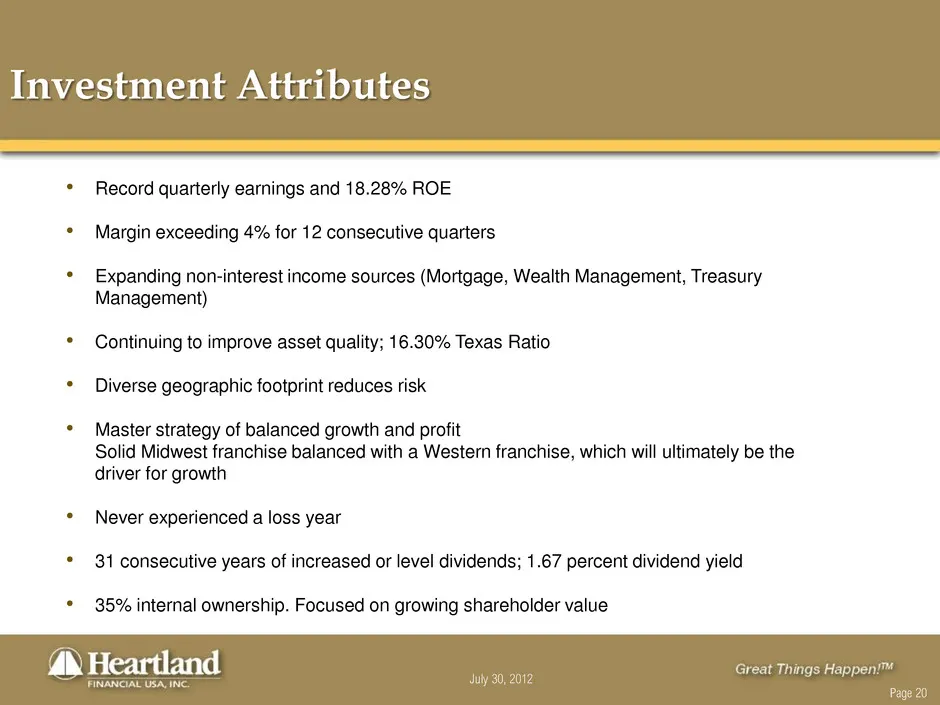
Slide 20: Investment Attributes
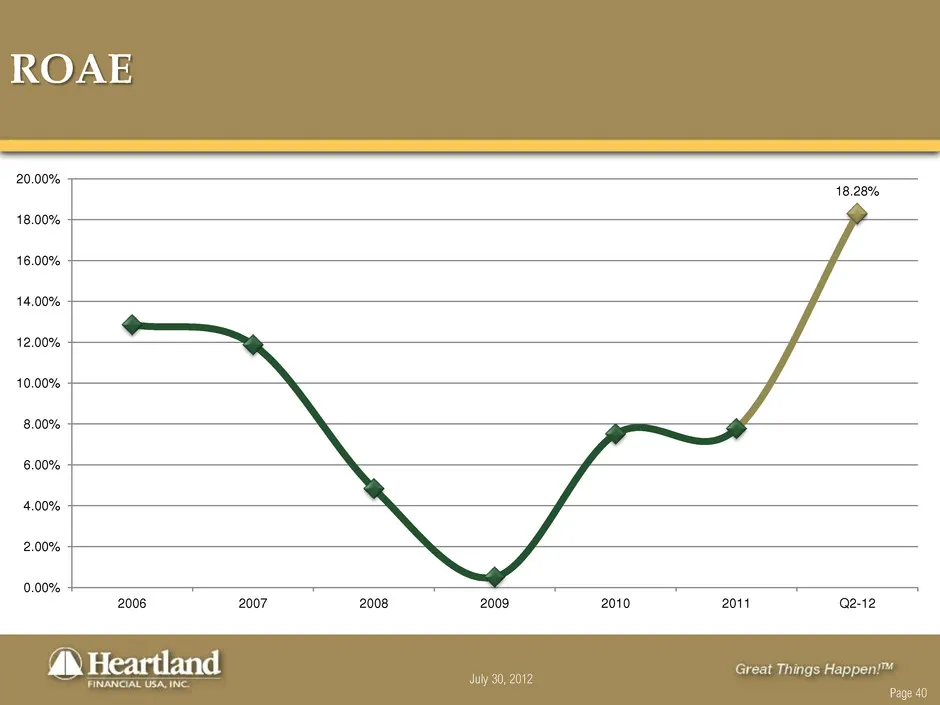
July 30, 2012 Page 20 Investment Attributes • Record quarterly earnings and 18.28% ROE • Margin exceeding 4% for 12 consecutive quarters • Expanding non-interest income sources (Mortgage, Wealth Management, Treasury Management) • Continuing to improve asset quality; 16.30% Texas Ratio • Diverse geog
Slide 21: Financial Highlights
July 30, 2012 Page 21 Financial Highlights
Slide 22: Financial Performance
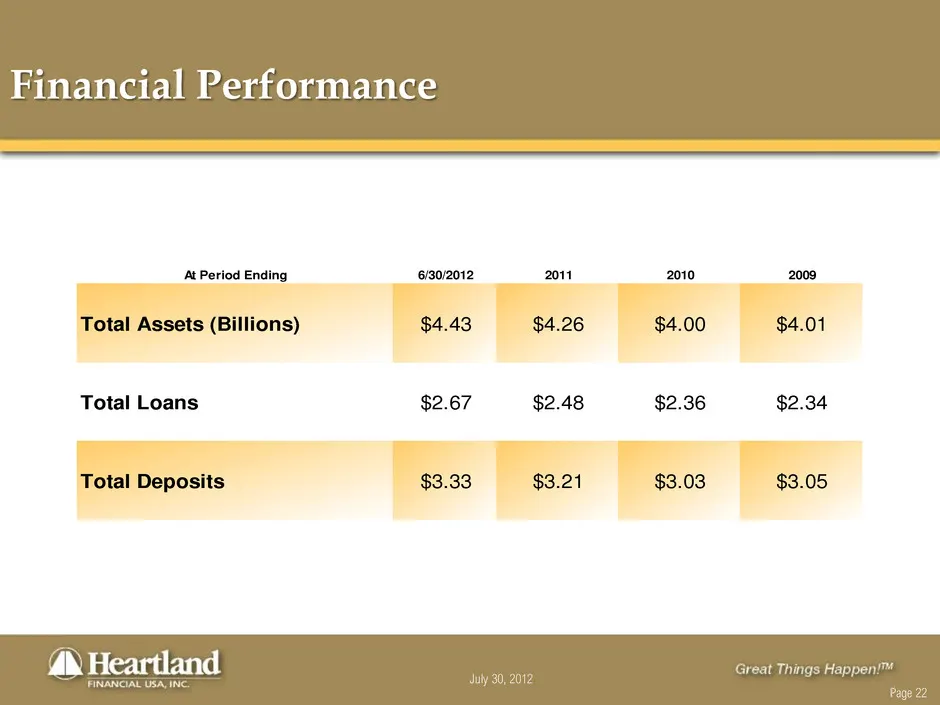
July 30, 2012 Page 22 Financial Performance At Period Ending 6/30/2012 2011 2010 2009 Total Assets (Billions) $4.43 $4.26 $4.00 $4.01 Total Loans $2.67 $2.48 $2.36 $2.34 Total Deposits $3.33 $3.21 $3.03 $3.05
Slide 23: Loans By Category
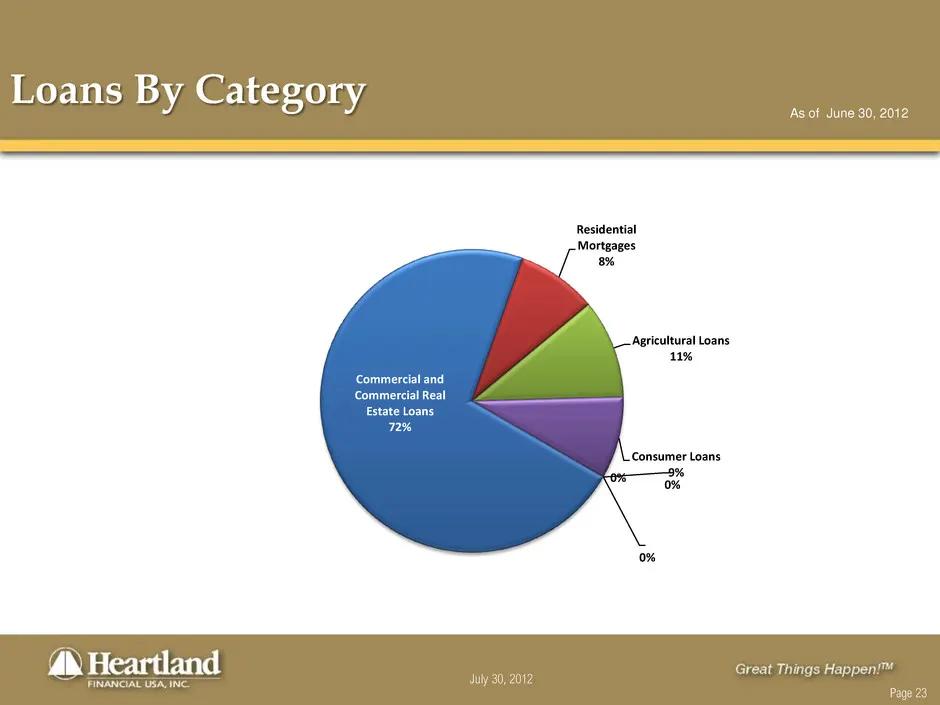
July 30, 2012 Page 23 Loans By Category As of June 30, 2012 Commercial and Commercial Real Estate Loans 72% Residential Mortgages 8% Agricultural Loans 11% Consumer Loans 9% 0% 0% 0%
Slide 24: Non-Performing Assets/Total Assets
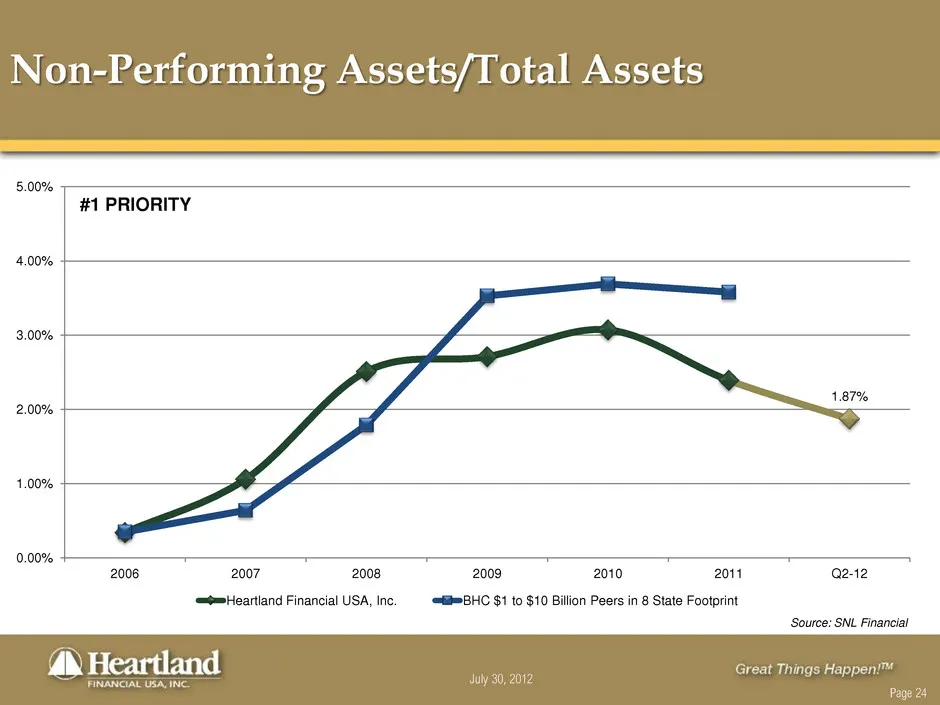
July 30, 2012 Page 24 Non-Performing Assets/Total Assets Source: SNL Financial #1 PRIORITY 1.87% 0.00% 1.00% 2.00% 3.00% 4.00% 5.00% 2006 2007 2008 2009 2010 2011 Q2-12 Heartland Financial USA, Inc. BHC $1 to $10 Billion Peers in 8 State Footprint
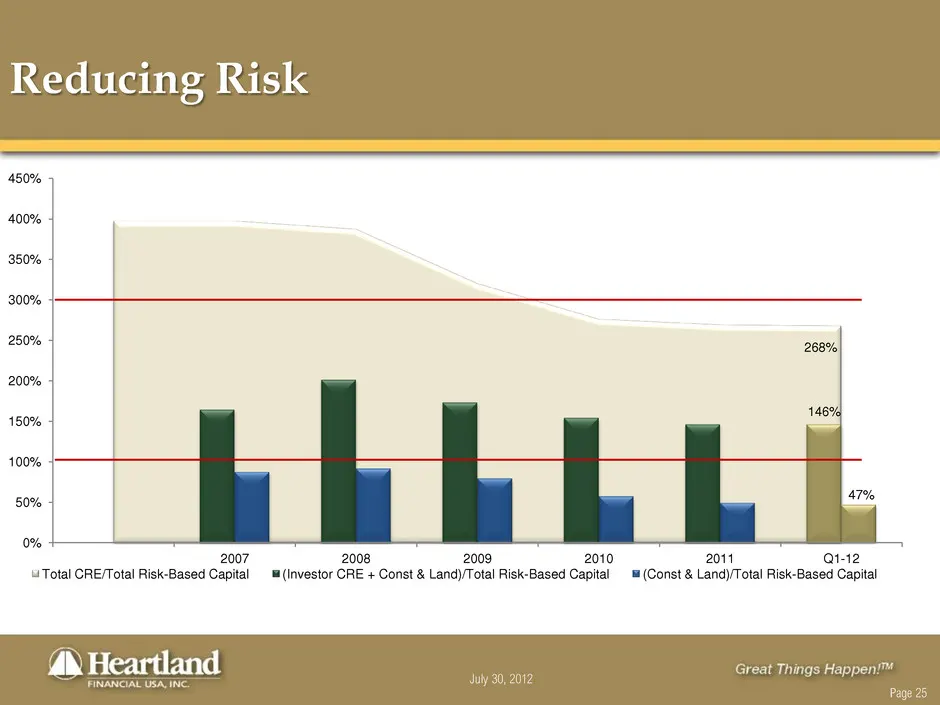
Slide 25: Reducing Risk
July 30, 2012 Page 25 Reducing Risk 268% 146% 47% 0% 50% 100% 150% 200% 250% 300% 350% 400% 450% 2007 2008 2009 2010 2011 Q1-12 Total CRE/Total Risk-Based Capital (Investor CRE + Const & Land)/Total Risk-Based Capital (Const & Land)/Total Risk-Based Capital
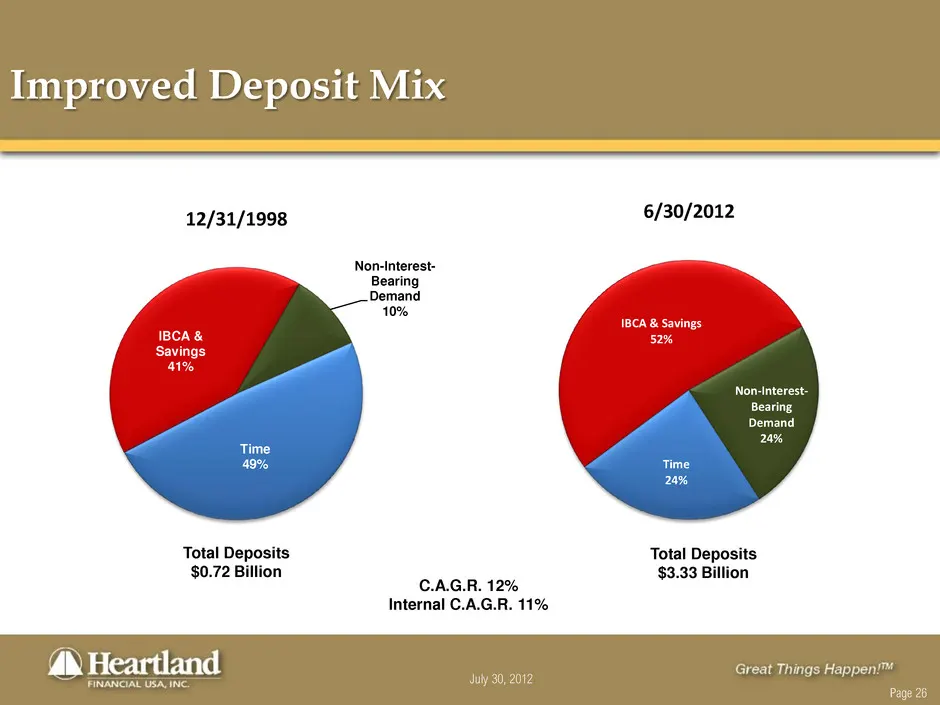
Slide 26: Improved Deposit Mix
July 30, 2012 Page 26 Improved Deposit Mix Total Deposits $0.72 Billion Total Deposits $3.33 Billion C.A.G.R. 12% Internal C.A.G.R. 11% Time 49% IBCA & Savings 41% Non-Interest- Bearing Demand 10% 12/31/1998 Time 24% IBCA & Savings 52% Non-Interest- Bearing Demand 24% 6/30/2012
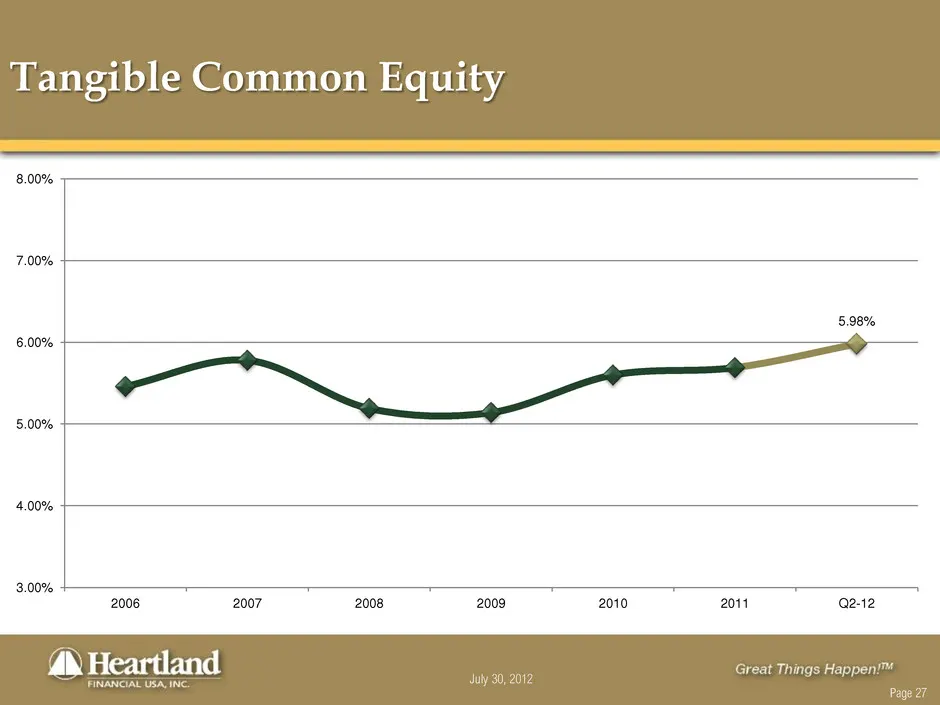
Slide 27: Tangible Common Equity
July 30, 2012 Page 27 Tangible Common Equity 5.98% 3.00% 4.00% 5.00% 6.00% 7.00% 8.00% 2006 2007 2008 2009 2010 2011 Q2-12
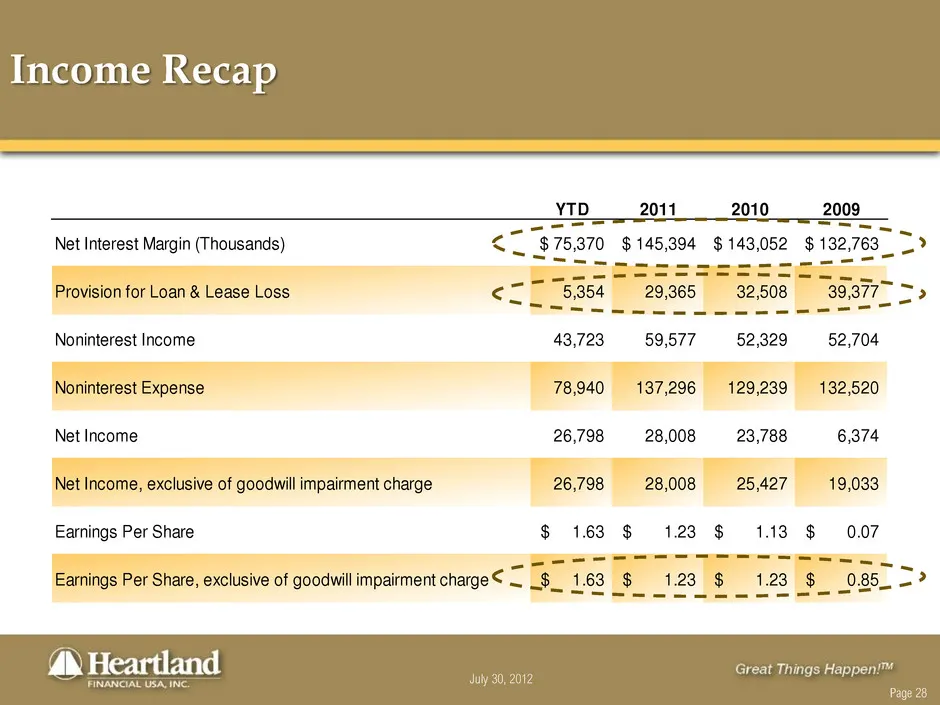
Slide 28: Income Recap
July 30, 2012 Page 28 Income Recap YTD 2011 2010 2009 Net Interest Margin (Thousands) 75,370$ 145,394$ 143,052$ 132,763$ Provision for Loan & Lease Loss 5,354 29,365 32,508 39,377 Noninterest Income 43,723 59,577 52,329 52,704 Noninterest Expense 78,940 137,296 129,239 132,520 Net Income 26,798 28,0
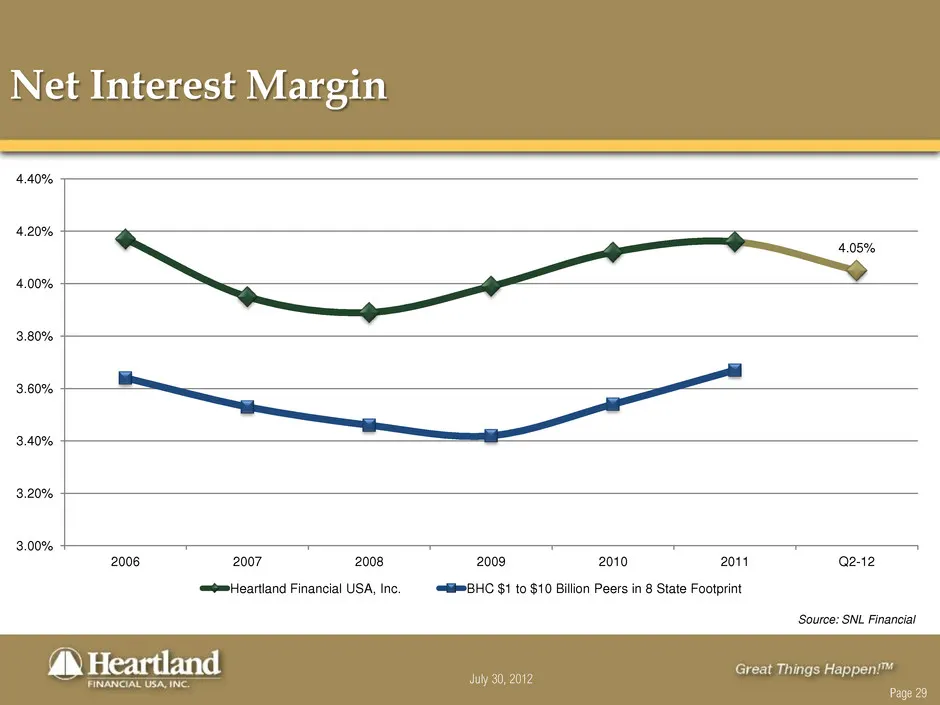
Slide 29: Net Interest Margin
July 30, 2012 Page 29 Net Interest Margin Source: SNL Financial 4.05% 3.00% 3.20% 3.40% 3.60% 3.80% 4.00% 4.20% 4.40% 2006 2007 2008 2009 2010 2011 Q2-12 Heartland Financial USA, Inc. BHC $1 to $10 Billion Peers in 8 State Footprint
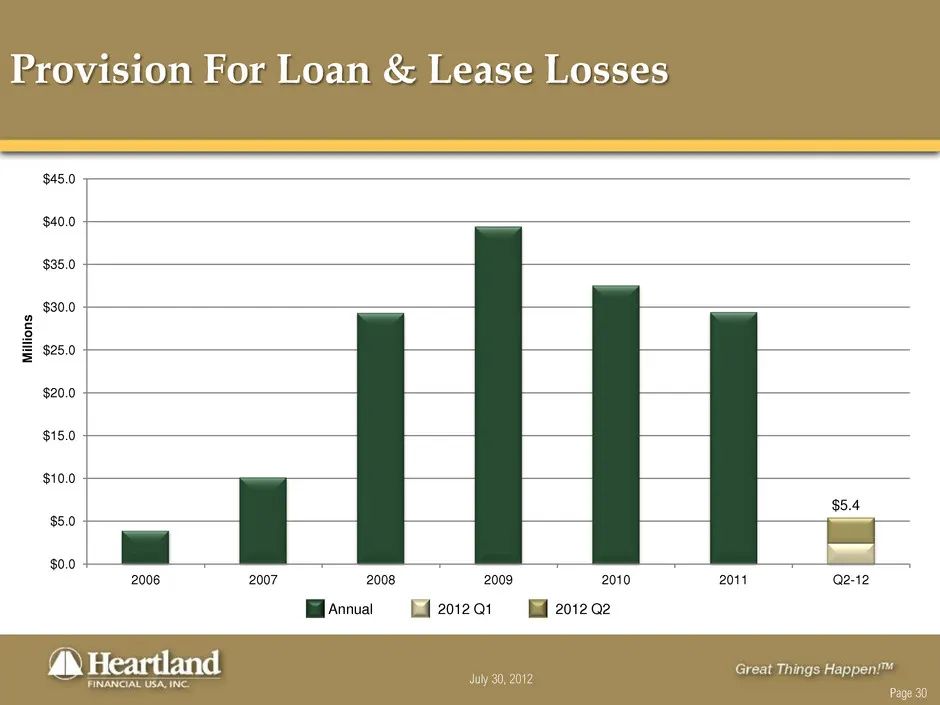
Slide 30: Provision For Loan & Lease Losses
July 30, 2012 Page 30 Provision For Loan & Lease Losses $0.0 $5.0 $10.0 $15.0 $20.0 $25.0 $30.0 $35.0 $40.0 $45.0 2006 2007 2008 2009 2010 2011 Q2-12 M ill io n s $5.4 Annual 2012 Q1 2012 Q2
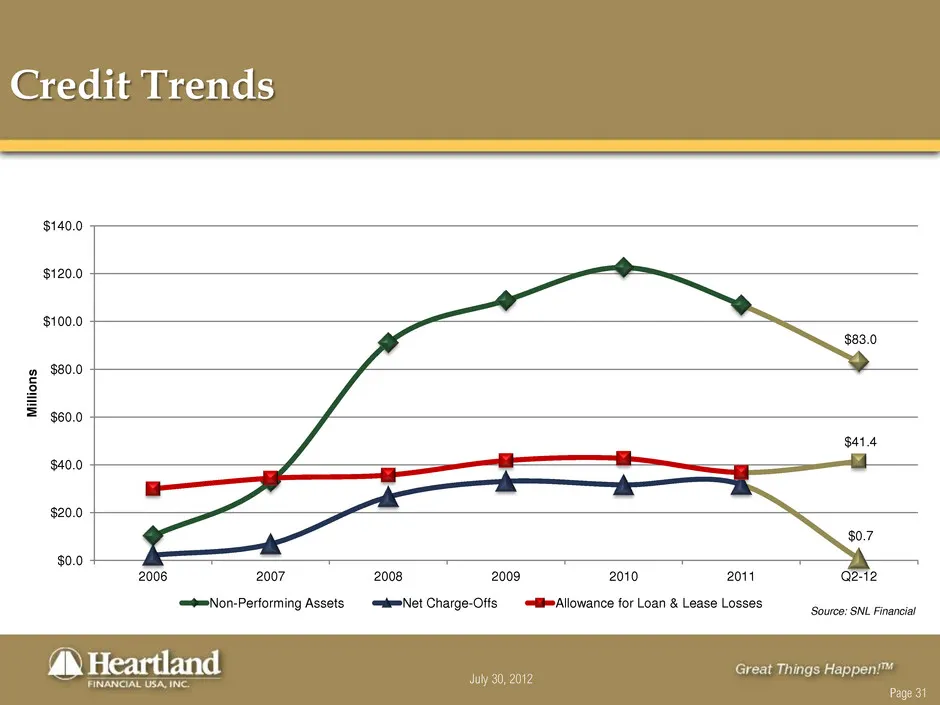
Slide 31: Credit Trends
July 30, 2012 Page 31 Credit Trends Source: SNL Financial $83.0 $0.7 $41.4 $0.0 $20.0 $40.0 $60.0 $80.0 $100.0 $120.0 $140.0 2006 2007 2008 2009 2010 2011 Q2-12 M ill io n s Non-Performing Assets Net Charge-Offs Allowance for Loan & Lease Losses
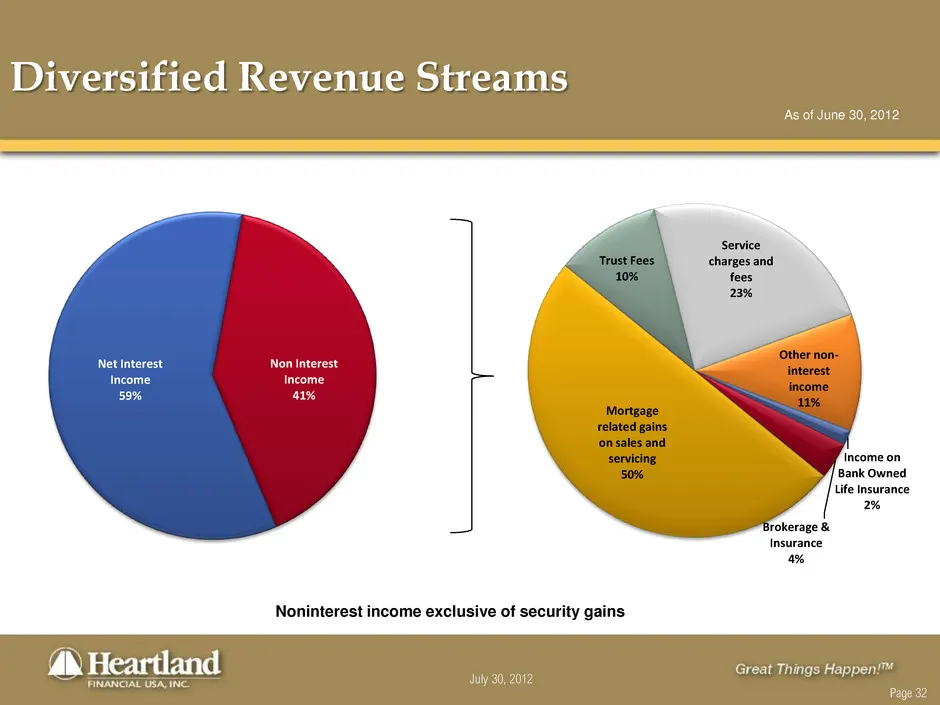
Slide 32: Diversified Revenue Streams
July 30, 2012 Page 32 Diversified Revenue Streams As of June 30, 2012 Noninterest income exclusive of security gains Income on Bank Owned Life Insurance 2% Brokerage & Insurance 4% Mortgage related gains on sales and servicing 50% Trust Fees 10% Service charges and fees 23% Other non- interest incom
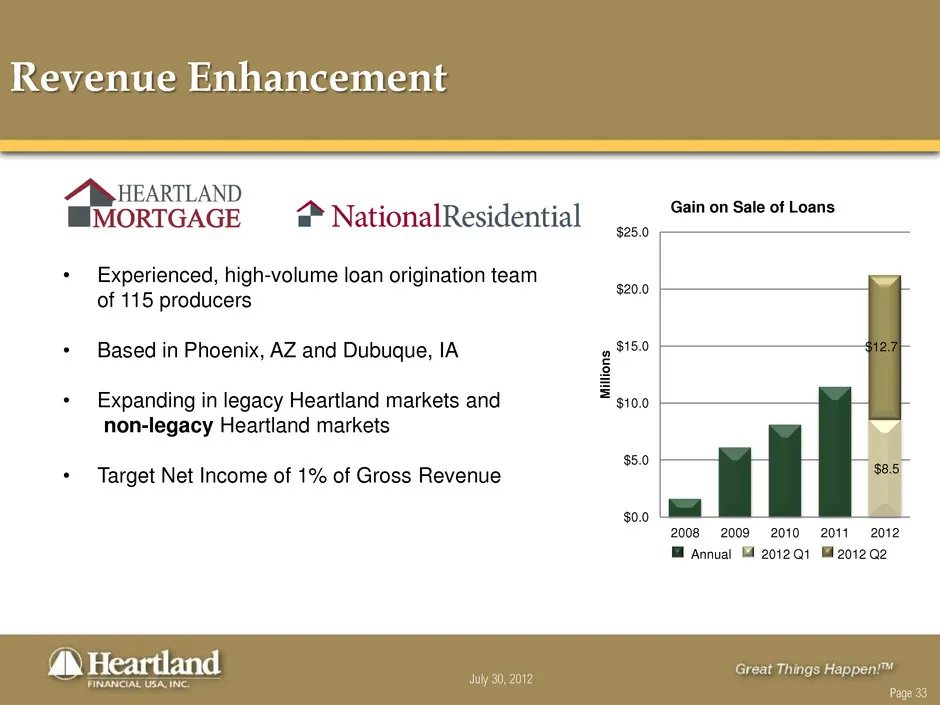
Slide 33: Revenue Enhancement: Mortgage
July 30, 2012 Page 33 Revenue Enhancement • Experienced, high-volume loan origination team of 115 producers • Based in Phoenix, AZ and Dubuque, IA • Expanding in legacy Heartland markets and non-legacy Heartland markets • Target Net Income of 1% of Gross Revenue $8.5 $12.7 $0.0 $5.0 $10.0 $15.0 $20.
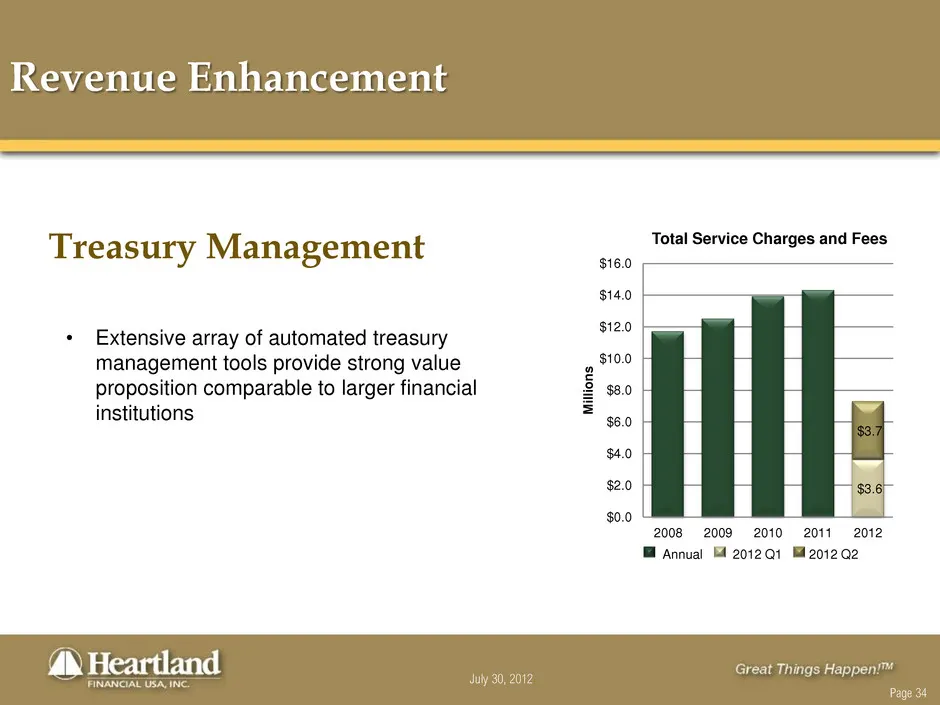
Slide 34: Revenue Enhancement: Treasury Management
July 30, 2012 Page 34 Revenue Enhancement Treasury Management • Extensive array of automated treasury management tools provide strong value proposition comparable to larger financial institutions $3.6 $3.7 $0.0 $2.0 $4.0 $6.0 $8.0 $10.0 $12.0 $14.0 $16.0 2008 2009 2010 2011 2012 M ill io n s Total S
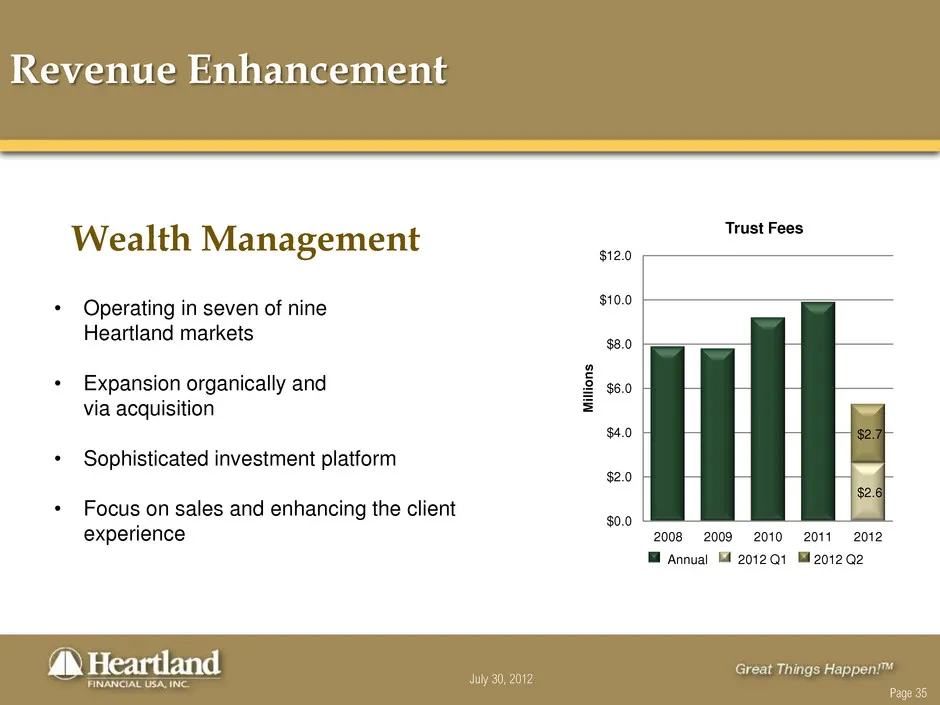
Slide 35: Revenue Enhancement: Wealth Management
July 30, 2012 Page 35 Revenue Enhancement • Operating in seven of nine Heartland markets • Expansion organically and via acquisition • Sophisticated investment platform • Focus on sales and enhancing the client experience Wealth Management $2.6 $2.7 $0.0 $2.0 $4.0 $6.0 $8.0 $10.0 $12.0 2008 2009 201
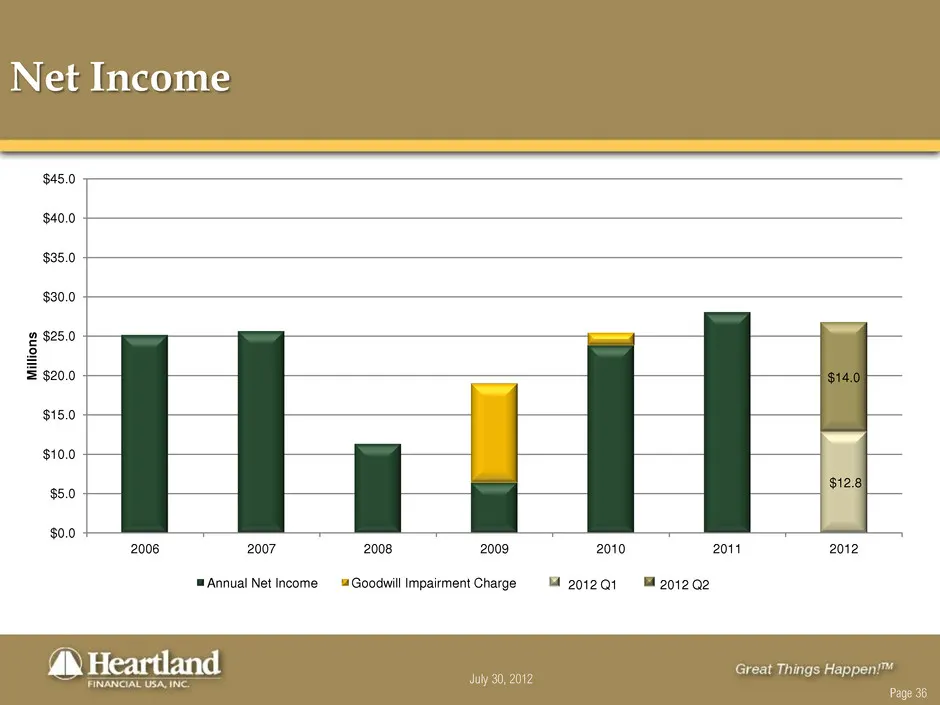
Slide 36: Net Income
July 30, 2012 Page 36 Net Income $12.8 $14.0 $0.0 $5.0 $10.0 $15.0 $20.0 $25.0 $30.0 $35.0 $40.0 $45.0 2006 2007 2008 2009 2010 2011 2012 M ill io n s Annual Net Income Goodwill Impairment Charge 2012 Q1 2012 Q2
Slide 37: Pre-Tax, Pre-Provision Earnings
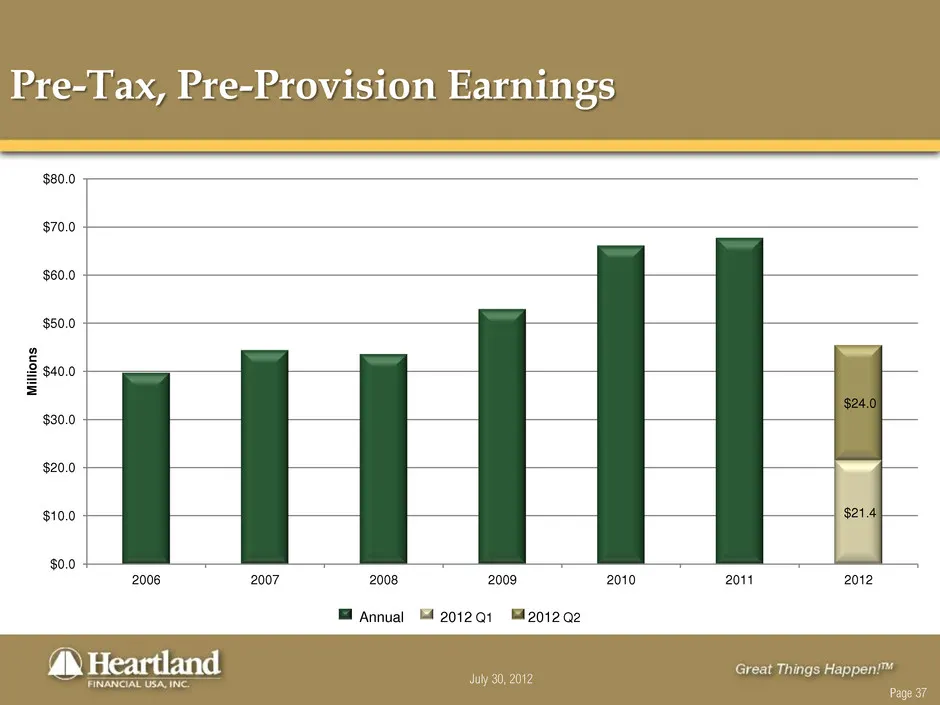
July 30, 2012 Page 37 Pre-Tax, Pre-Provision Earnings $21.4 $24.0 $0.0 $10.0 $20.0 $30.0 $40.0 $50.0 $60.0 $70.0 $80.0 2006 2007 2008 2009 2010 2011 2012 M ill io n s Annual 2012 Q1 2012 Q2
Slide 38: Efficiency Ratio
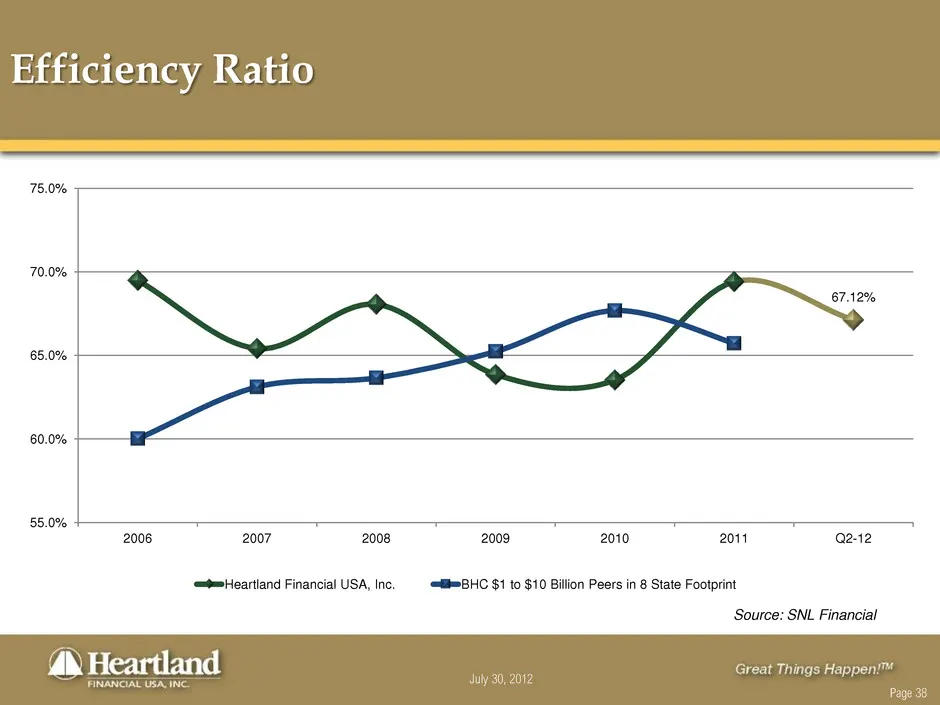
July 30, 2012 Page 38 Efficiency Ratio Source: SNL Financial 67.12% 55.0% 60.0% 65.0% 70.0% 75.0% 2006 2007 2008 2009 2010 2011 Q2-12 Heartland Financial USA, Inc. BHC $1 to $10 Billion Peers in 8 State Footprint
Slide 39: Restated Efficiency Ratio
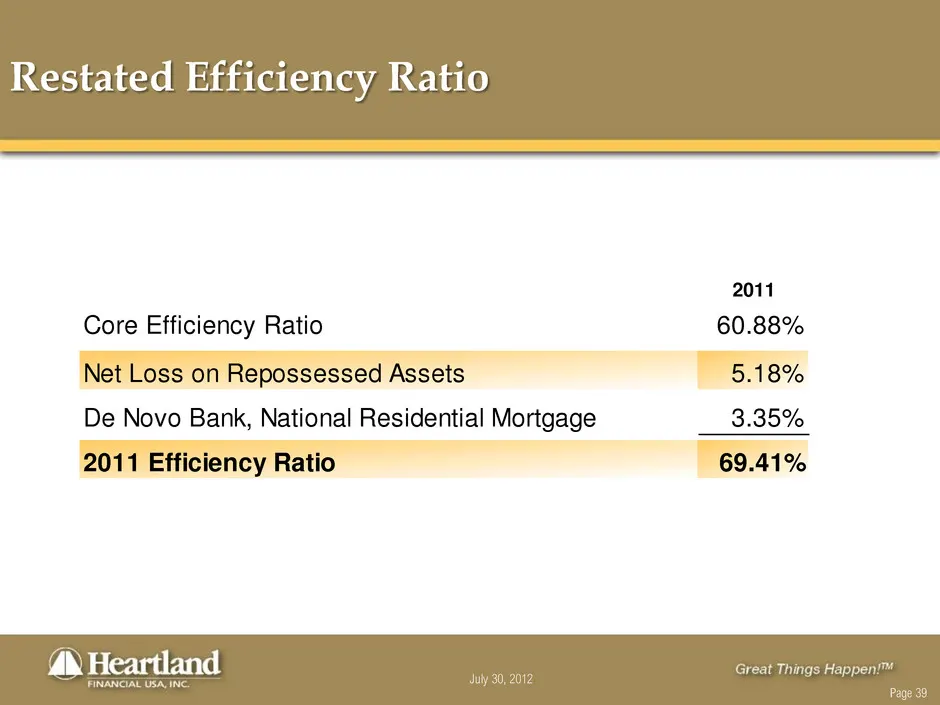
July 30, 2012 Page 39 Restated Efficiency Ratio 2011 Core Efficiency Ratio 60.88% Net Loss on Repossessed Assets 5.18% De Novo Bank, National Residential Mortgage 3.35% 2011 Efficiency Ratio 69.41%
Slide 40: ROAE
July 30, 2012 Page 40 ROAE 18.28% 0.00% 2.00% 4.00% 6.00% 8.00% 10.00% 12.00% 14.00% 16.00% 18.00% 20.00% 2006 2007 2008 2009 2010 2011 Q2-12
Slide 41: Investment Summary
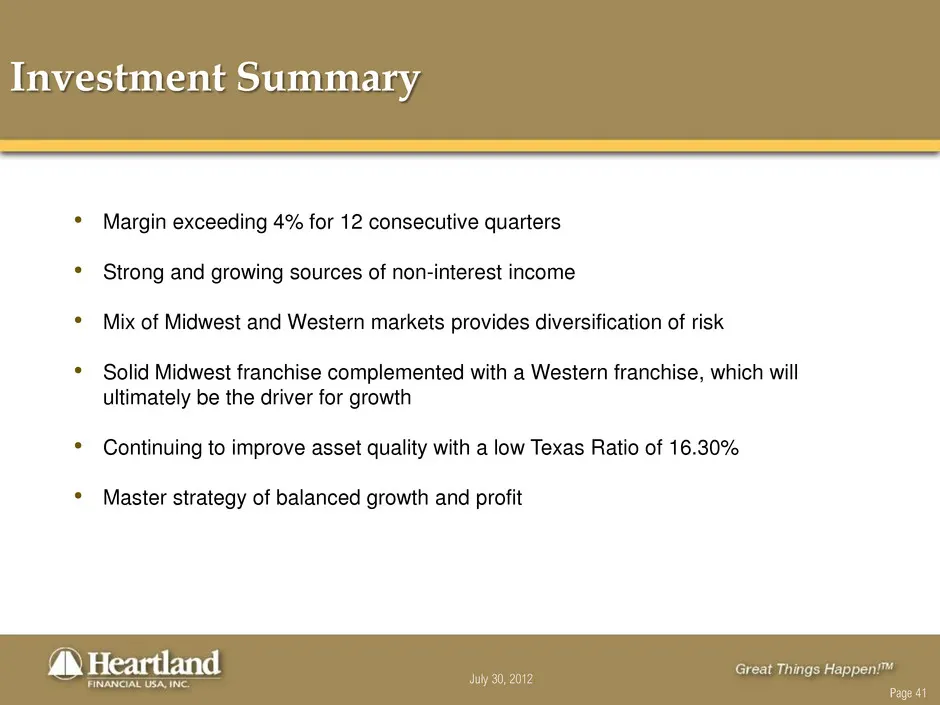
July 30, 2012 Page 41 Investment Summary • Margin exceeding 4% for 12 consecutive quarters • Strong and growing sources of non-interest income • Mix of Midwest and Western markets provides diversification of risk • Solid Midwest franchise complemented with a Western franchise, which will ultimately

Slide 42: 1398 Central Avenue, Dubuque, IA
1398 Central Avenue Dubuque, IA 52001 563.589.2100
Source: SEC EDGAR · 8-K filed Aug 3, 2012
More decks from Heartland Financial USA Inc
 Merger or Acquisition (July 2024)6 slides · Jul 31, 2024
 Merger or Acquisition (May 2024)6 slides · May 2, 2024
 Merger or Acquisition (May 2024)27 slides · May 2, 2024
 Q4 2023 Earnings Presentation54 slides · Feb 13, 2024
 Q4 2023 Earnings Presentation35 slides · Jan 29, 2024
 Q3 2023 Earnings Presentation55 slides · Nov 15, 2023