Snap Inc. · NYSE:SNAP
Snap — Investor Presentation (August 2022)
21 slides from Snap's investor presentation, August 2022

Slide 1: Investor Update
Snap Inc. Investor Update August 2022
Slide 2: Disclaimers
2 Disclaimers Note Regarding User Metrics and Other Data We define a Daily Active User, or DAU, as a registered Snapchat user who opens the Snapchat application at least once during a defined 24-hour period. We calculate average DAUs for a particular quarter by adding the number of DAUs on each day of
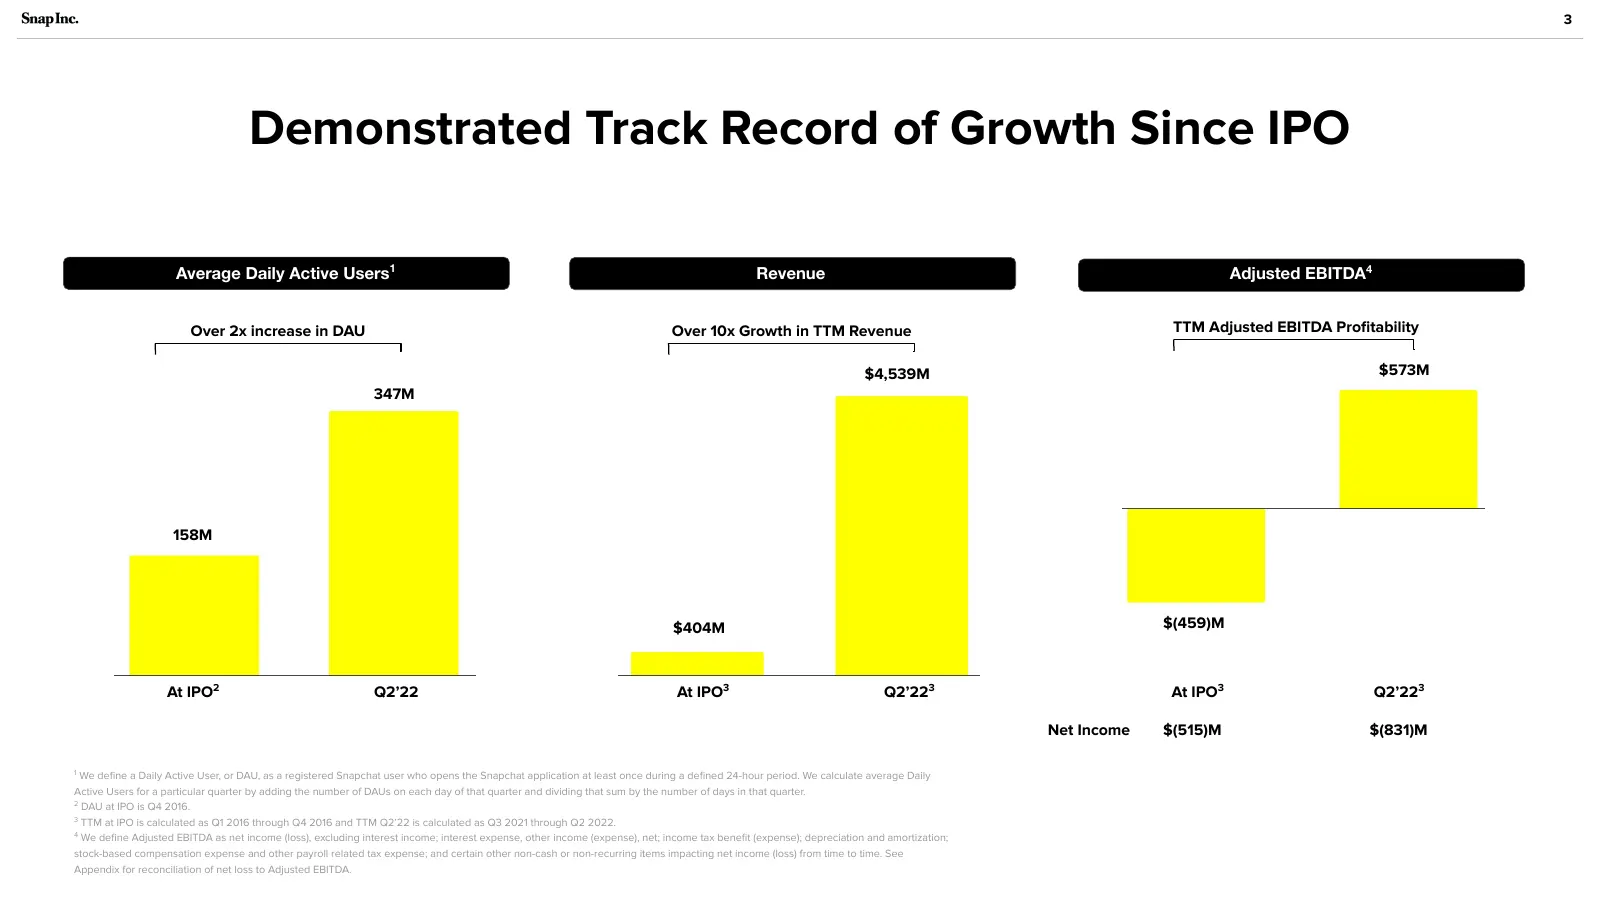
Slide 3: Demonstrated Track Record of Growth Since IPO
3 Demonstrated Track Record of Growth Since IPO Revenue Average Daily Active Users1 Revenue Revenue Revenue Adjusted EBITDA4 Over 2x increase in DAU Over 10x Growth in TTM Revenue TTM Adjusted EBITDA Profitability $4,539M $573M 347M 158M $404M $(459)M At IPO2 Q2’22 At IPO3 Q2’223 At IPO3 Q2’223 Net I
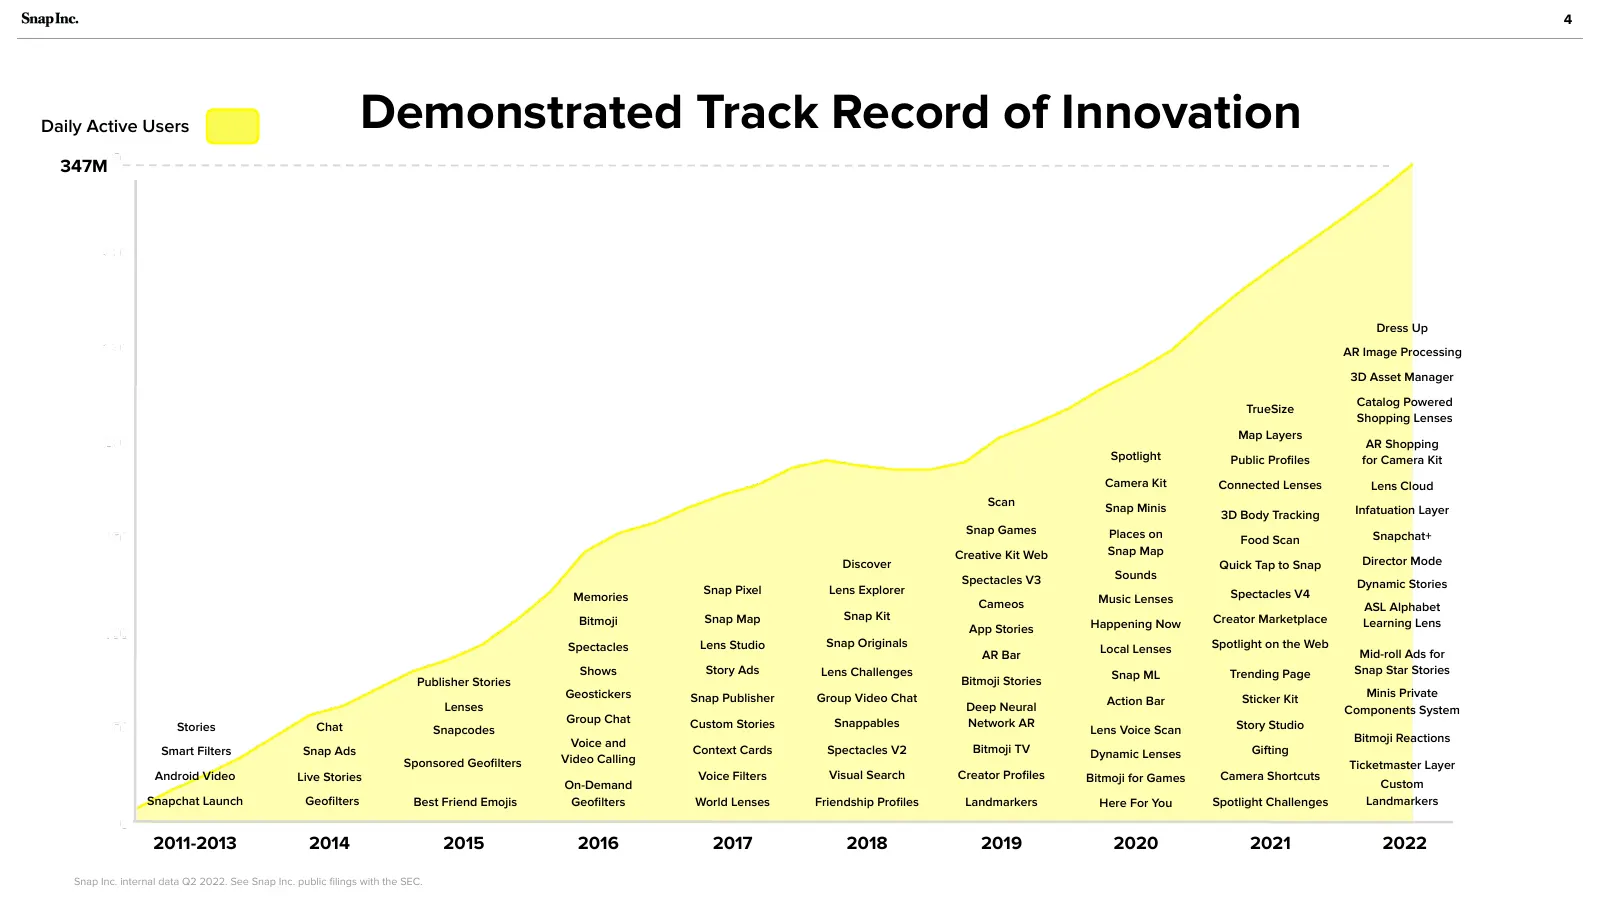
Slide 4: Demonstrated Track Record of Innovation
4 Daily Active Users Demonstrated Track Record of Innovation 347M Dress Up AR Image Processing 3D Asset Manager Catalog Powered TrueSize Shopping Lenses Map Layers AR Shopping Spotlight Public Profiles for Camera Kit Camera Kit Connected Lenses Lens Cloud Scan Snap Minis Infatuation Layer 3D Body Tra
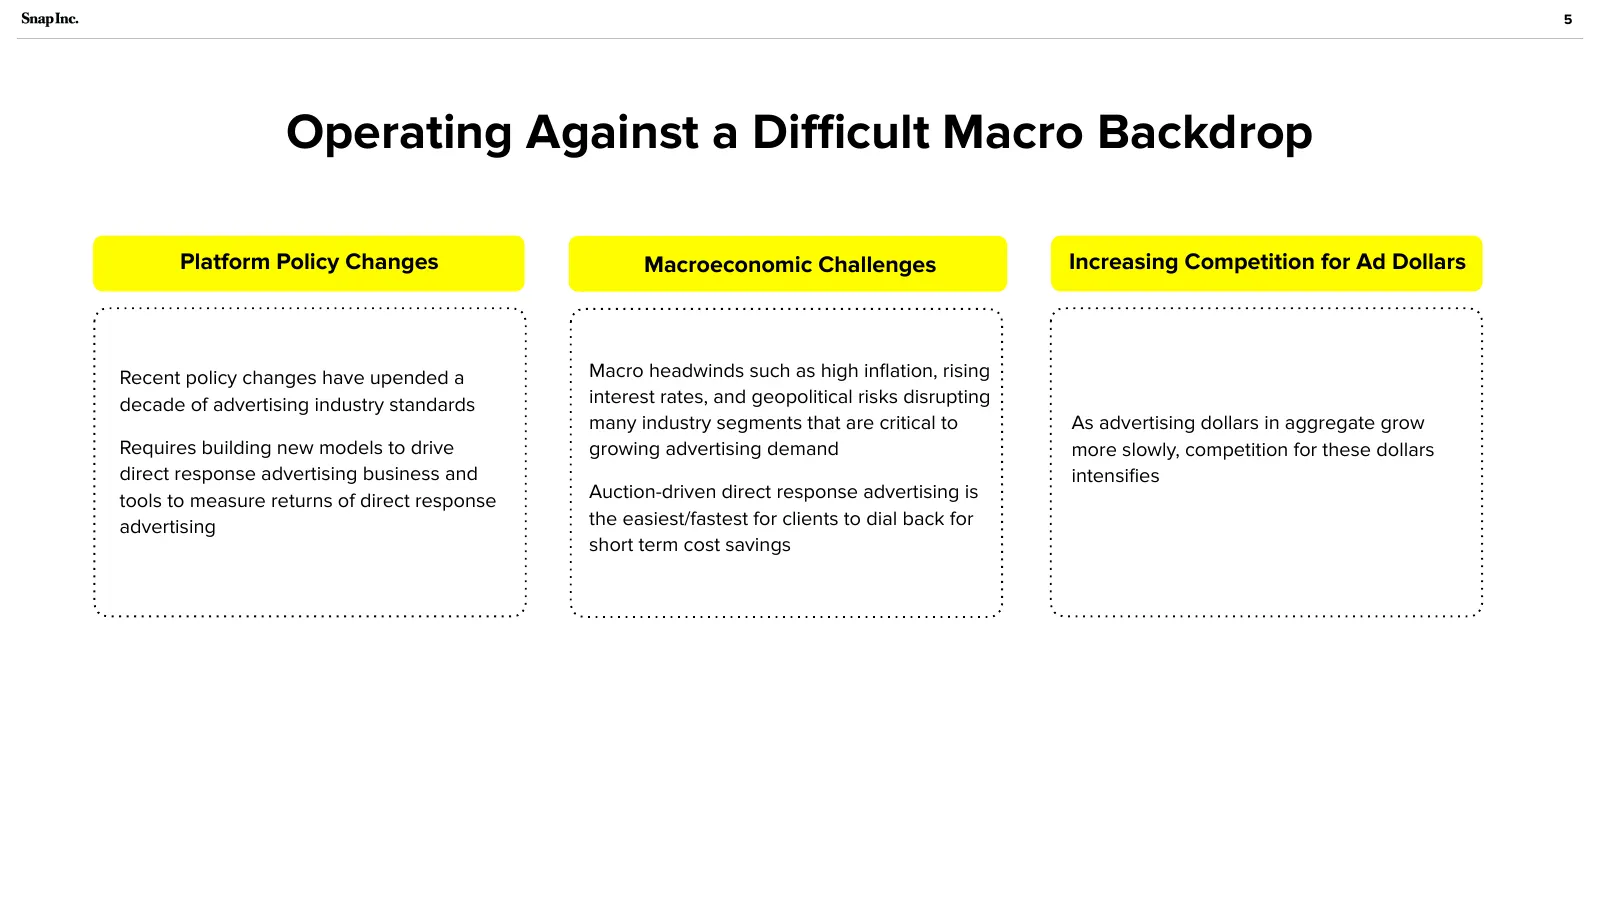
Slide 5: Operating Against a Difficult Macro Backdrop
5 Operating Against a Difficult Macro Backdrop Platform Policy Changes Macroeconomic Challenges Increasing Competition for Ad Dollars Recent policy changes have upended a Macro headwinds such as high inflation, rising decade of advertising industry standards interest rates, and geopolitical risks disru
Slide 6: Focused Investment to Drive Long-Term Growth
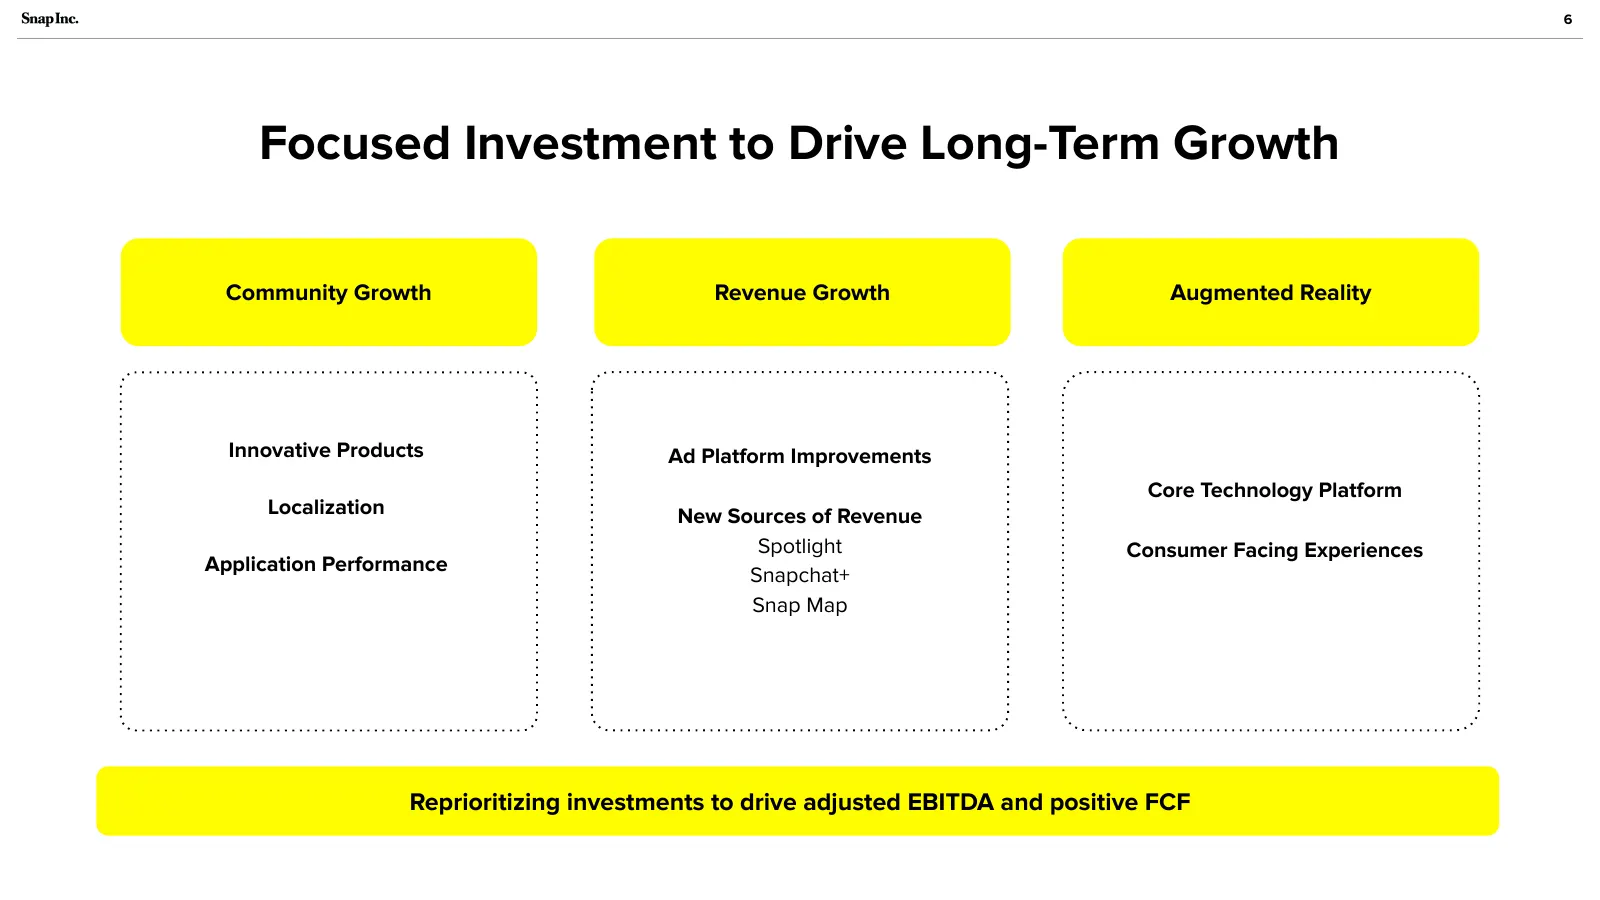
6 Focused Investment to Drive Long-Term Growth Community Growth Revenue Growth Augmented Reality Innovative Products Ad Platform Improvements Core Technology Platform Localization New Sources of Revenue Spotlight Consumer Facing Experiences Application Performance Snapchat+ Snap Map Reprioritizing i
Slide 7: Reprioritizing Investments
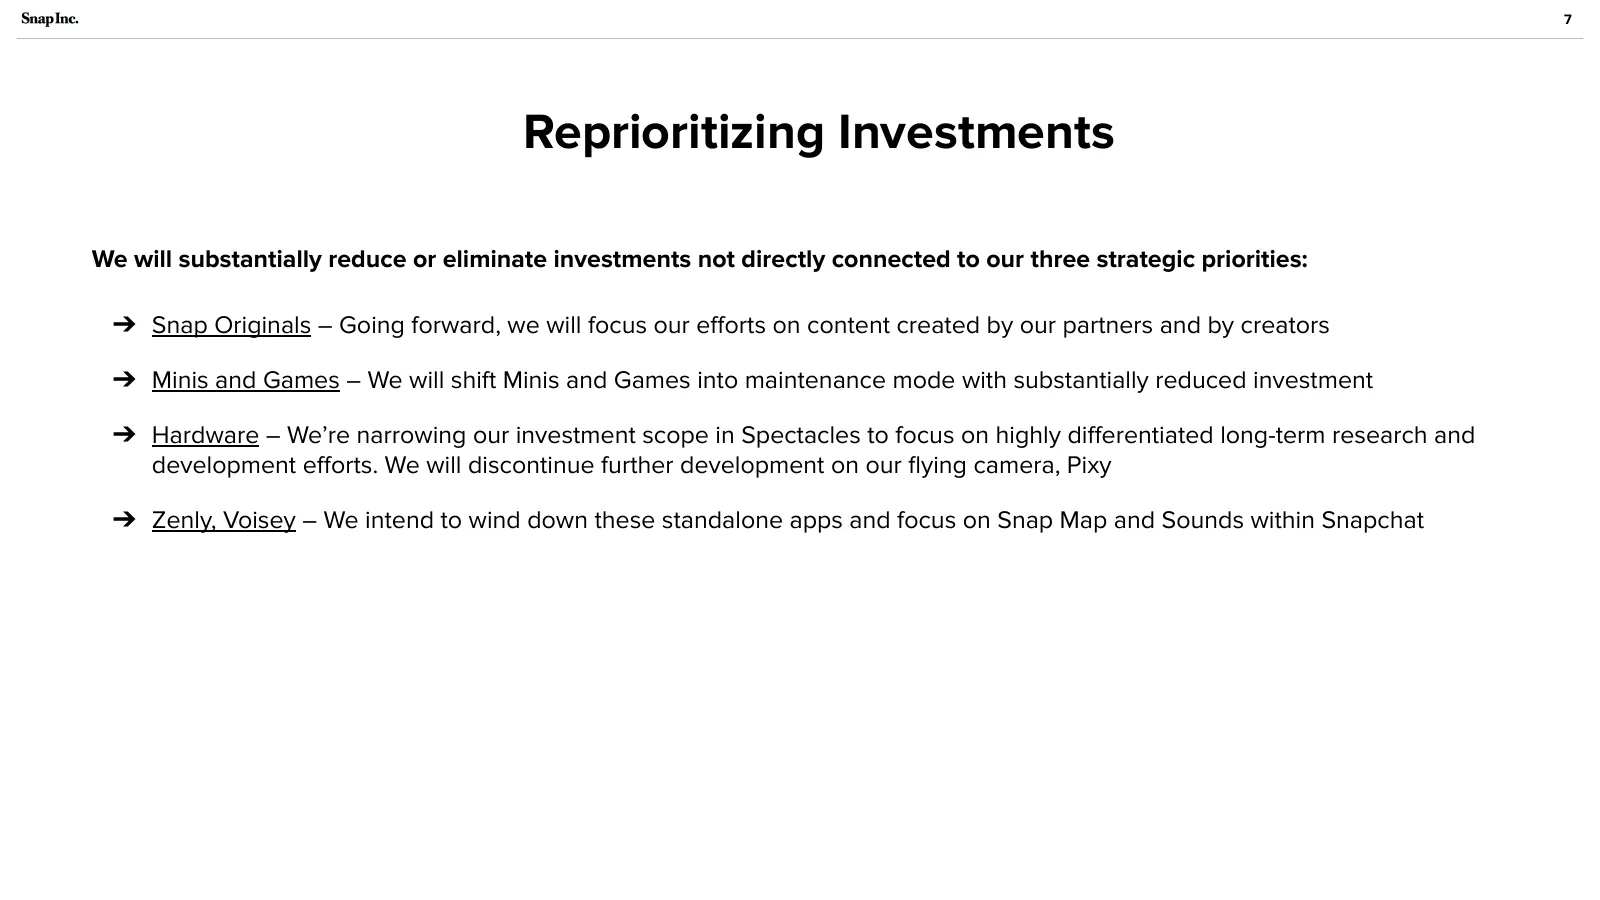
7 Reprioritizing Investments We will substantially reduce or eliminate investments not directly connected to our three strategic priorities: ➔ Snap Originals – Going forward, we will focus our efforts on content created by our partners and by creators ➔ Minis and Games – We will shift Minis and Games
Slide 8: Productive Investment in our Strategic Priorities
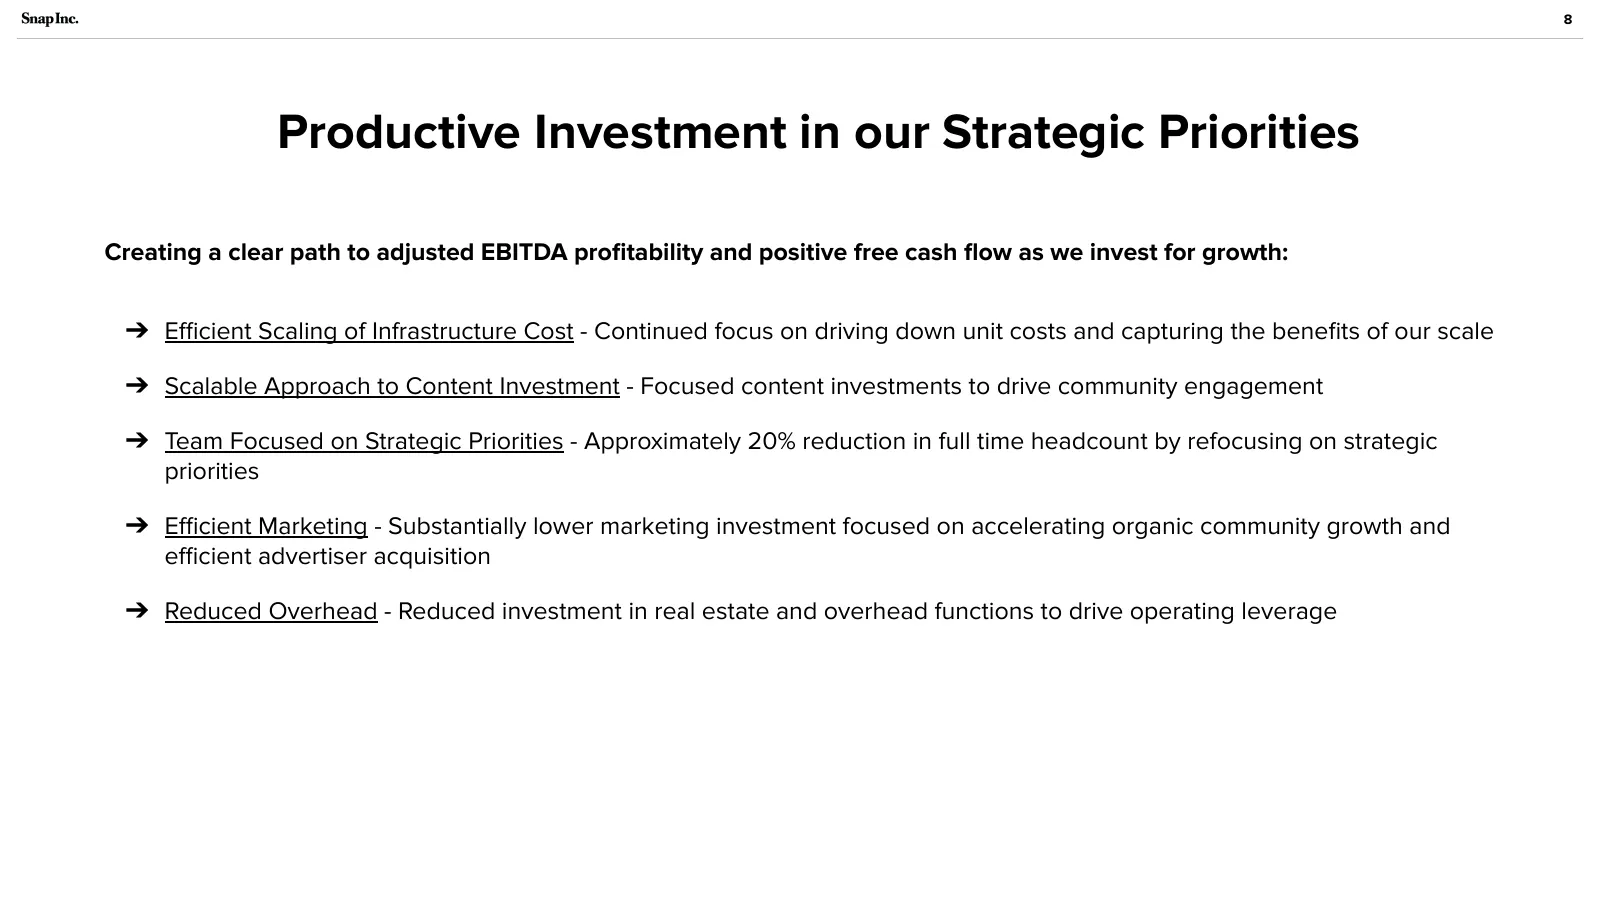
8 Productive Investment in our Strategic Priorities Creating a clear path to adjusted EBITDA profitability and positive free cash flow as we invest for growth: ➔ Efficient Scaling of Infrastructure Cost - Continued focus on driving down unit costs and capturing the benefits of our scale ➔ Scalable Approa
Slide 9: Path to Profitability and Positive Free Cash Flow
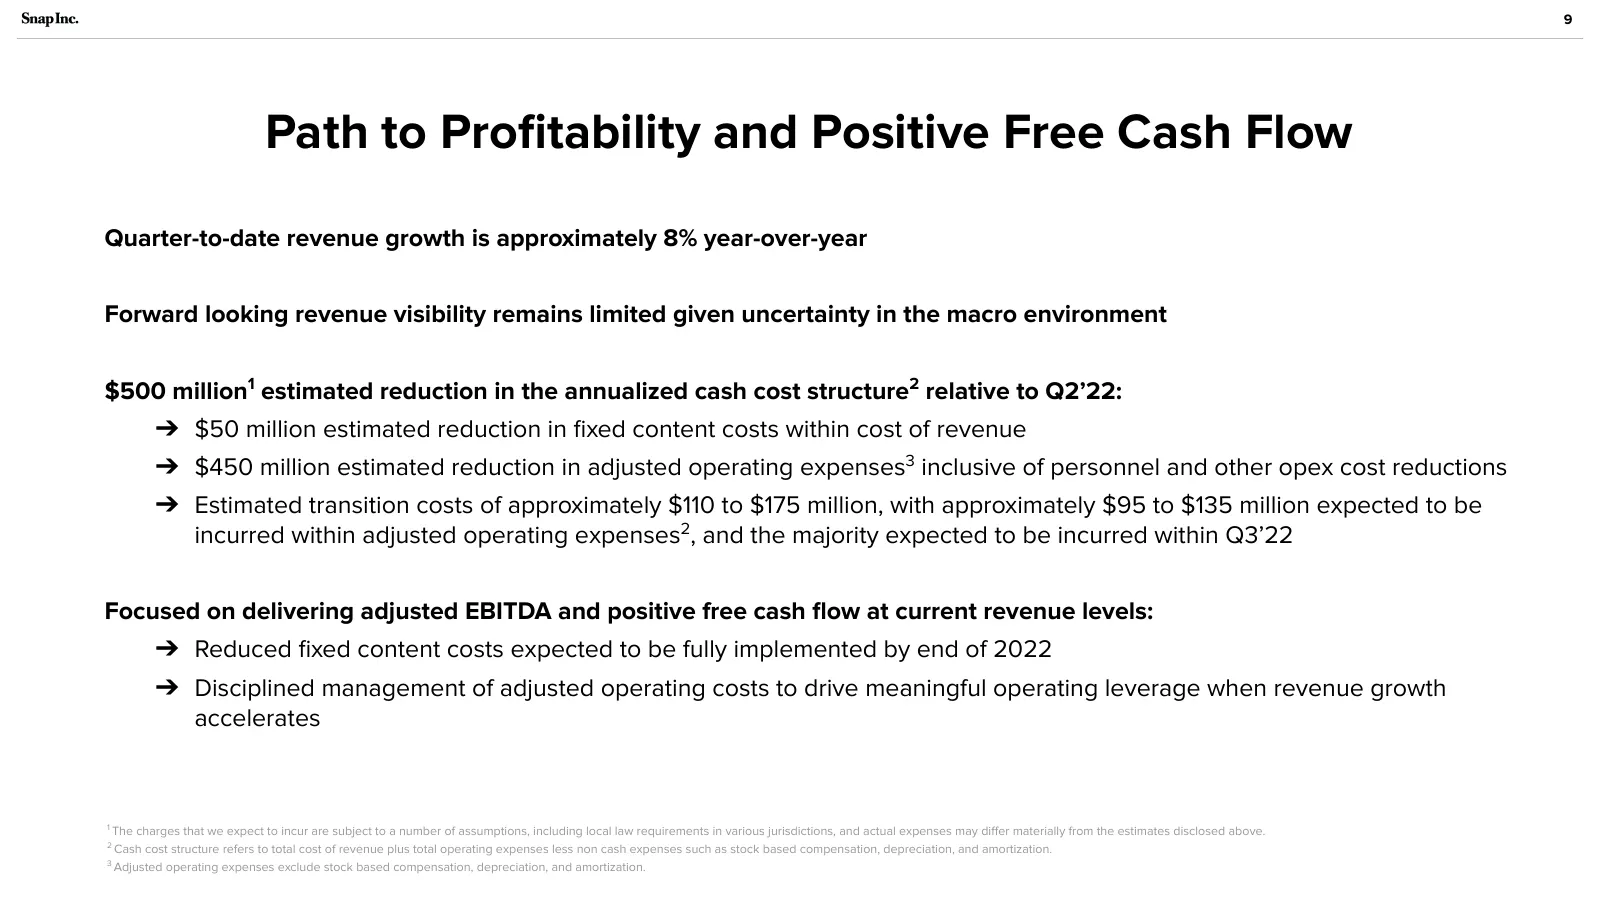
9 Path to Profitability and Positive Free Cash Flow Quarter-to-date revenue growth is approximately 8% year-over-year Forward looking revenue visibility remains limited given uncertainty in the macro environment $500 million1 estimated reduction in the annualized cash cost structure2 relative to Q2’2
Slide 10: Stock-Based Compensation & Dilution Management Strategy
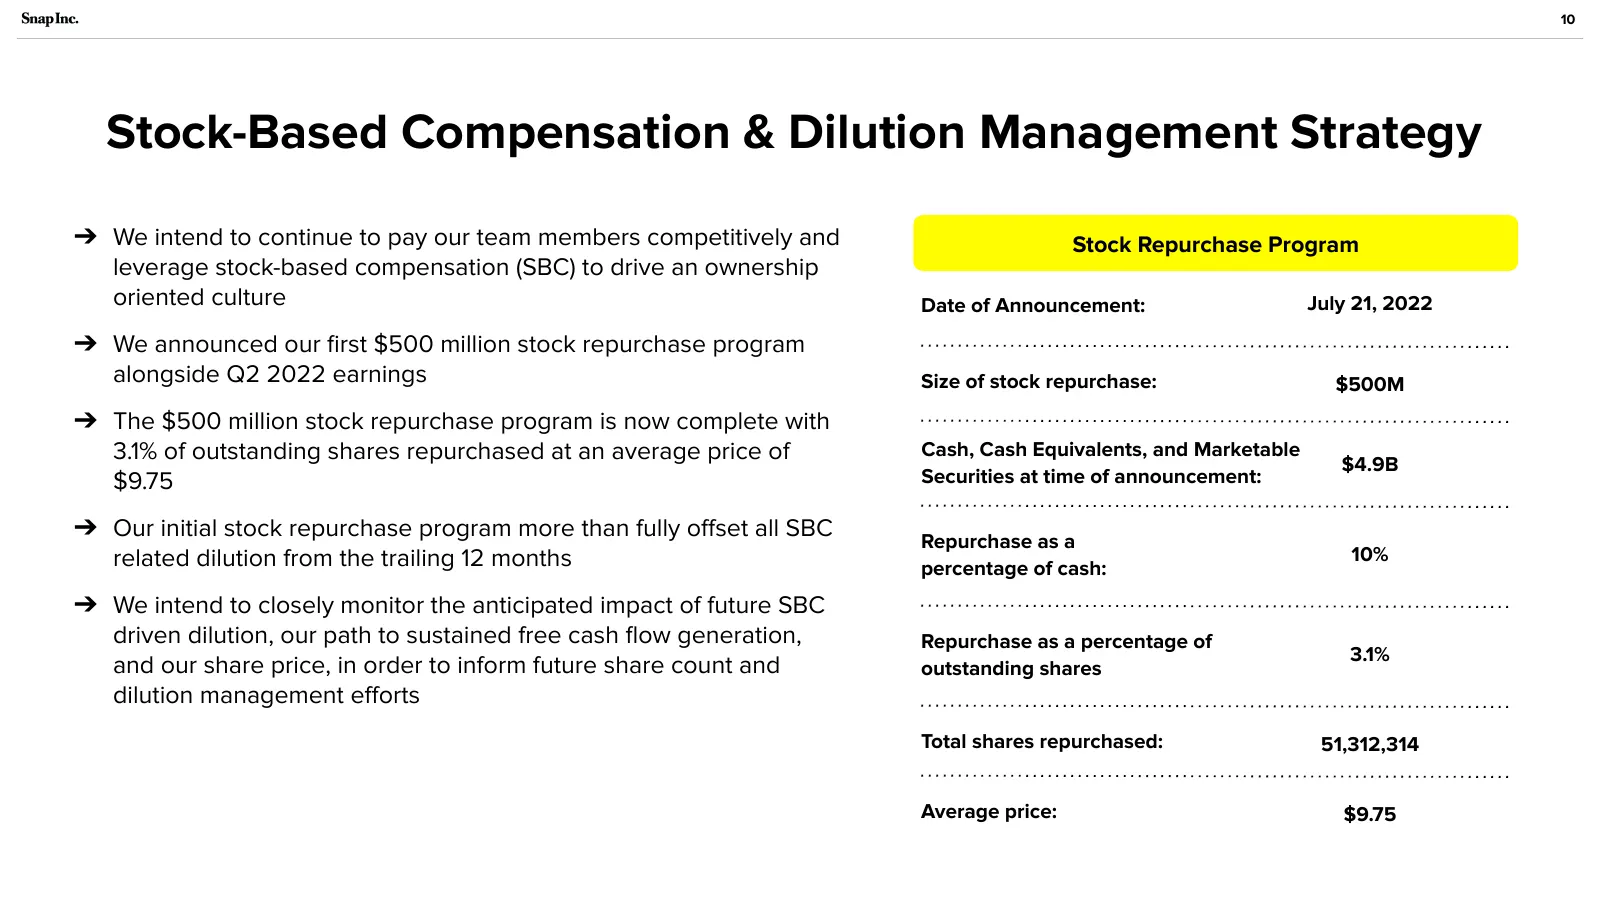
10 Stock-Based Compensation & Dilution Management Strategy ➔ We intend to continue to pay our team members competitively and Stock Repurchase Program leverage stock-based compensation (SBC) to drive an ownership oriented culture Date of Announcement: July 21, 2022 ➔ We announced our first $500 millio
Slide 11: The Opportunity Ahead
The Opportunity Ahead
Slide 12: Building Blocks to Accelerate Revenue Growth
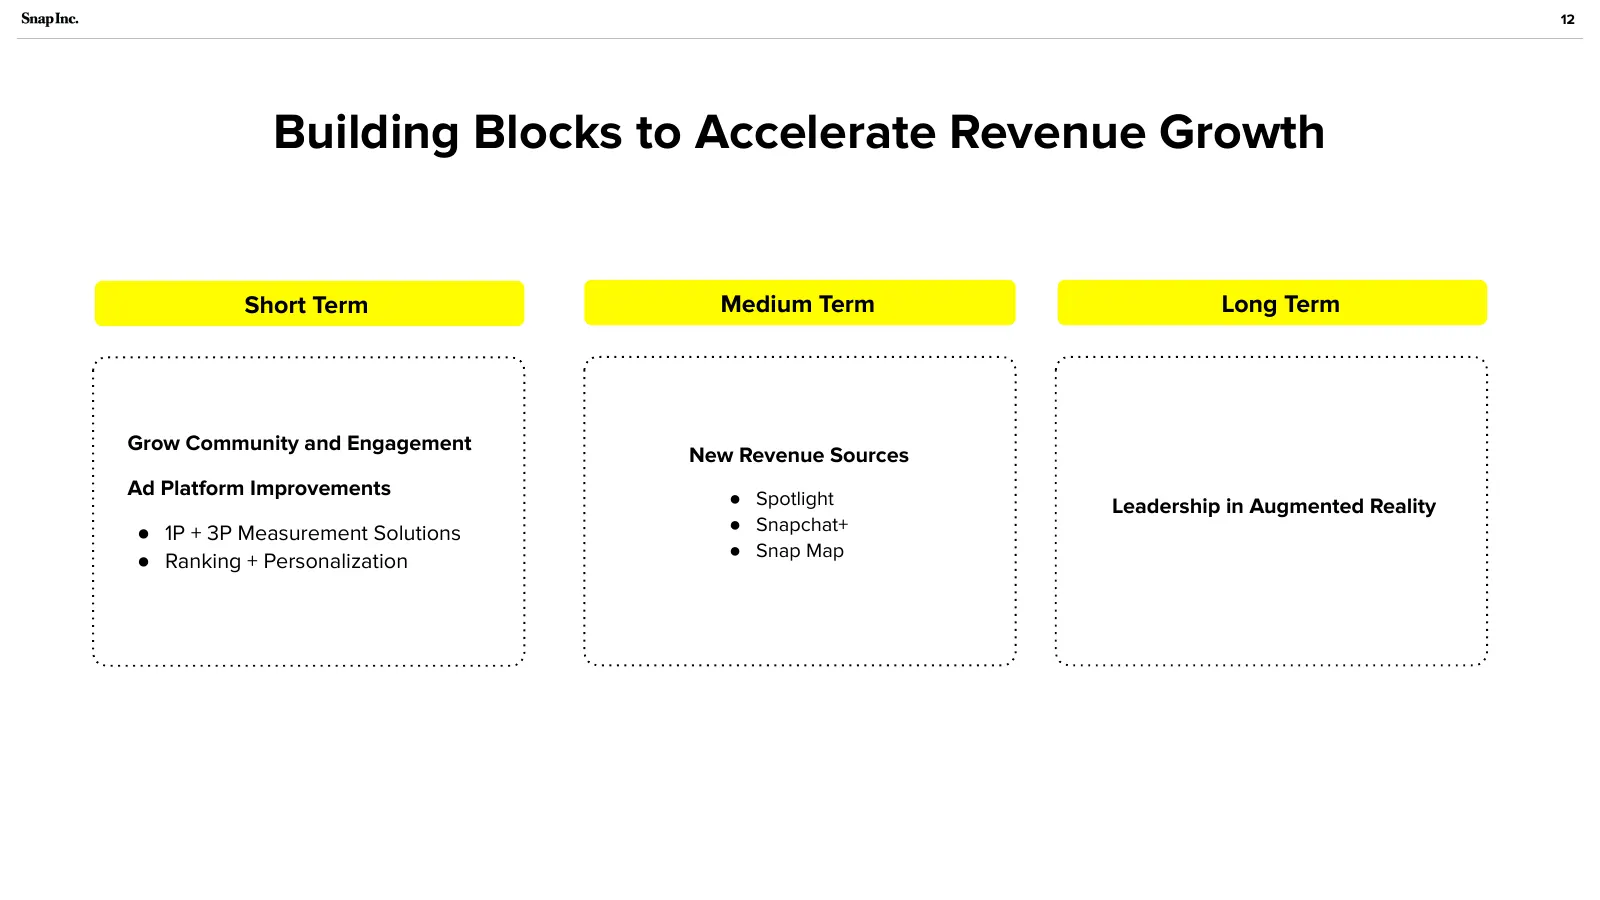
12 Building Blocks to Accelerate Revenue Growth Short Term Medium Term Long Term Grow Community and Engagement New Revenue Sources Ad Platform Improvements ● Spotlight Leadership in Augmented Reality ● 1P + 3P Measurement Solutions ● Snapchat+ ● Snap Map ● Ranking + Personalization
Slide 13: Significant Opportunity to Expand Our Community
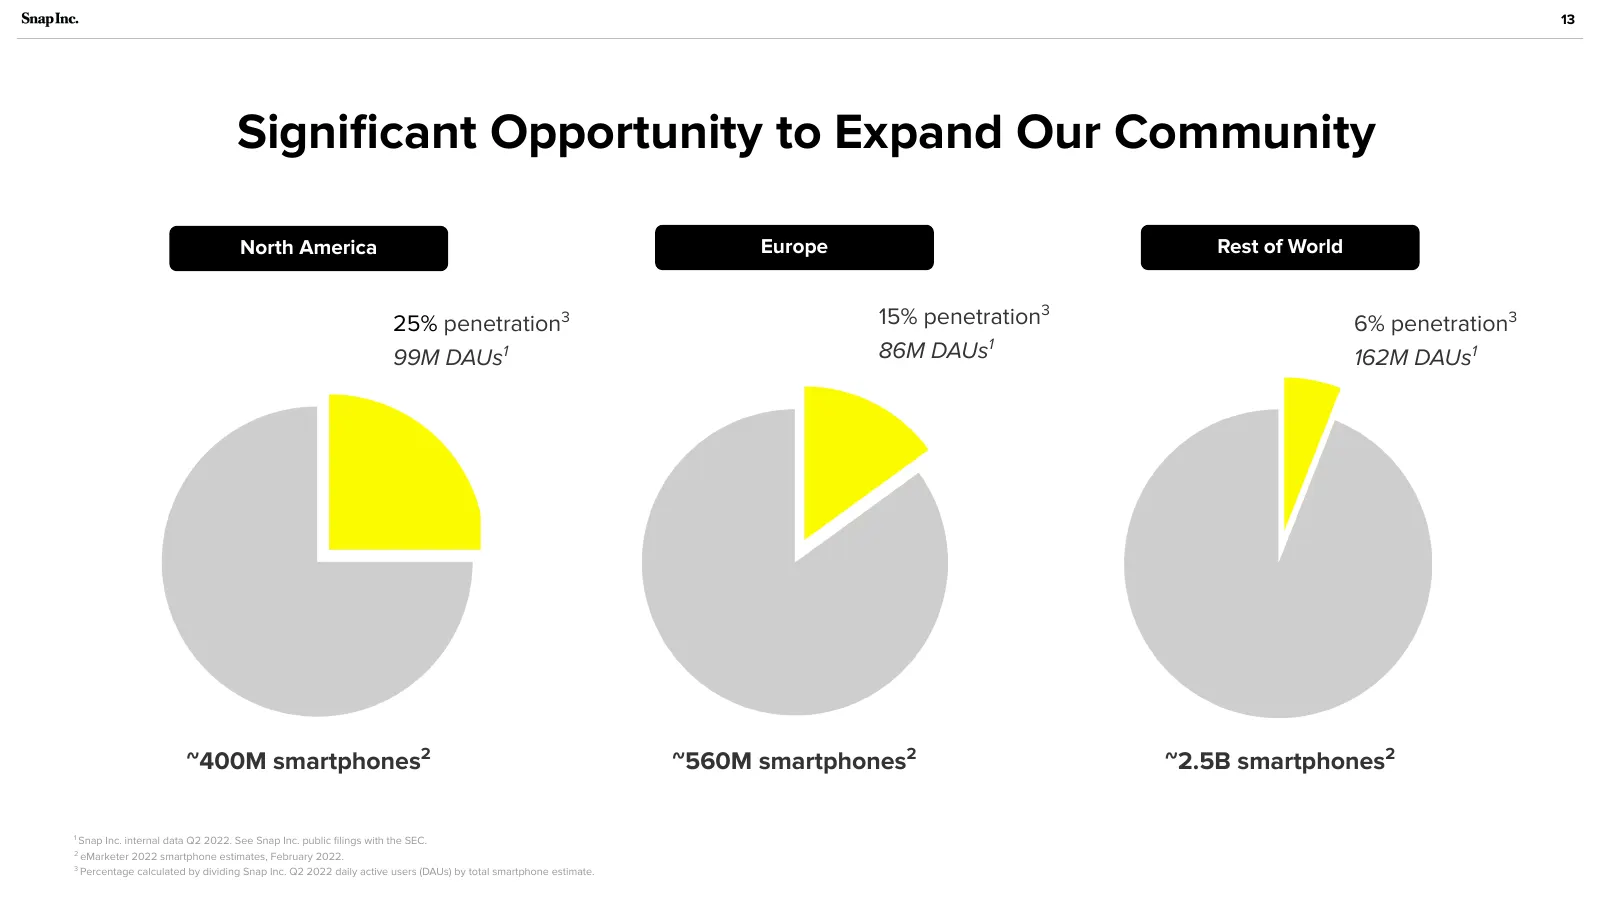
13 Significant Opportunity to Expand Our Community North America Europe Rest of World 25% penetration 3 15% penetration3 6% penetration3 99M DAUs1 86M DAUs1 162M DAUs1 ~400M smartphones2 ~560M smartphones2 ~2.5B smartphones2 1 Snap Inc. internal data Q2 2022. See Snap Inc. public filings with the SEC.
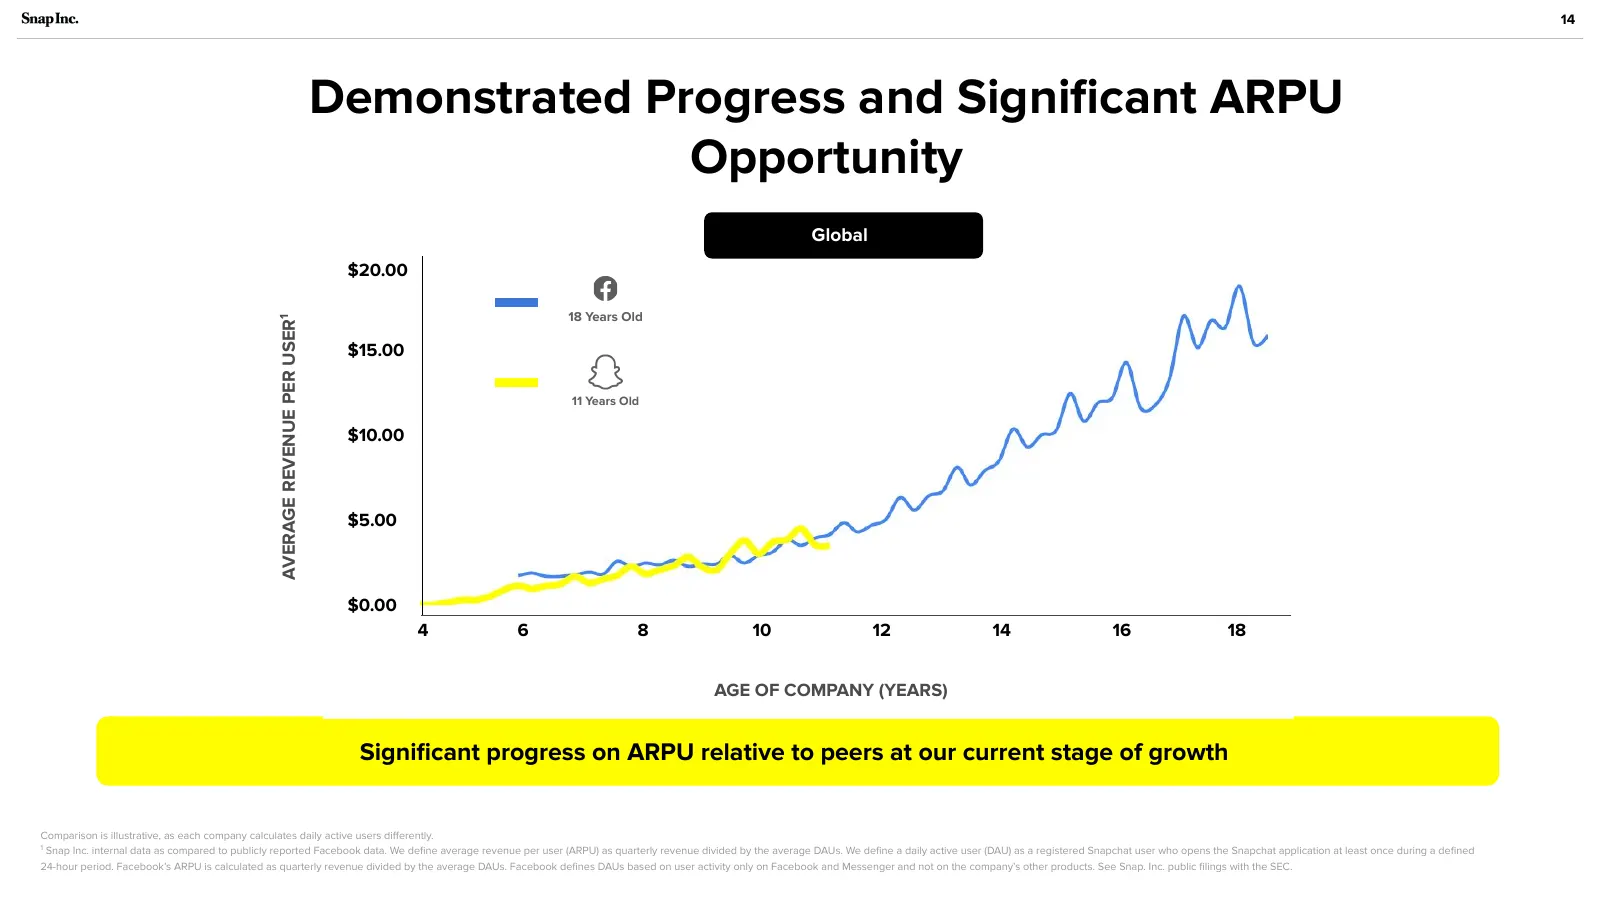
Slide 14: Demonstrated Progress and Significant ARPU Opportunity
14 Demonstrated Progress and Significant ARPU Opportunity Global $20.00 18 Years Old AVERAGE REVENUE PER USER1 $15.00 11 Years Old $10.00 $5.00 $0.00 4 6 8 10 12 14 16 18 AGE OF COMPANY (YEARS) Significant progress on ARPU relative to peers at our current stage of growth Comparison is illustrative, as
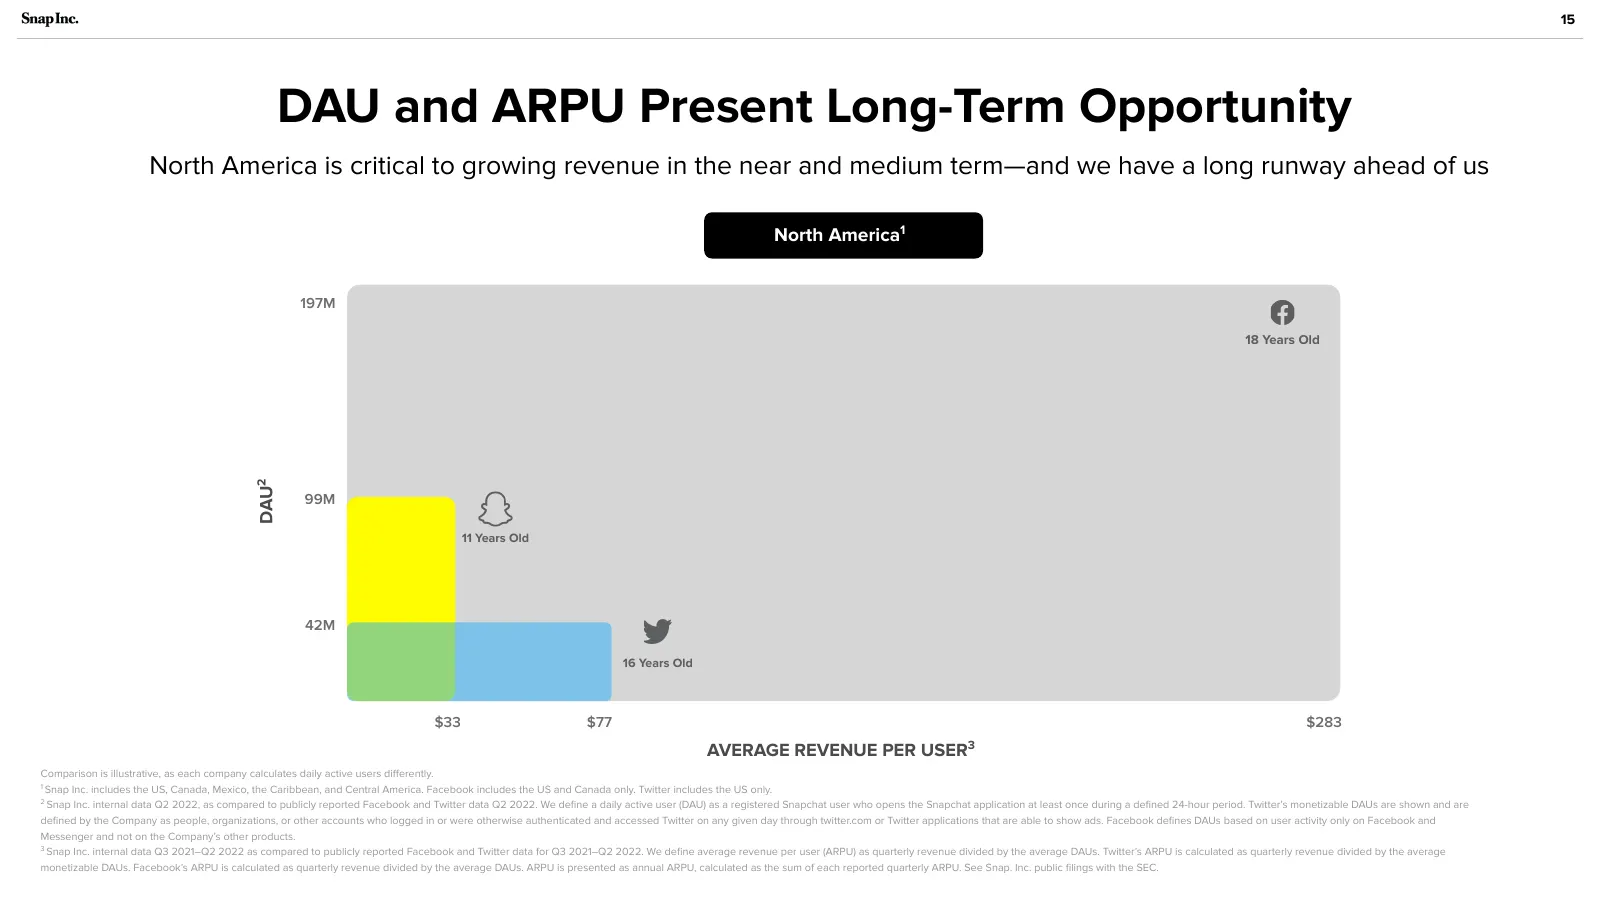
Slide 15: DAU and ARPU Present Long-Term Opportunity
15 DAU and ARPU Present Long-Term Opportunity North America is critical to growing revenue in the near and medium term—and we have a long runway ahead of us North America1 197M 18 Years Old 16 years old DAU2 99M 11 Years Old 42M 16 Years Old $33 $77 $283 AVERAGE REVENUE PER USER3 Comparison is illus
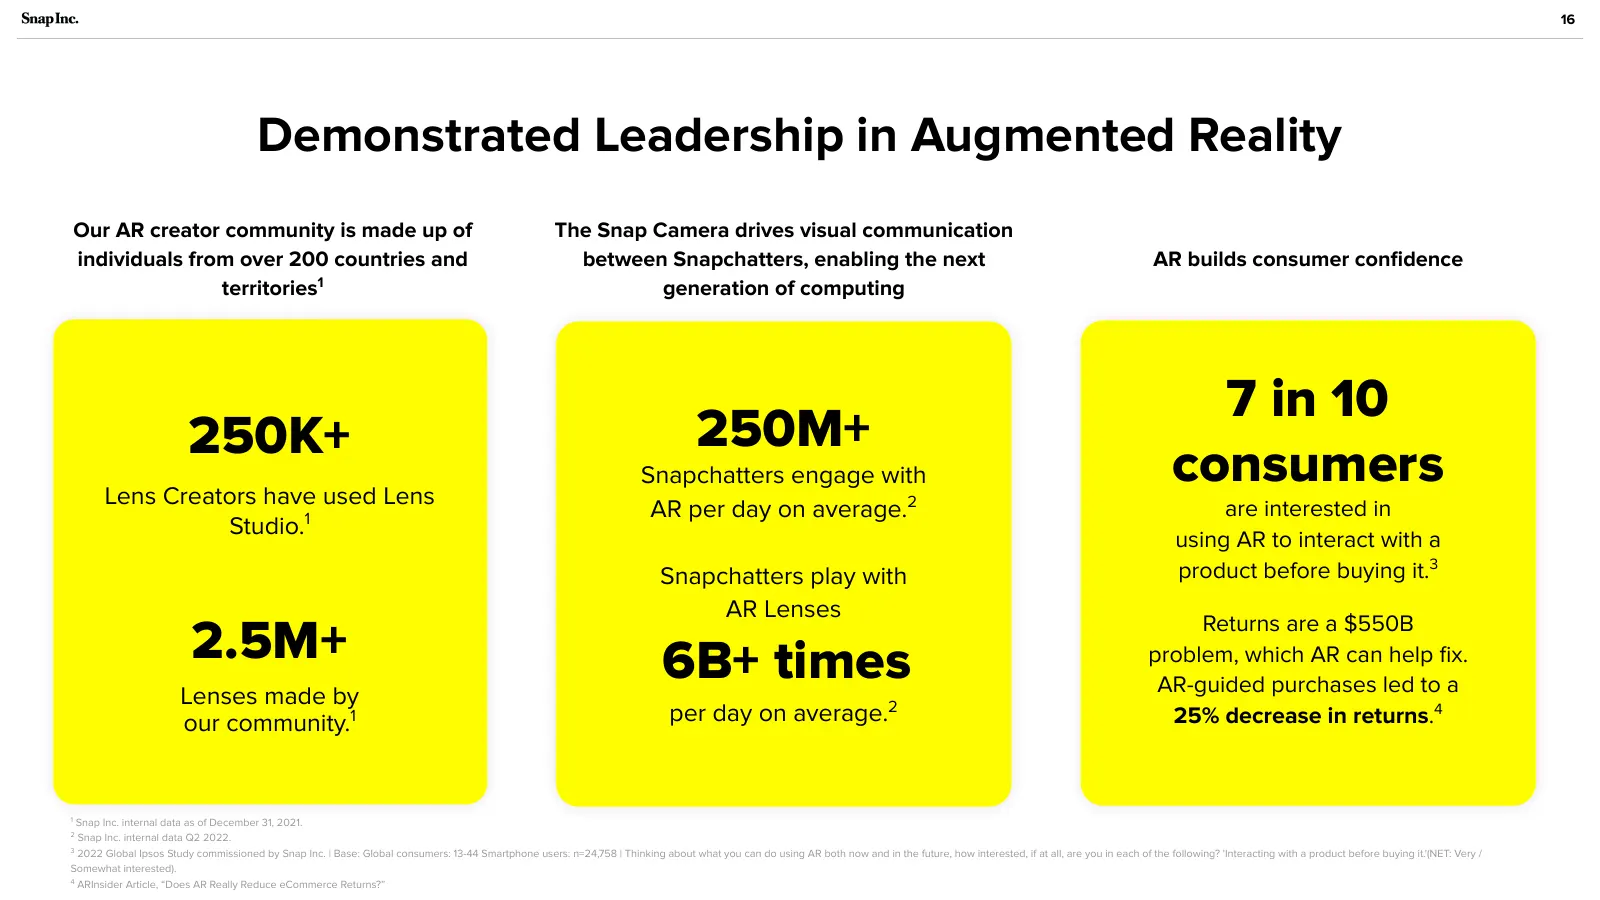
Slide 16: Demonstrated Leadership in Augmented Reality
16 Demonstrated Leadership in Augmented Reality Our AR creator community is made up of The Snap Camera drives visual communication individuals from over 200 countries and between Snapchatters, enabling the next AR builds consumer confidence territories1 generation of computing 7 in 10 250K+ 250M+ Len
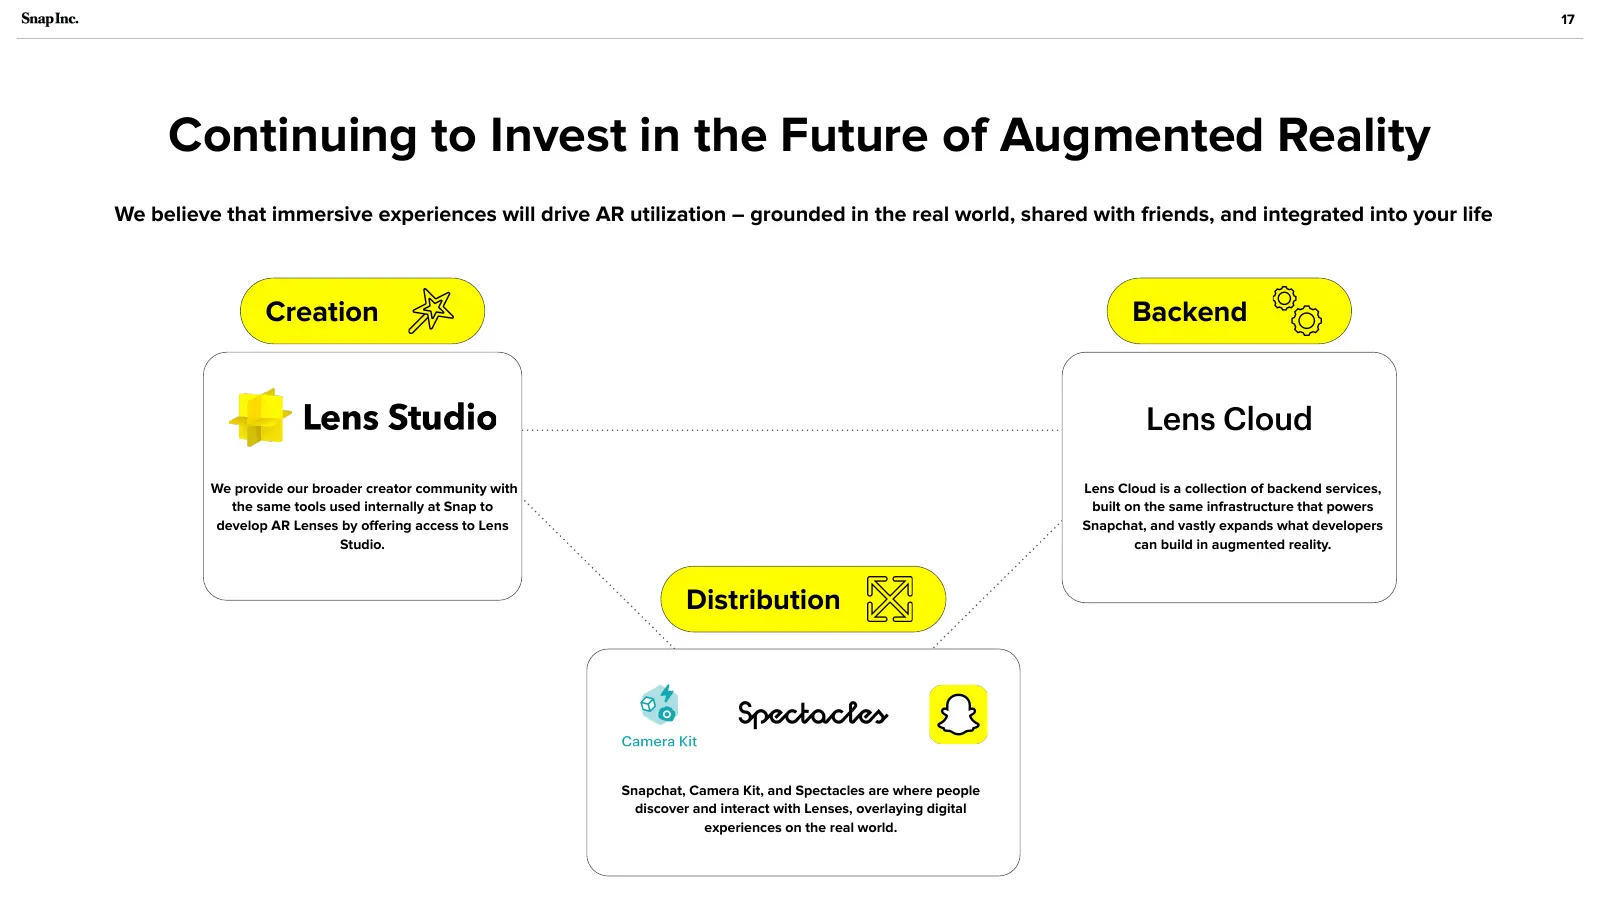
Slide 17: Continuing to Invest in the Future of Augmented Reality
17 Continuing to Invest in the Future of Augmented Reality We believe that immersive experiences will drive AR utilization – grounded in the real world, shared with friends, and integrated into your life Creation Backend We provide our broader creator community with Lens Cloud is a collection of bac
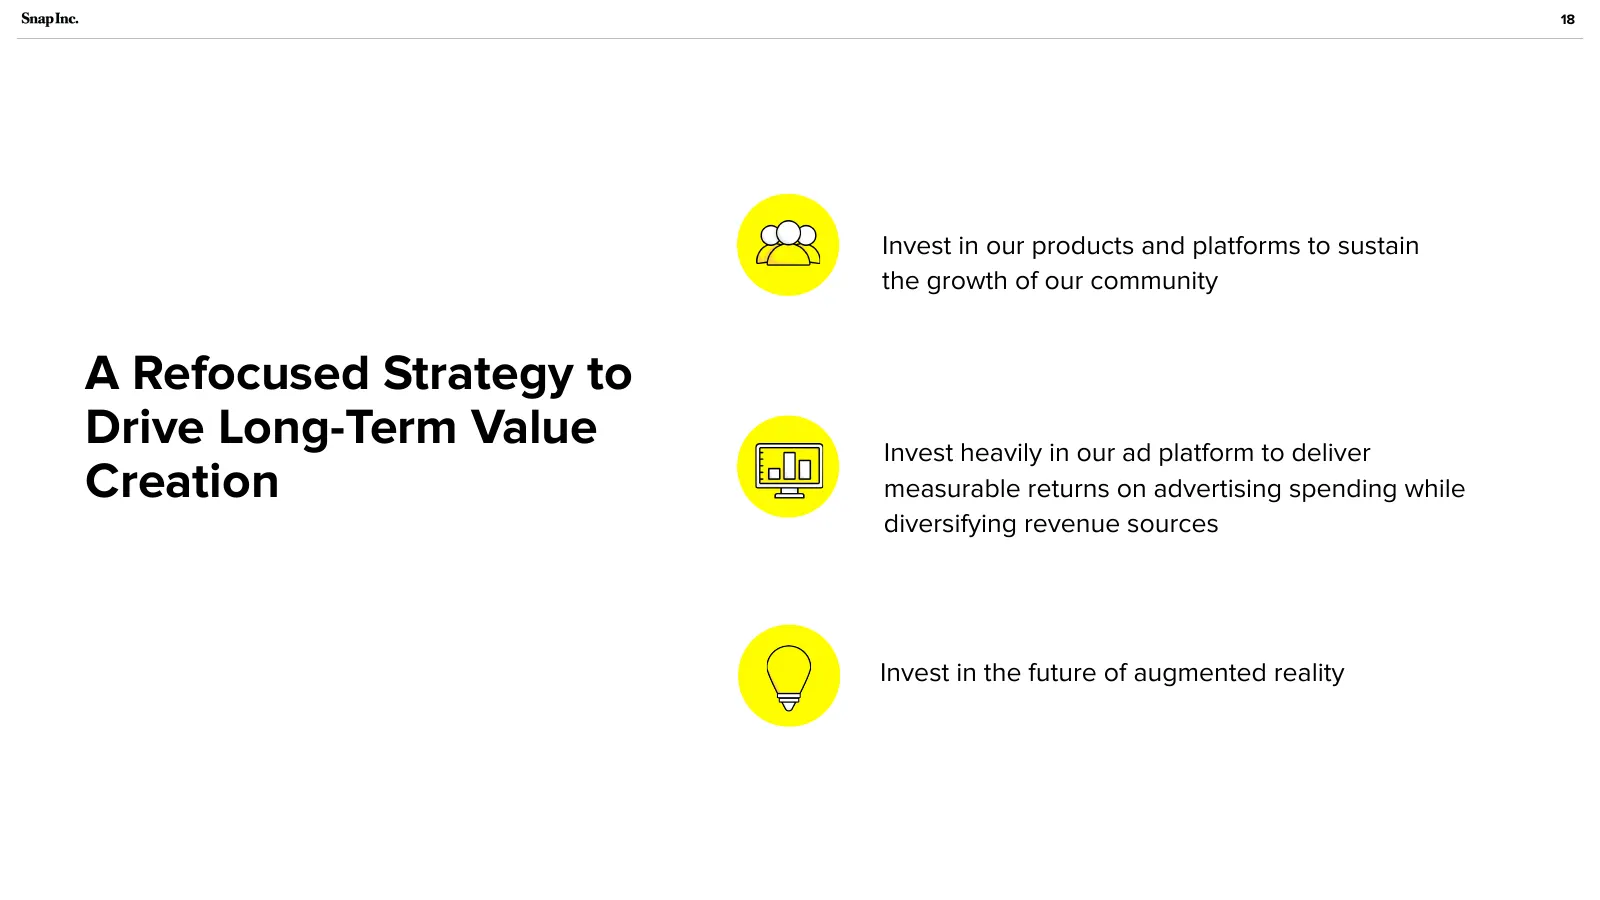
Slide 18: A Refocused Strategy to Drive Long-Term Value Creation
18 Invest in our products and platforms to sustain the growth of our community A Refocused Strategy to Drive Long-Term Value Invest heavily in our ad platform to deliver Creation measurable returns on advertising spending while diversifying revenue sources Invest in the future of augmented reality

Slide 19: Appendix
Appendix
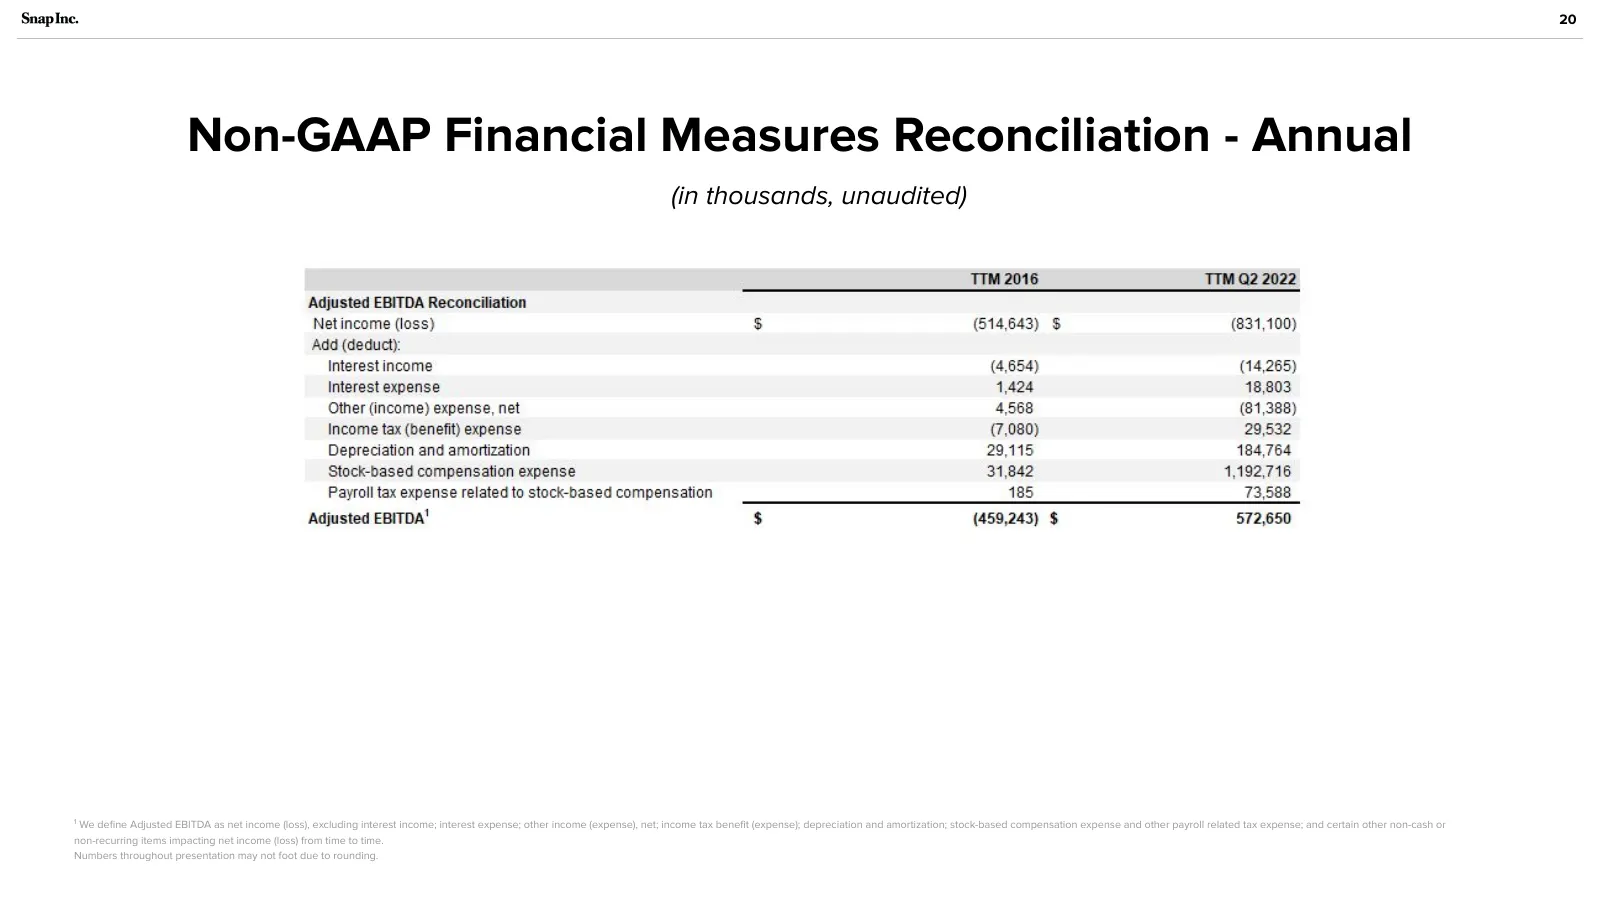
Slide 20: Non-GAAP Financial Measures Reconciliation - Annual
20 Non-GAAP Financial Measures Reconciliation - Annual (in thousands, unaudited) 1 We define Adjusted EBITDA as net income (loss), excluding interest income; interest expense; other income (expense), net; income tax benefit (expense); depreciation and amortization; stock-based compensation expense and

Slide 21: Snap Inc.
Snap Inc.
Source: Internet Archive copy of s25.q4cdn.com
More decks from Snap Inc.
 Q2 2026 Earnings Presentation21 slides · Aug 3, 2026
 Q1 2026 Earnings Presentation22 slides · May 6, 2026
 Corporate Update (April 2026)10 slides · April 2026
 Q4 2025 Earnings Presentation32 slides · Feb 4, 2026
 Q3 2025 Earnings Presentation24 slides · Nov 5, 2025
 Q2 2025 Earnings Presentation24 slides · Aug 5, 2025