Snap Inc. · NYSE:SNAP
Snap — Q2 2025 Earnings Presentation
24 slides from Snap's earnings presentation, Aug 5, 2025

Slide 1: Q2 2025 Earnings Slides
Q2 2025 Earnings Slides August 5, 2025
Slide 2: Forward-Looking Statements & Non-GAAP Financial Measures
Forward-Looking Statements & Non-GAAP Financial Measures This presentation contains forward-looking statements about us and our industry that involve substantial risks and uncertainties. All statements other than statements of historical facts contained in this presentation, including statements reg
Slide 3: Second Quarter 2025 Financial Summary
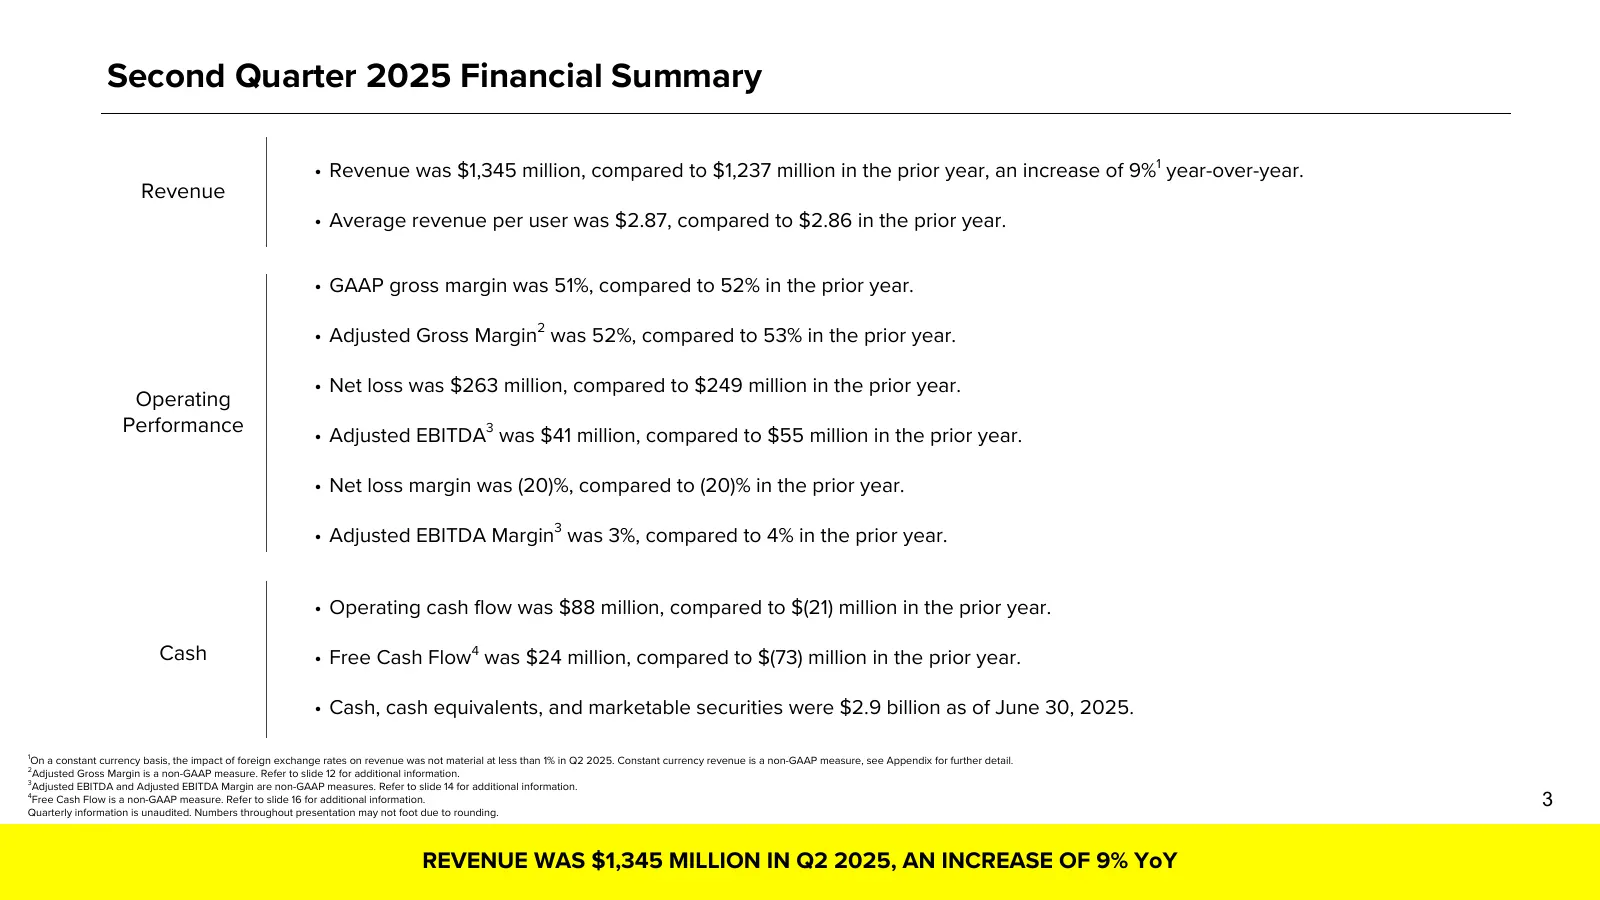
Second Quarter 2025 Financial Summary • Revenue was $1,345 million, compared to $1,237 million in the prior year, an increase of 9%1 year-over-year. Revenue • Average revenue per user was $2.87, compared to $2.86 in the prior year. • GAAP gross margin was 51%, compared to 52% in the prior year. • Ad
Slide 4: Business Highlights
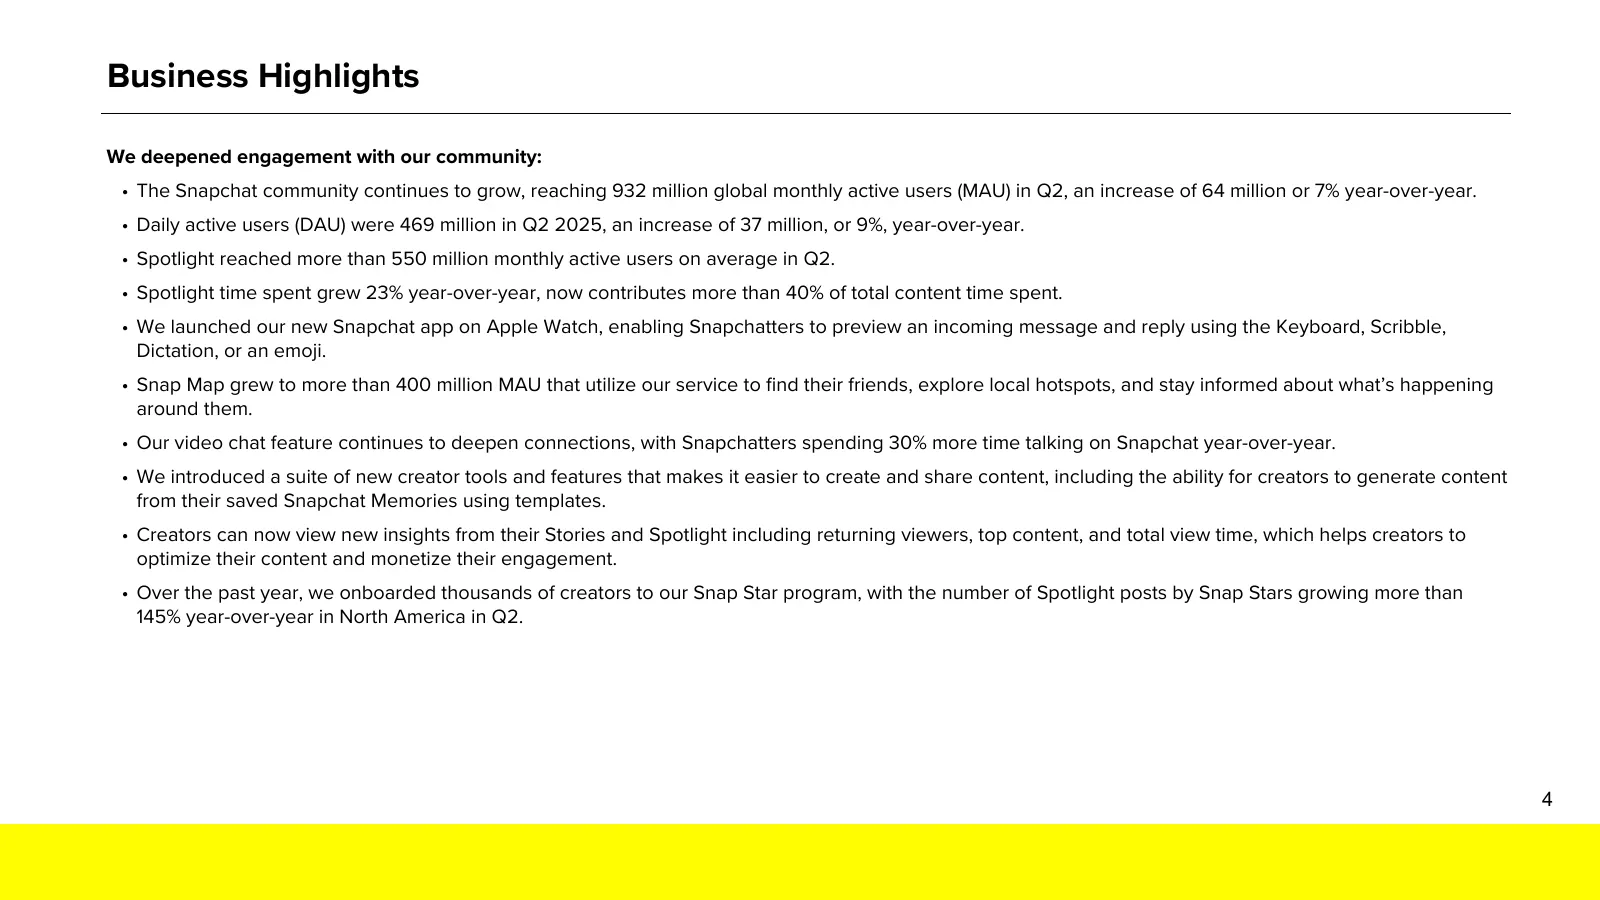
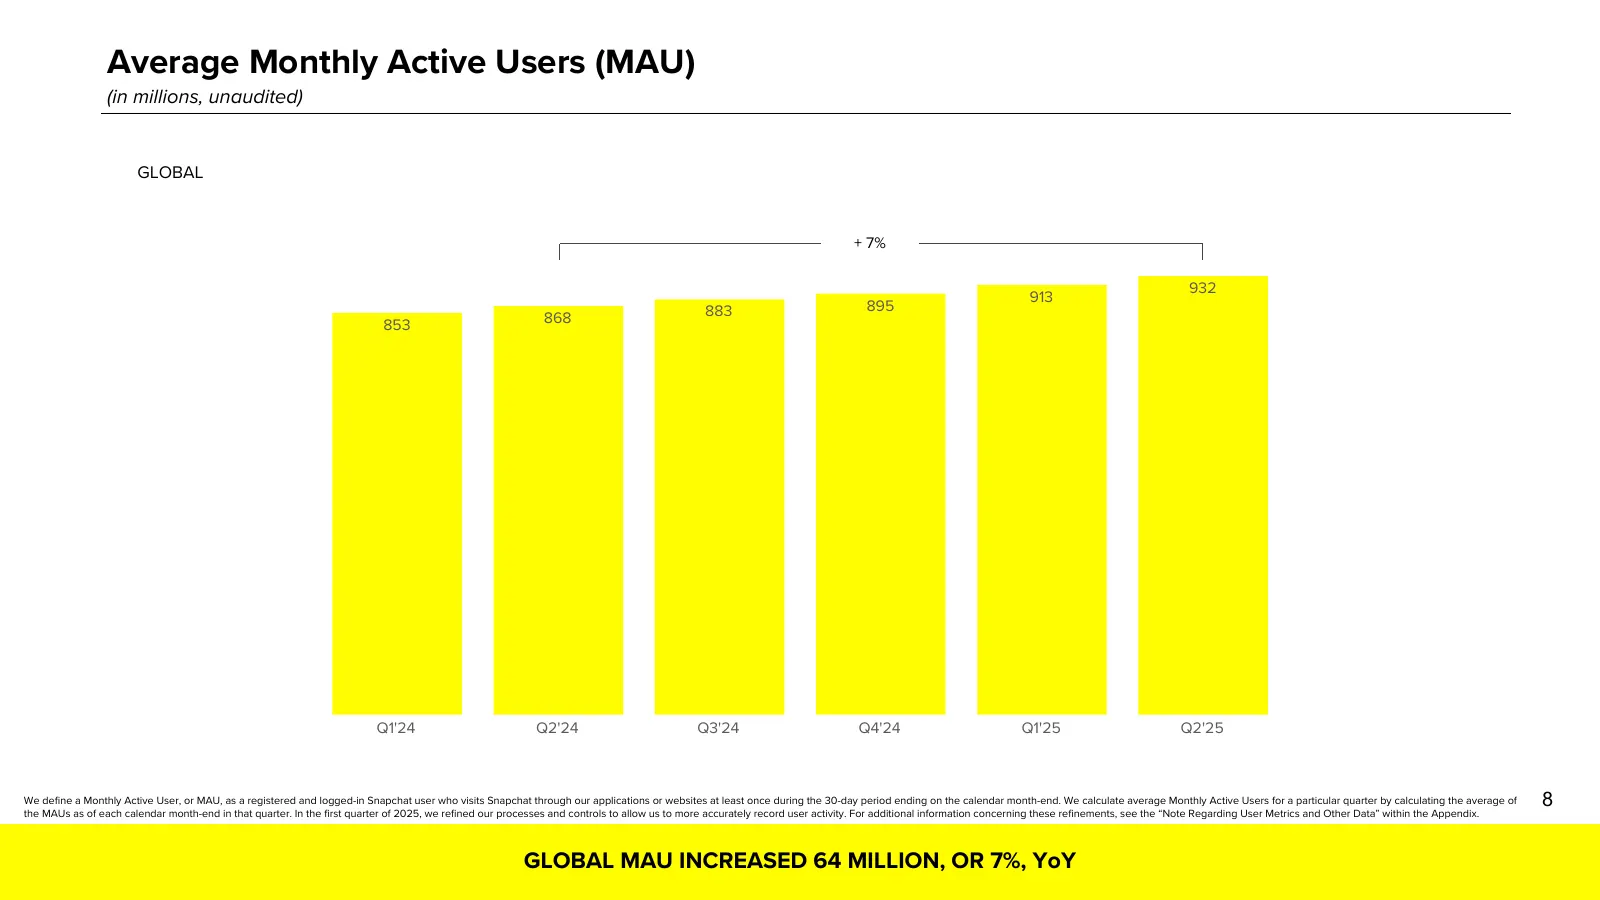
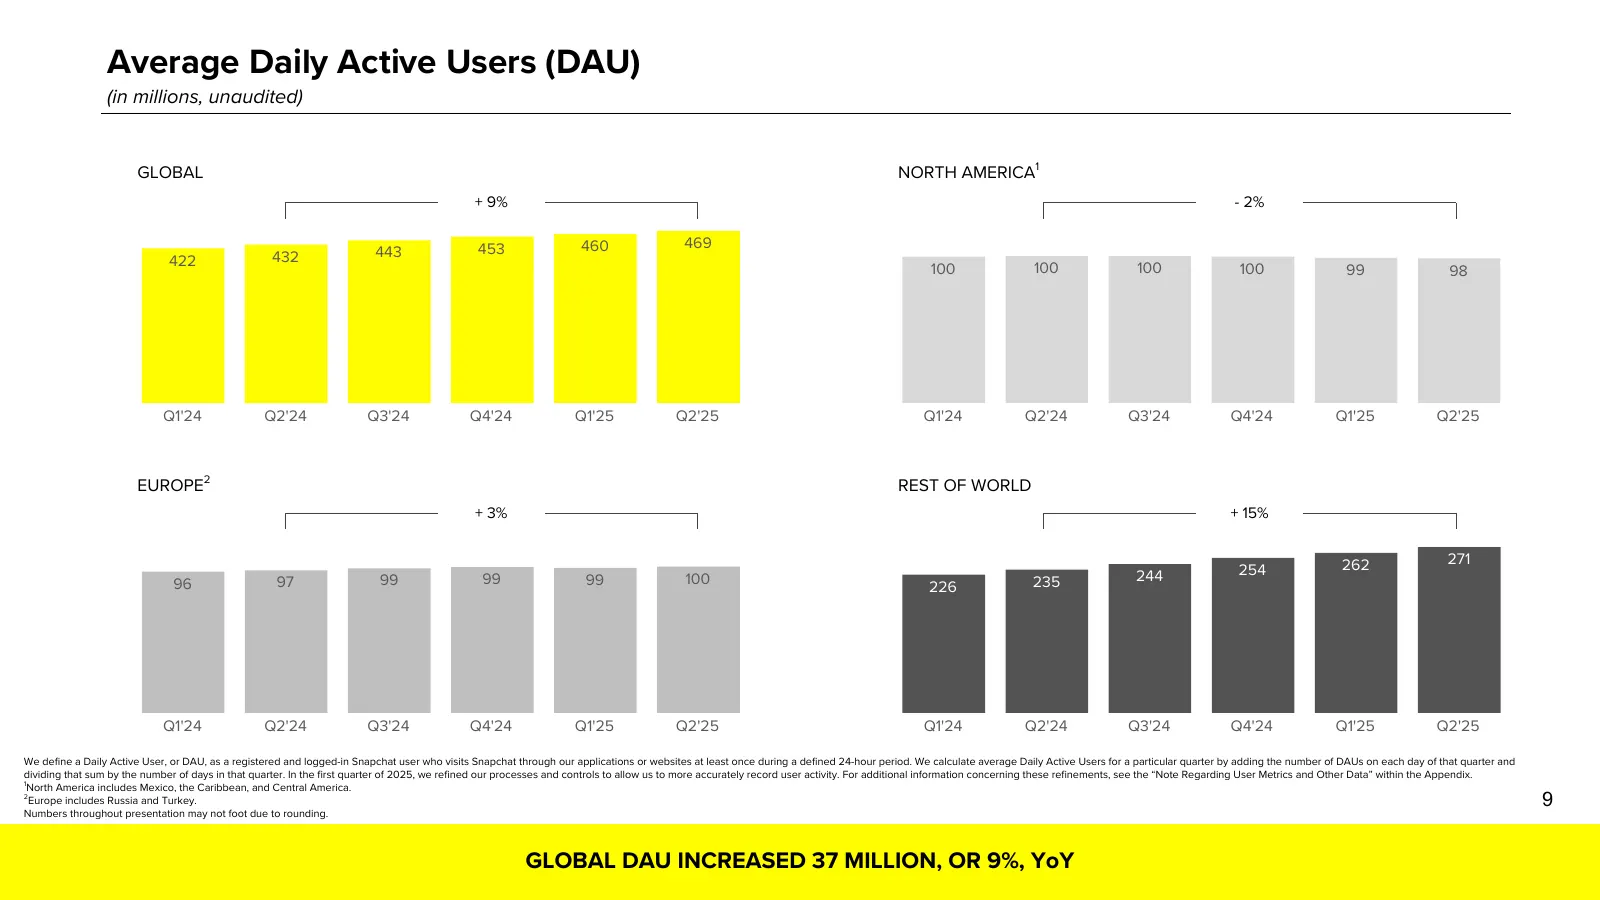
Business Highlights We deepened engagement with our community: • The Snapchat community continues to grow, reaching 932 million global monthly active users (MAU) in Q2, an increase of 64 million or 7% year-over-year. • Daily active users (DAU) were 469 million in Q2 2025, an increase of 37 million,
Slide 5: Business Highlights (Continued)
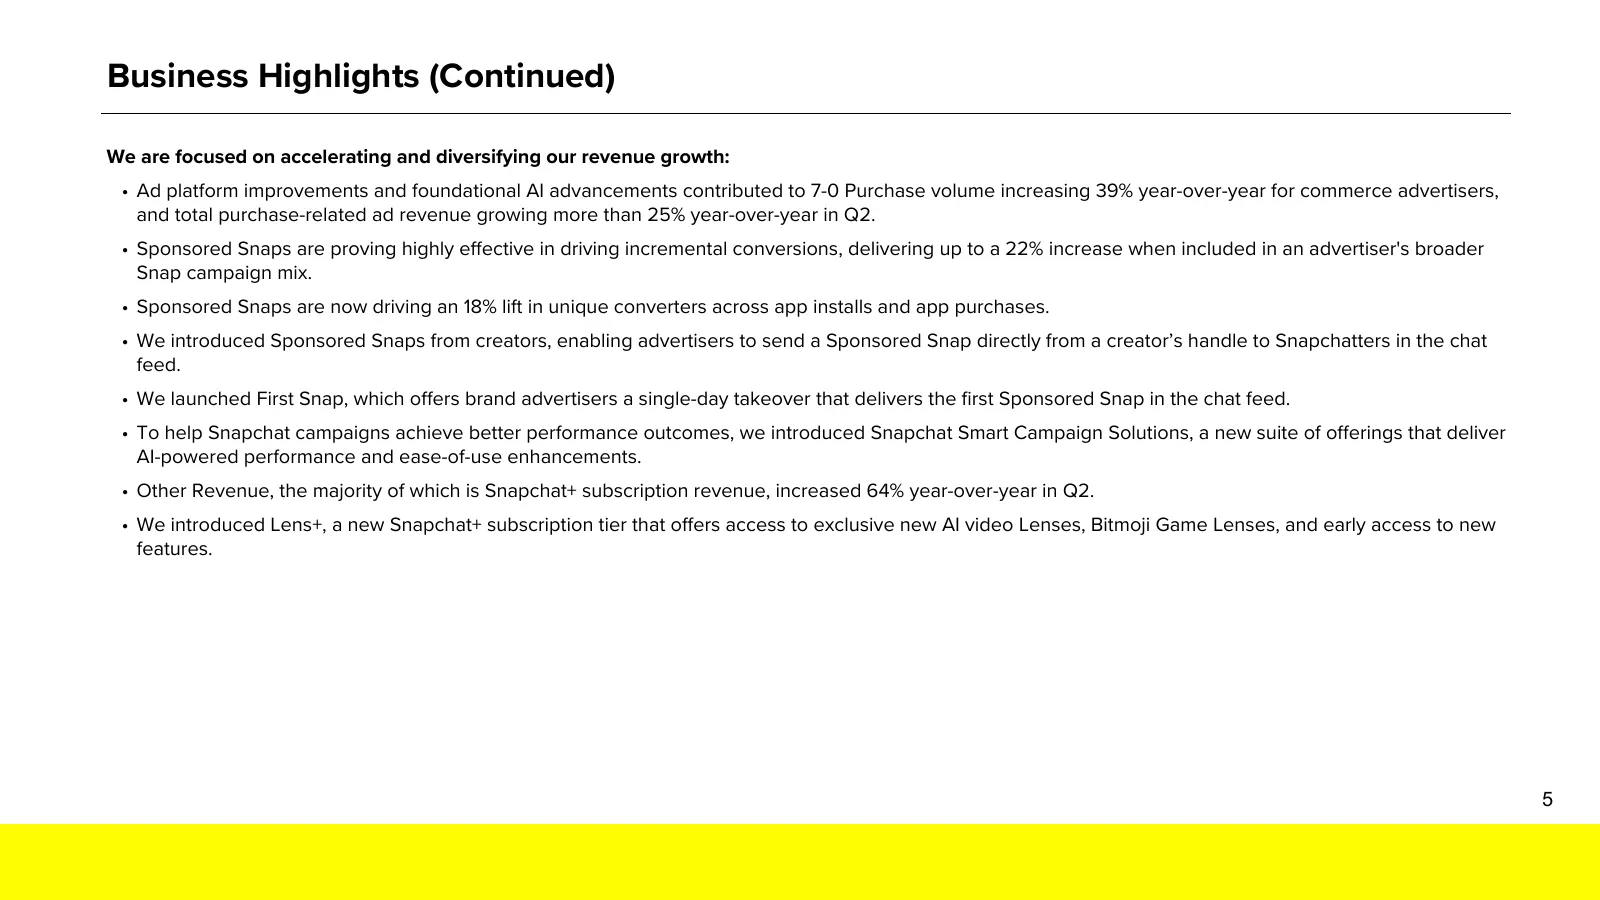
Business Highlights (Continued) We are focused on accelerating and diversifying our revenue growth: • Ad platform improvements and foundational AI advancements contributed to 7-0 Purchase volume increasing 39% year-over-year for commerce advertisers, and total purchase-related ad revenue growing mor
Slide 6: Business Highlights (Continued)
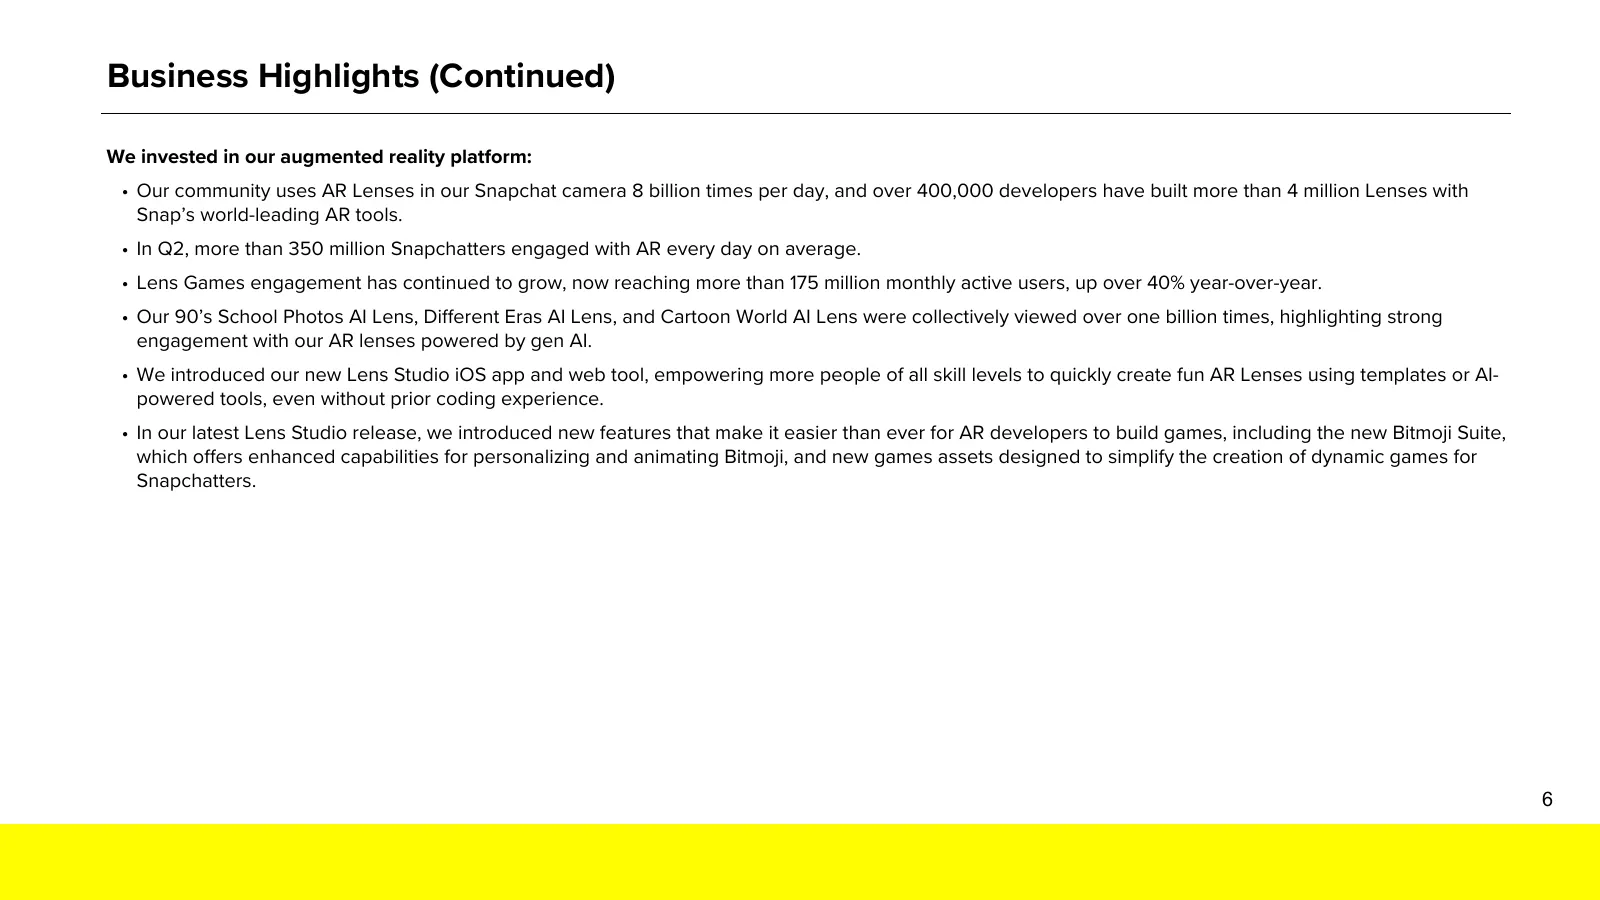
Business Highlights (Continued) We invested in our augmented reality platform: • Our community uses AR Lenses in our Snapchat camera 8 billion times per day, and over 400,000 developers have built more than 4 million Lenses with Snap’s world-leading AR tools. • In Q2, more than 350 million Snapchatt
Slide 7: Business Highlights (Continued)
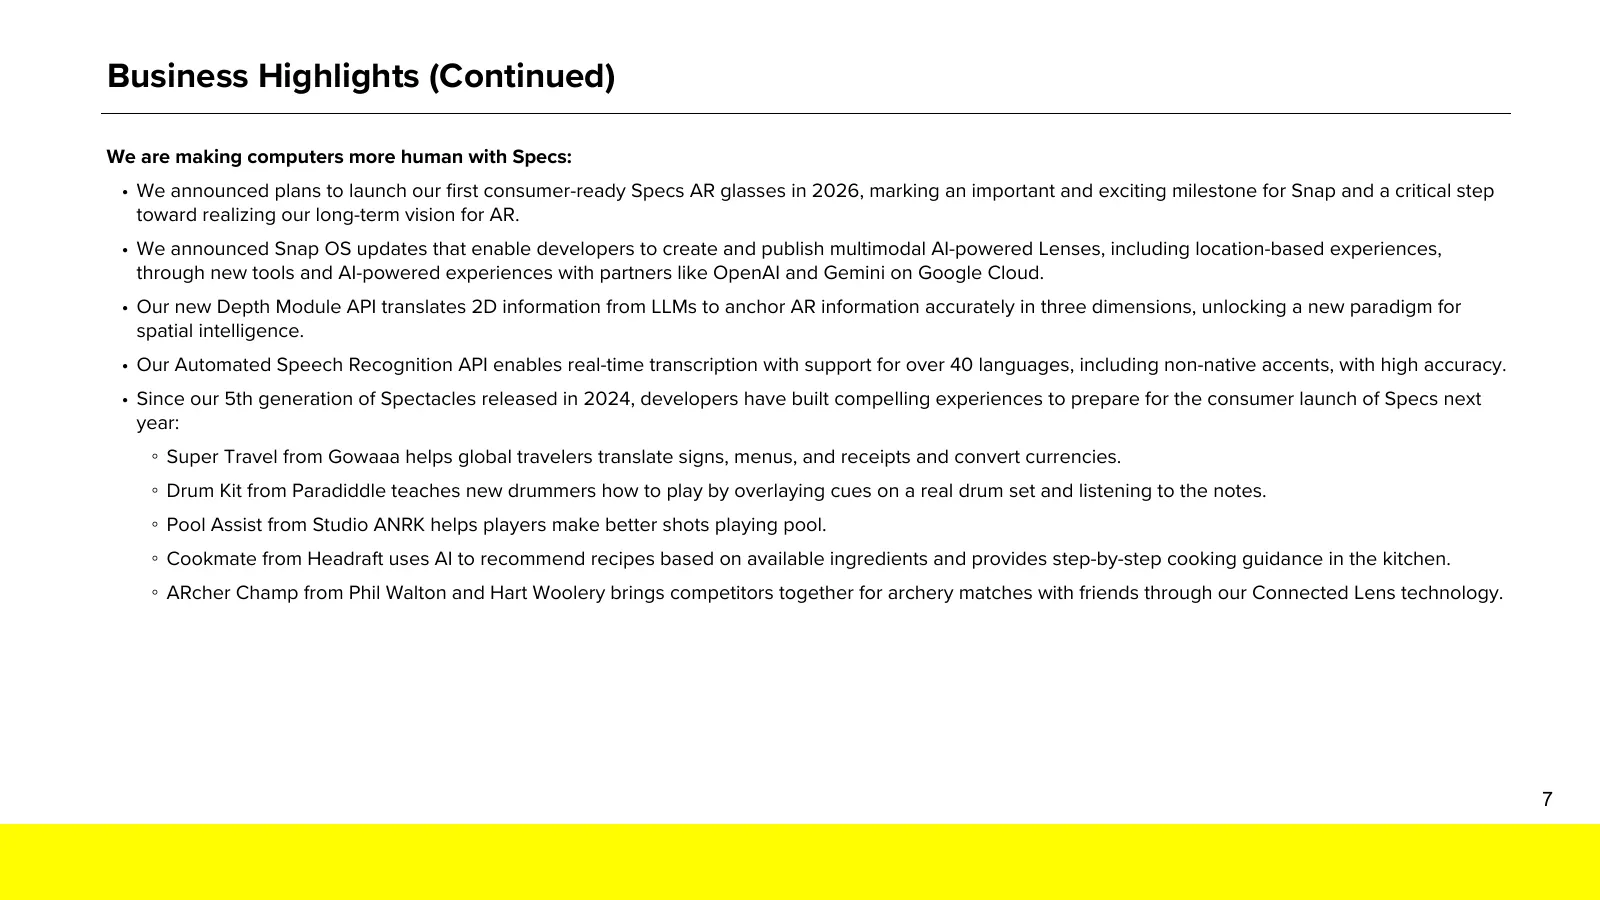
Business Highlights (Continued) We are making computers more human with Specs: • We announced plans to launch our first consumer-ready Specs AR glasses in 2026, marking an important and exciting milestone for Snap and a critical step toward realizing our long-term vision for AR. • We announced Snap
Slide 8: Average Monthly Active Users (MAU)
Average Monthly Active Users (MAU) (in millions, unaudited) GLOBAL + 7% 932 913 883 895 853 868 Q1'24 Q2'24 Q3'24 Q4'24 Q1'25 Q2'25 We define a Monthly Active User, or MAU, as a registered and logged-in Snapchat user who visits Snapchat through our applications or websites at least once during the 3
Slide 9: Average Daily Active Users (DAU)
Average Daily Active Users (DAU) (in millions, unaudited) GLOBAL NORTH AMERICA1 + 9% - 2% 453 460 469 432 443 422 100 100 100 100 99 98 Q1'24 Q2'24 Q3'24 Q4'24 Q1'25 Q2'25 Q1'24 Q2'24 Q3'24 Q4'24 Q1'25 Q2'25 EUROPE2 REST OF WORLD + 3% + 15% 262 271 244 254 96 97 99 99 99 100 235 226 Q1'24 Q2'24 Q3'2
Slide 10: Revenue by Geography
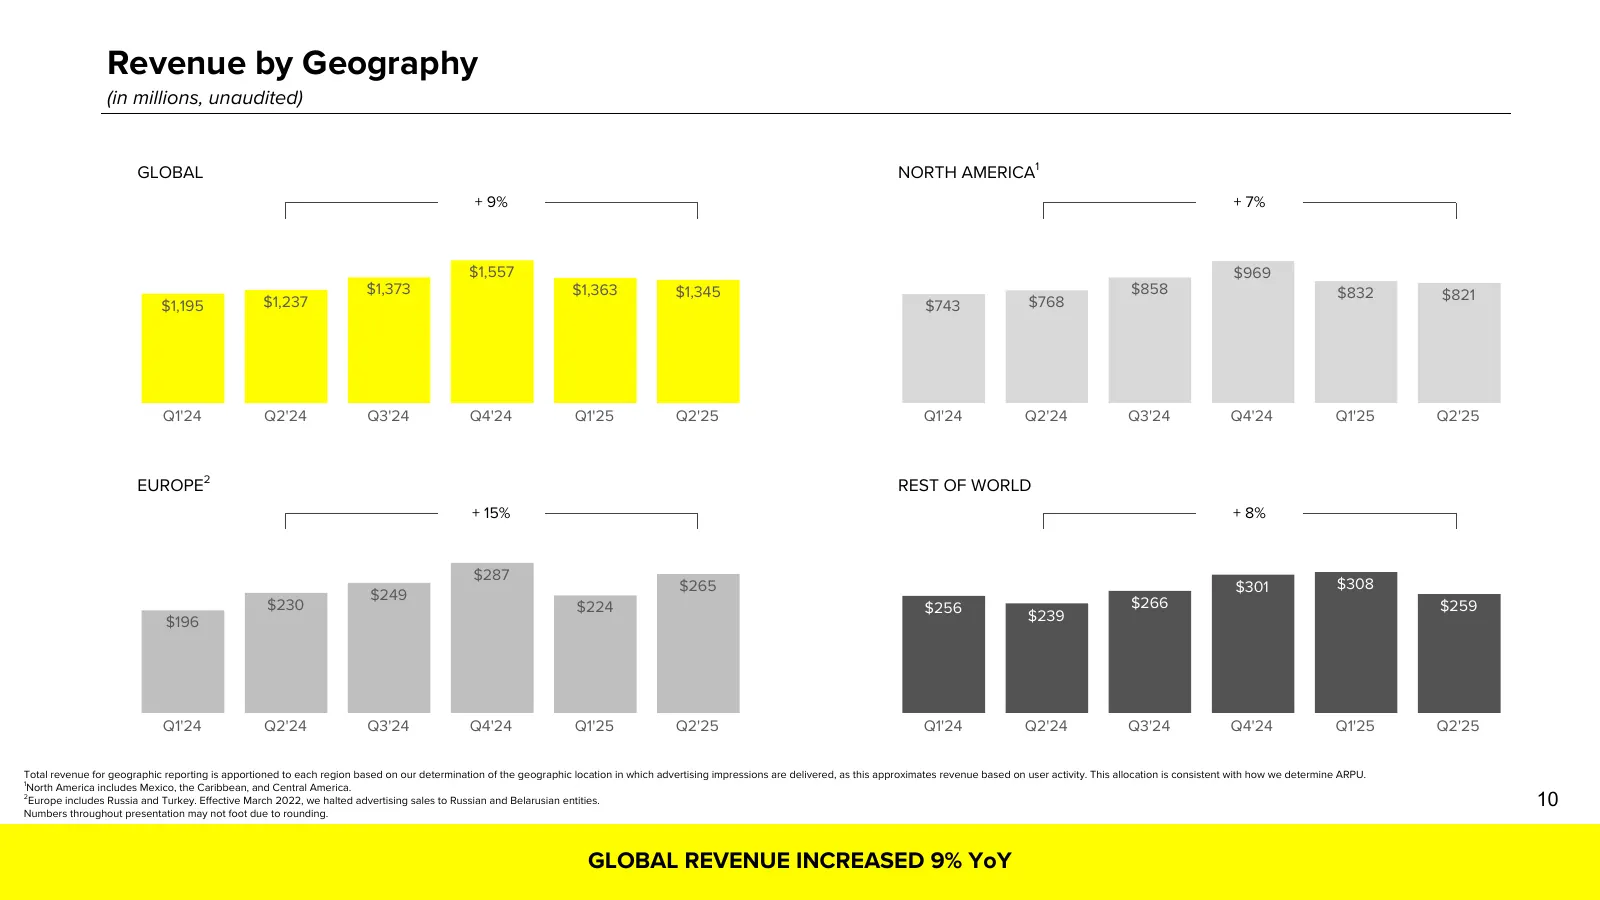
Revenue by Geography (in millions, unaudited) GLOBAL NORTH AMERICA1 + 9% + 7% $1,557 $969 $1,373 $1,363 $1,345 $858 $832 $821 $1,195 $1,237 $743 $768 Q1'24 Q2'24 Q3'24 Q4'24 Q1'25 Q2'25 Q1'24 Q2'24 Q3'24 Q4'24 Q1'25 Q2'25 EUROPE2 REST OF WORLD + 15% + 8% $287 $265 $301 $308 $249 $230 $224 $256 $266
Slide 11: Average Revenue Per User (ARPU)
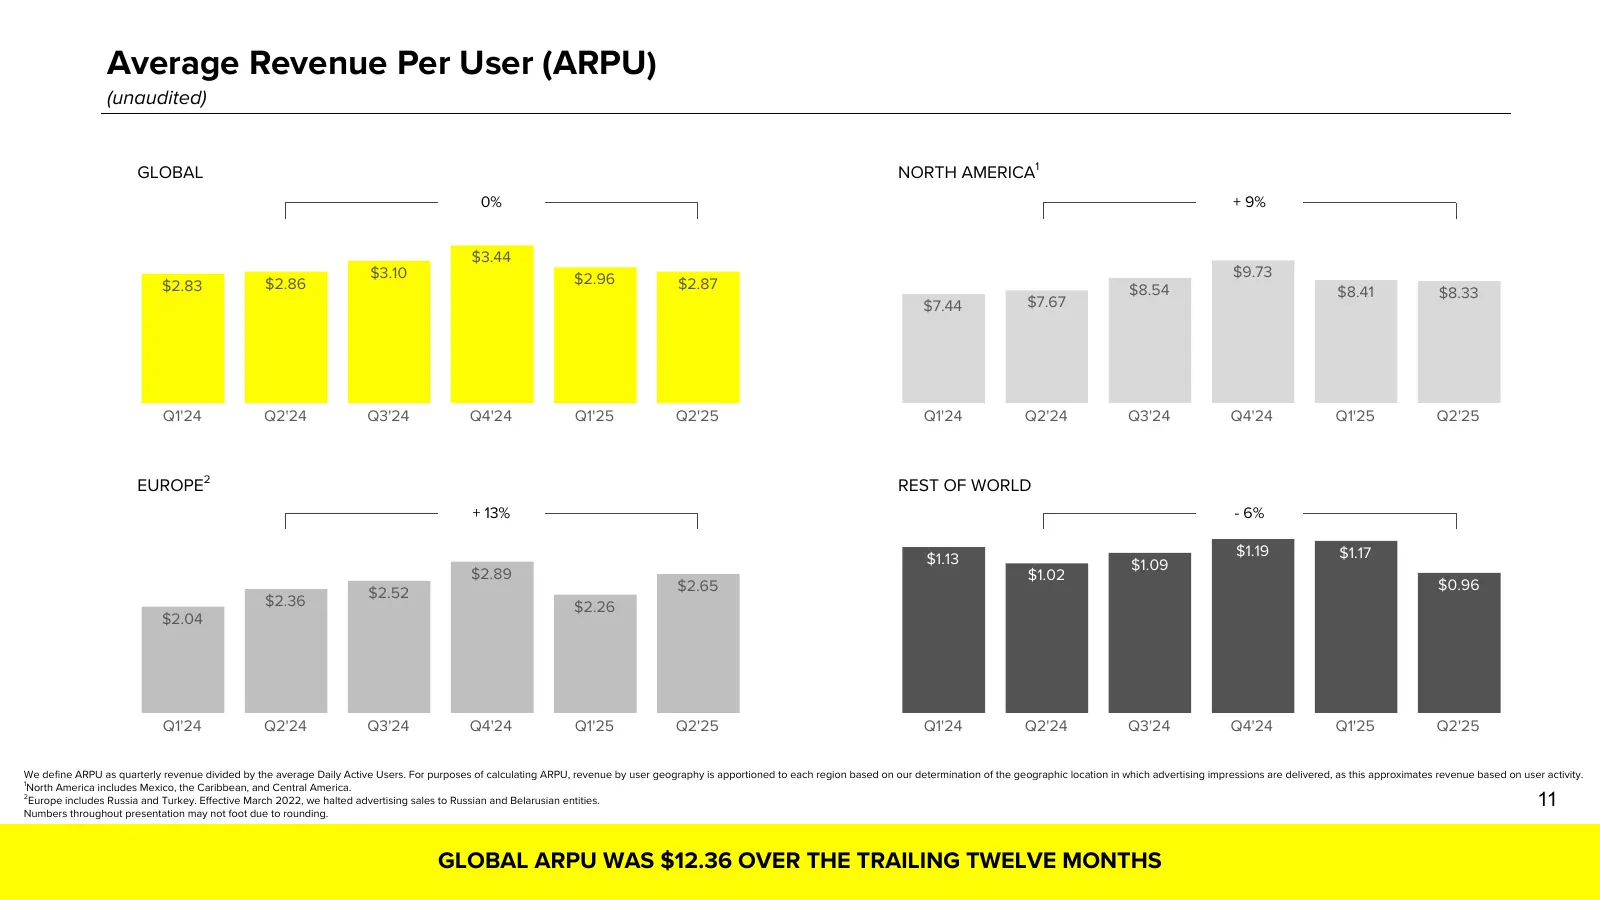
Average Revenue Per User (ARPU) (unaudited) GLOBAL NORTH AMERICA1 0% + 9% $3.44 $3.10 $2.96 $9.73 $2.83 $2.86 $2.87 $8.54 $8.41 $8.33 $7.44 $7.67 Q1'24 Q2'24 Q3'24 Q4'24 Q1'25 Q2'25 Q1'24 Q2'24 Q3'24 Q4'24 Q1'25 Q2'25 EUROPE2 REST OF WORLD + 13% - 6% $1.19 $1.17 $1.13 $1.09 $2.89 $1.02 $2.65 $0.96 $
Slide 12: Adjusted Gross Margin and Adjusted Cost of Revenue
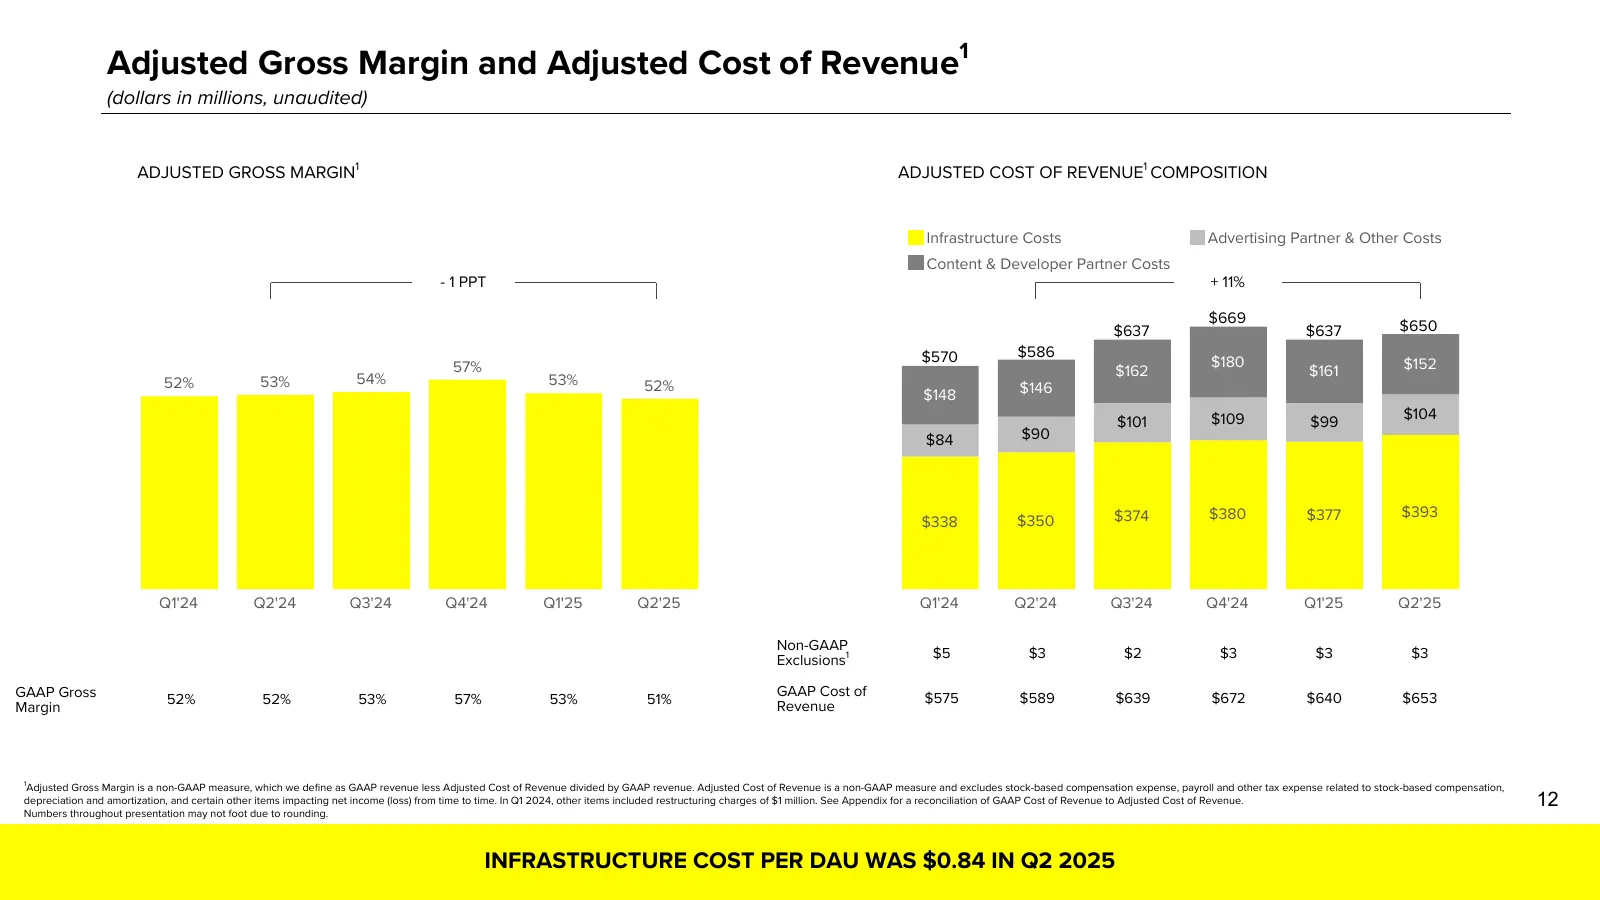
1 Adjusted Gross Margin and Adjusted Cost of Revenue (dollars in millions, unaudited) ADJUSTED GROSS MARGIN1 ADJUSTED COST OF REVENUE1 COMPOSITION Infrastructure Costs Advertising Partner & Other Costs Content & Developer Partner Costs - 1 PPT + 11% $669 $637 $637 $650 $570 $586 57% $180 $152 $162 $
Slide 13: Adjusted Operating Expense Margin and Adjusted Operating Expenses
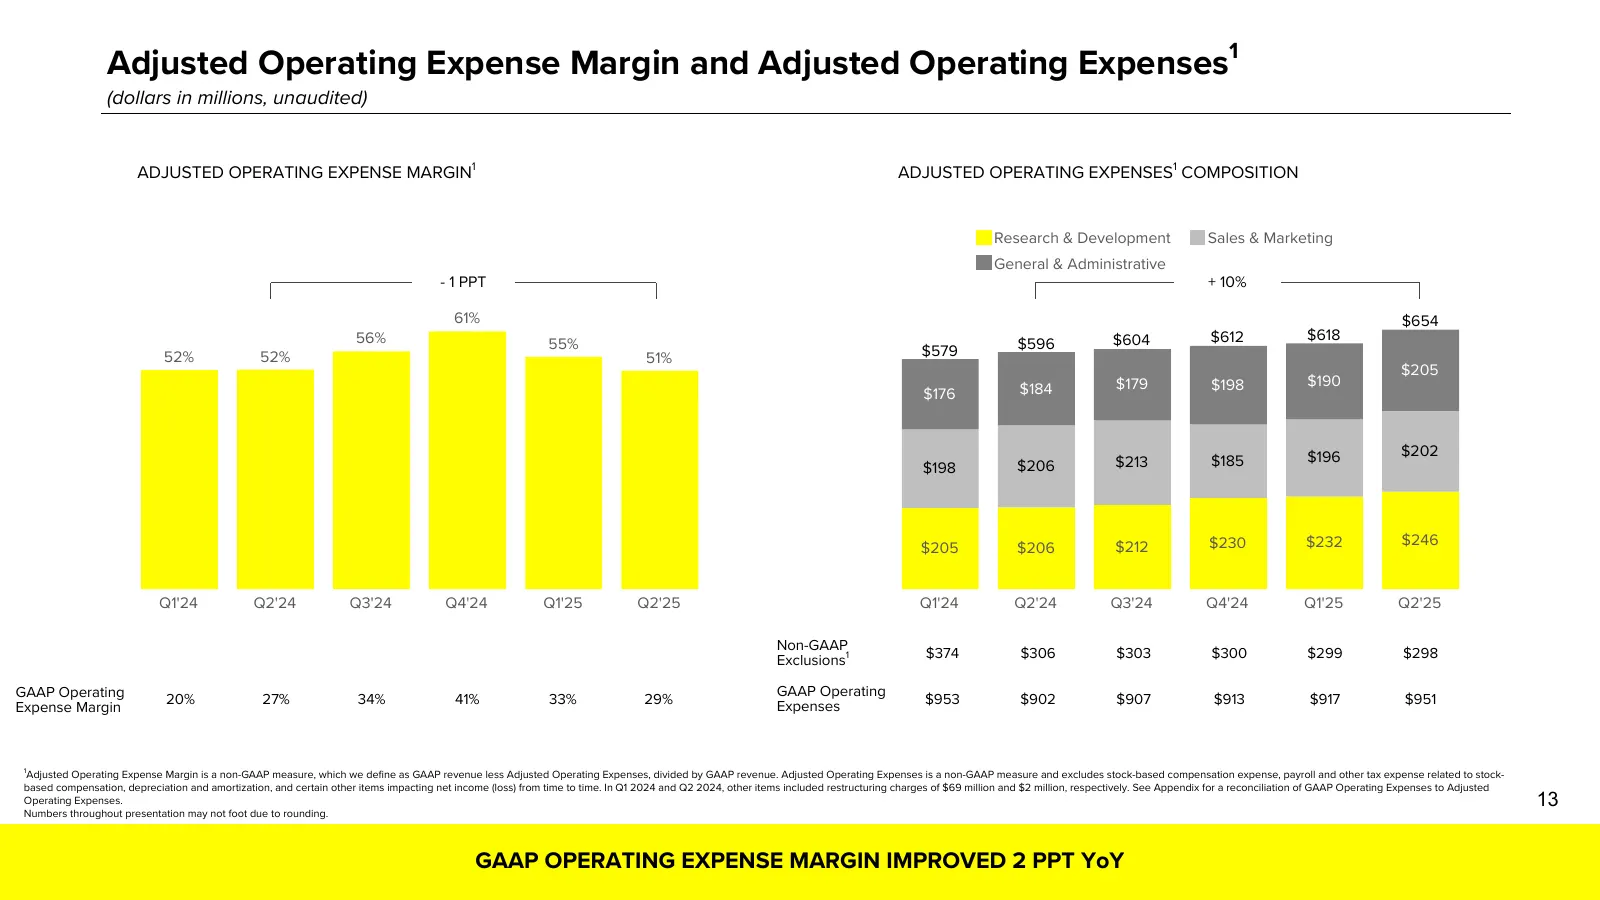
1 Adjusted Operating Expense Margin and Adjusted Operating Expenses (dollars in millions, unaudited) ADJUSTED OPERATING EXPENSE MARGIN1 ADJUSTED OPERATING EXPENSES1 COMPOSITION Research & Development Sales & Marketing General & Administrative - 1 PPT + 10% 61% $654 56% $604 $612 $618 55% $579 $596 5
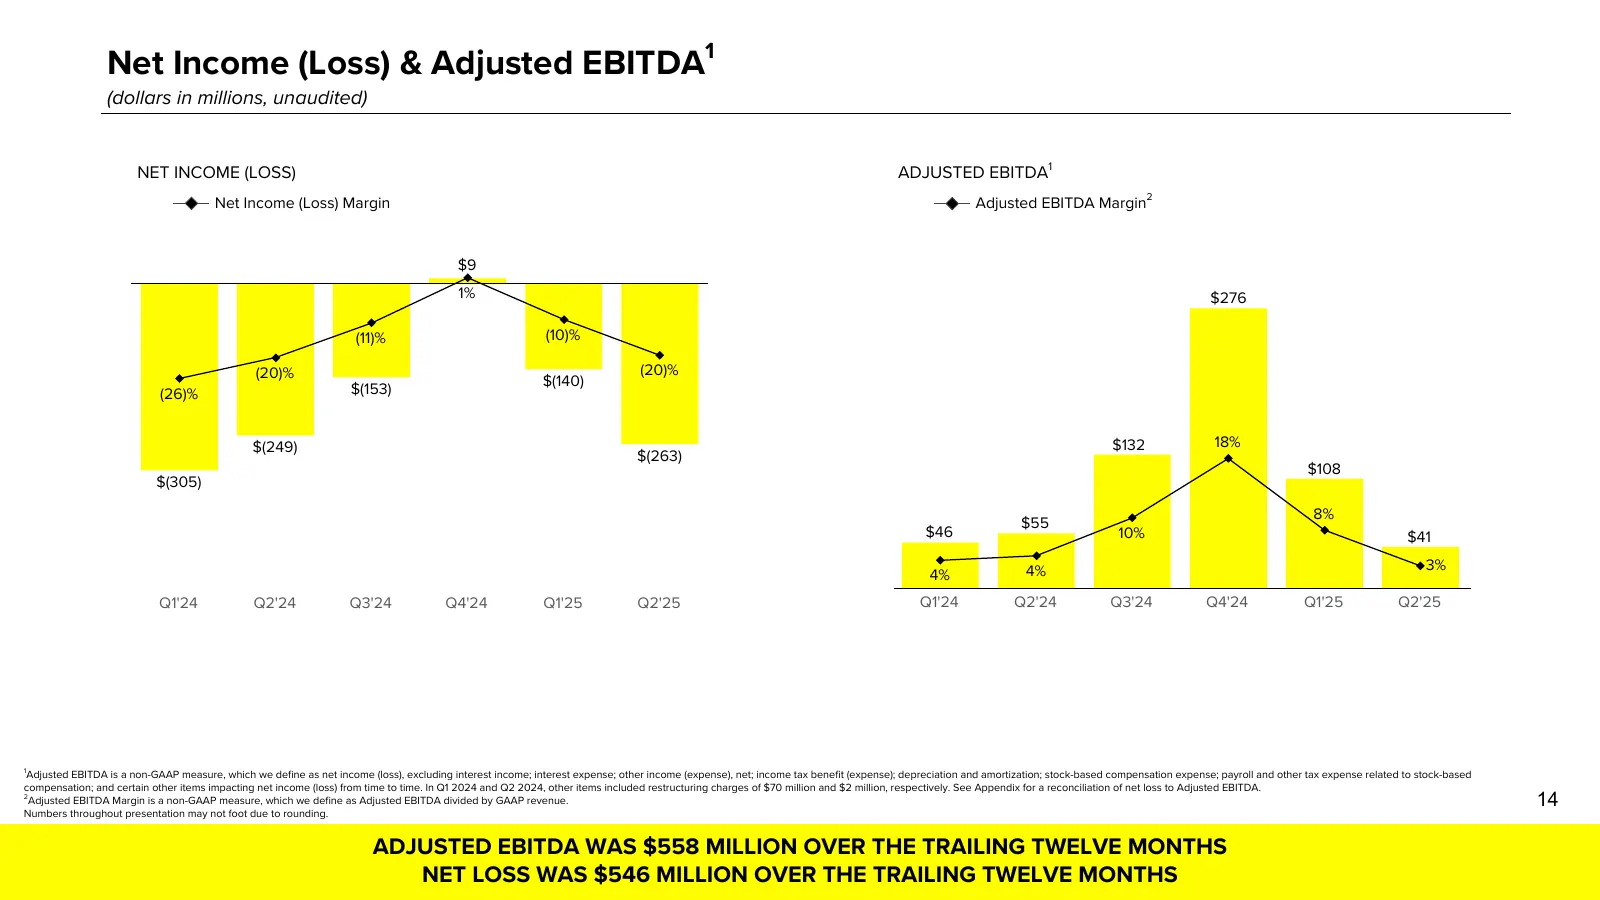
Slide 14: Net Income (Loss) & Adjusted EBITDA
1 Net Income (Loss) & Adjusted EBITDA (dollars in millions, unaudited) NET INCOME (LOSS) ADJUSTED EBITDA1 Net Income (Loss) Margin Adjusted EBITDA Margin2 $9 1% $276 (11)% (10)% (20)% (20)% $(140) (26)% $(153) $(249) $132 18% $(263) $108 $(305) 8% $55 $46 10% $41 4% 3% 4% Q1'24 Q2'24 Q3'24 Q4'24 Q1'
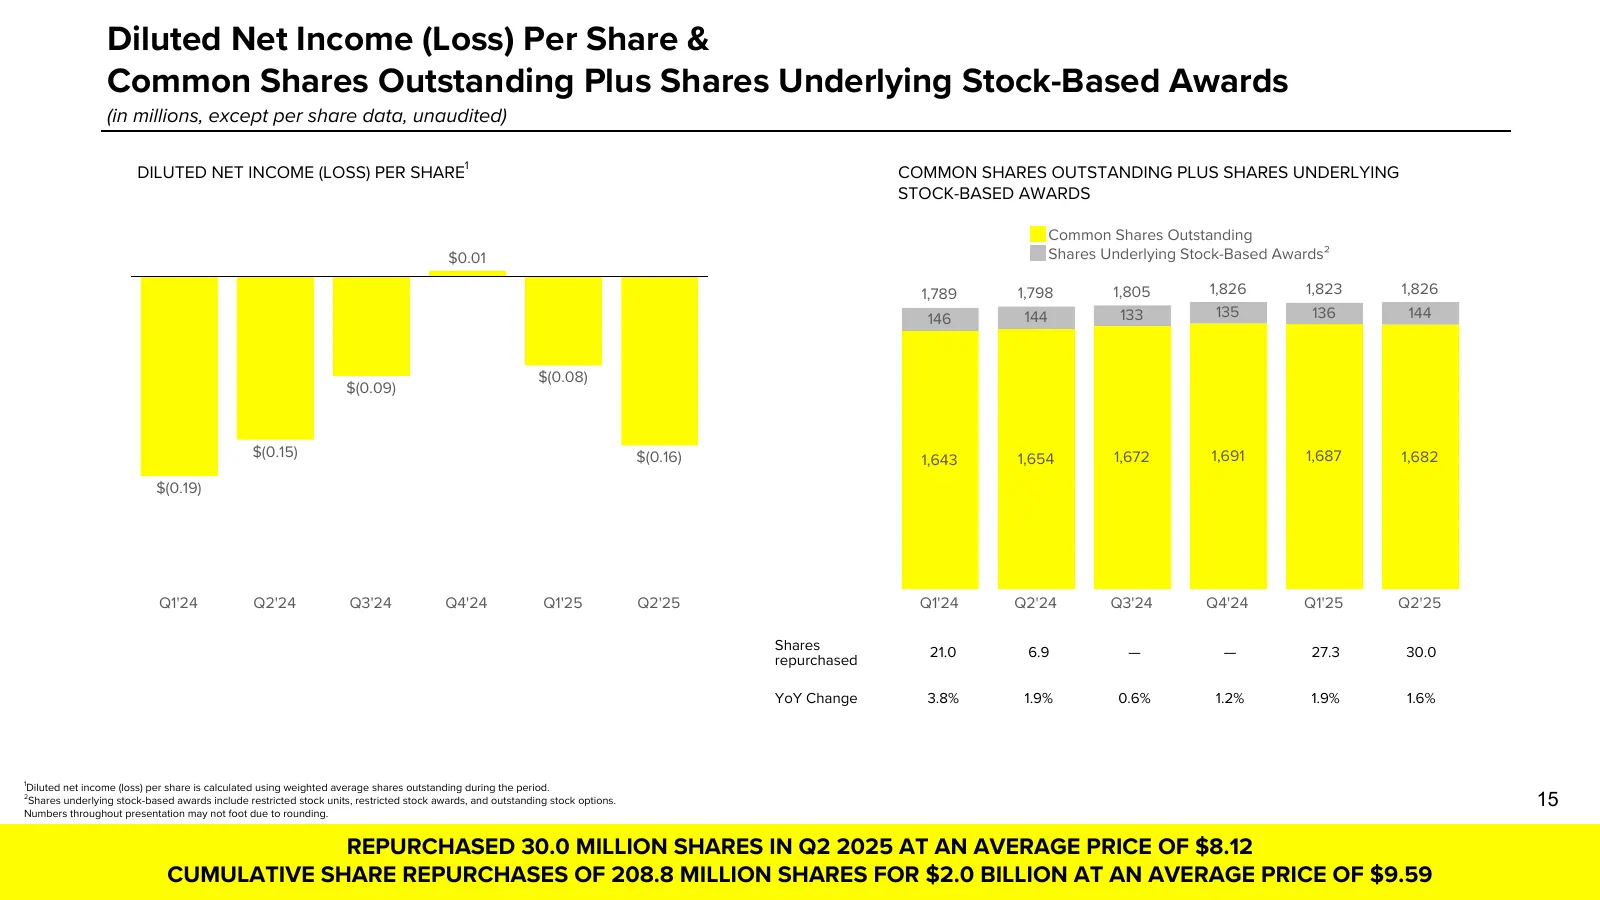
Slide 15: Diluted Net Income (Loss) Per Share & Common Shares Outstanding
Diluted Net Income (Loss) Per Share & Common Shares Outstanding Plus Shares Underlying Stock-Based Awards (in millions, except per share data, unaudited) DILUTED NET INCOME (LOSS) PER SHARE1 COMMON SHARES OUTSTANDING PLUS SHARES UNDERLYING STOCK-BASED AWARDS Common Shares Outstanding $0.01 Shares Un
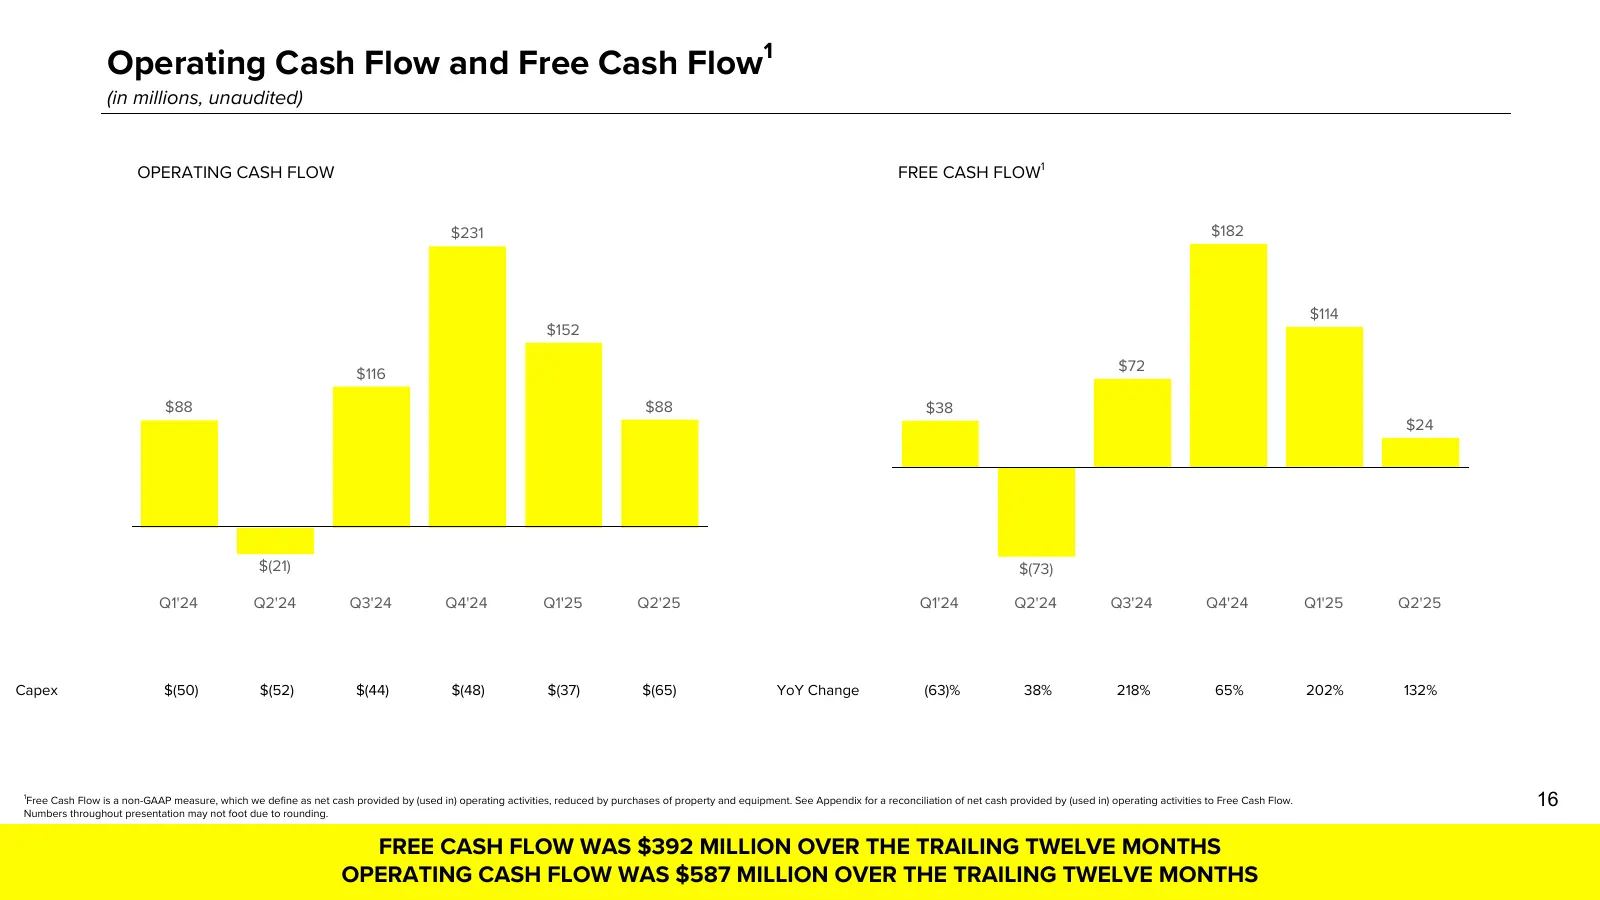
Slide 16: Operating Cash Flow and Free Cash Flow
1 Operating Cash Flow and Free Cash Flow (in millions, unaudited) OPERATING CASH FLOW FREE CASH FLOW1 $231 $182 $114 $152 $116 $72 $88 $88 $38 $24 $(21) $(73) Q1'24 Q2'24 Q3'24 Q4'24 Q1'25 Q2'25 Q1'24 Q2'24 Q3'24 Q4'24 Q1'25 Q2'25 Capex $(50) $(52) $(44) $(48) $(37) $(65) YoY Change (63)% 38% 218% 6
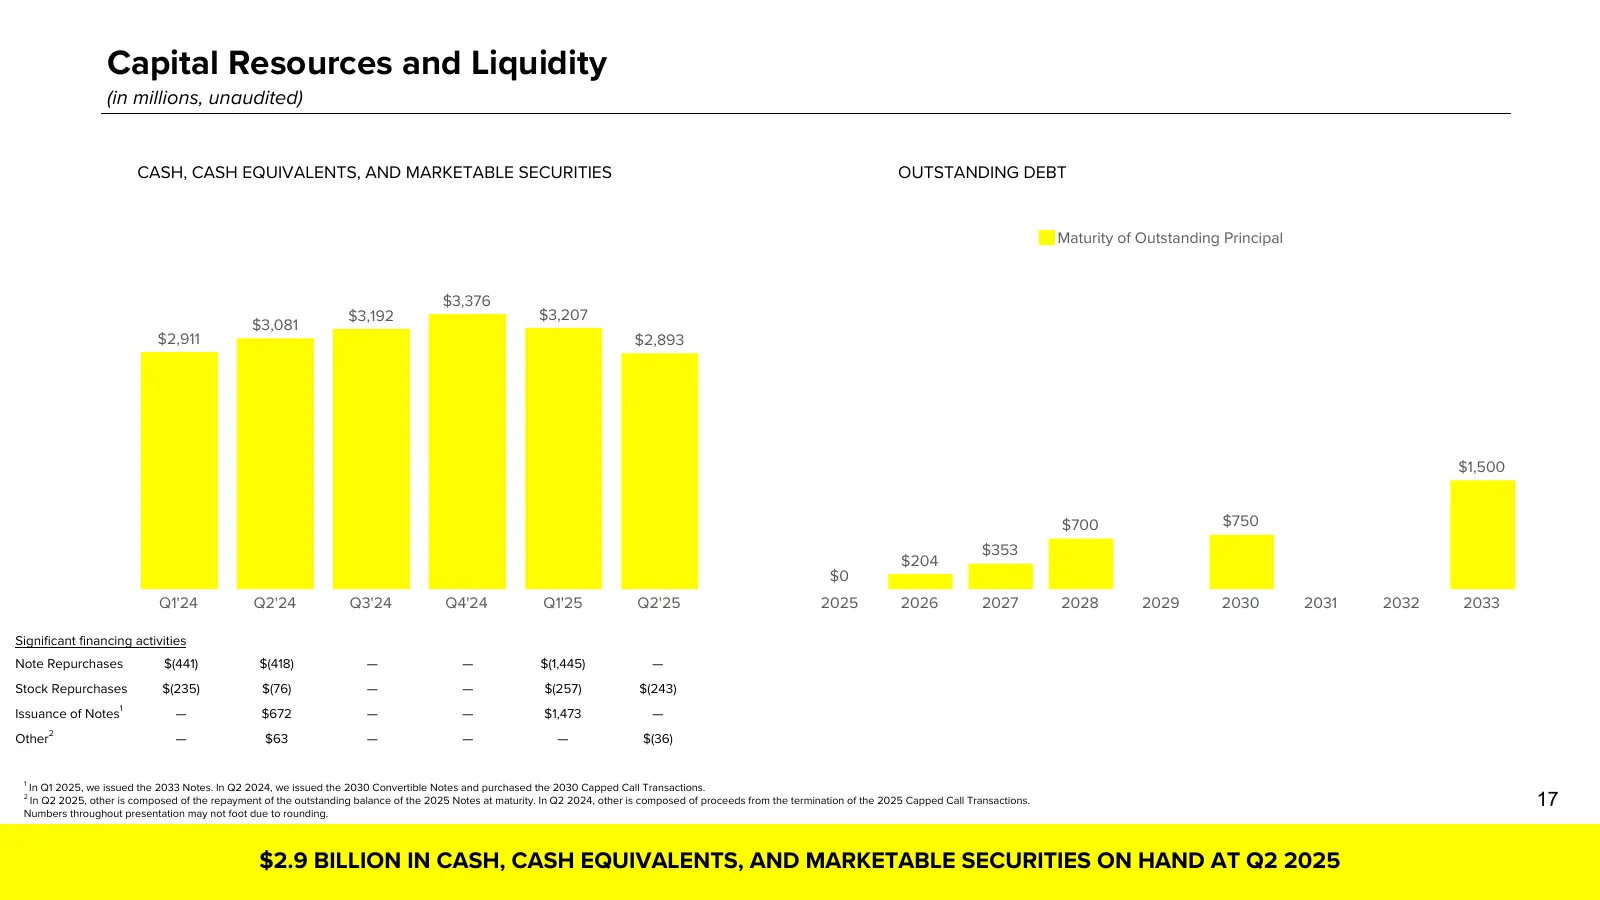
Slide 17: Capital Resources and Liquidity
Capital Resources and Liquidity (in millions, unaudited) CASH, CASH EQUIVALENTS, AND MARKETABLE SECURITIES OUTSTANDING DEBT Maturity of Outstanding Principal $3,376 $3,192 $3,207 $3,081 $2,911 $2,893 $1,500 $700 $750 $353 $204 $0 Q1'24 Q2'24 Q3'24 Q4'24 Q1'25 Q2'25 2025 2026 2027 2028 2029 2030 2031

Slide 18: Appendix
Appendix
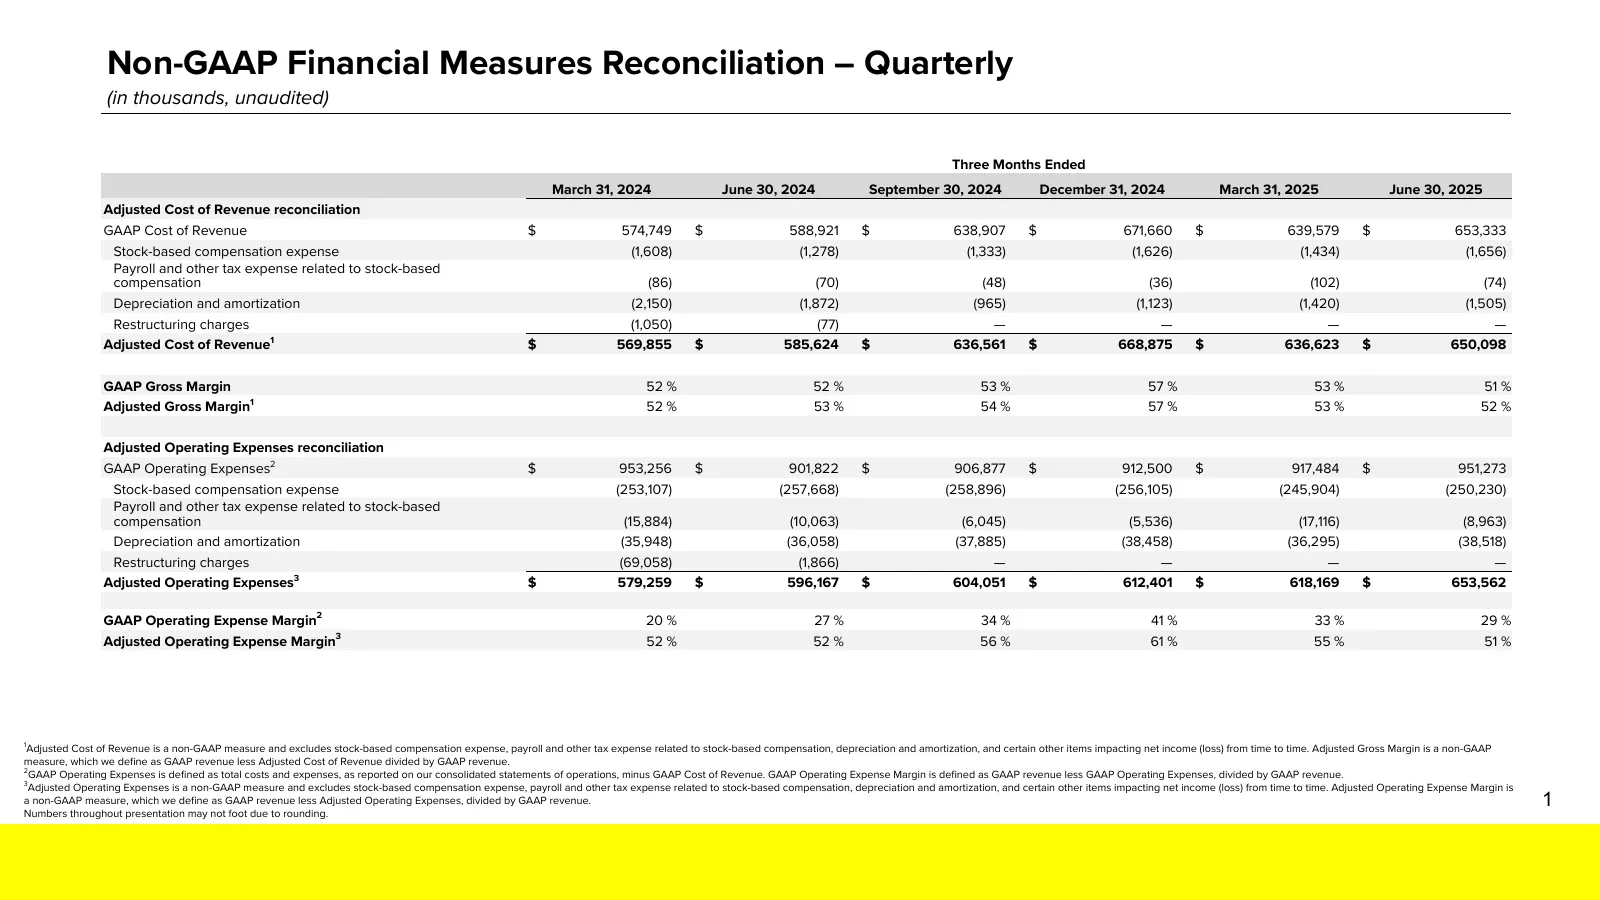
Slide 19: Non-GAAP Financial Measures Reconciliation – Quarterly
Non-GAAP Financial Measures Reconciliation – Quarterly (in thousands, unaudited) Three Months Ended March 31, 2024 June 30, 2024 September 30, 2024 December 31, 2024 March 31, 2025 June 30, 2025 Adjusted Cost of Revenue reconciliation GAAP Cost of Revenue $ 574,749 $ 588,921 $ 638,907 $ 671,660 $ 63
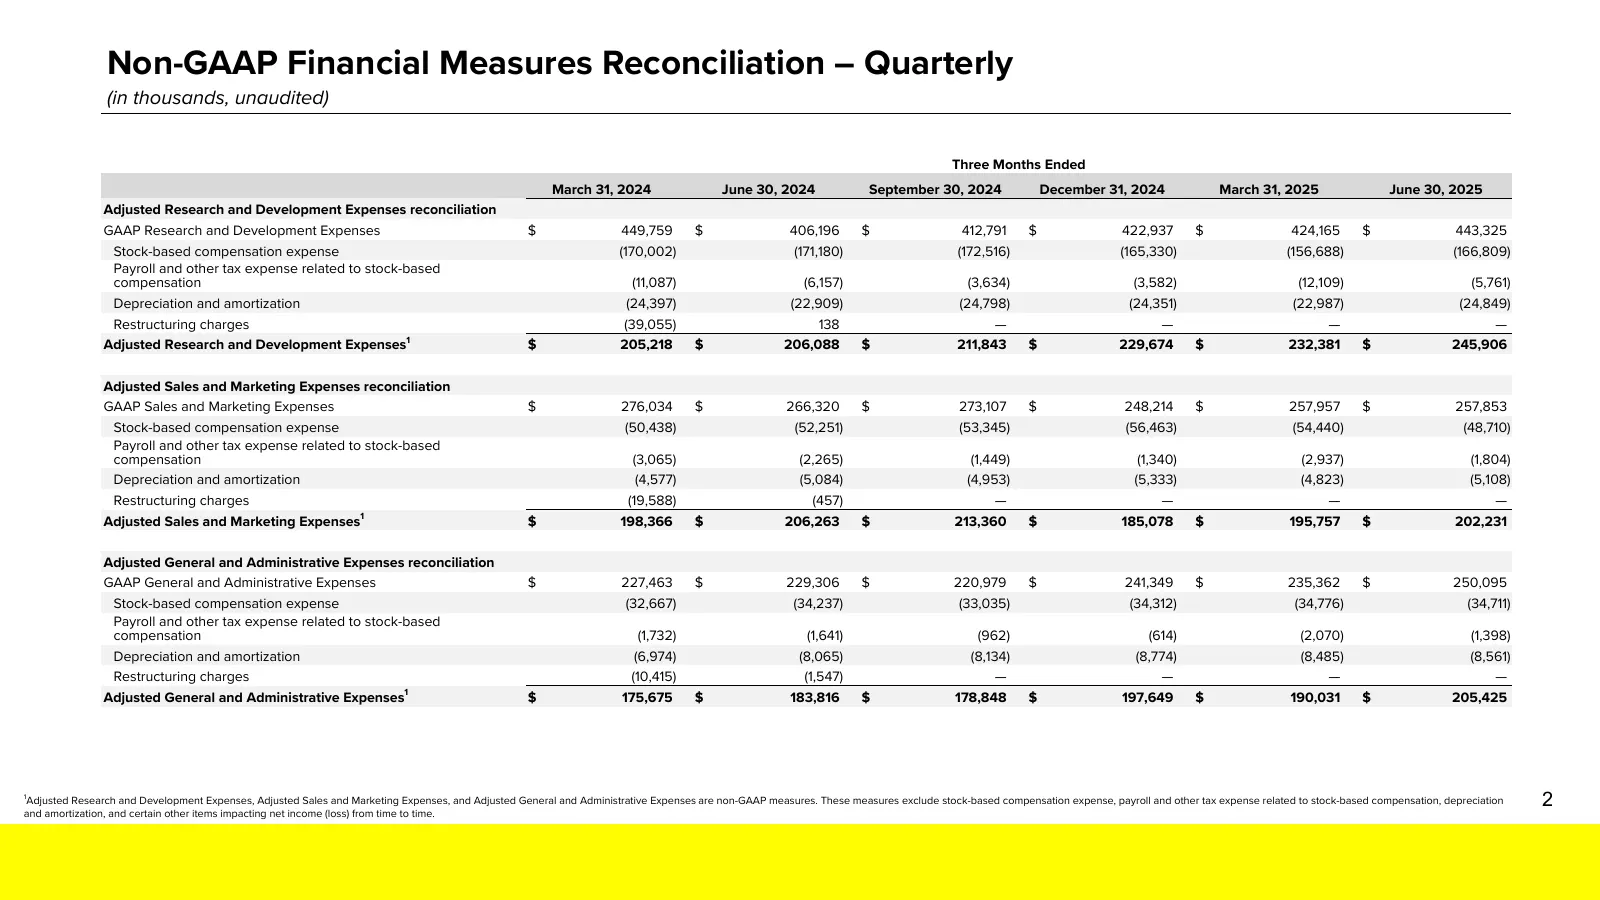
Slide 20: Non-GAAP Financial Measures Reconciliation – Quarterly
Non-GAAP Financial Measures Reconciliation – Quarterly (in thousands, unaudited) Three Months Ended March 31, 2024 June 30, 2024 September 30, 2024 December 31, 2024 March 31, 2025 June 30, 2025 Adjusted Research and Development Expenses reconciliation GAAP Research and Development Expenses $ 449,75
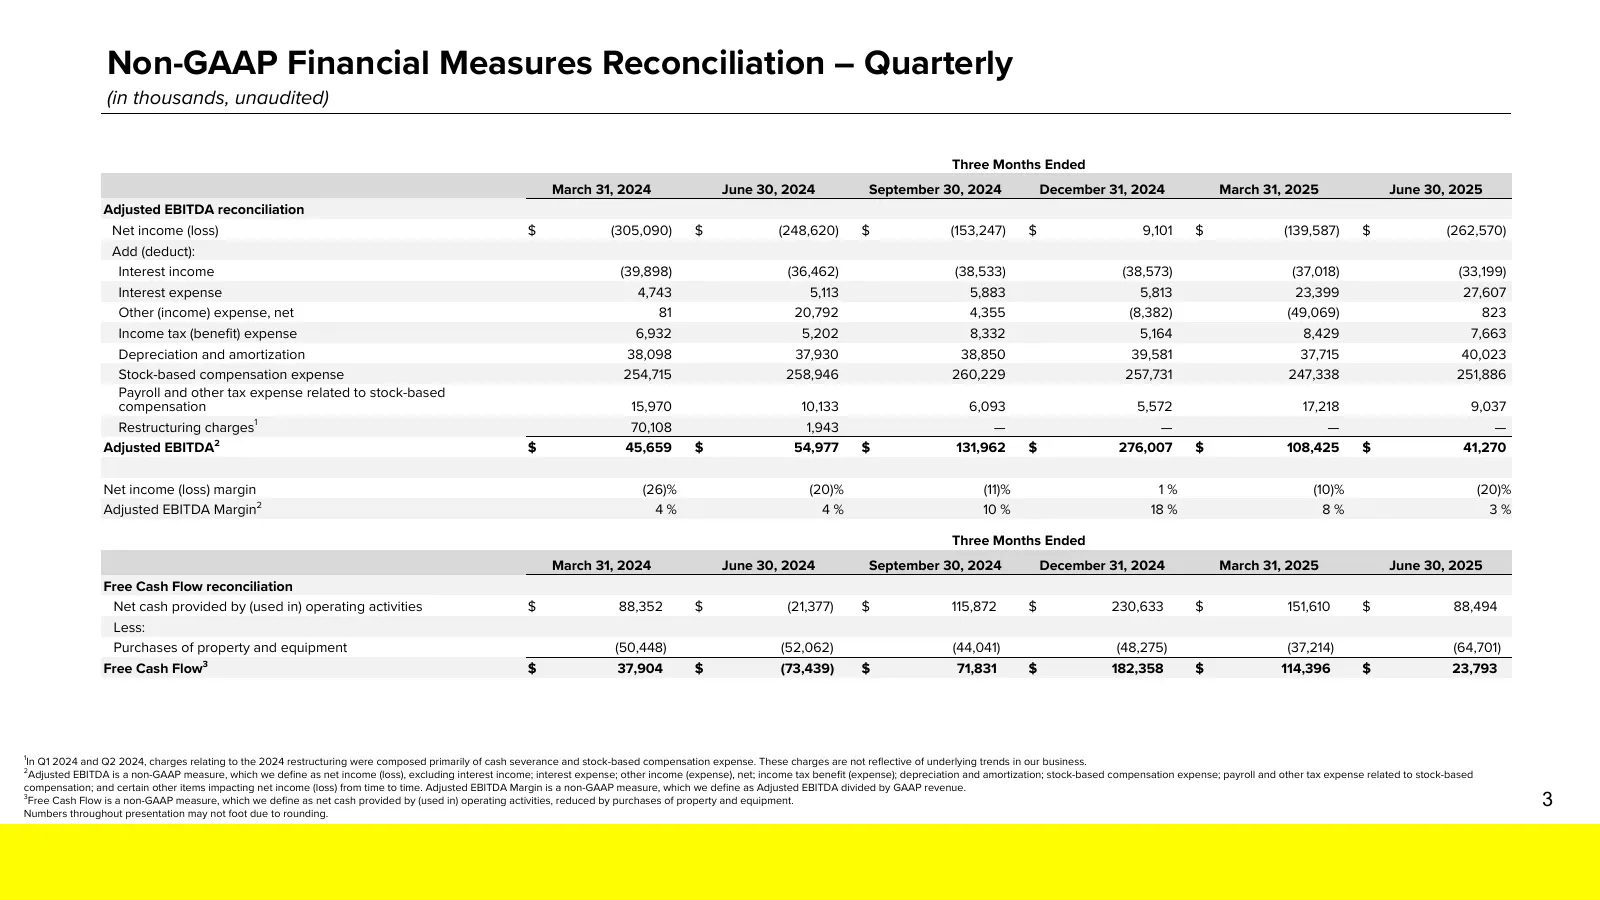
Slide 21: Non-GAAP Financial Measures Reconciliation – Quarterly
Non-GAAP Financial Measures Reconciliation – Quarterly (in thousands, unaudited) Three Months Ended March 31, 2024 June 30, 2024 September 30, 2024 December 31, 2024 March 31, 2025 June 30, 2025 Adjusted EBITDA reconciliation Net income (loss) $ (305,090) $ (248,620) $ (153,247) $ 9,101 $ (139,587)
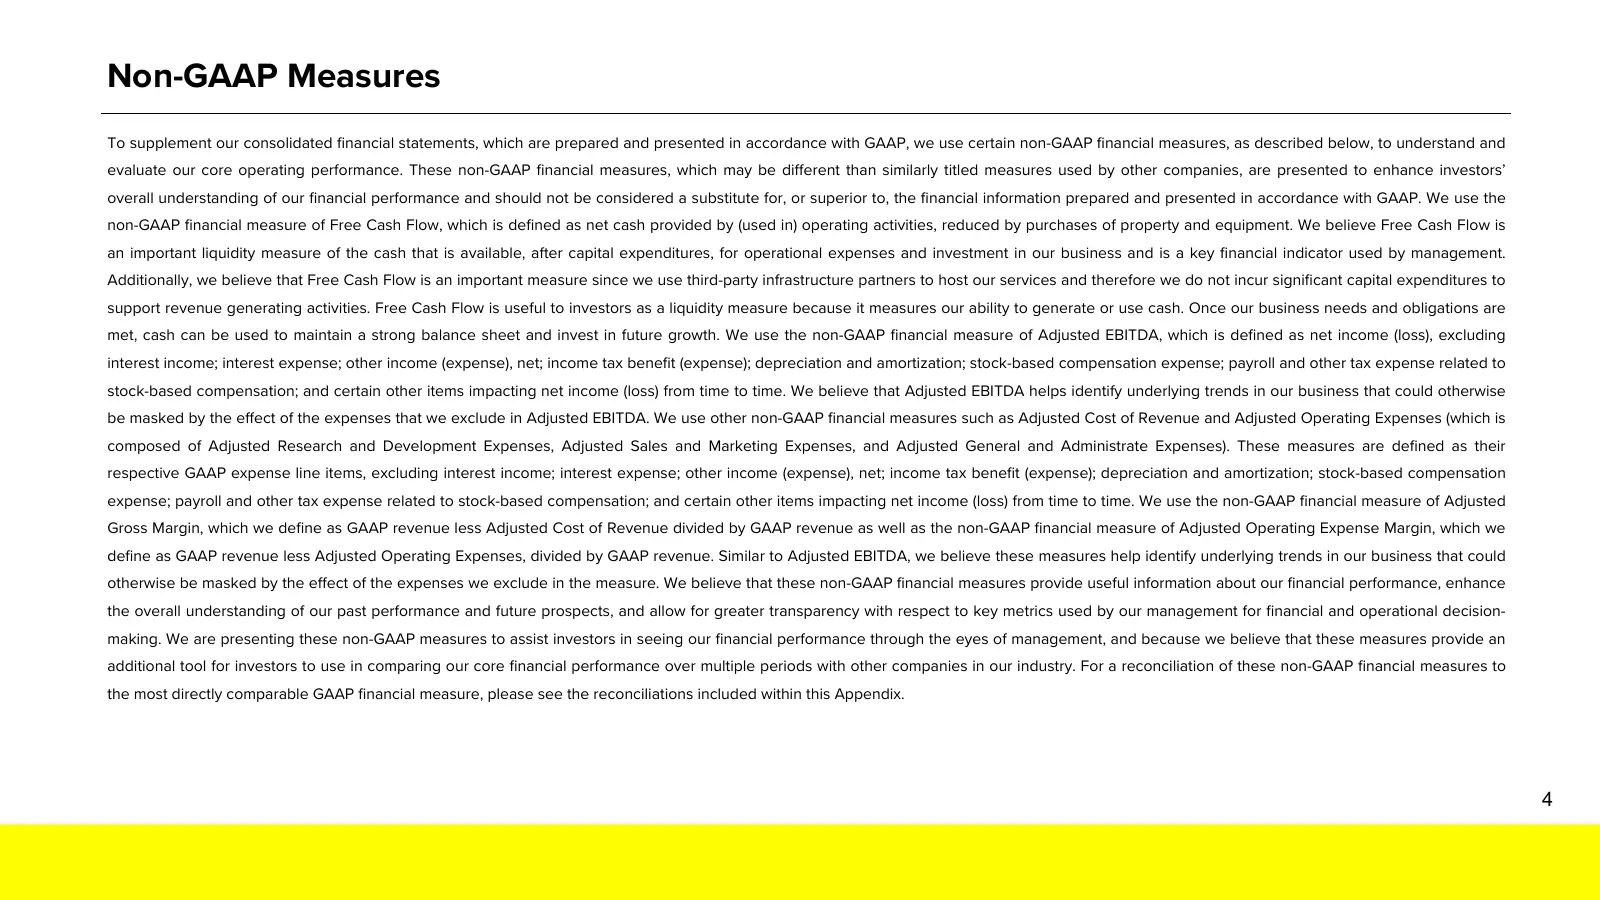
Slide 22: Non-GAAP Measures
Non-GAAP Measures To supplement our consolidated financial statements, which are prepared and presented in accordance with GAAP, we use certain non-GAAP financial measures, as described below, to understand and evaluate our core operating performance. These non-GAAP financial measures, which may be
Slide 23: Note Regarding User Metrics and Other Data
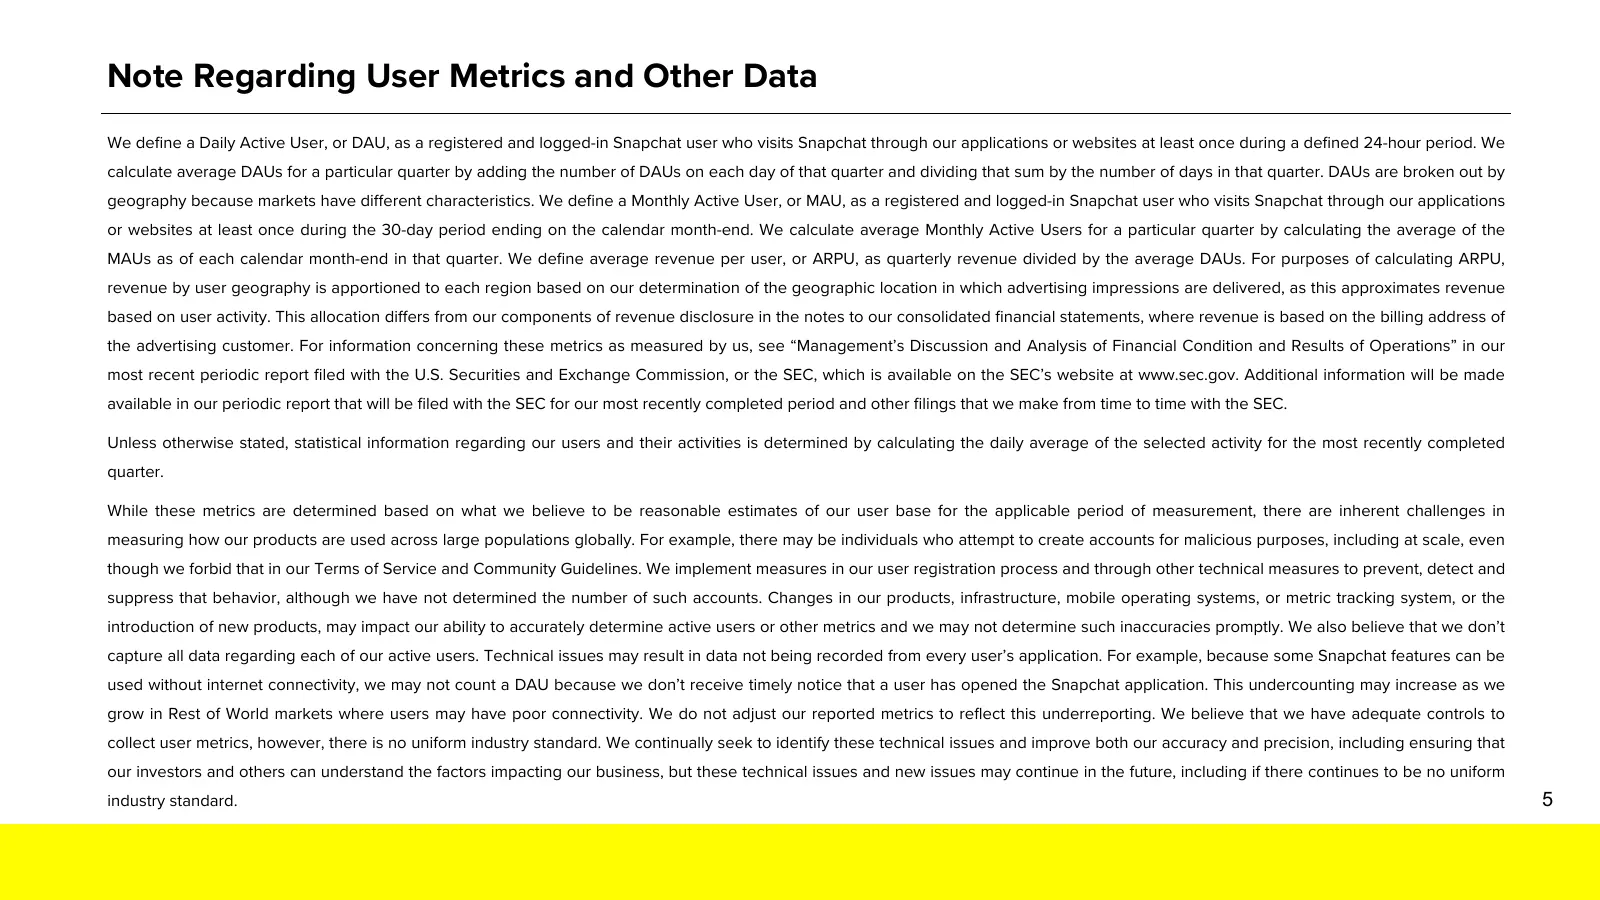
Note Regarding User Metrics and Other Data We define a Daily Active User, or DAU, as a registered and logged-in Snapchat user who visits Snapchat through our applications or websites at least once during a defined 24-hour period. We calculate average DAUs for a particular quarter by adding the numbe
Slide 24: Note Regarding User Metrics and Other Data (Continued)
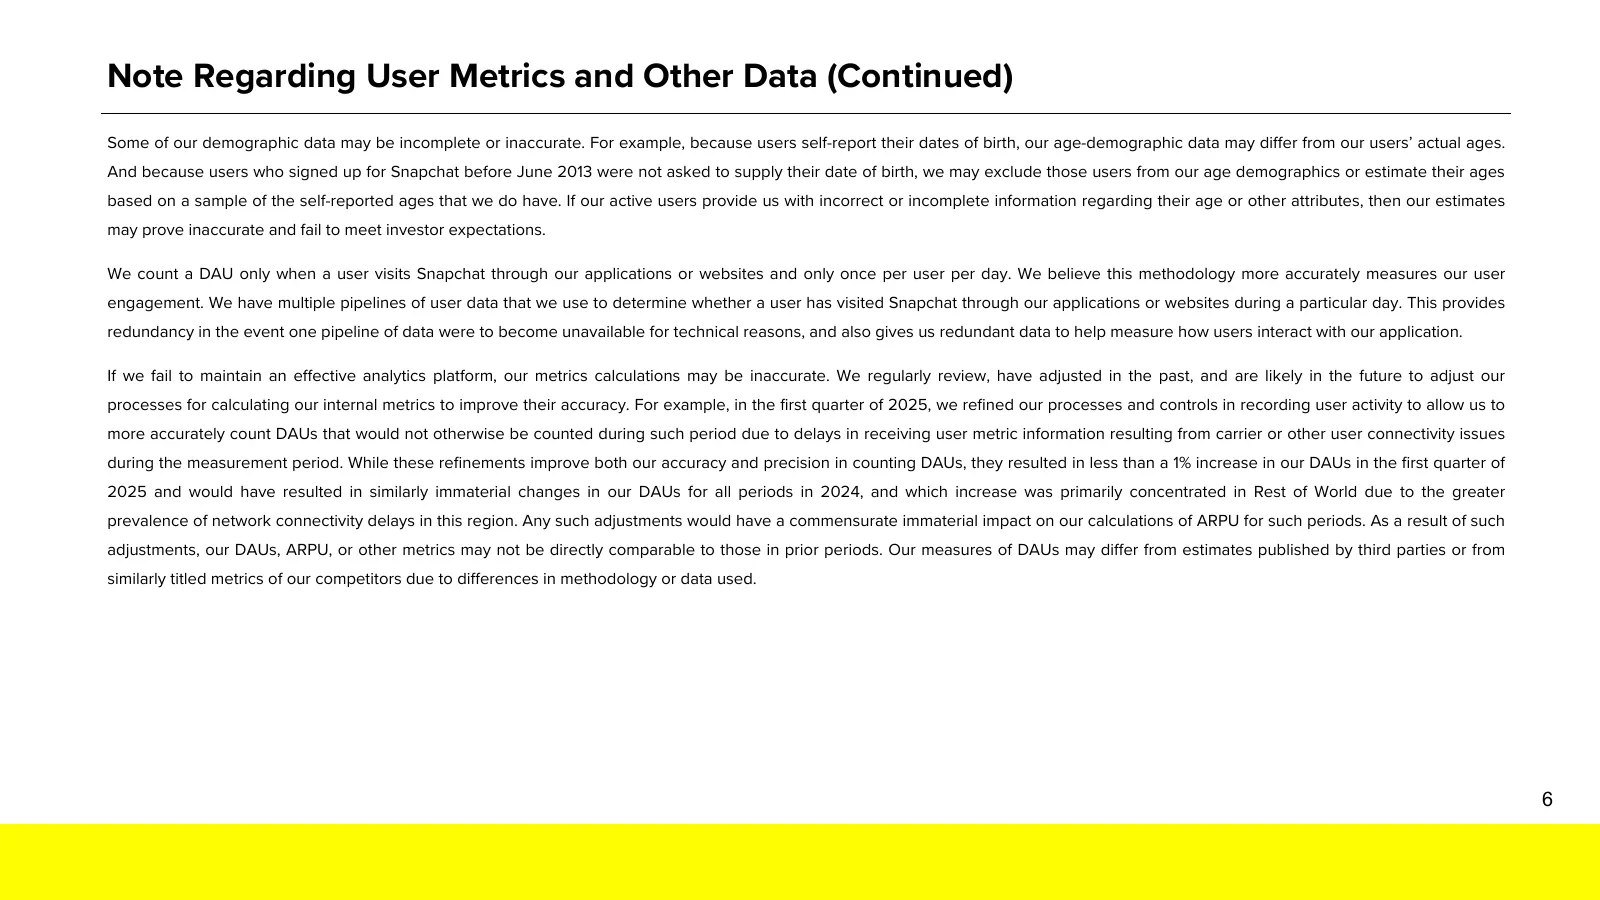
Note Regarding User Metrics and Other Data (Continued) Some of our demographic data may be incomplete or inaccurate. For example, because users self-report their dates of birth, our age-demographic data may differ from our users’ actual ages. And because users who signed up for Snapchat before June
Source: Internet Archive copy of s25.q4cdn.com
More decks from Snap Inc.
 Q2 2026 Earnings Presentation21 slides · Aug 3, 2026
 Q1 2026 Earnings Presentation22 slides · May 6, 2026
 Corporate Update (April 2026)10 slides · April 2026
 Q4 2025 Earnings Presentation32 slides · Feb 4, 2026
 Q3 2025 Earnings Presentation24 slides · Nov 5, 2025
 Q4 2024 Earnings Presentation30 slides · Feb 4, 2025