Heritage Financial Corporation · NASDAQ:HFWA
Heritage Financial — Investor Presentation (May 2017)
25 slides from Heritage Financial's investor presentation, May 10, 2017

Slide 1: Investor Presentation May 2017
Investor Presentation May 2017
Slide 2: Forward-Looking Statement
FORWARD – LOOKING STATEMENT 2 This presentation contains forward-looking statements that are subject to risks and uncertainties, including, but not limited to: • The expected revenues, cost savings, synergies and other benefits from our other merger and acquisition activities might not be realized w
Slide 3: Company Overview
3 COMPANY OVERVIEW
Slide 4: Overview
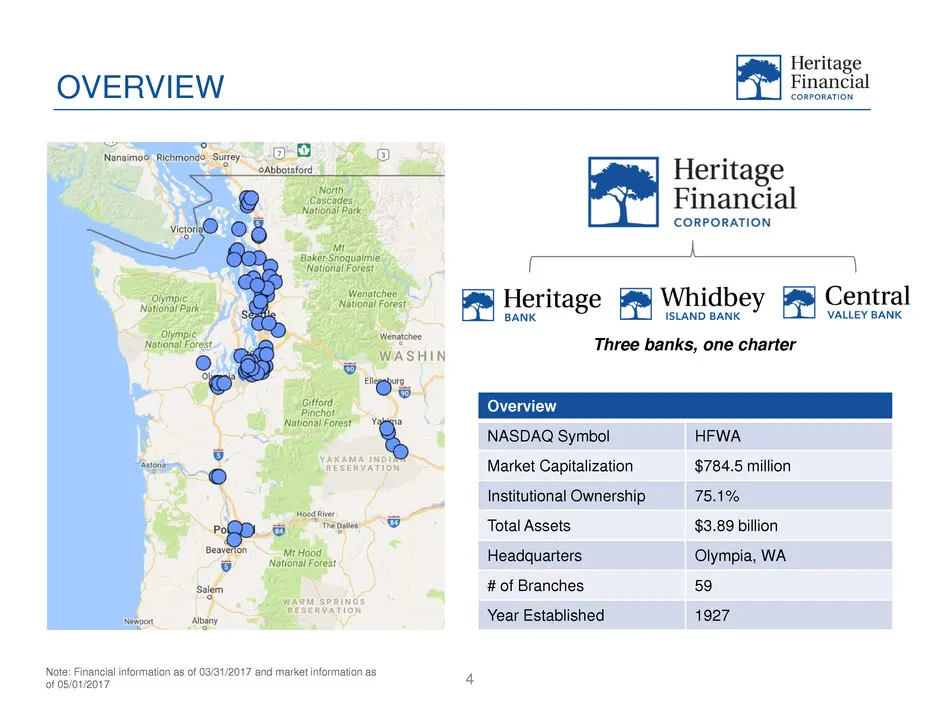
OVERVIEW 4 Overview NASDAQ Symbol HFWA Market Capitalization $784.5 million Institutional Ownership 75.1% Total Assets $3.89 billion Headquarters Olympia, WA # of Branches 59 Year Established 1927 Note: Financial information as of 03/31/2017 and market information as of 05/01/2017 Three banks, one c
Slide 5: Historical Growth – Organic and Acquisitive
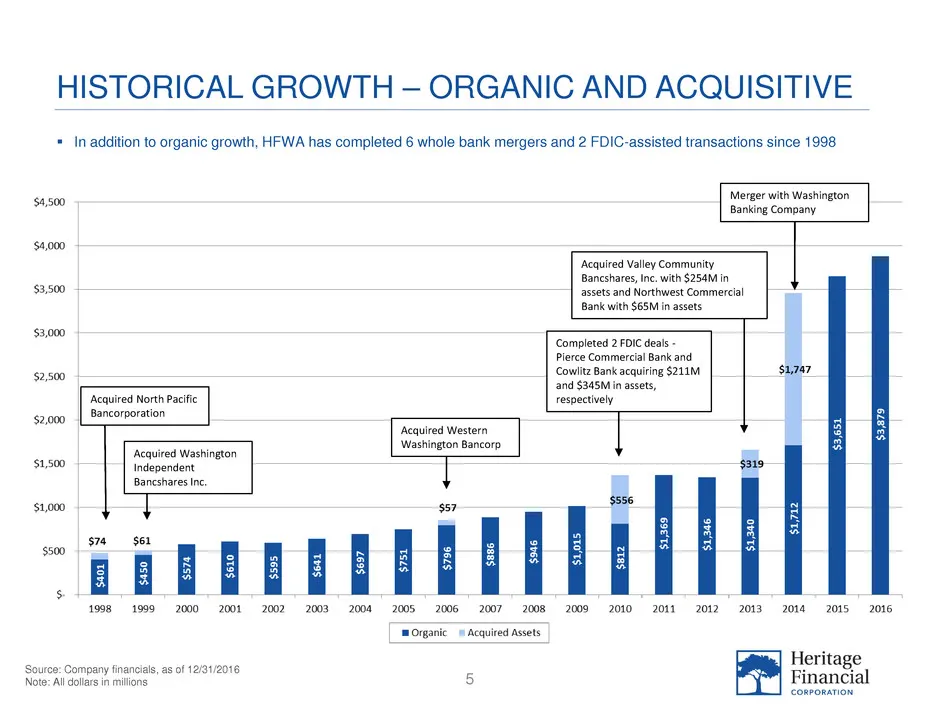
5 HISTORICAL GROWTH – ORGANIC AND ACQUISITIVE Source: Company financials, as of 12/31/2016 Note: All dollars in millions Acquired North Pacific Bancorporation Acquired Washington Independent Bancshares Inc. Acquired Western Washington Bancorp Completed 2 FDIC deals - Pierce Commercial Bank and Cowli
Slide 6: Strong and Diverse Economic Landscape
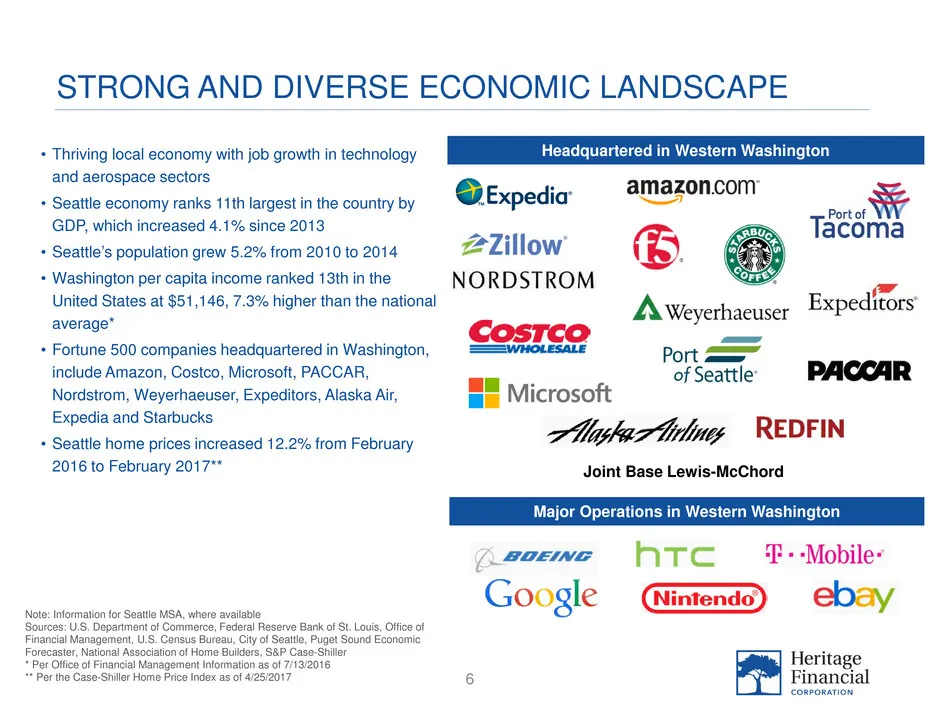
6 STRONG AND DIVERSE ECONOMIC LANDSCAPE • Thriving local economy with job growth in technology and aerospace sectors • Seattle economy ranks 11th largest in the country by GDP, which increased 4.1% since 2013 • Seattle’s population grew 5.2% from 2010 to 2014 • Washington per capita income ranked 13
Slide 7: Financial Update
7 FINANCIAL UPDATE
Slide 8: Financial Update – Q1 2017
FINANCIAL UPDATE – Q1 2017 8 • Diluted earnings per share were $0.31 for the quarter • Return on average assets was 0.97%, return on average equity was 7.78% and return on average tangible common equity was 10.51% • Dividend declared on April 25, 2017 of $0.13 per share, an increase of 8.3% from $0.
Slide 9: Loan Portfolio
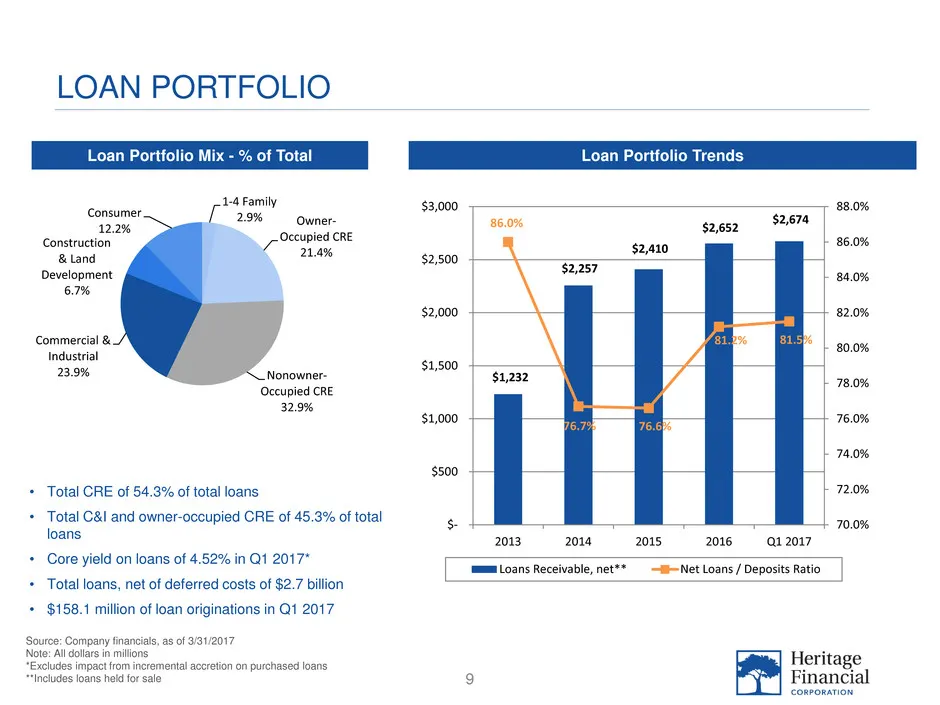
9 LOAN PORTFOLIO Loan Portfolio TrendsLoan Portfolio Mix - % of Total Source: Company financials, as of 3/31/2017 Note: All dollars in millions *Excludes impact from incremental accretion on purchased loans **Includes loans held for sale • Total CRE of 54.3% of total loans • Total C&I and owner-occu
Slide 10: Deposit Profile
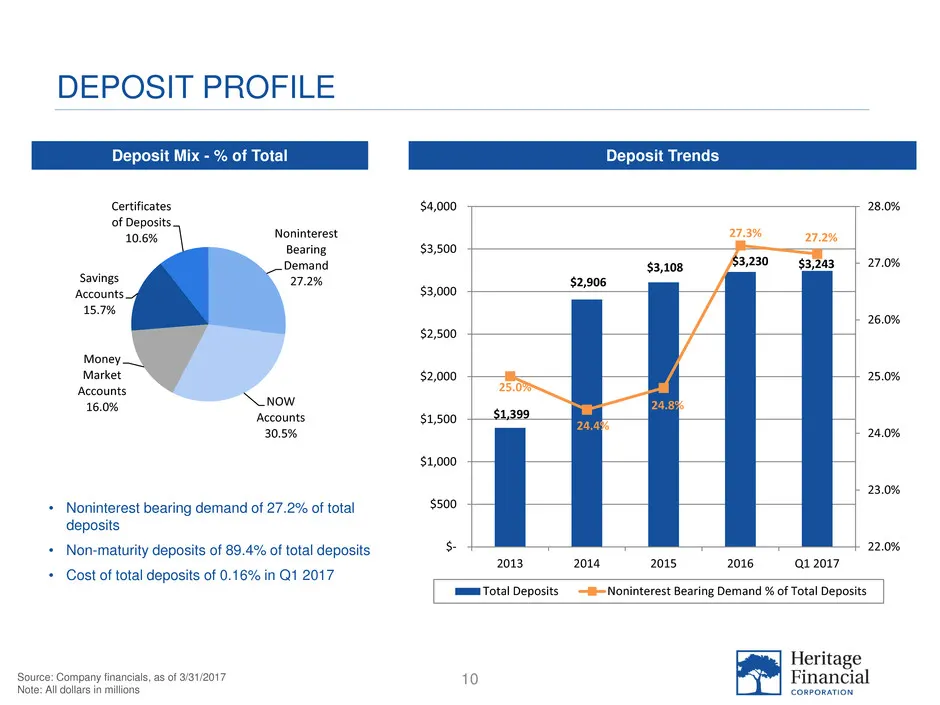
10 DEPOSIT PROFILE Deposit TrendsDeposit Mix - % of Total Source: Company financials, as of 3/31/2017 Note: All dollars in millions • Noninterest bearing demand of 27.2% of total deposits • Non-maturity deposits of 89.4% of total deposits • Cost of total deposits of 0.16% in Q1 2017 Noninterest Bear
Slide 11: Net Interest Margin Trends
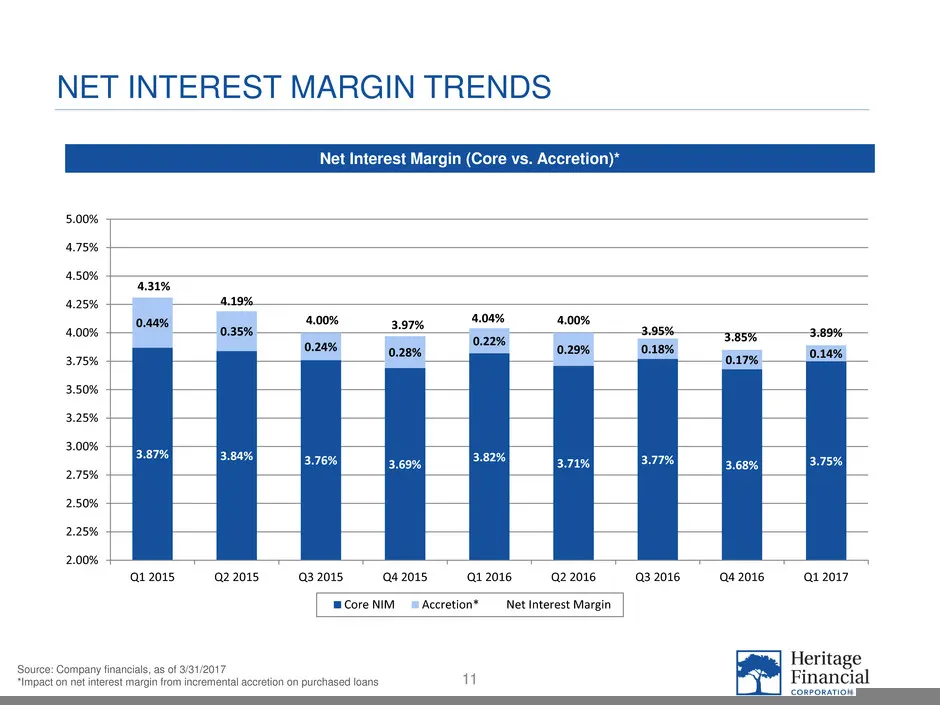
11 NET INTEREST MARGIN TRENDS Net Interest Margin (Core vs. Accretion)* Source: Company financials, as of 3/31/2017 *Impact on net interest margin from incremental accretion on purchased loans 3.87% 3.84% 3.76% 3.69% 3.82% 3.71% 3.77% 3.68% 3.75% 0.44% 0.35% 0.24% 0.28% 0.22% 0.29% 0.18% 0.17% 0.14%
Slide 12: Cash, Interest Earning Deposits & Investment Securities
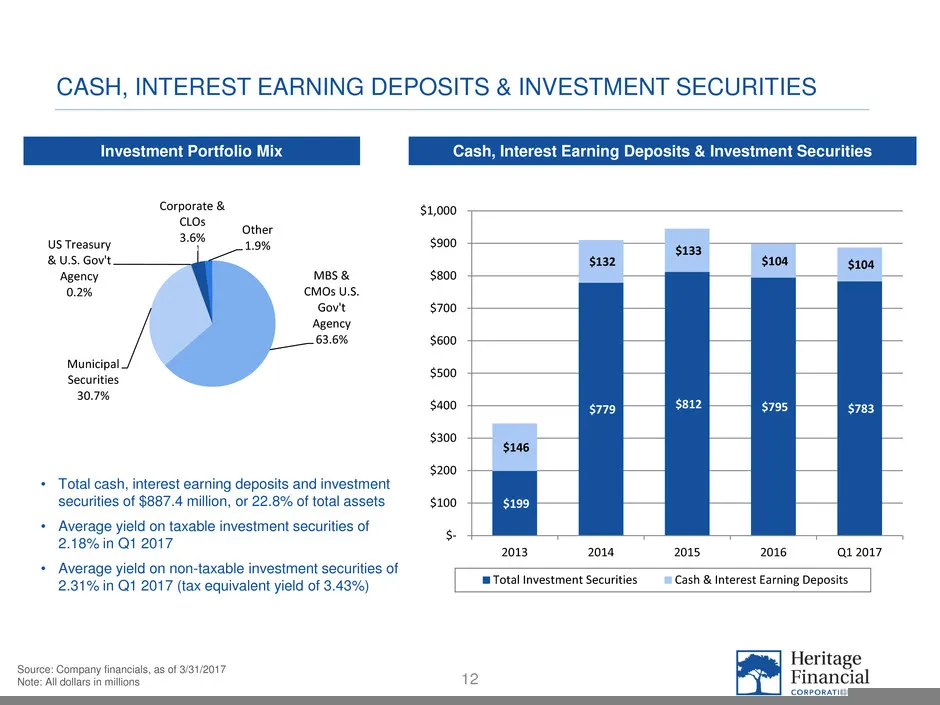
12 CASH, INTEREST EARNING DEPOSITS & INVESTMENT SECURITIES Cash, Interest Earning Deposits & Investment SecuritiesInvestment Portfolio Mix Source: Company financials, as of 3/31/2017 Note: All dollars in millions • Total cash, interest earning deposits and investment securities of $887.4 million, or
Slide 13: Non-Interest Expense
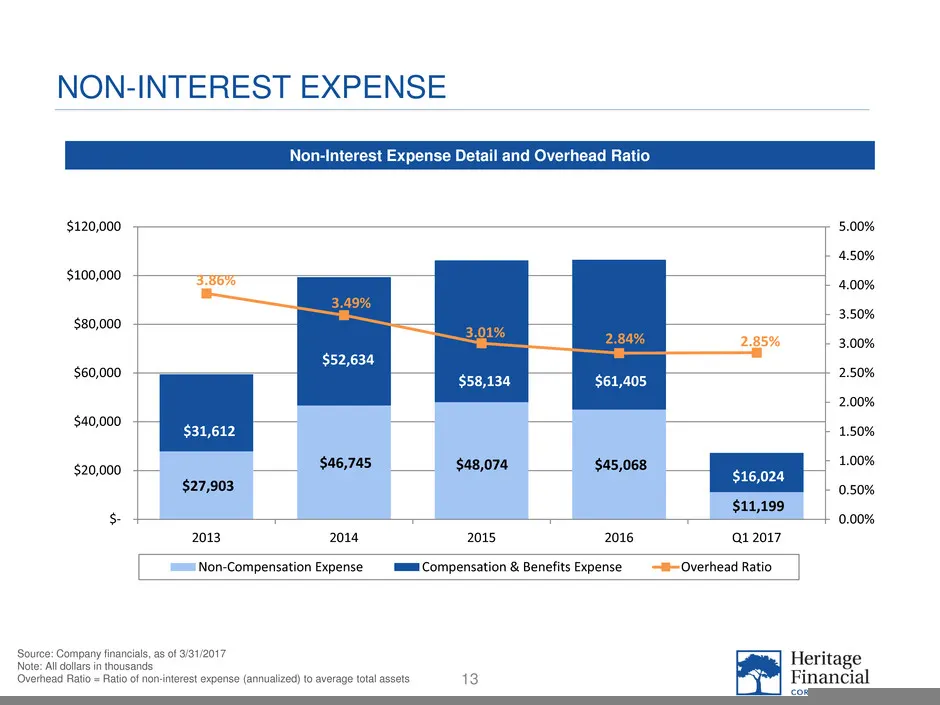
13 NON-INTEREST EXPENSE Source: Company financials, as of 3/31/2017 Note: All dollars in thousands Overhead Ratio = Ratio of non-interest expense (annualized) to average total assets Non-Interest Expense Detail and Overhead Ratio $27,903 $46,745 $48,074 $45,068 $11,199 $31,612 $52,634 $58,134 $61,40
Slide 14: Credit Quality Trends
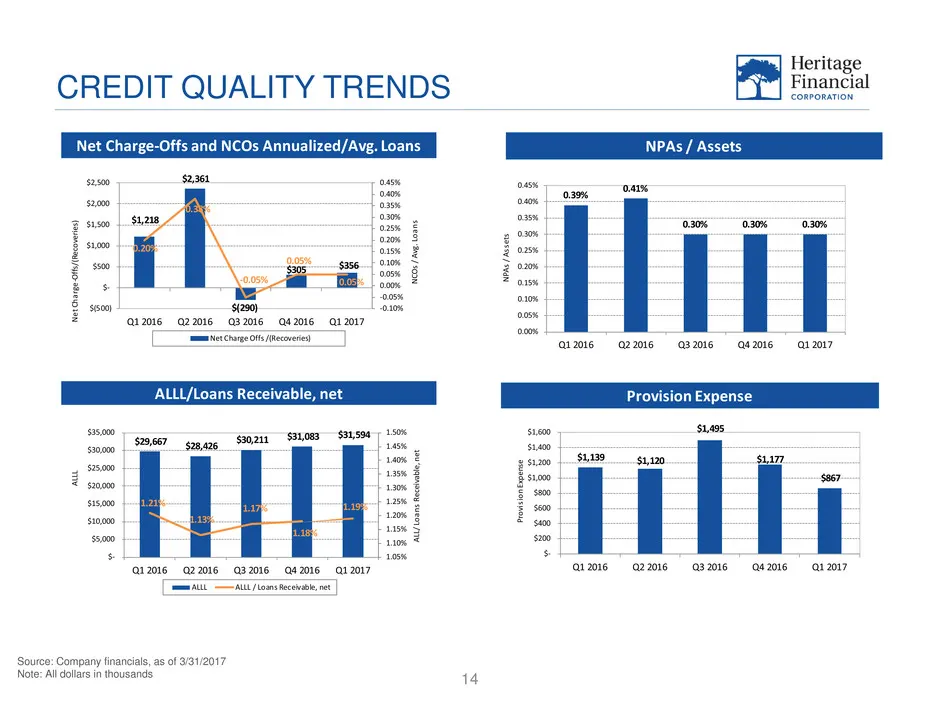
CREDIT QUALITY TRENDS 14 Source: Company financials, as of 3/31/2017 Note: All dollars in thousands - - - - $29,667 $28,426 $30,211 $31,083 $31,594 1.21% 1.13% 1.17% 1.18% 1.19% 1.05% 1.10% 1.15% 1.20% 1.25% 1.30% 1.35% 1.40% 1.45% 1.50% $- $5,000 $10,000 $15,000 $20,000 $25,000 $30,000 $35,000 Q1 2
Slide 15: Capital Ratio Trends
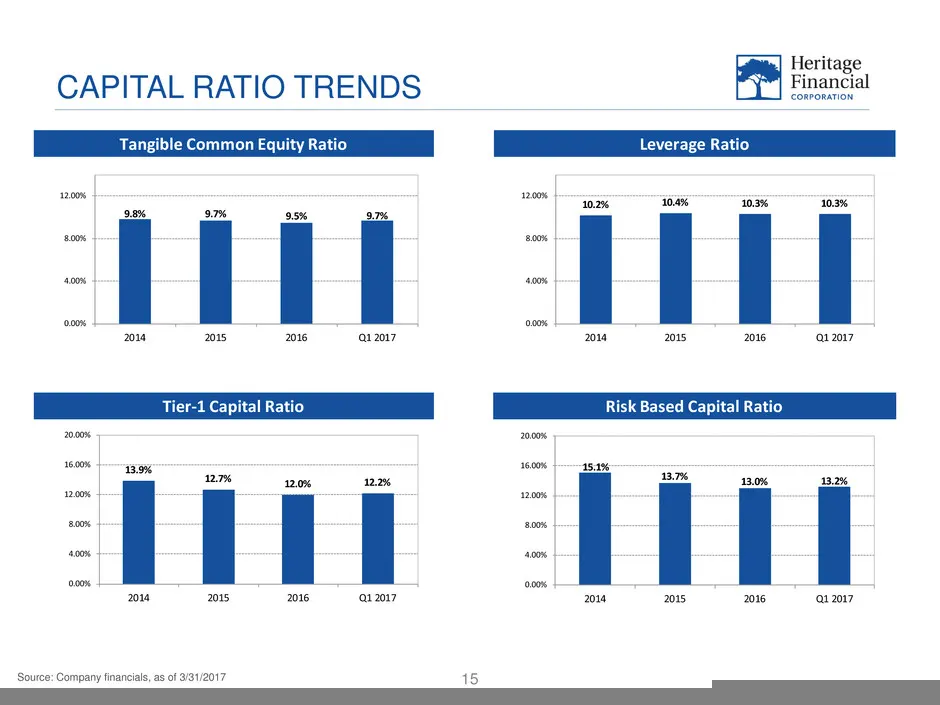
CAPITAL RATIO TRENDS 15Source: Company financials, as of 3/31/2017 - - - - Tier-1 Capital Ratio 10.2% 10.4% 10.3% 10.3% 0.00% 4.00% 8.00% 12.00% 2014 2015 2016 Q1 2017 9.8% 9.7% 9.5% 9.7% 0.00% 4.00% 8.00% 12.00% 2014 2015 2016 Q1 2017 13.9% 12.7% 12.0% 12.2% 0.00% 4.00% 8.00% 12.00% 16.00% 20.00% 2
Slide 16: Profitability Trends
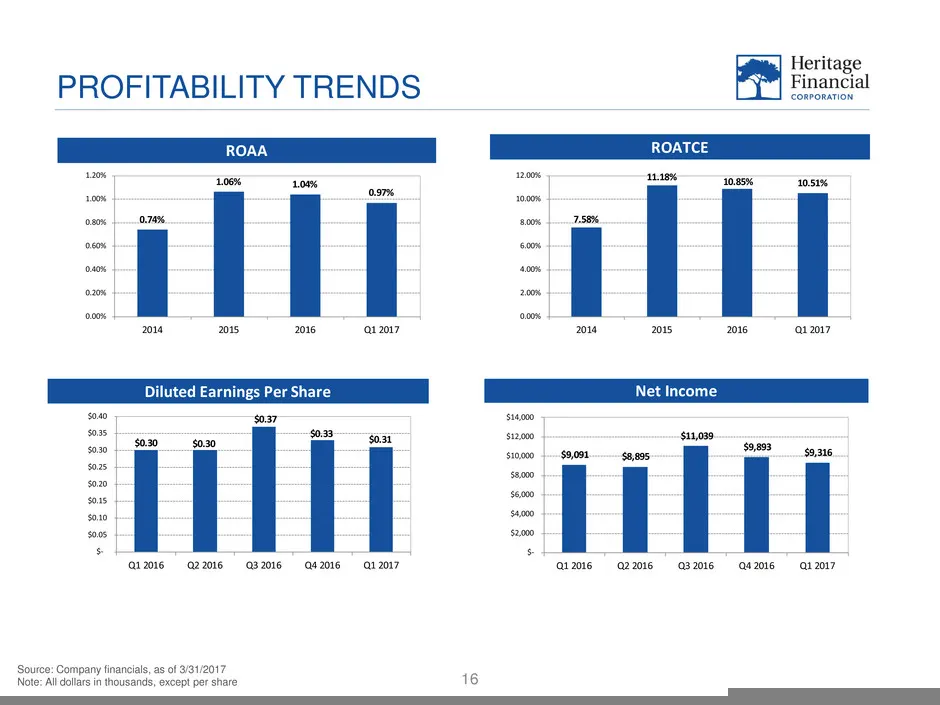
PROFITABILITY TRENDS 16 Source: Company financials, as of 3/31/2017 Note: All dollars in thousands, except per share - - ROAA 0.74% 1.06% 1.04% 0.97% 0.00% 0.20% 0.40% 0.60% 0.80% 1.00% 1.20% 2014 2015 2016 Q1 2017 7.58% 11.18% 10.85% 10.51% 0.00% 2.00% 4.00% 6.00% 8.00% 10.00% 12.00% 2014 2015 2016
Slide 17: King County Metro
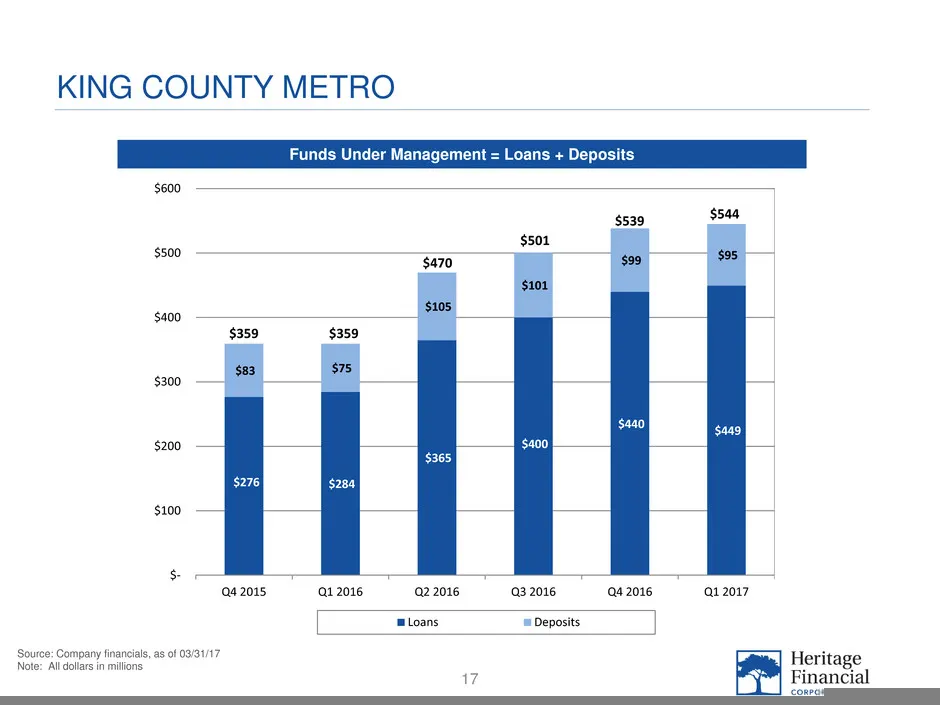
17 KING COUNTY METRO Source: Company financials, as of 03/31/17 Note: All dollars in millions Funds Under Management = Loans + Deposits $276 $284 $365 $400 $440 $449 $83 $75 $105 $101 $99 $95 $- $100 $200 $300 $400 $500 $600 Q4 2015 Q1 2016 Q2 2016 Q3 2016 Q4 2016 Q1 2017 Loans Deposits $359$359 $47
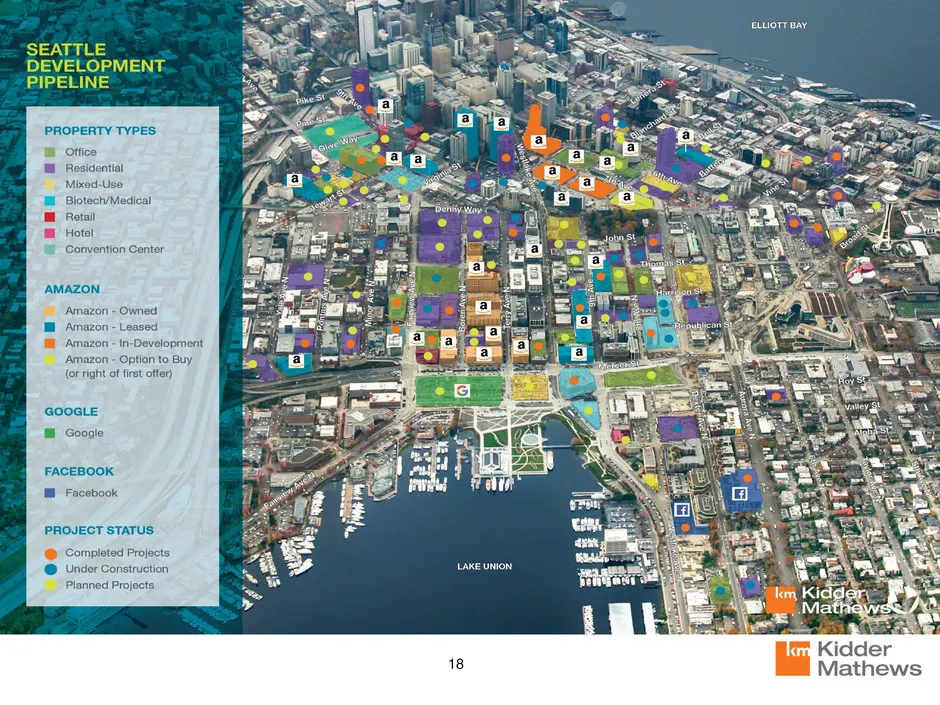
Slide 18: eLuorroay
eLuorroay ‘Amazon - Option to Buy (right of first offer) @ Completed Proj ction LAKE UNION Planned Projects Kidder Mathews
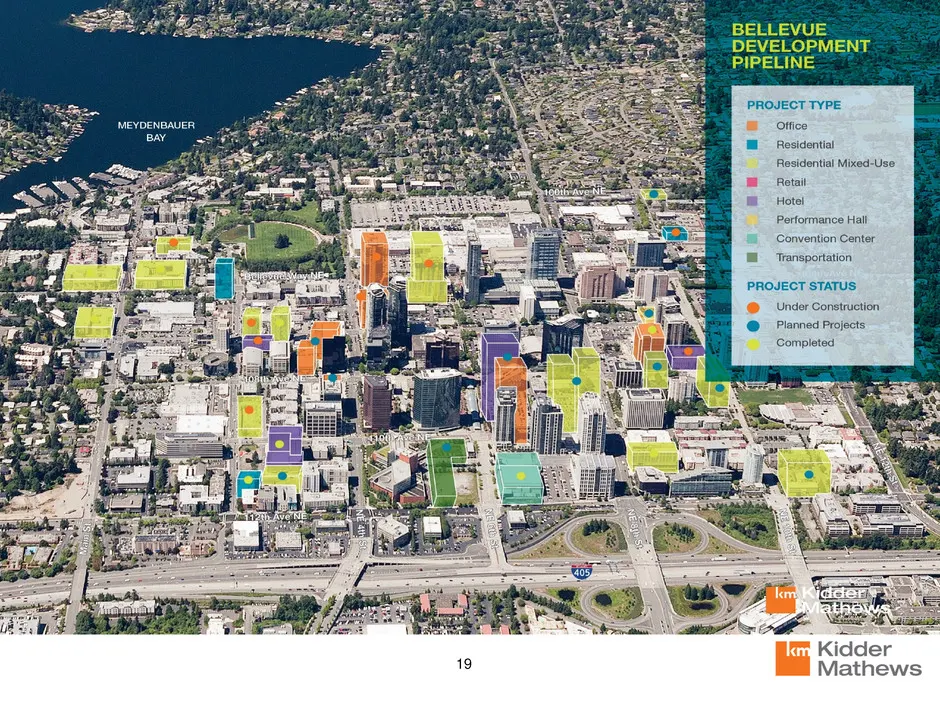
Slide 19: Bellevue Development Pipeline
LLEVUE DEVELOPMENT PIPELINE PROJECT TYPE Office Residential Residential Mixed-Use Performance Hall, Convention Center Transportation PROJECT STATUS, Under Construction. @ Planned Projects Completed Kidder 19 Mathews
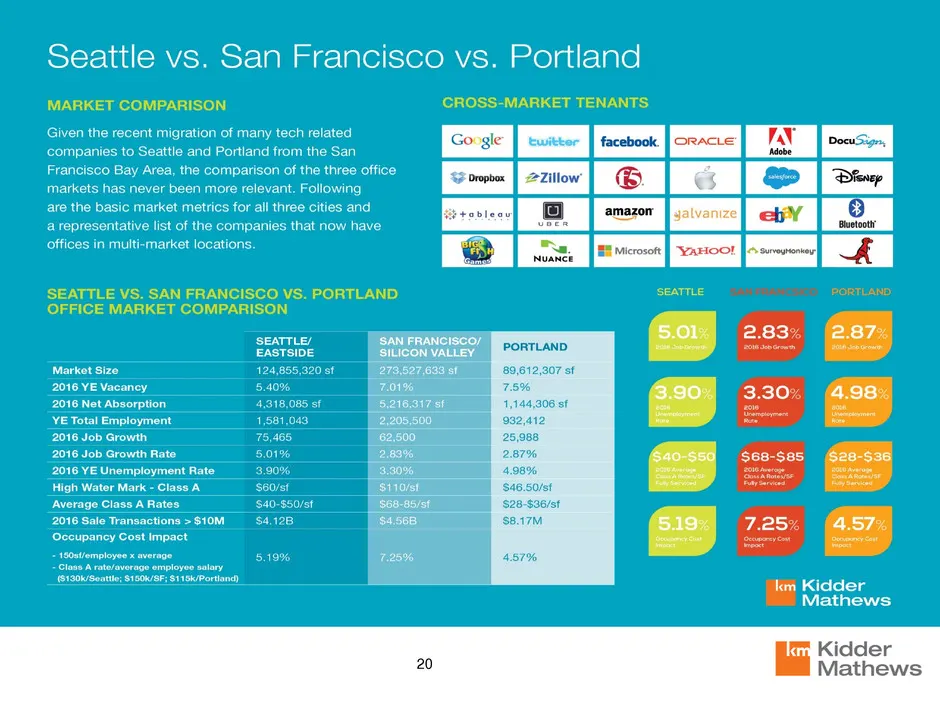
Slide 20: Market Comparison
MARKET COMPARISON a SEATTLE VS. SAN FRANCISCO VS. PORTLAND OFFICE MARKET COMPARISON (CROSS-MARKET TENANTS facebook Joracte | VAY | pocu tae ® Dheusp amazon | ja\vance mazon faaivanze| ety | 8. BE Micosot | -yAx21001 | anermer Kidder Mathews
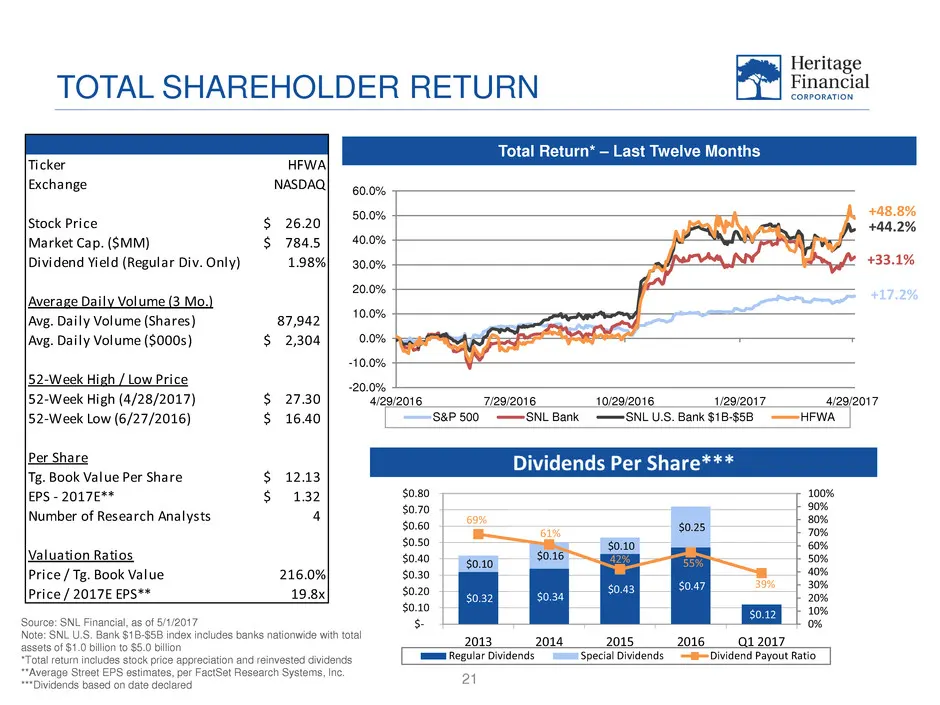
Slide 21: Total Shareholder Return
TOTAL SHAREHOLDER RETURN 21 Total Return* – Last Twelve Months Source: SNL Financial, as of 5/1/2017 Note: SNL U.S. Bank $1B-$5B index includes banks nationwide with total assets of $1.0 billion to $5.0 billion *Total return includes stock price appreciation and reinvested dividends **Average Street
Slide 22: HFWA Investment Thesis
HFWA INVESTMENT THESIS 22 • Western Washington geographic footprint with vibrant economy and attractive long-term demographics • Continued focus on growth trends and capital management – Grow organically and continue to evaluate M&A opportunities – Continue to focus on improving shareholder value •
Slide 23: Appendix
23 APPENDIX
Slide 24: Historical Financial Highlights
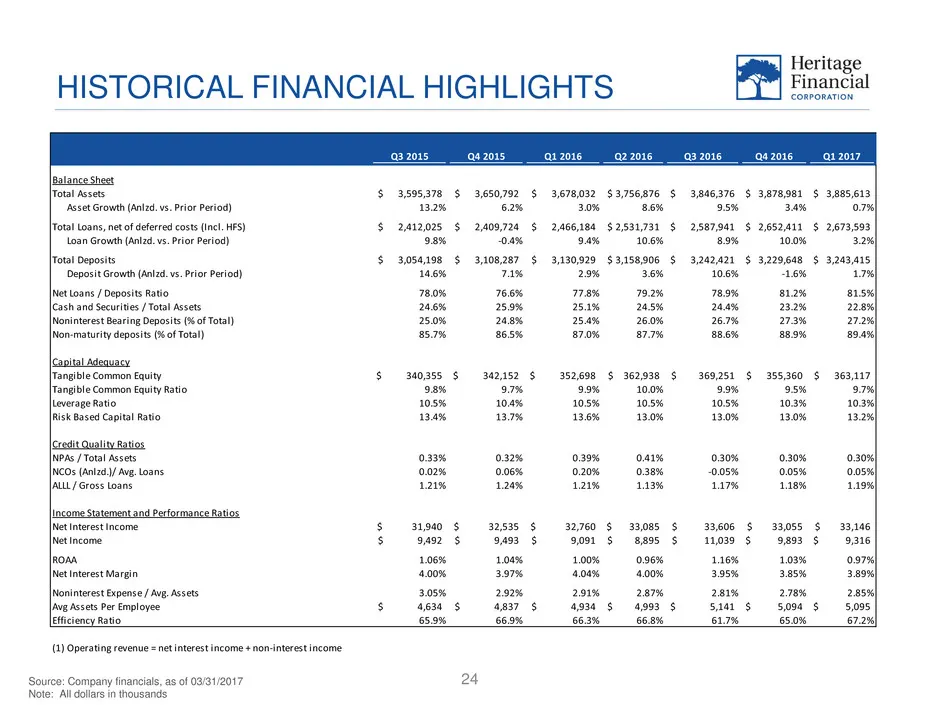
HISTORICAL FINANCIAL HIGHLIGHTS 24Source: Company financials, as of 03/31/2017 Note: All dollars in thousands Q3 2015 Q4 2015 Q1 2016 Q2 2016 Q3 2016 Q4 2016 Q1 2017 Balance Sheet Total Assets 3,595,378$ 3,650,792$ 3,678,032$ 3,756,876$ 3,846,376$ 3,878,981$ 3,885,613$ Asset Growth (Anlzd. vs. Prior
Slide 25: Discounts on Acquired Loans
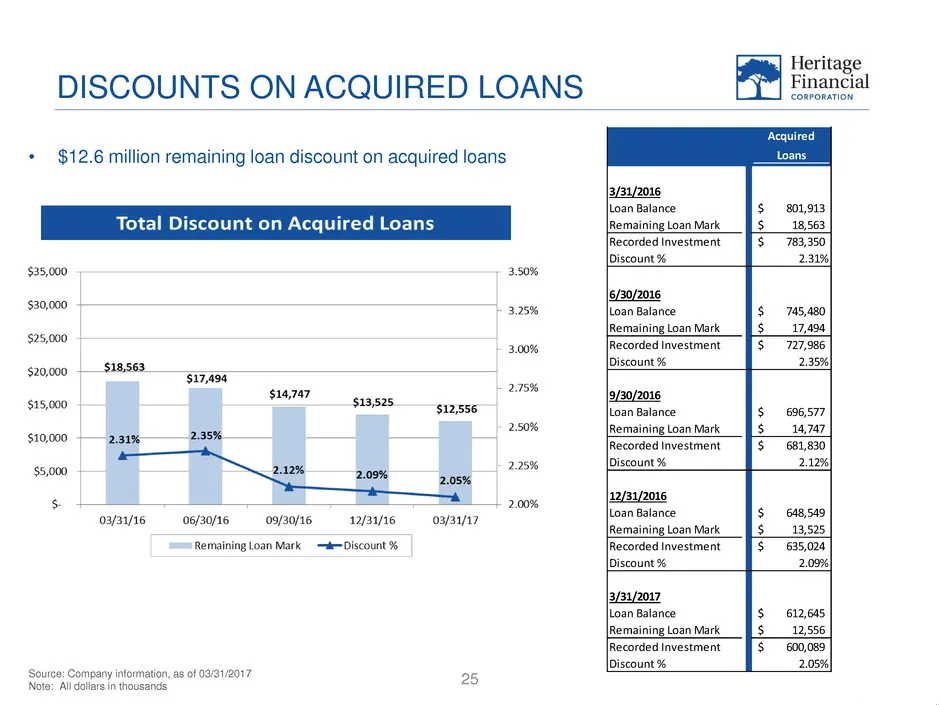
DISCOUNTS ON ACQUIRED LOANS 25 • $12.6 million remaining loan discount on acquired loans Source: Company information, as of 03/31/2017 Note: All dollars in thousands Acquired Loans 3/31/2016 Loan Balance 801,913$ Remaining Loan Mark 18,563$ Recorded Investment 783,350$ Discount % 2.31% 6/30/2016 Loa
Source: SEC EDGAR · 8-K filed May 10, 2017
More decks from Heritage Financial Corporation
 Q3 2026 Earnings Presentation39 slides · Oct 22, 2026
 Q2 2026 Earnings Presentation39 slides · Jul 23, 2026
 Q1 2026 Earnings Presentation40 slides · Apr 23, 2026
 Q4 2025 Earnings Presentation41 slides · Jan 22, 2026
 Q3 2025 Earnings Presentation41 slides · Oct 23, 2025
 Merger or Acquisition (October 2025)22 slides · Oct 1, 2025