WH Smith PLC · LSE:SMWH
WH Smith — FY2026 Earnings Presentation
34 slides from WH Smith's earnings presentation, November 2026
Slide 1: Disclaimer
Disclaimer Disclaimer This document contains forward-looking statements with respect to the operations, performance and financial condition of WH Smith PLC. By their nature, these statements are subject to risks, assumptions and uncertainties that could cause actual results to differ materially from
Slide 2: 2025/26 Preliminary Results
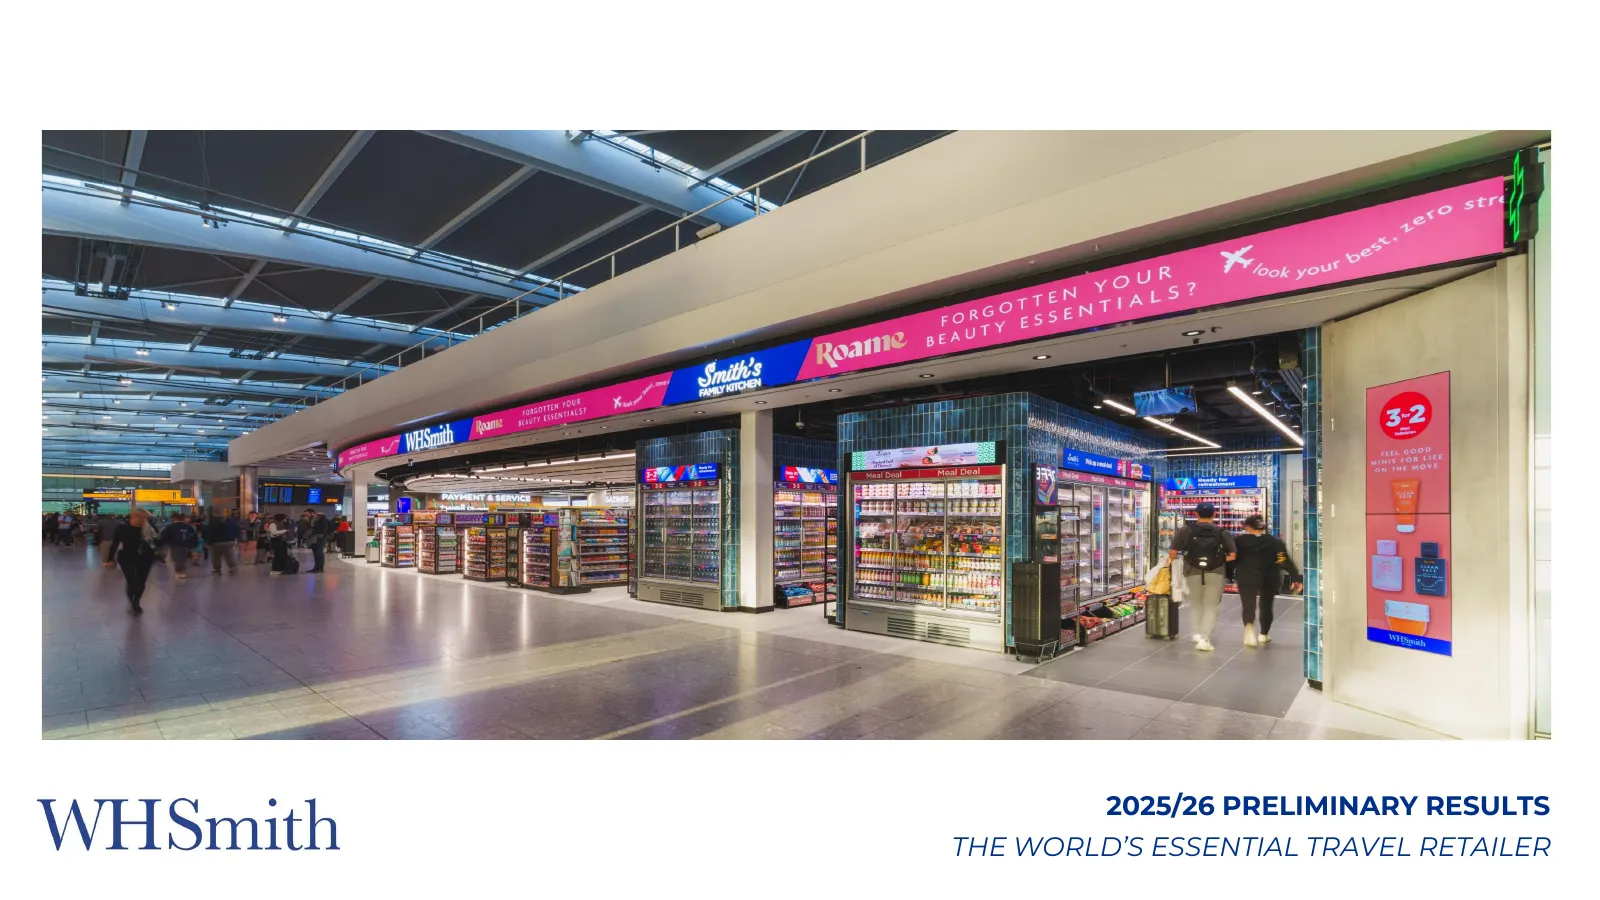
2025/26 PRELIMINARY RESULTS THE WORLD’S ESSENTIAL TRAVEL RETAILER
Slide 3: Agenda
Agenda ▪ Introduction Leo Quinn ▪ Financial Review Max Izzard ▪ Business Review Leo Quinn ▪ Q&A
Slide 4: Where we are today
Where we are today ▪ Structural growth market and strong, recognised brand ▪ High barriers to entry; premium locations ▪ Strong customer proposition ▪ Focused global portfolio ▪ Opportunity to improve capital discipline ▪ Aligned and motivated team focused on cash, cost and profitable growth Opportu
Slide 5: FY26 Financial Review
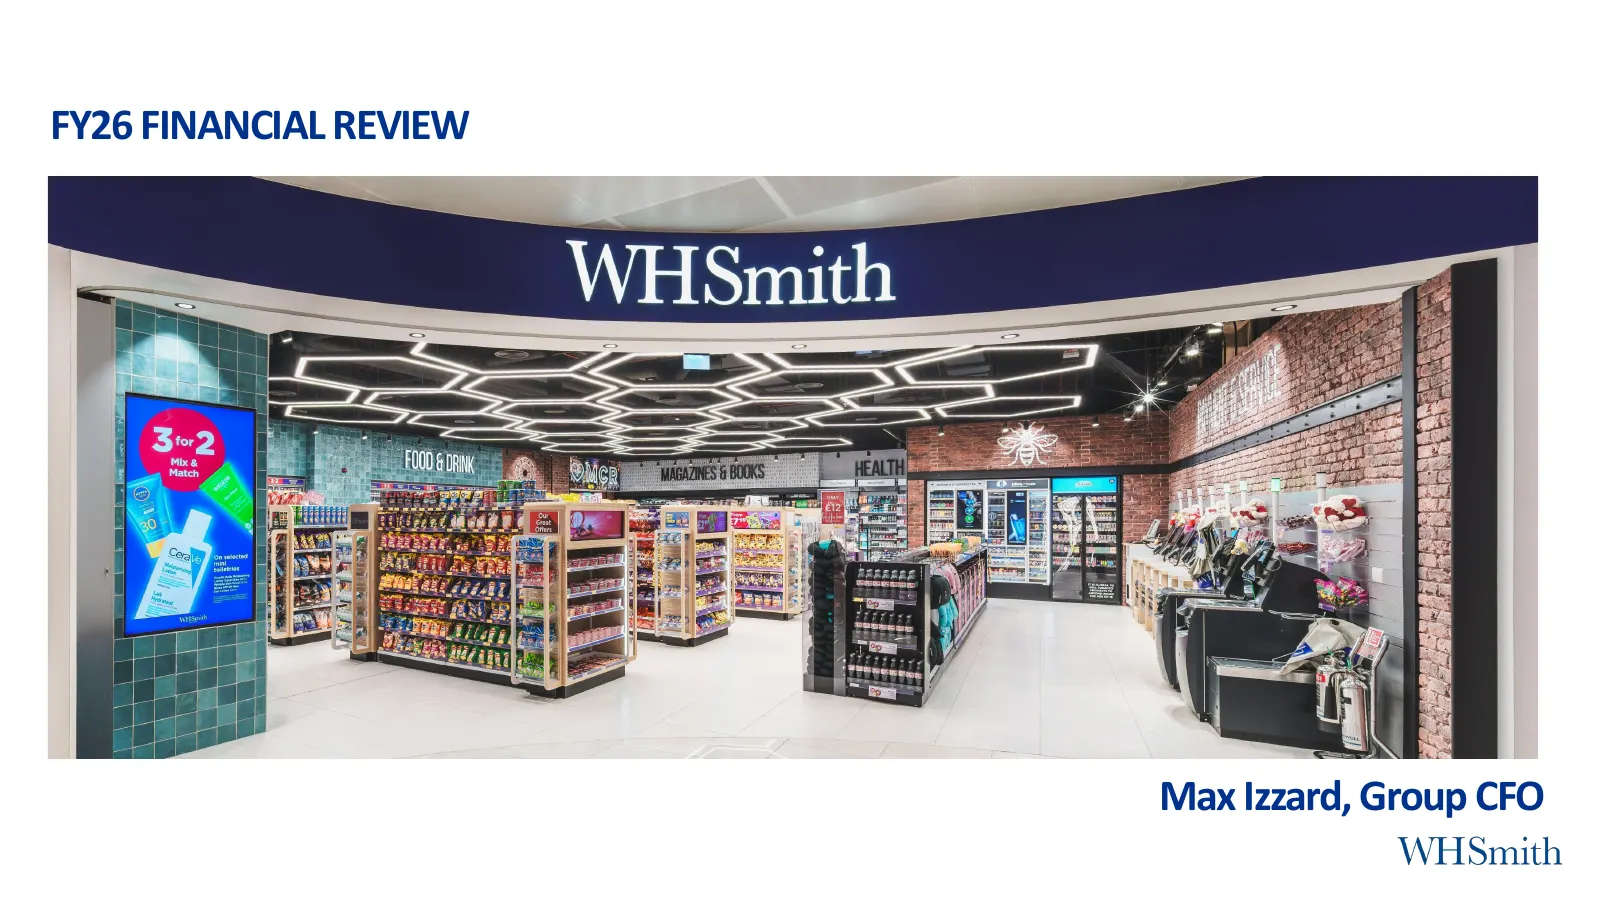
FY26 FINANCIAL REVIEW Max Izzard, Group CFO
Slide 6: Financial Performance Headlines
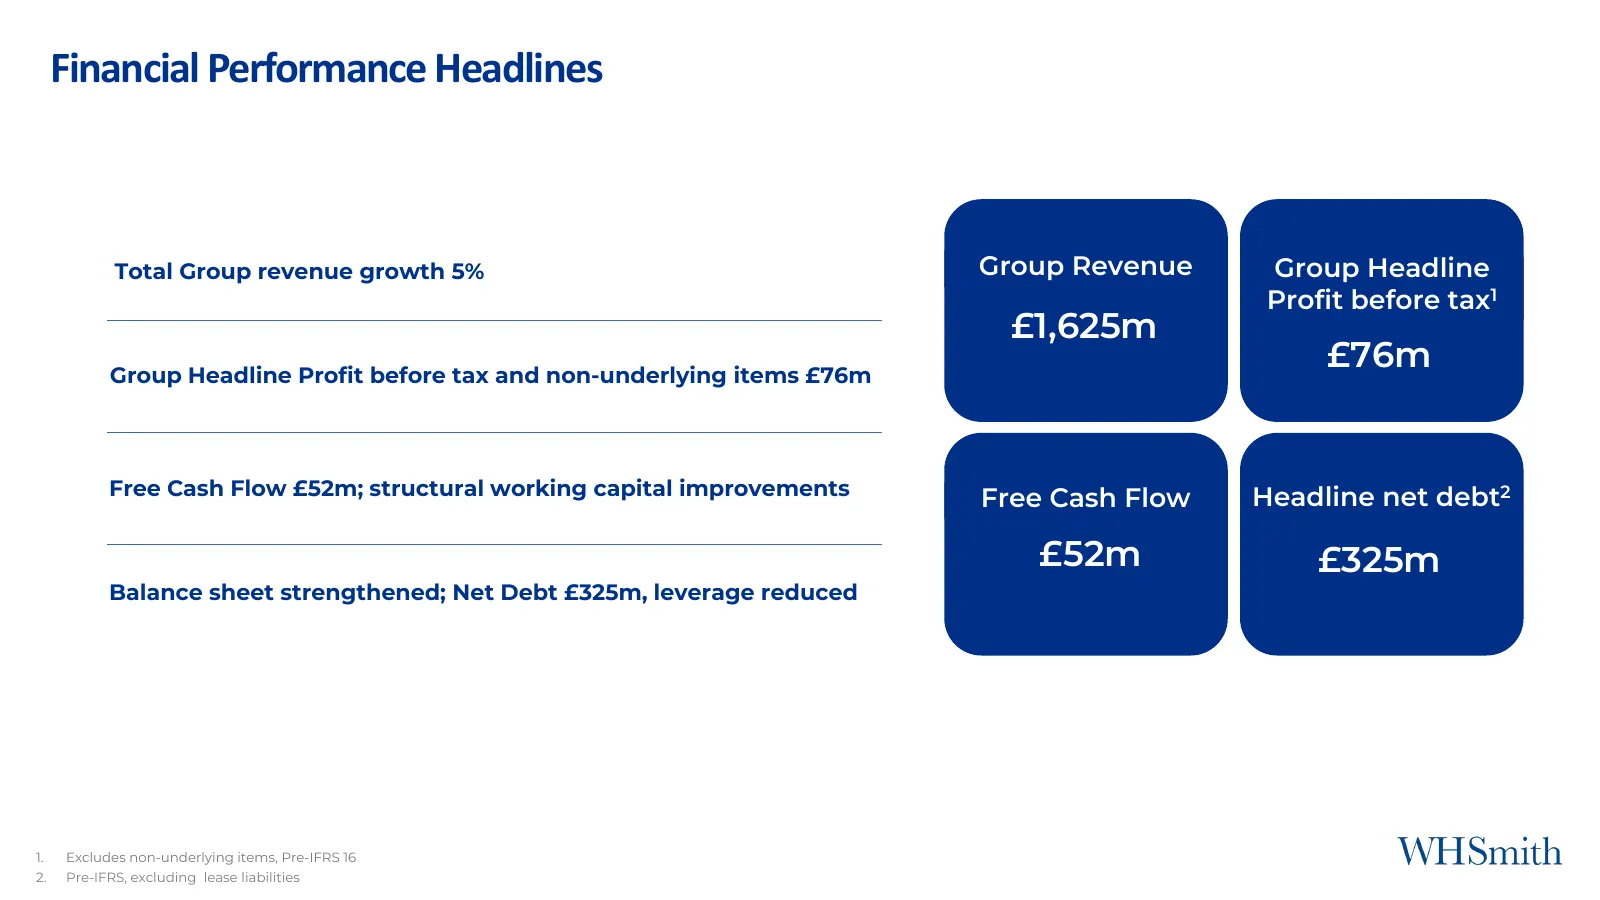
Financial Performance Headlines Total Group revenue growth 5% Group Revenue Group Headline Profit before tax1 £1,625m Group Headline Profit before tax and non-underlying items £76m £76m Free Cash Flow £52m; structural working capital improvements Headline net debt2 Free Cash Flow £52m £325m Balance
Slide 7: Group Headline Income Statement
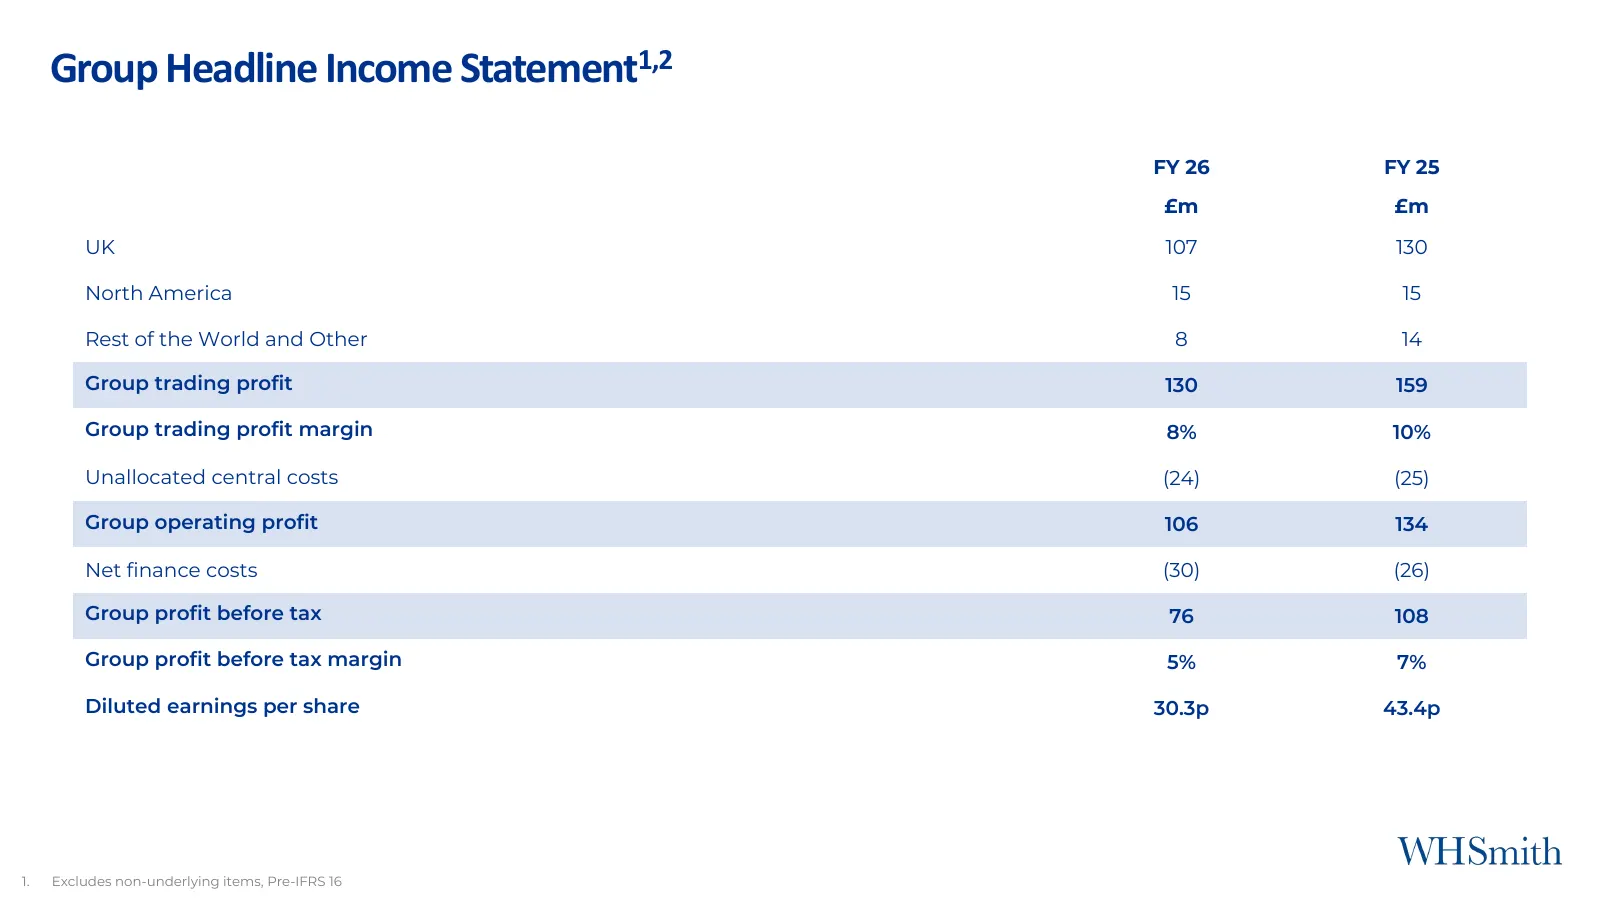
Group Headline Income Statement1,2 FY 26 FY 25 £m £m UK 107 130 North America 15 15 Rest of the World and Other 8 14 Group trading profit 130 159 Group trading profit margin 8% 10% Unallocated central costs (24) (25) Group operating profit 106 134 Net finance costs (30) (26) Group profit before tax
Slide 8: Revenue by Division and Channel
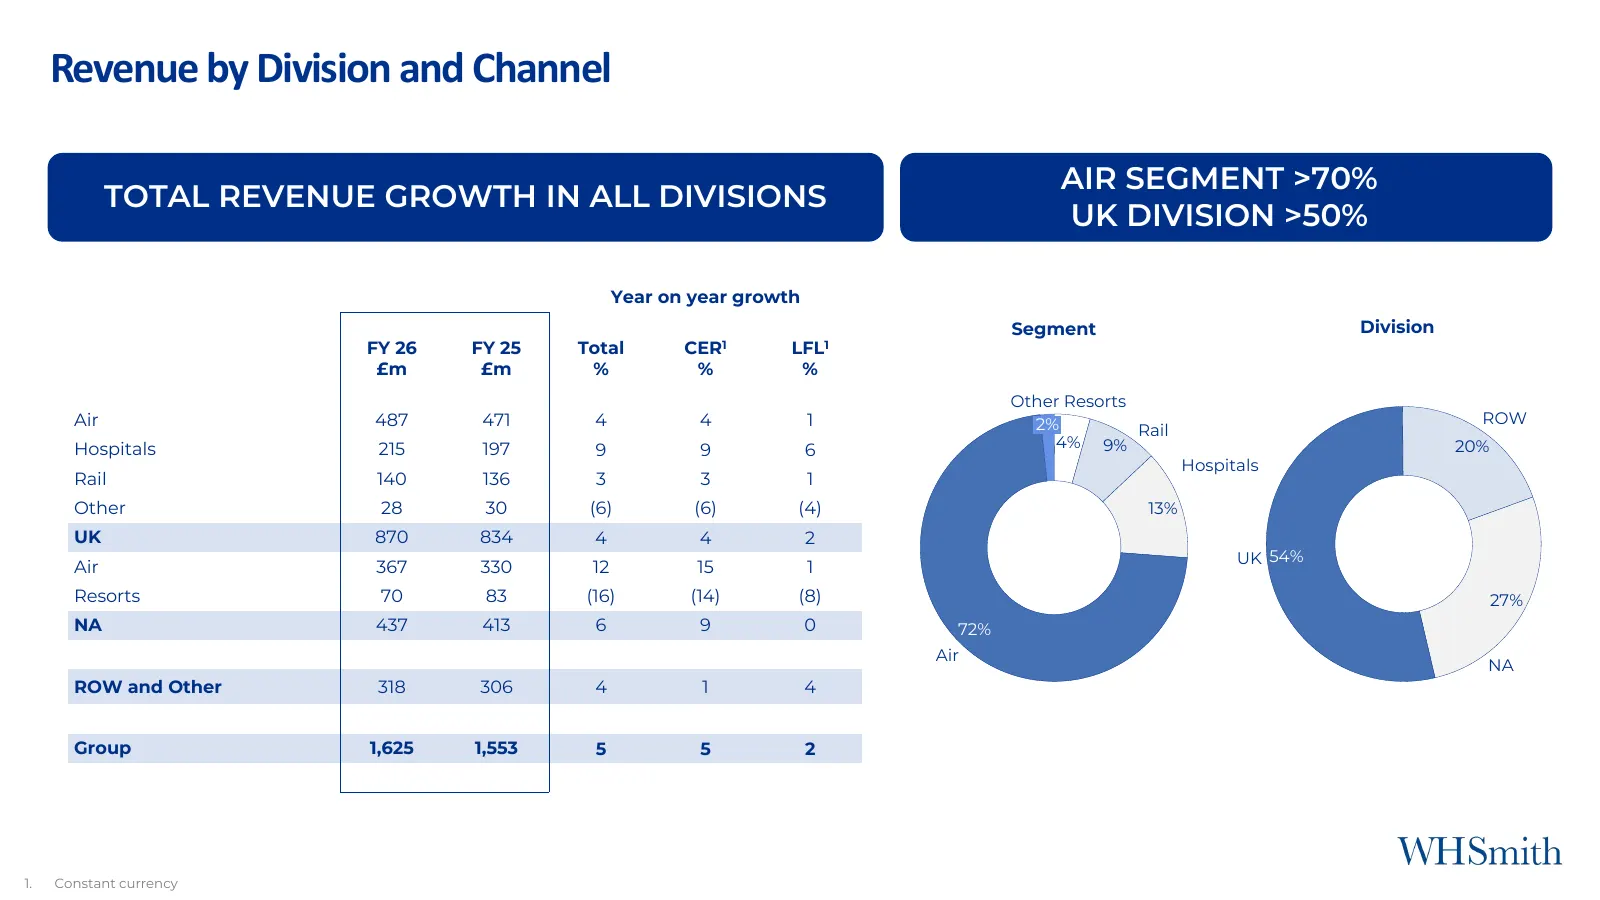
Revenue by Division and Channel AIR SEGMENT >70% TOTAL REVENUE GROWTH IN ALL DIVISIONS UK DIVISION >50% Year on year growth Segment Division FY 26 FY 25 Total CER1 LFL1 £m £m % % % Other Resorts Air 487 471 4 4 1 2% ROW Rail Hospitals 215 197 9 9 6 4% 9% 20% Hospitals Rail 140 136 3 3 1 Other 28 30
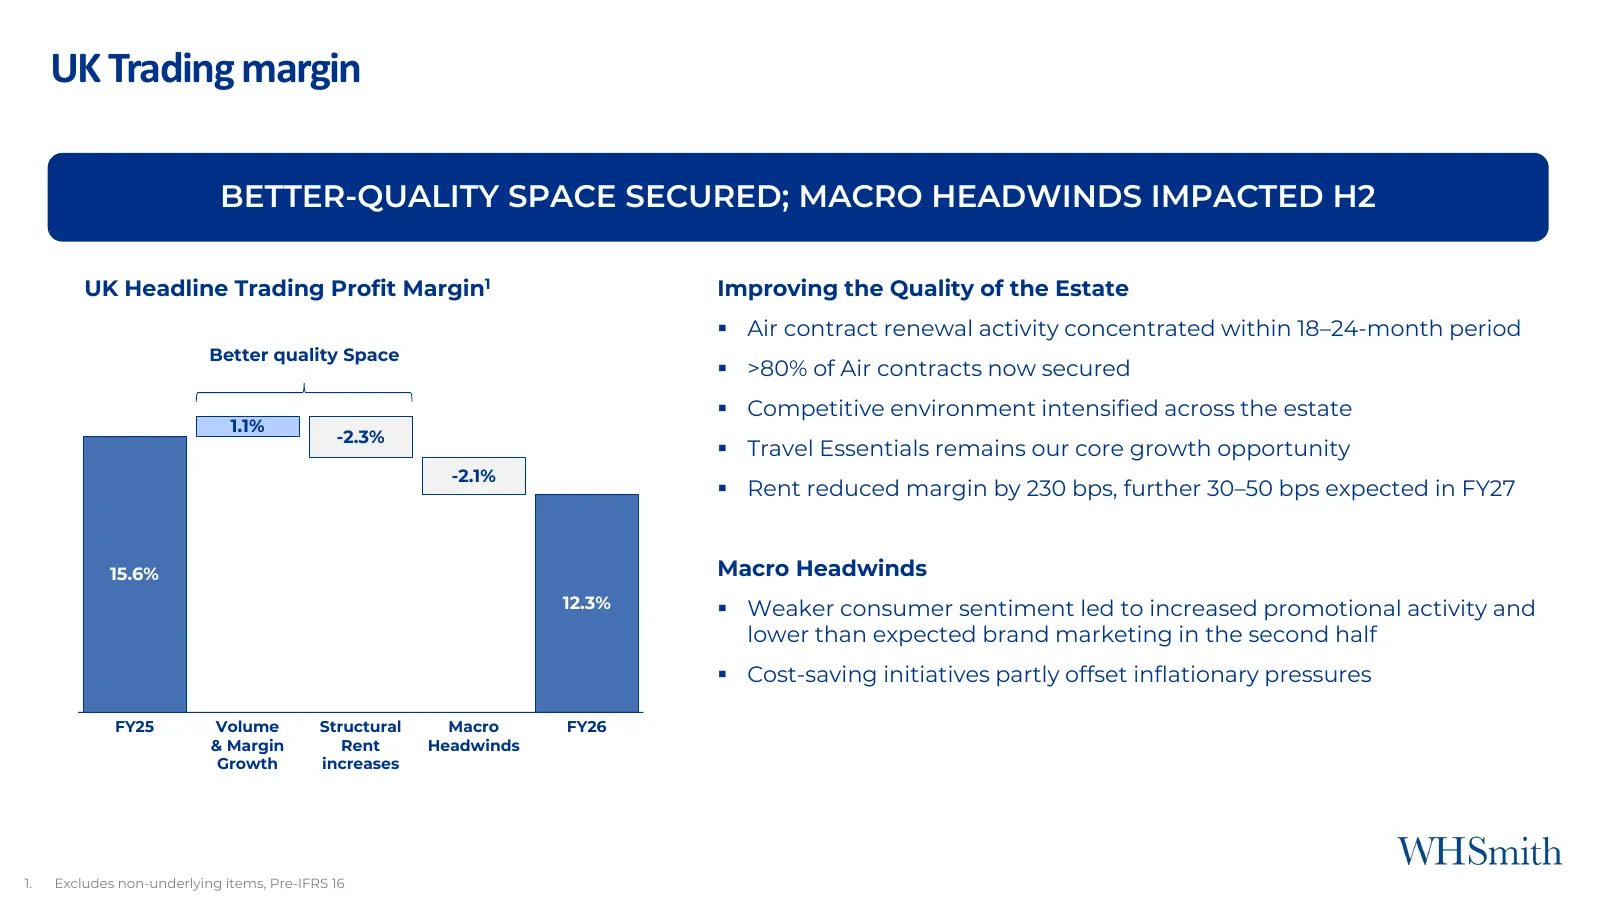
Slide 9: UK Trading margin
UK Trading margin BETTER-QUALITY SPACE SECURED; MACRO HEADWINDS IMPACTED H2 UK Headline Trading Profit Margin1 Improving the Quality of the Estate ▪ Air contract renewal activity concentrated within 18–24-month period Better quality Space ▪ >80% of Air contracts now secured ▪ Competitive environment
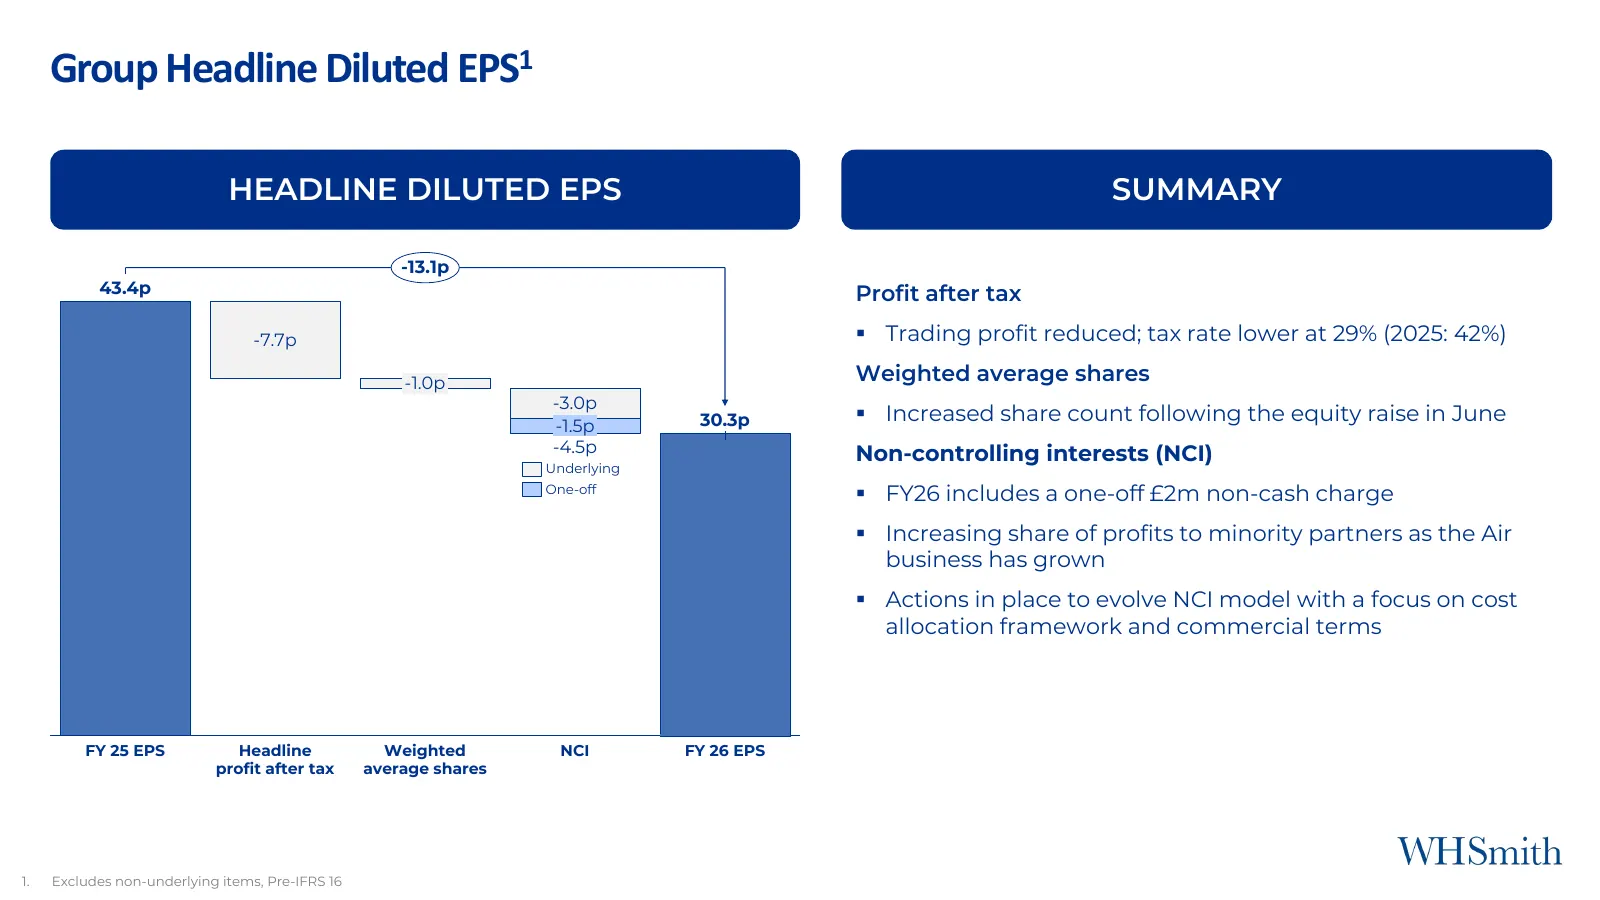
Slide 10: Group Headline Diluted EPS
Group Headline Diluted EPS1 HEADLINE DILUTED EPS SUMMARY -13.1p 43.4p Profit after tax -7.7p ▪ Trading profit reduced; tax rate lower at 29% (2025: 42%) -1.0p Weighted average shares -3.0p -1.5p 30.3p ▪ Increased share count following the equity raise in June -4.5p Non-controlling interests (NCI) Un
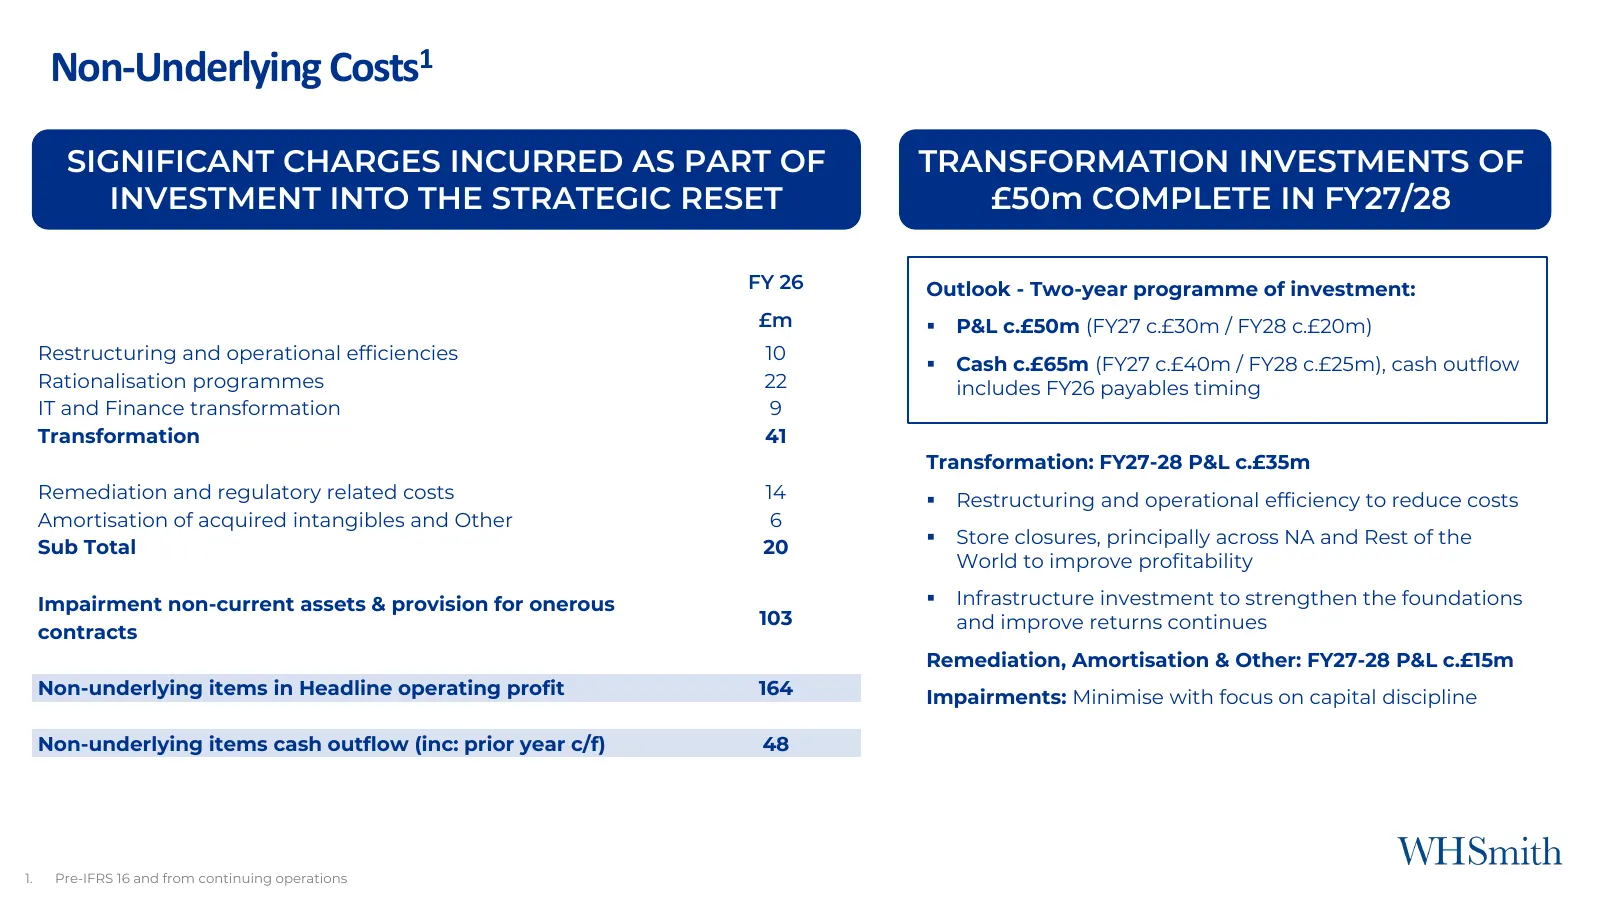
Slide 11: Non-Underlying Costs
Non-Underlying Costs1 SIGNIFICANT CHARGES INCURRED AS PART OF TRANSFORMATION INVESTMENTS OF INVESTMENT INTO THE STRATEGIC RESET £50m COMPLETE IN FY27/28 FY 26 Outlook - Two-year programme of investment: £m ▪ P&L c.£50m (FY27 c.£30m / FY28 c.£20m) Restructuring and operational efficiencies 10 ▪ Cash
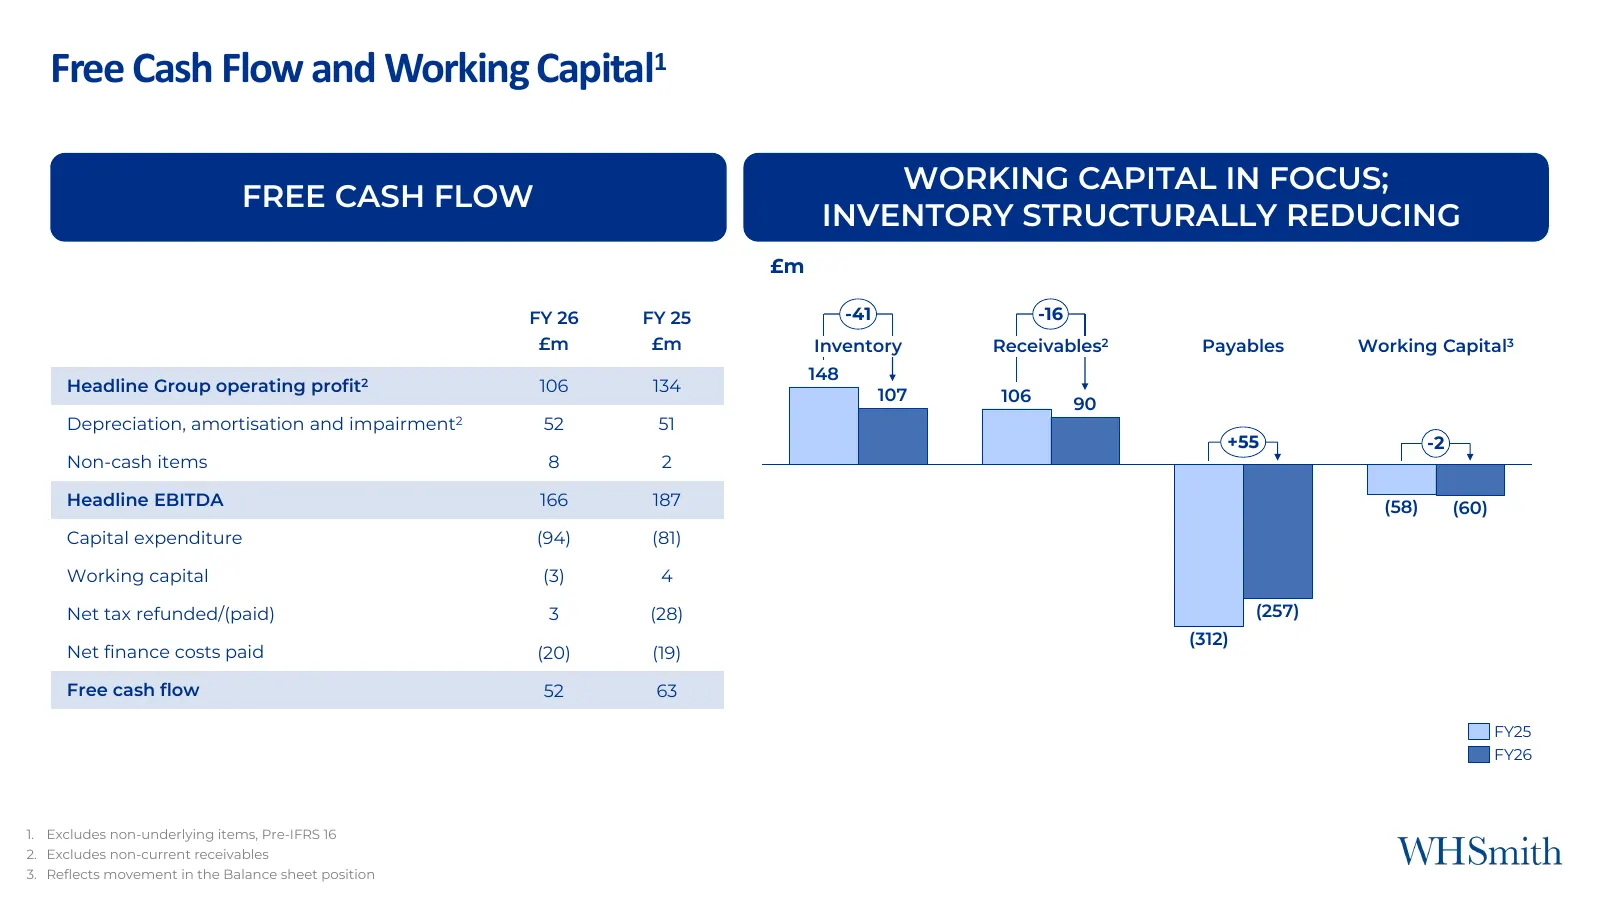
Slide 12: Free Cash Flow and Working Capital
Free Cash Flow and Working Capital1 WORKING CAPITAL IN FOCUS; FREE CASH FLOW INVENTORY STRUCTURALLY REDUCING £m FY 26 FY 25 -41 -16 £m £m Inventory Receivables2 Payables Working Capital3 148 Headline Group operating profit2 106 134 107 106 90 Depreciation, amortisation and impairment2 52 51 +55 -2 N
Slide 13: Balance Sheet
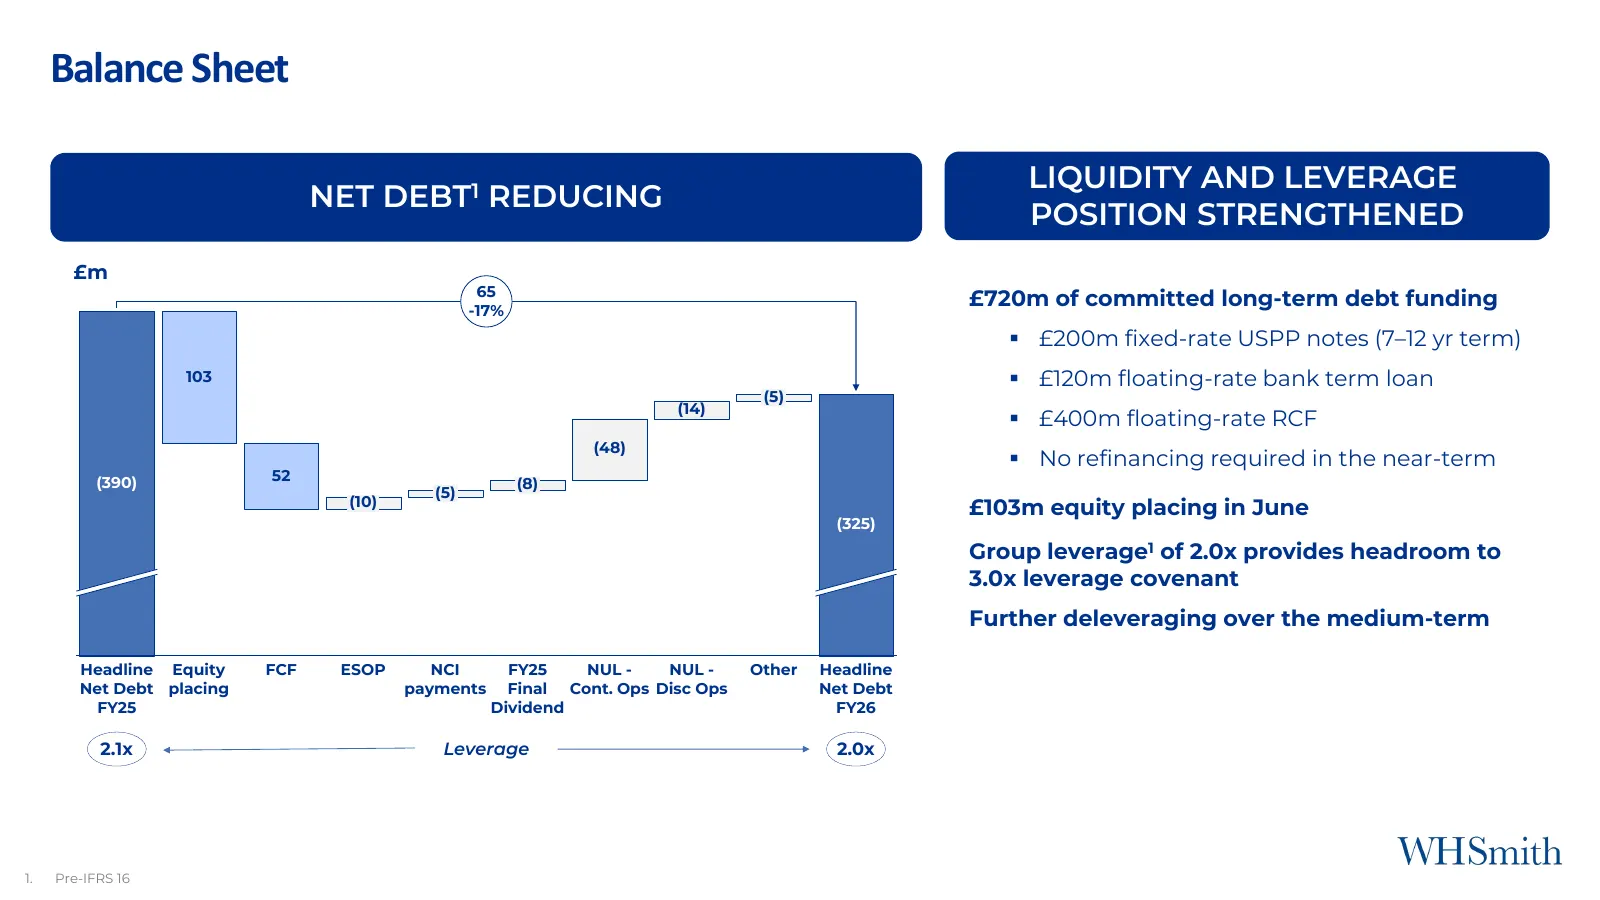
Balance Sheet LIQUIDITY AND LEVERAGE NET DEBT1 REDUCING POSITION STRENGTHENED £m 65 -17% £720m of committed long-term debt funding ▪ £200m fixed-rate USPP notes (7–12 yr term) 103 ▪ £120m floating-rate bank term loan (5) (14) ▪ £400m floating-rate RCF (48) ▪ No refinancing required in the near-term
Slide 14: Capital Investment and ROCE
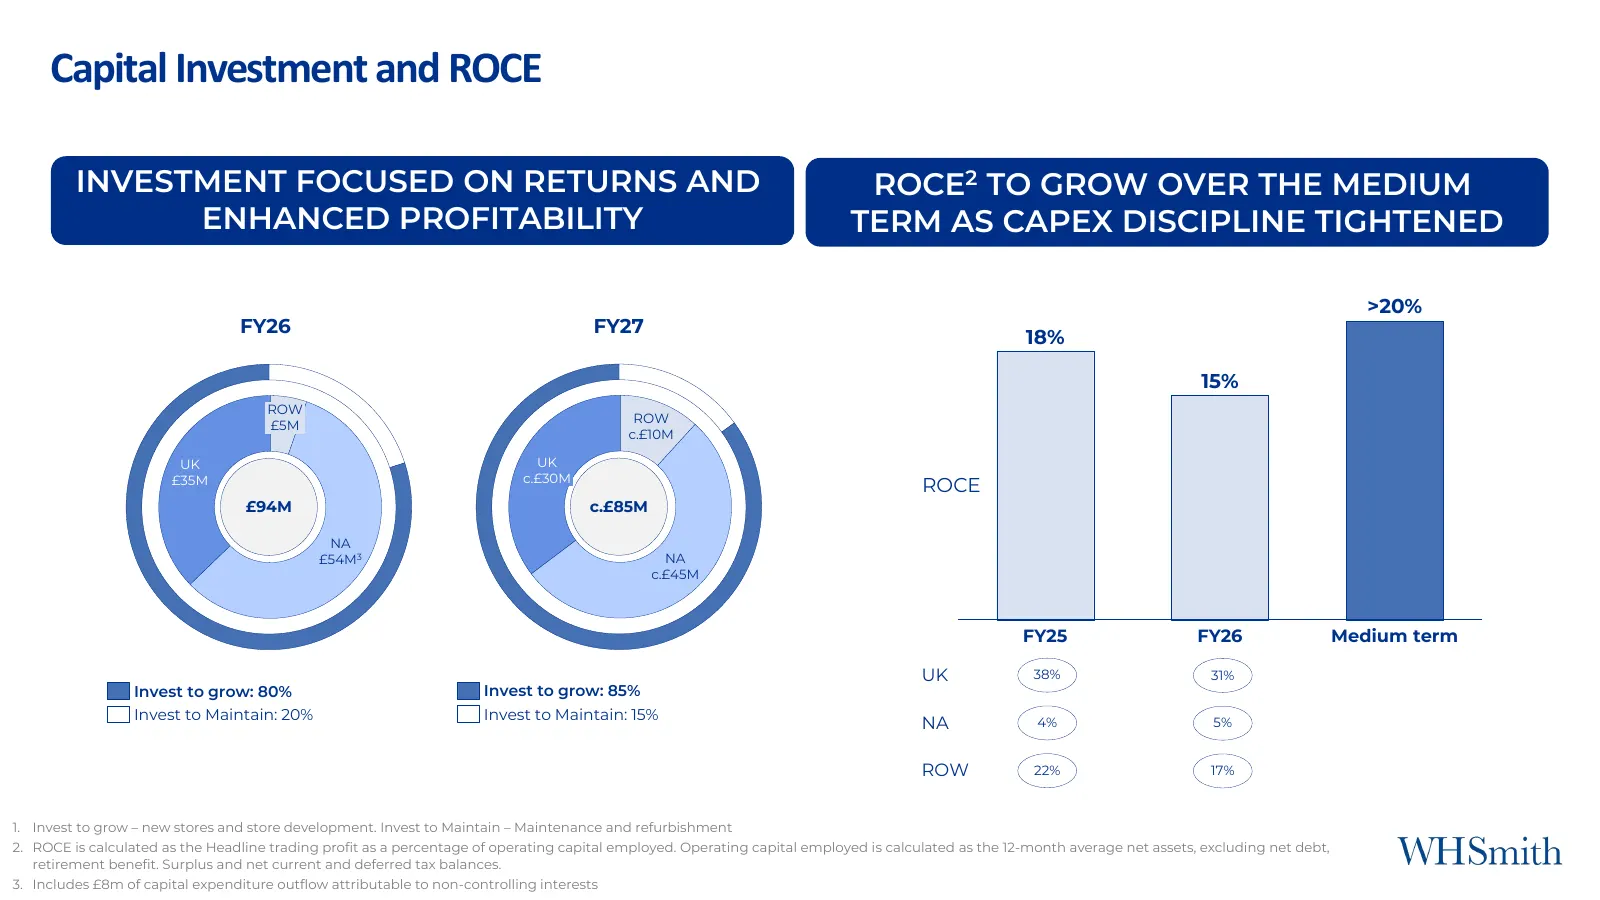
Capital Investment and ROCE INVESTMENT FOCUSED ON RETURNS AND ROCE2 TO GROW OVER THE MEDIUM ENHANCED PROFITABILITY TERM AS CAPEX DISCIPLINE TIGHTENED >20% FY26 FY27 18% 15% ROW ROW £5M c.£10M UK UK £35M c.£30M ROCE £94M c.£85M NA £54M3 NA c.£45M FY25 FY26 Medium term UK 38% 31% Invest to grow: 80% I
Slide 15: Capital Allocation
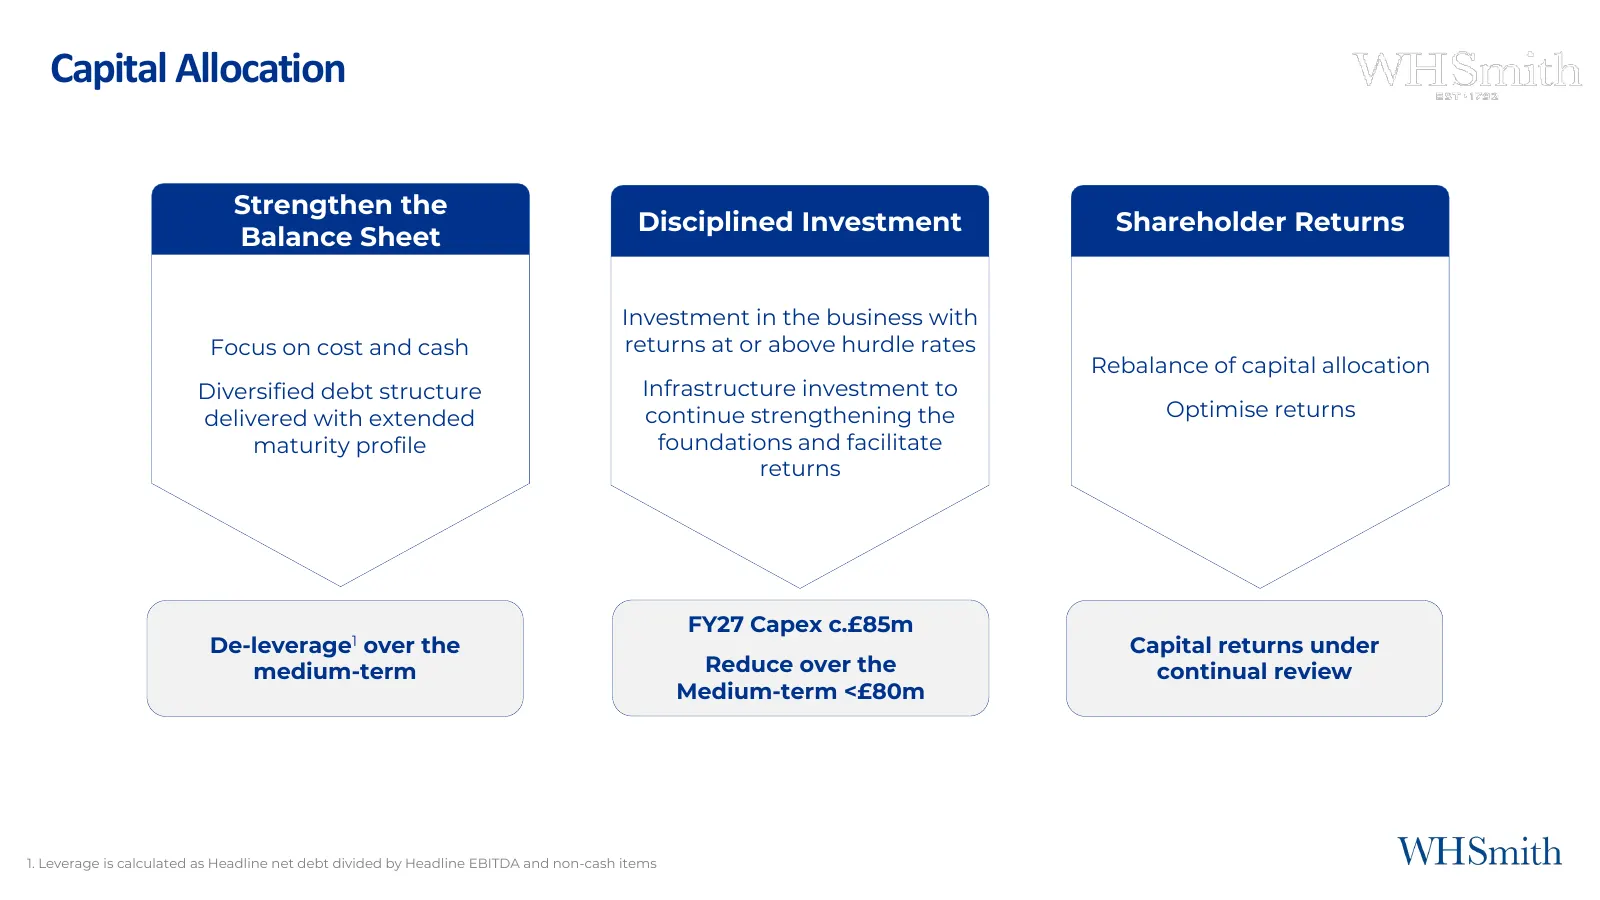
Capital Allocation Strengthen the Disciplined Investment Shareholder Returns Balance Sheet Investment in the business with Focus on cost and cash returns at or above hurdle rates Rebalance of capital allocation Diversified debt structure Infrastructure investment to delivered with extended continue
Slide 16: Summary and FY27 Outlook
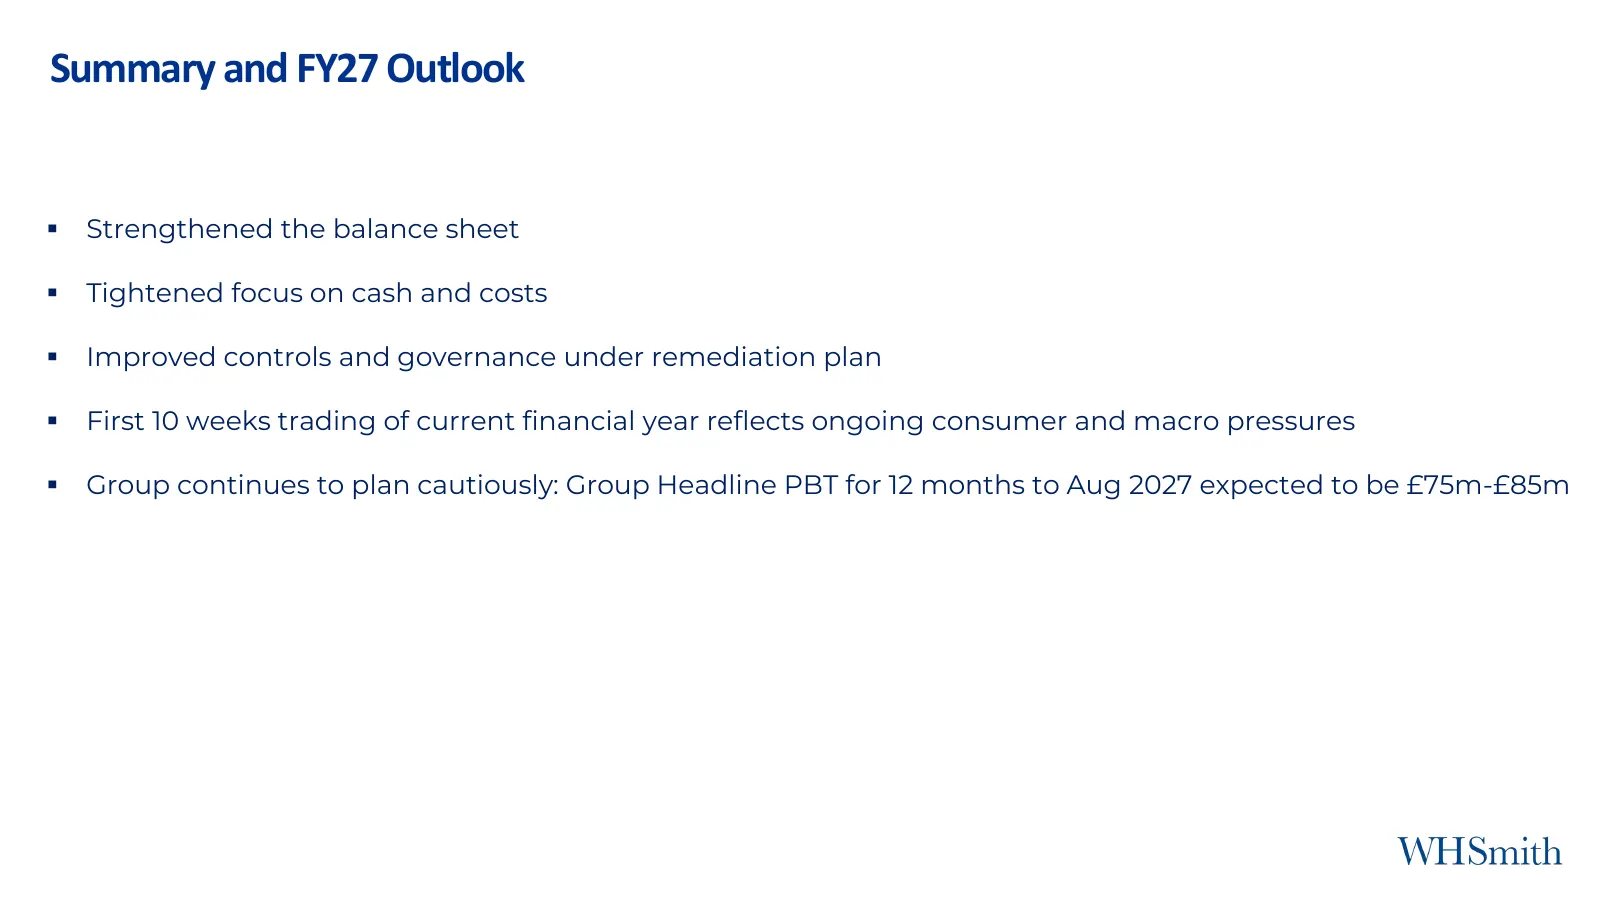
Summary and FY27 Outlook ▪ Strengthened the balance sheet ▪ Tightened focus on cash and costs ▪ Improved controls and governance under remediation plan ▪ First 10 weeks trading of current financial year reflects ongoing consumer and macro pressures ▪ Group continues to plan cautiously: Group Headlin
Slide 17: Business Review
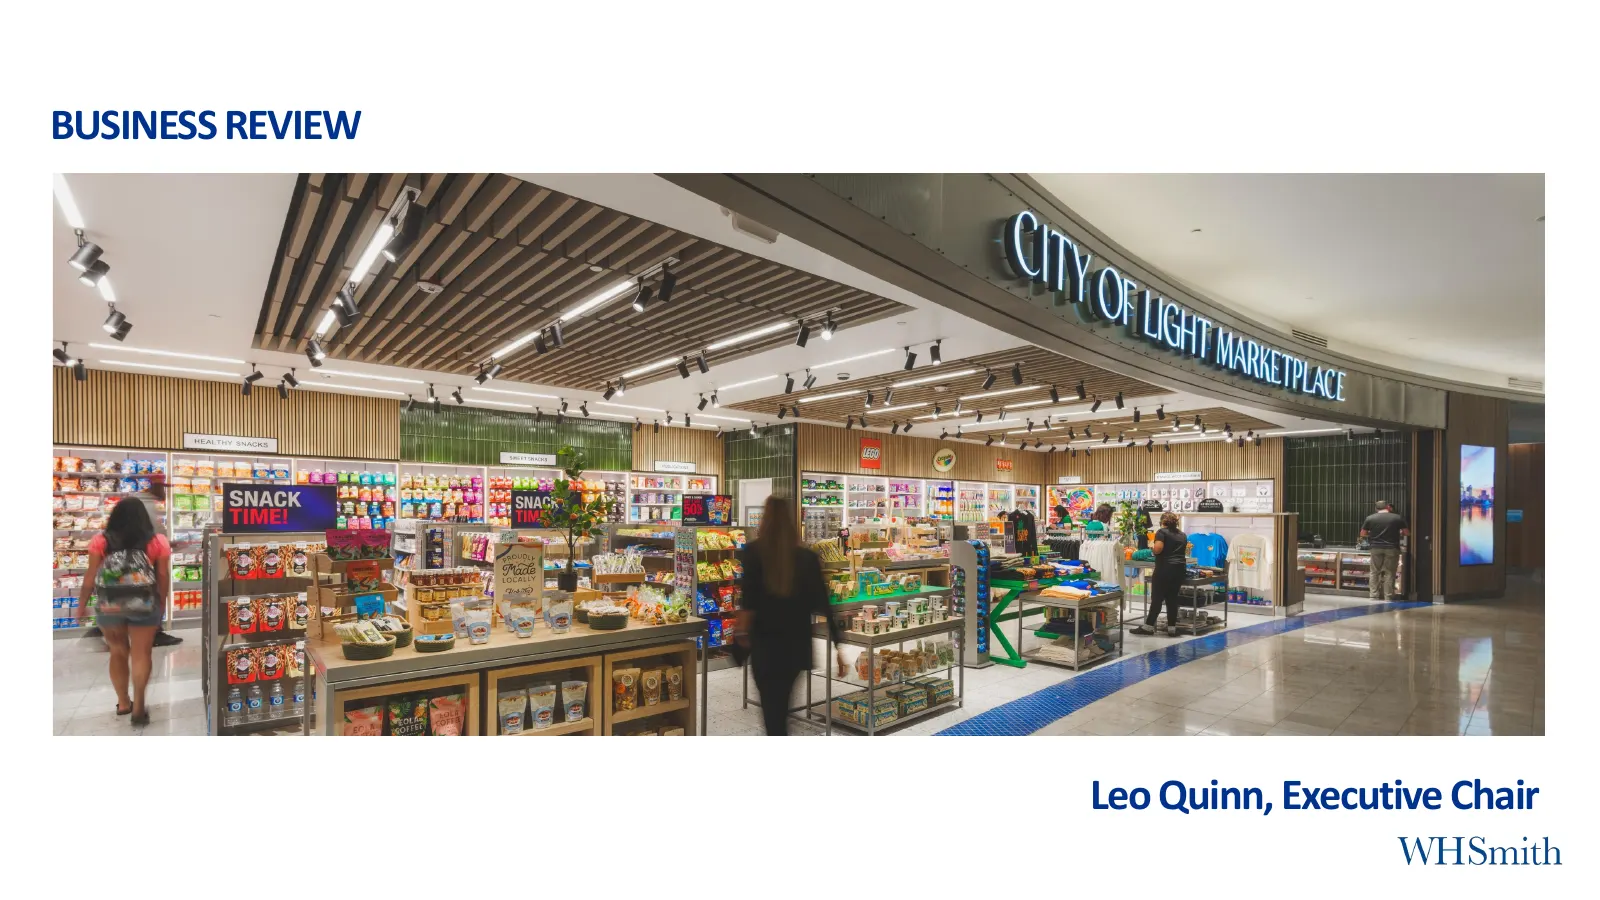
BUSINESS REVIEW Leo Quinn, Executive Chair
Slide 18: Attractive market
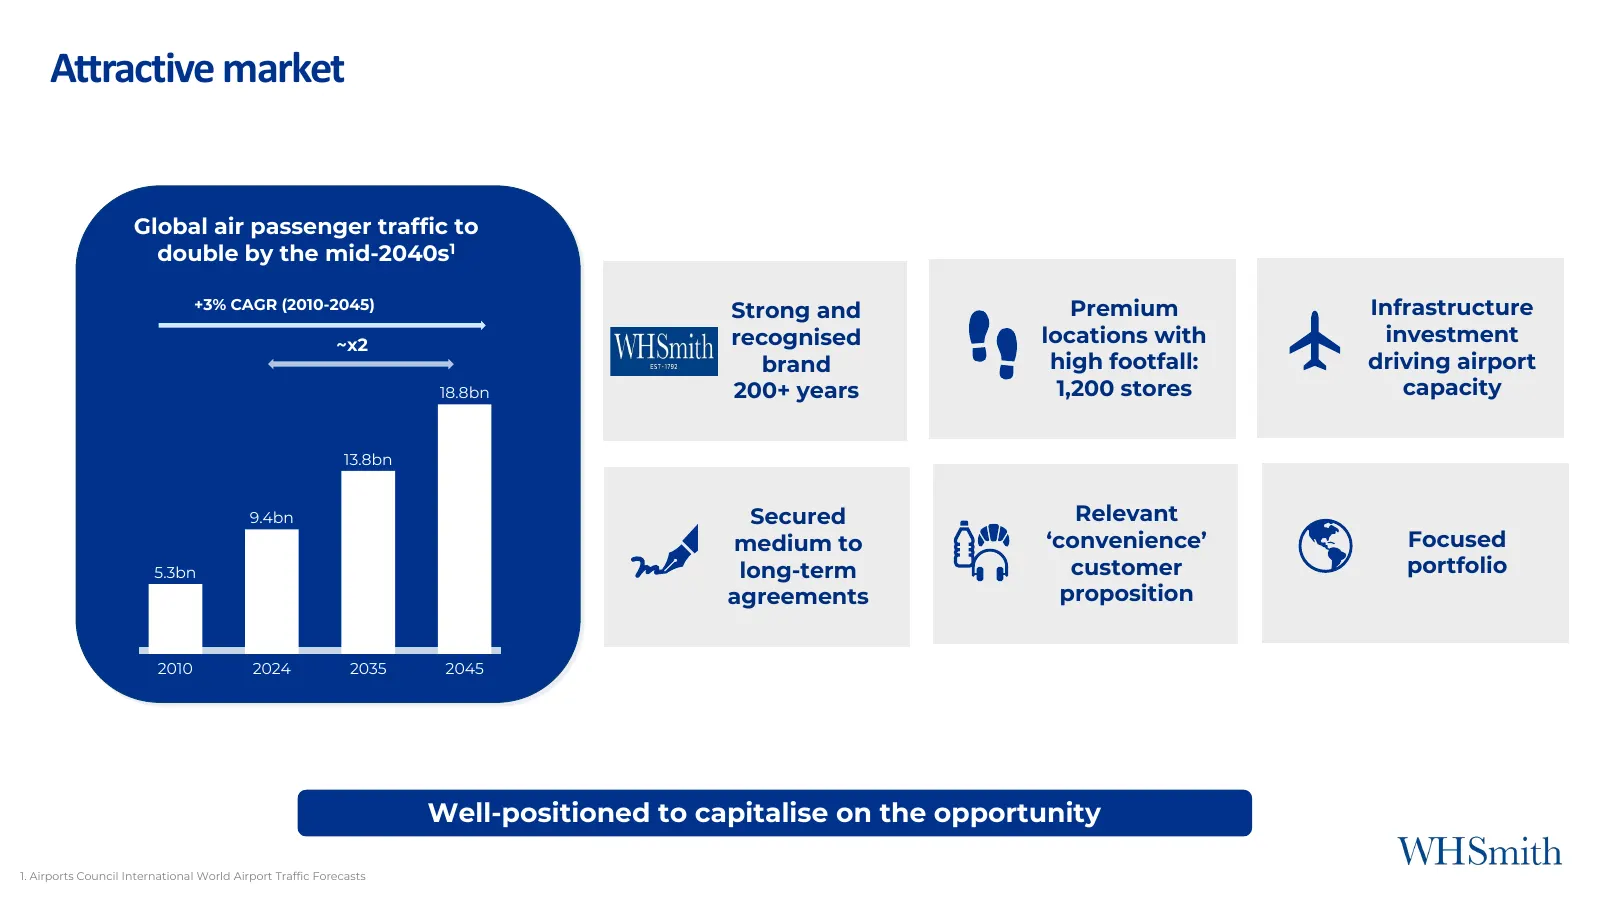
Attractive market Global air passenger traffic to double by the mid-2040s1 +3% CAGR (2010-2045) Strong and Premium Infrastructure ~x2 recognised locations with investment brand high footfall: driving airport 18.8bn 200+ years 1,200 stores capacity 13.8bn 9.4bn Secured Relevant medium to ‘convenience
Slide 19: Forced growth
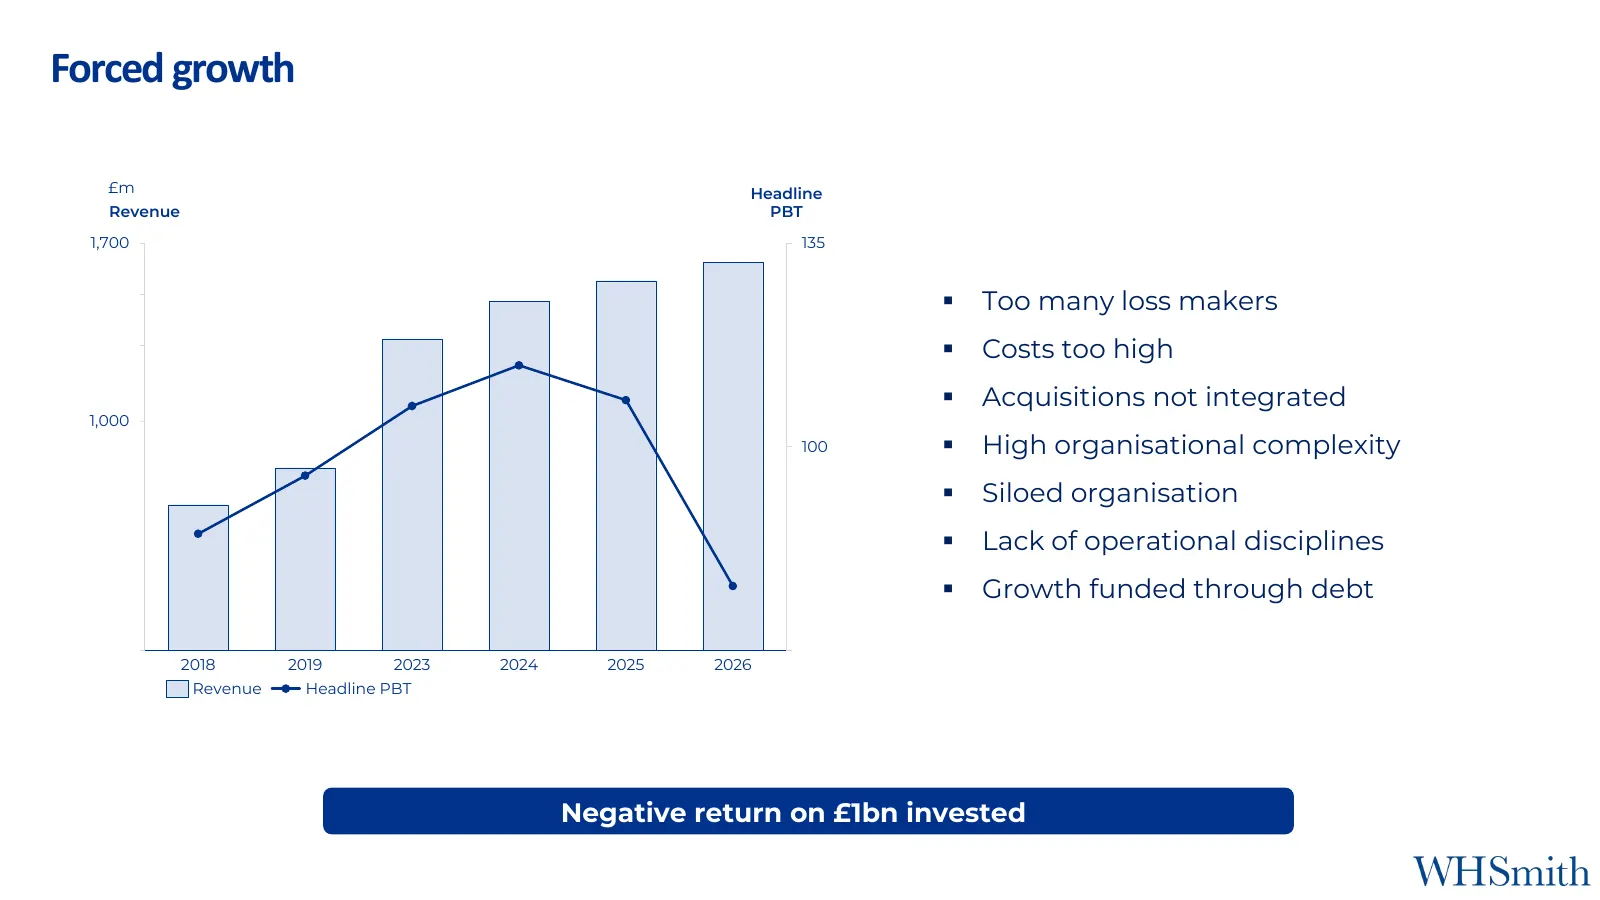
Forced growth £m Headline Revenue PBT 1,700 135 ▪ Too many loss makers ▪ Costs too high ▪ Acquisitions not integrated 1,000 100 ▪ High organisational complexity ▪ Siloed organisation ▪ Lack of operational disciplines ▪ Growth funded through debt 2018 2019 2023 2024 2025 2026 Revenue Headline PBT Neg
Slide 20: Selective growth
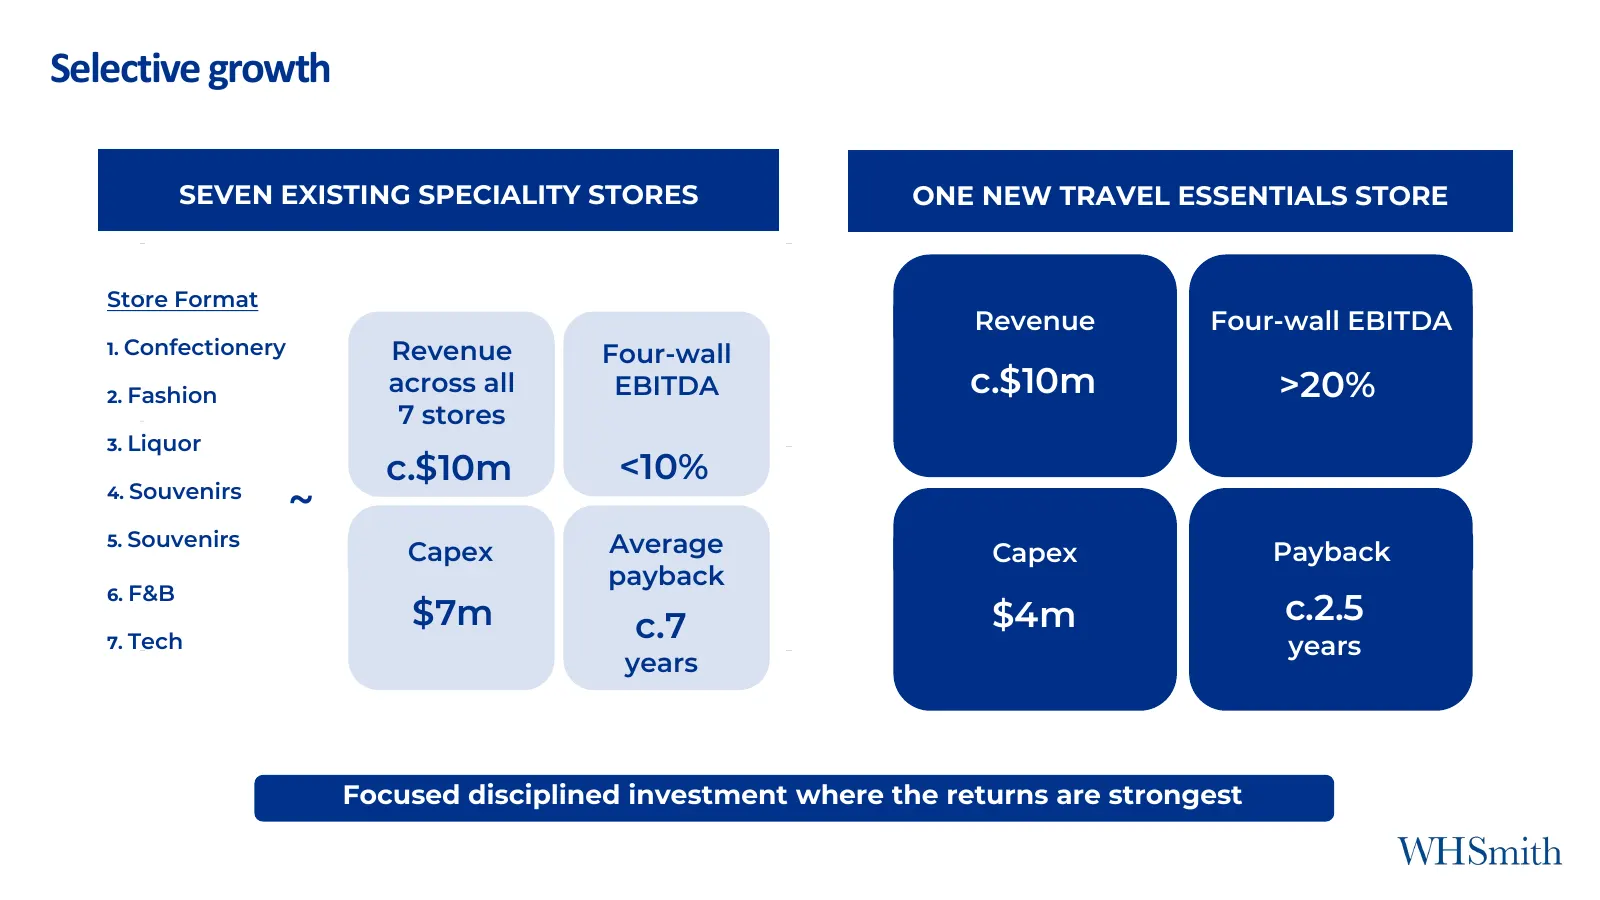
Selective growth SEVEN EXISTING SPECIALITY STORES ONE NEW TRAVEL ESSENTIALS STORE Store Format Revenue Four-wall EBITDA 1. Confectionery Revenue Four-wall 2. Fashion across all EBITDA c.$10m >20% 7 stores 3. Liquor c.$10m <10% 4. Souvenirs ~ 5. Souvenirs Average Capex Capex Payback payback 6. F&B $7
Slide 21: Group transformation
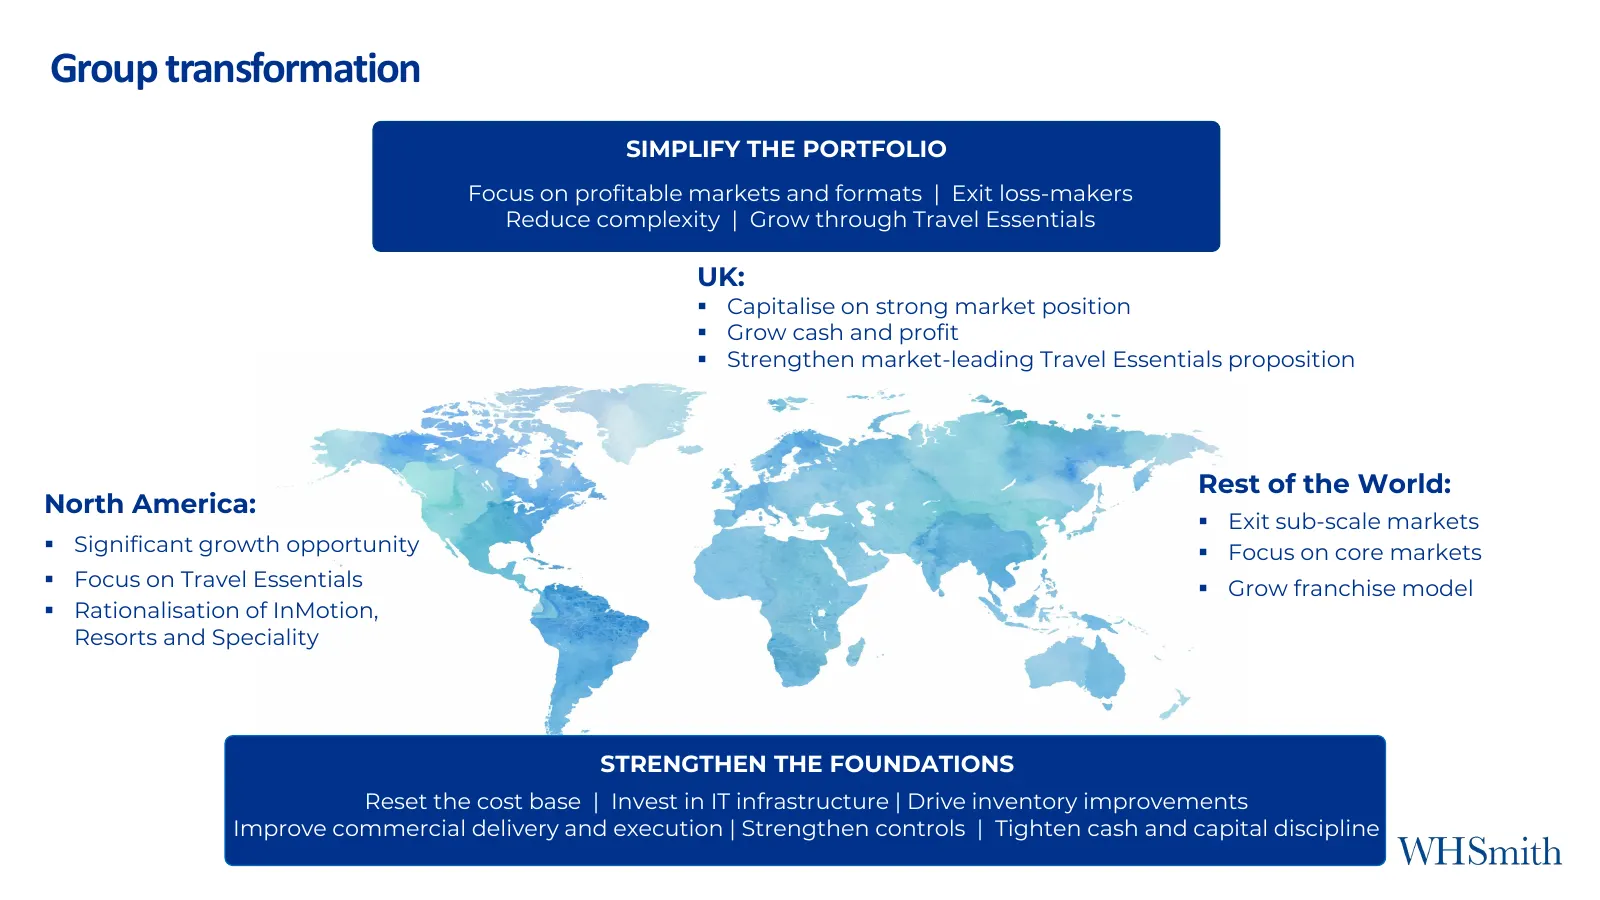
Group transformation SIMPLIFY THE PORTFOLIO Focus on profitable markets and formats | Exit loss-makers Reduce complexity | Grow through Travel Essentials UK: ▪ Capitalise on strong market position ▪ Grow cash and profit ▪ Strengthen market-leading Travel Essentials proposition Rest of the World: Nor
Slide 22: UK: Better quality store estate
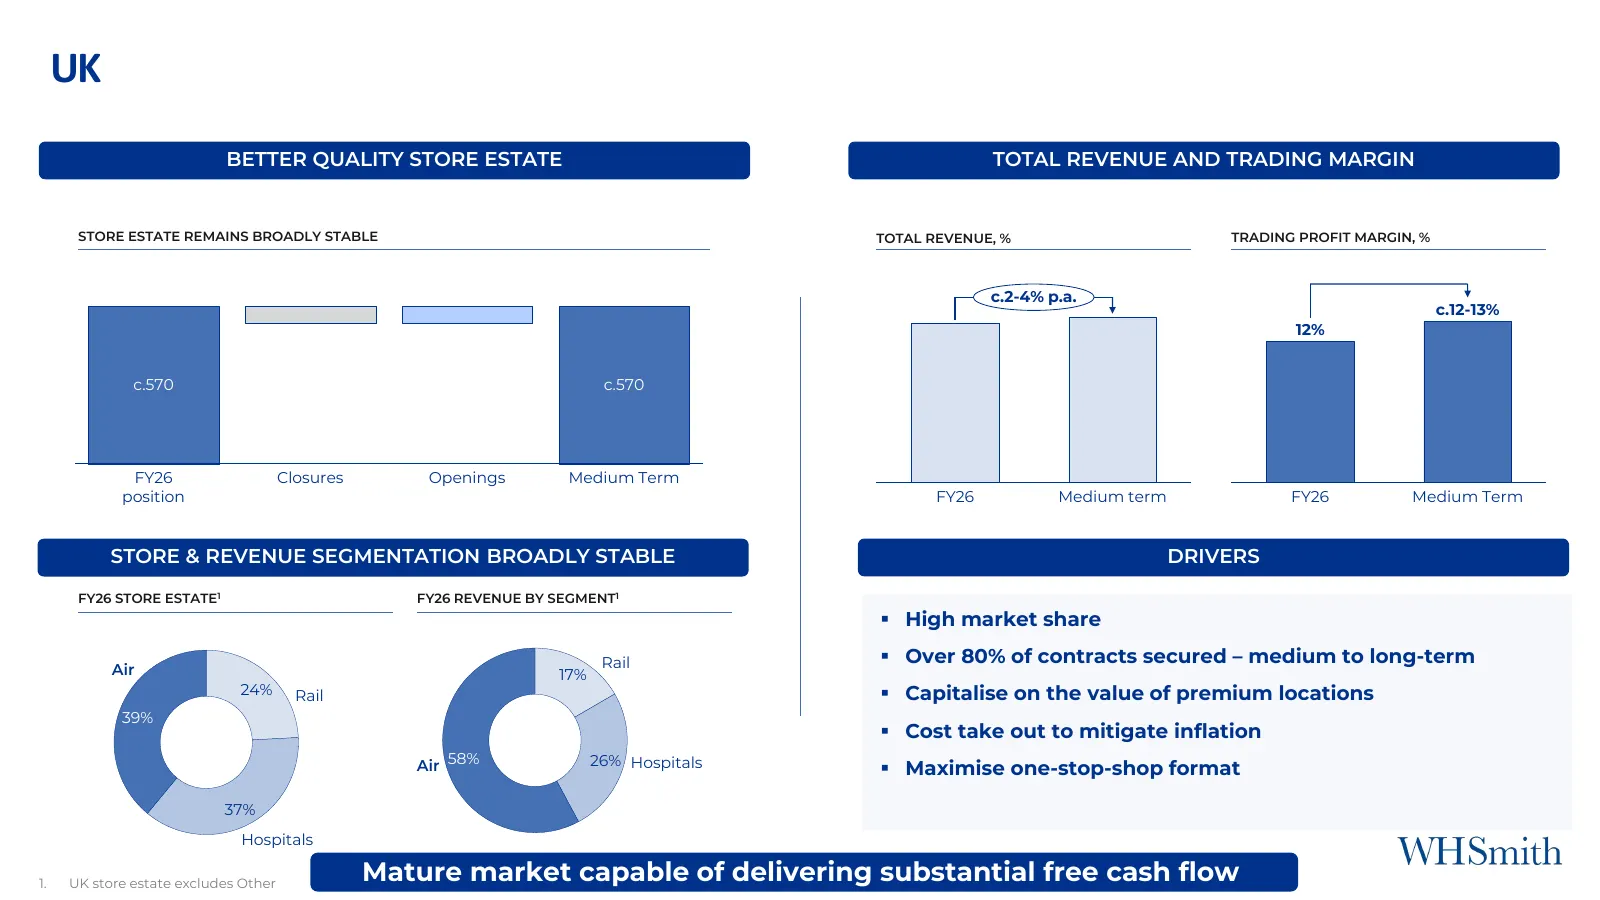
UK BETTER QUALITY STORE ESTATE TOTAL REVENUE AND TRADING MARGIN STORE ESTATE REMAINS BROADLY STABLE TOTAL REVENUE, % TRADING PROFIT MARGIN, % c.2-4% p.a. c.12-13% 12% c.570 c.570 FY26 Closures Openings Medium Term position FY26 Medium term FY26 Medium Term STORE & REVENUE SEGMENTATION BROADLY STABLE
Slide 23: North America
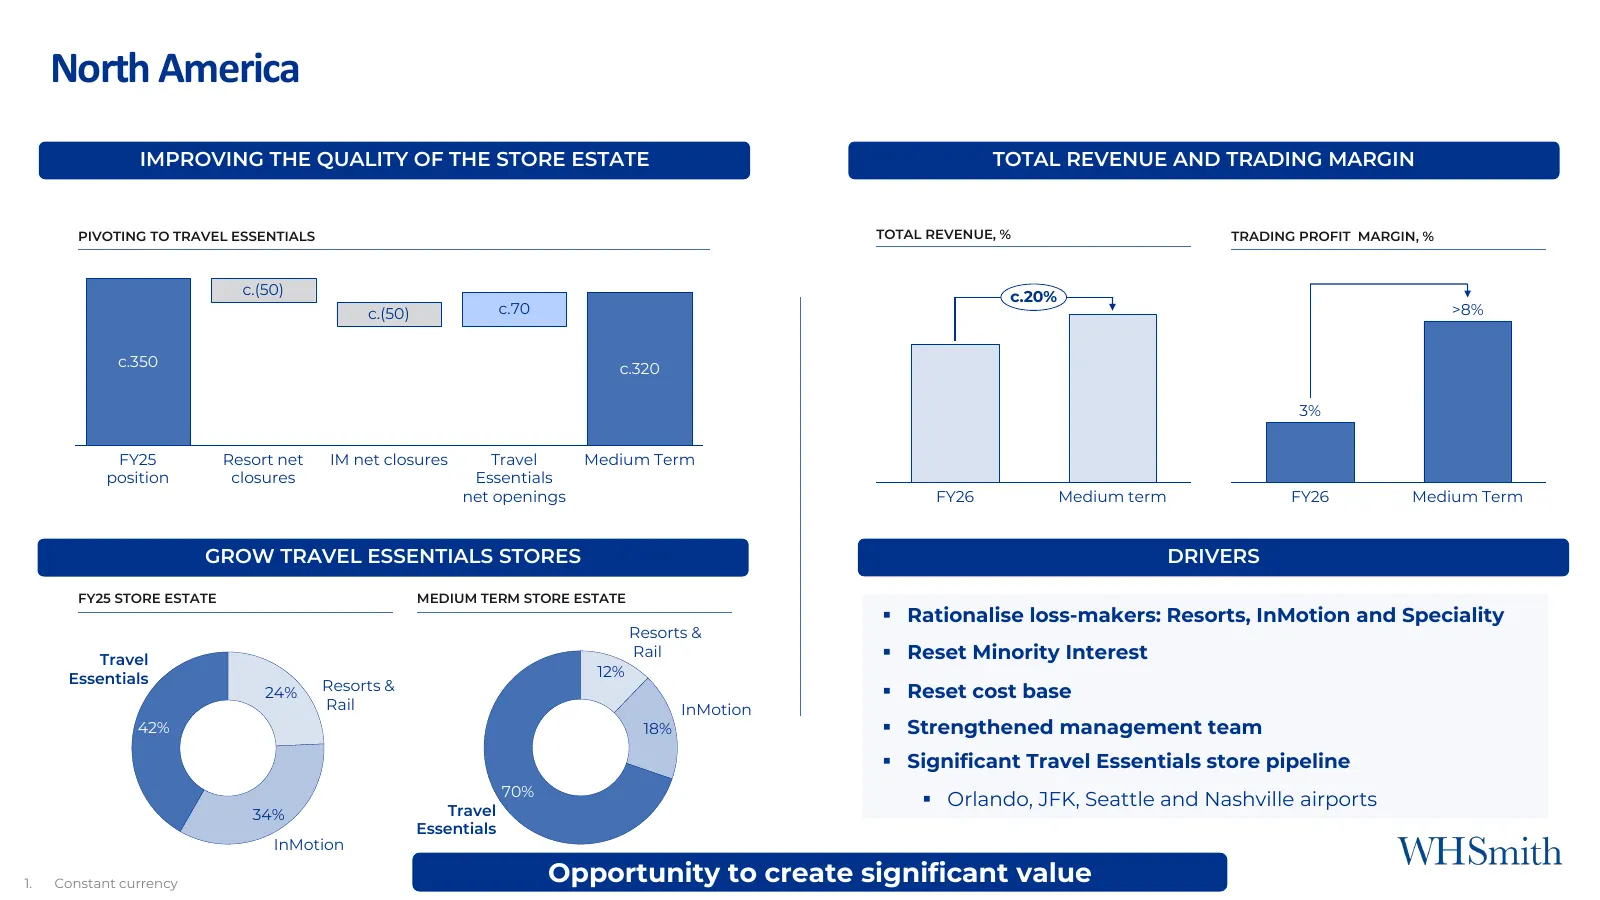
North America IMPROVING THE QUALITY OF THE STORE ESTATE TOTAL REVENUE AND TRADING MARGIN PIVOTING TO TRAVEL ESSENTIALS TOTAL REVENUE, % TRADING PROFIT MARGIN, % c.(50) c.20% c.(50) c.70 >8% c.350 c.320 3% FY25 Resort net IM net closures Travel Medium Term position closures Essentials net openings FY
Slide 24: Rest of the World
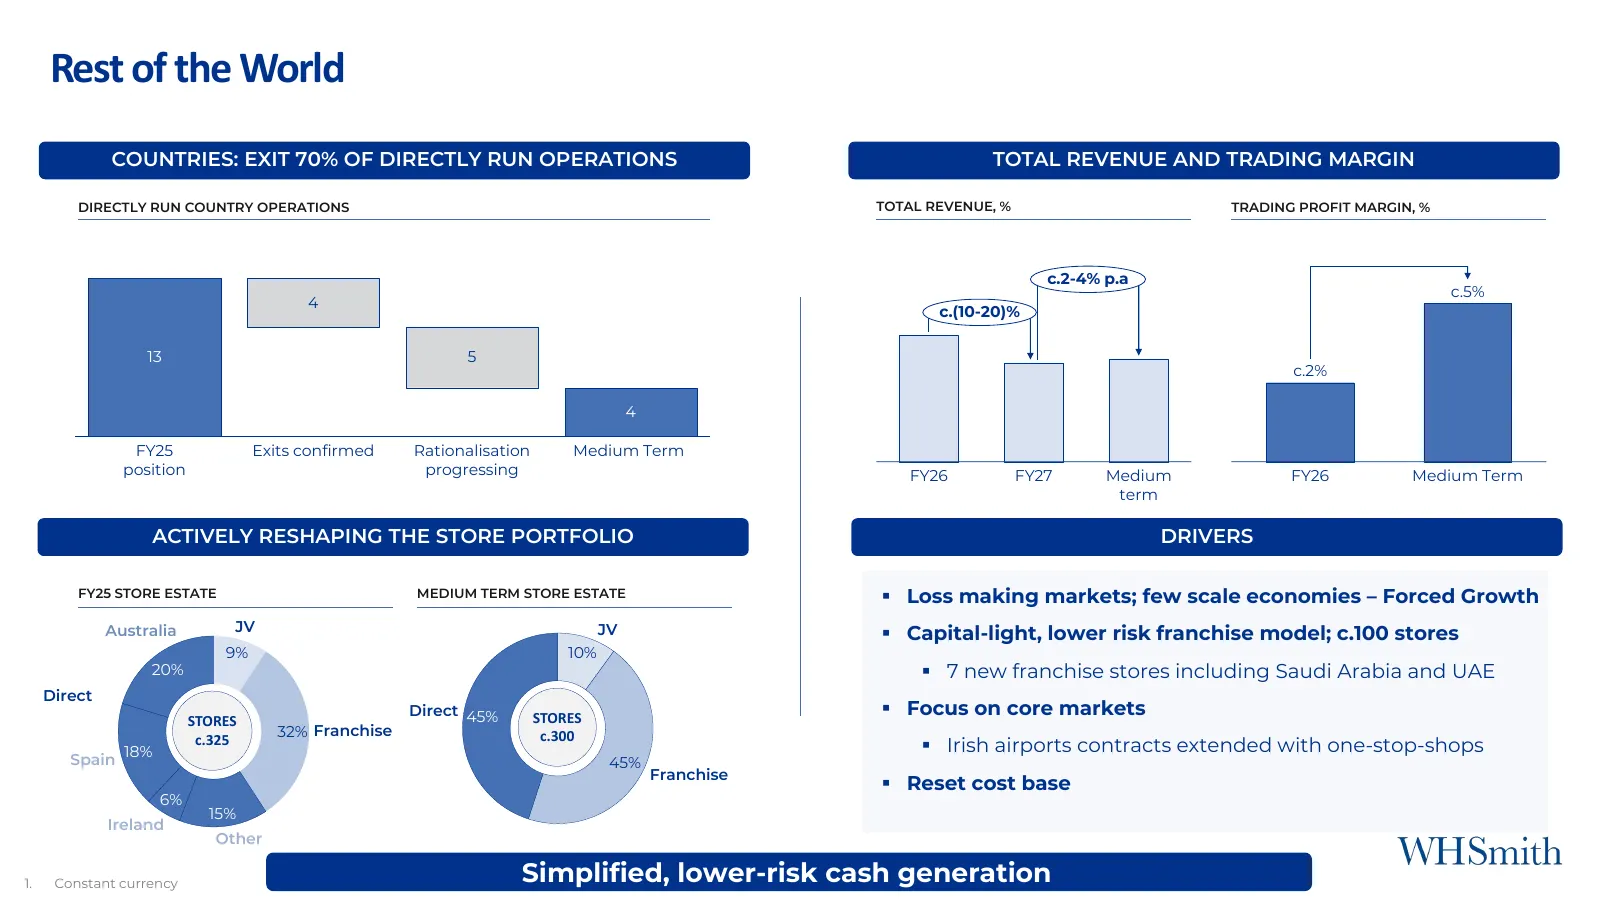
Rest of the World COUNTRIES: EXIT 70% OF DIRECTLY RUN OPERATIONS TOTAL REVENUE AND TRADING MARGIN DIRECTLY RUN COUNTRY OPERATIONS TOTAL REVENUE, % TRADING PROFIT MARGIN, % c.2-4% p.a c.5% 4 c.(10-20)% 13 5 c.2% 4 FY25 Exits confirmed Rationalisation Medium Term position progressing FY26 FY27 Medium
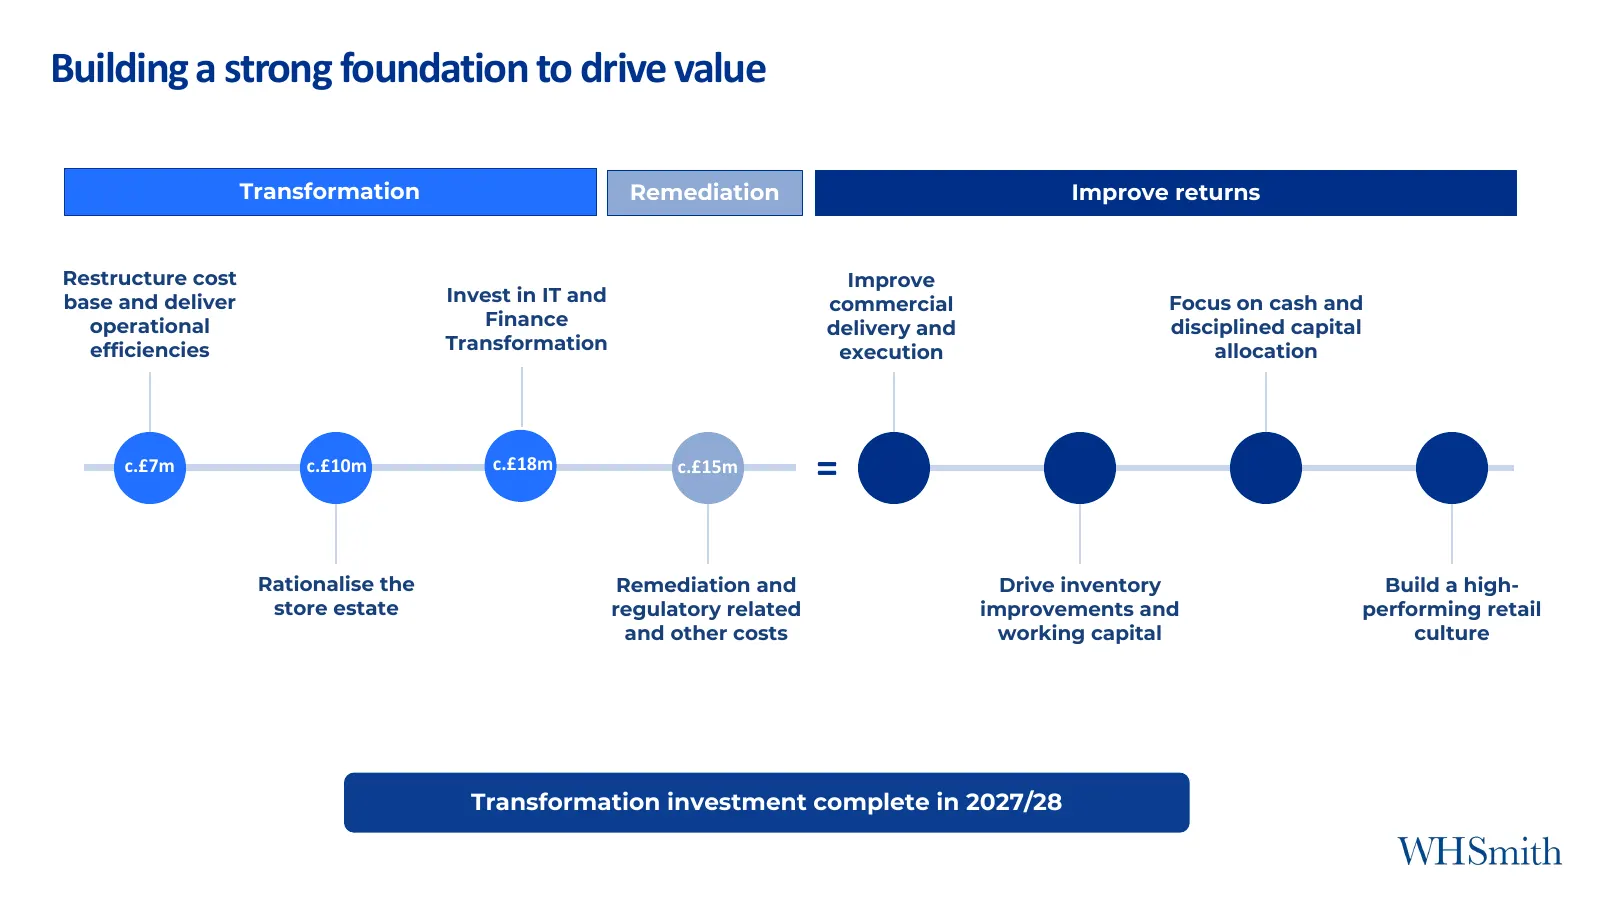
Slide 25: Building a strong foundation to drive value
Building a strong foundation to drive value Transformation Remediation Improve returns Restructure cost Improve base and deliver Invest in IT and commercial Focus on cash and operational Finance delivery and disciplined capital efficiencies Transformation execution allocation c.£7m c.£10m c.£18m c.£
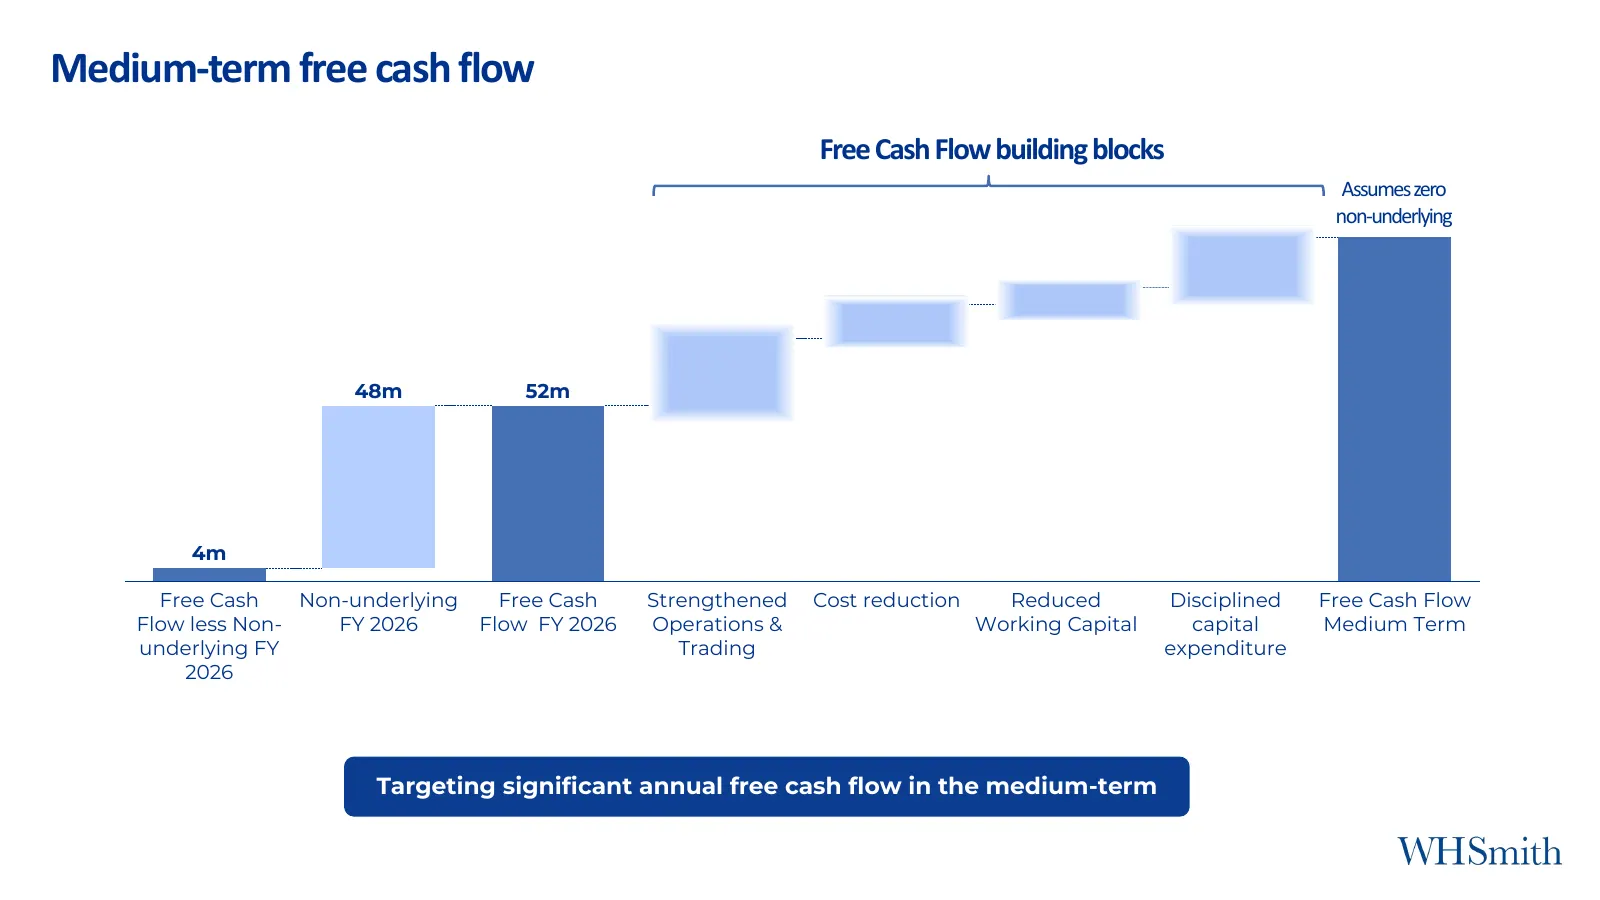
Slide 26: Medium-term free cash flow
Medium-term free cash flow Free Cash Flow building blocks Assumes zero non-underlying 48m 52m 4m Free Cash Non-underlying Free Cash Strengthened Cost reduction Reduced Disciplined Free Cash Flow Flow less Non- FY 2026 Flow FY 2026 Operations & Working Capital capital Medium Term underlying FY Tradin
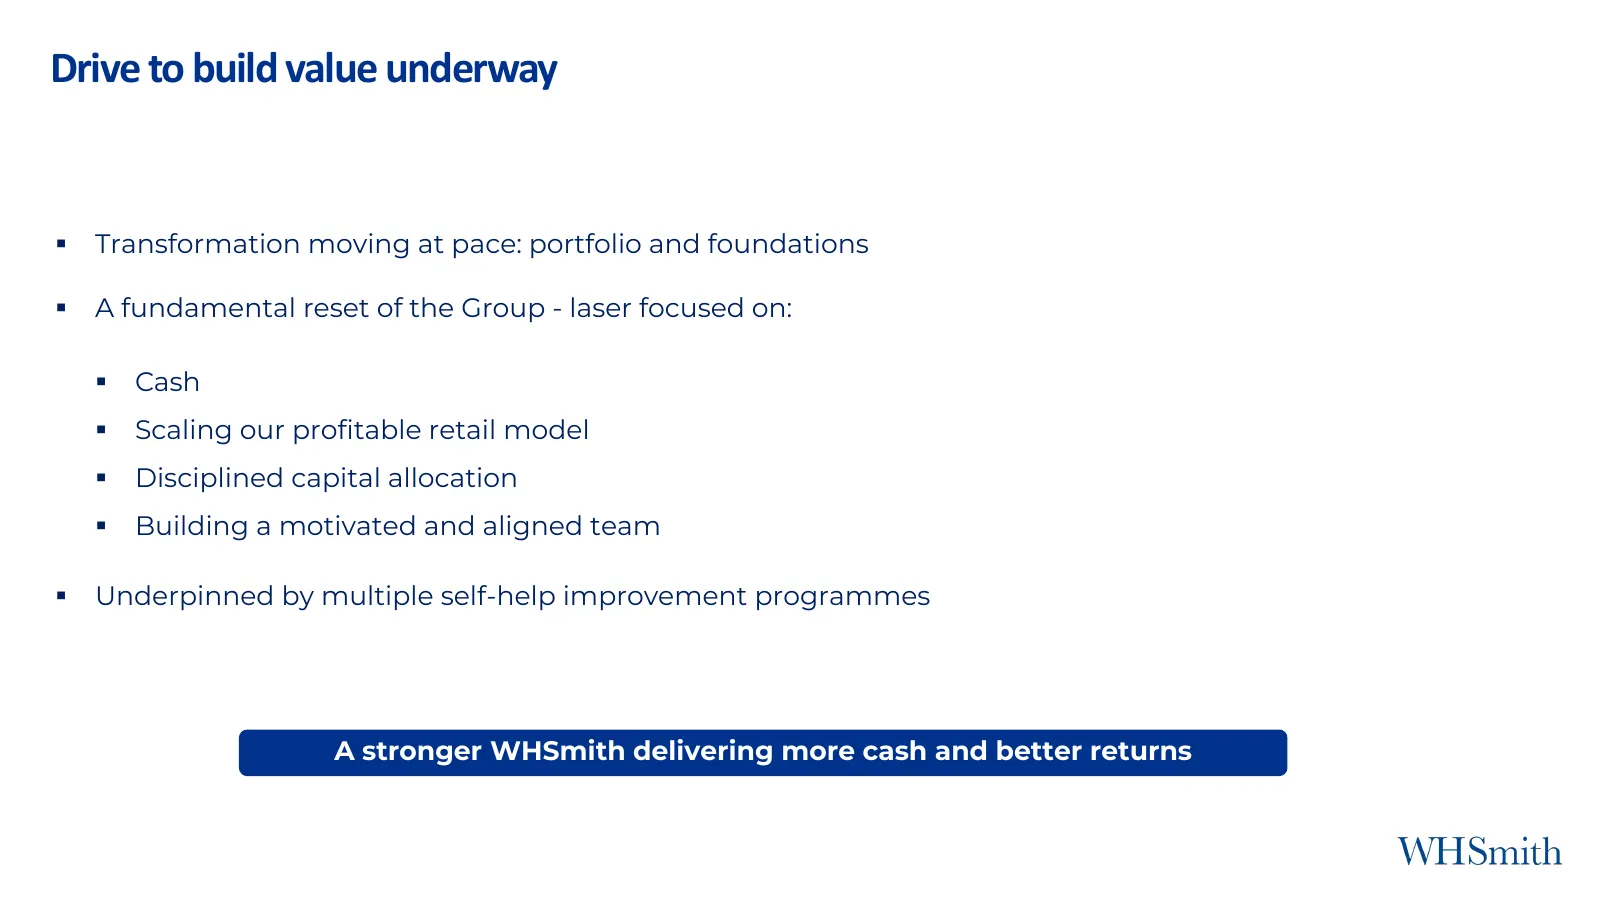
Slide 27: Drive to build value underway
Drive to build value underway ▪ Transformation moving at pace: portfolio and foundations ▪ A fundamental reset of the Group - laser focused on: ▪ Cash ▪ Scaling our profitable retail model ▪ Disciplined capital allocation ▪ Building a motivated and aligned team ▪ Underpinned by multiple self-help im
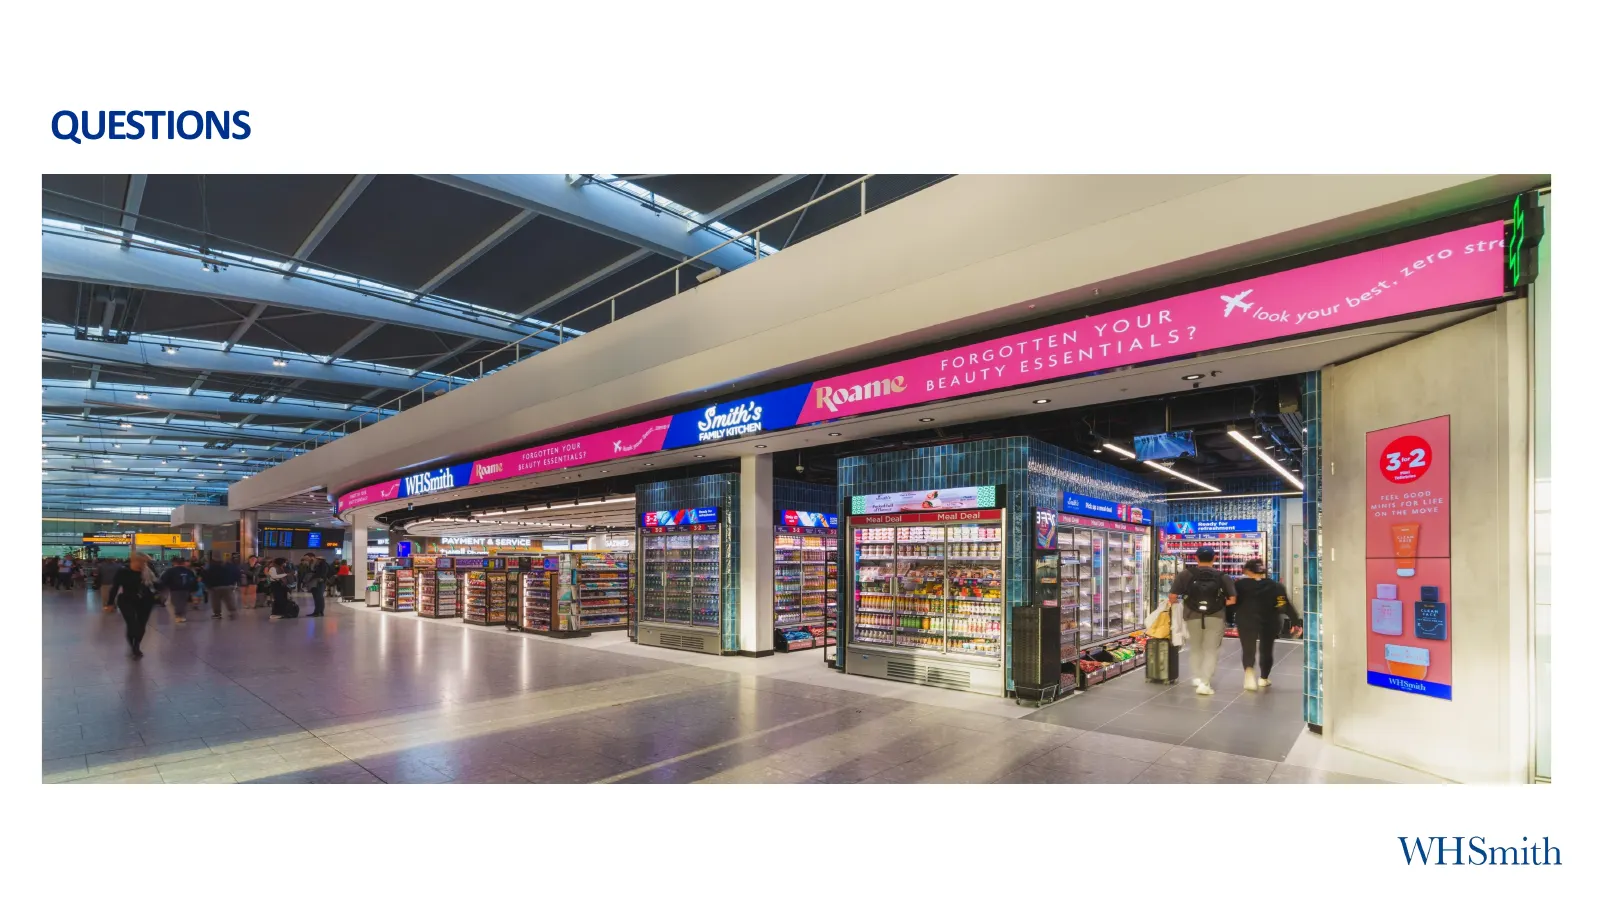
Slide 28: Questions
QUESTIONS
Slide 29: Appendix
APPENDIX WHSmith
Slide 30: Current Operational & Technical planning assumptions
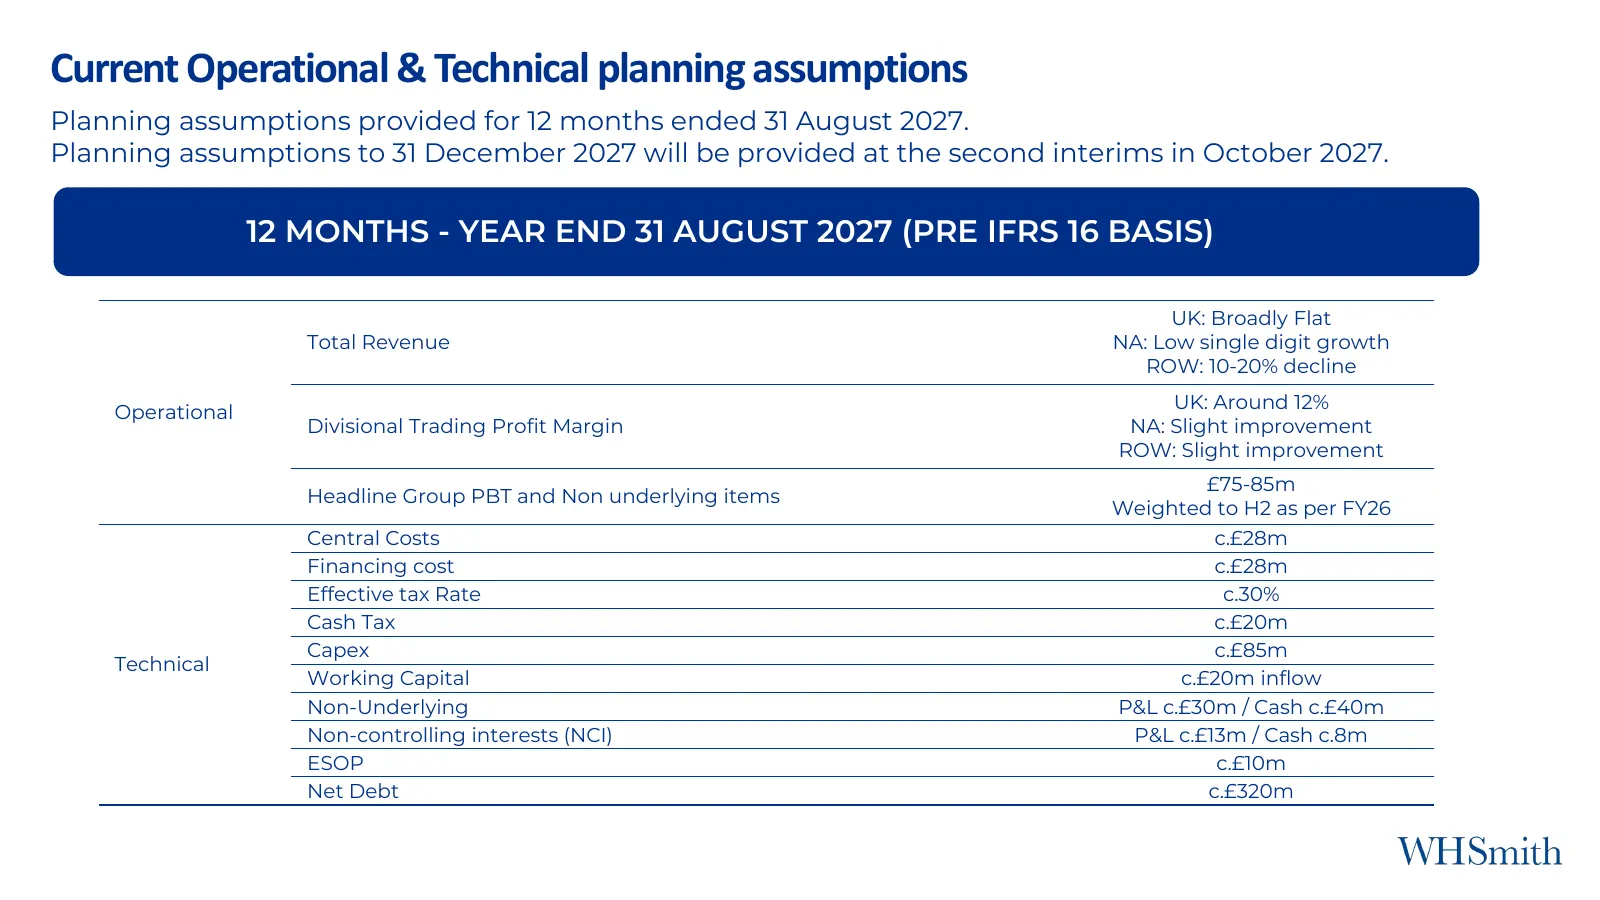
Current Operational & Technical planning assumptions Planning assumptions provided for 12 months ended 31 August 2027. Planning assumptions to 31 December 2027 will be provided at the second interims in October 2027. 12 MONTHS - YEAR END 31 AUGUST 2027 (PRE IFRS 16 BASIS) UK: Broadly Flat Total Reve
Slide 31: Change of financial year end
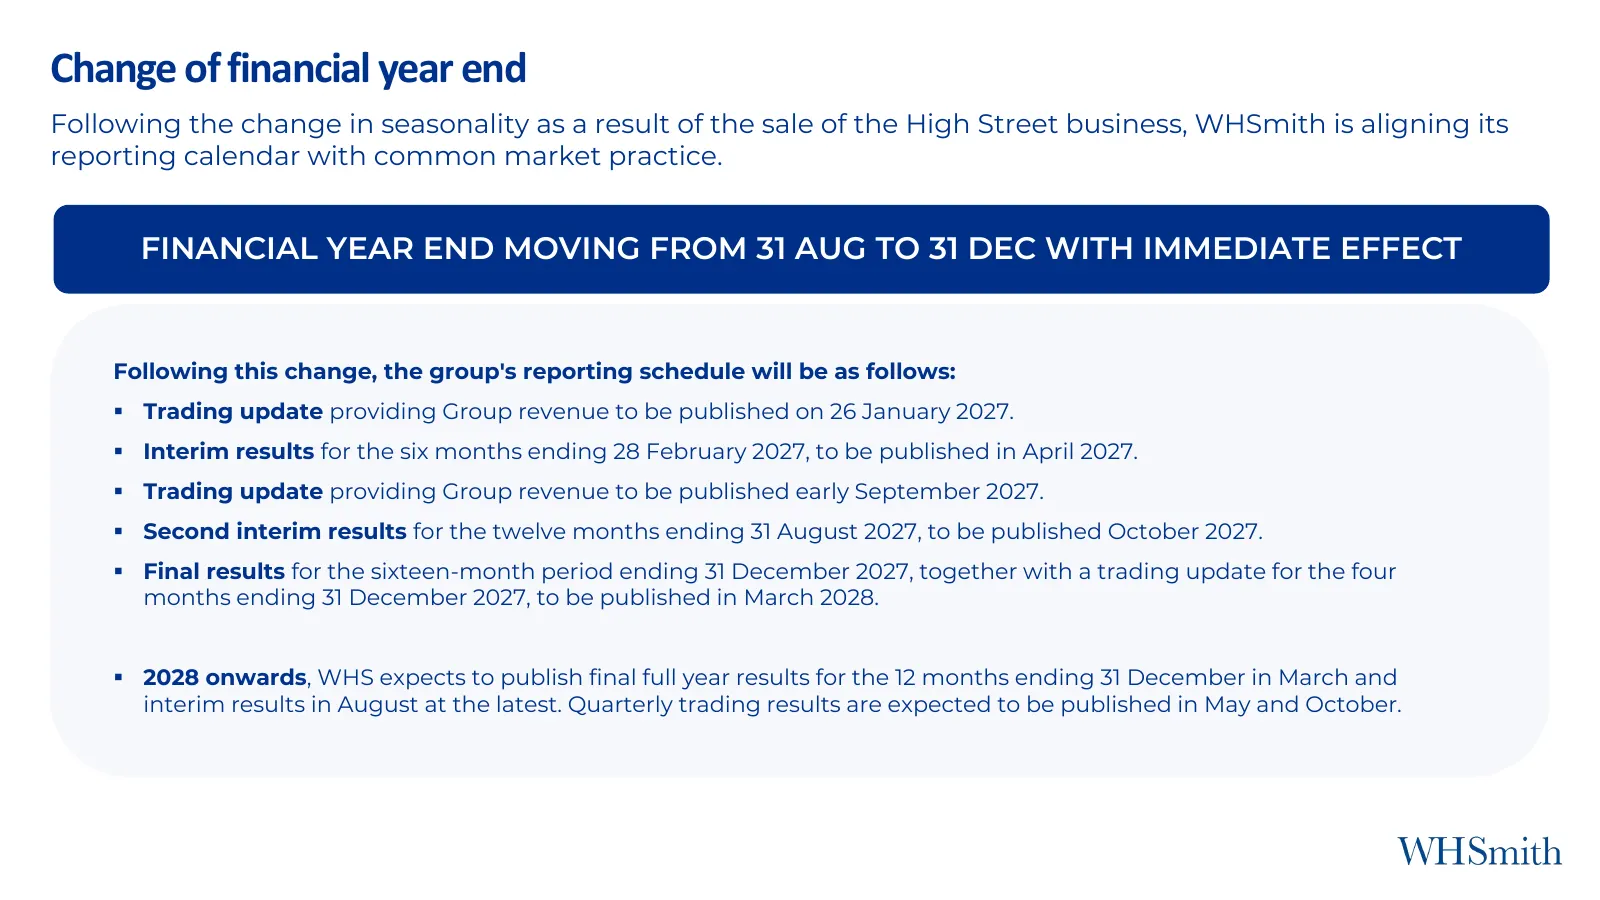
Change of financial year end Following the change in seasonality as a result of the sale of the High Street business, WHSmith is aligning its reporting calendar with common market practice. FINANCIAL YEAR END MOVING FROM 31 AUG TO 31 DEC WITH IMMEDIATE EFFECT Following this change, the group's repor
Slide 32: IFRS 16 Impact on Income Statement
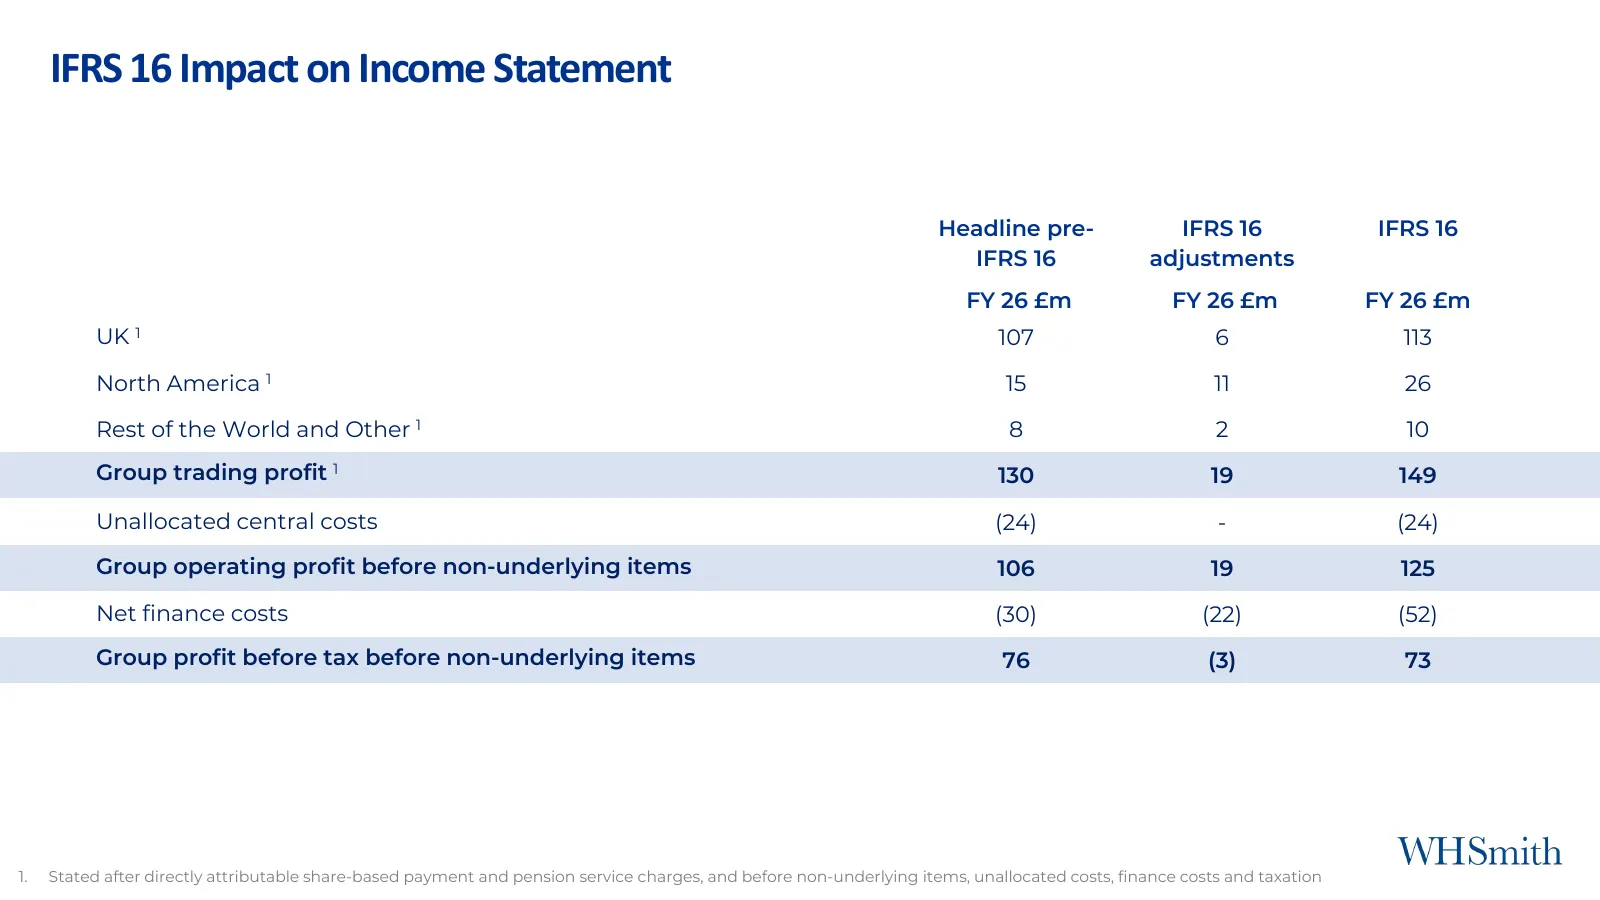
IFRS 16 Impact on Income Statement Headline pre- IFRS 16 IFRS 16 IFRS 16 adjustments FY 26 £m FY 26 £m FY 26 £m UK 1 107 6 113 North America 1 15 11 26 Rest of the World and Other 1 8 2 10 Group trading profit 1 130 19 149 Unallocated central costs (24) - (24) Group operating profit before non-under
Slide 33: IFRS 16 Impact on Cash flow Statement
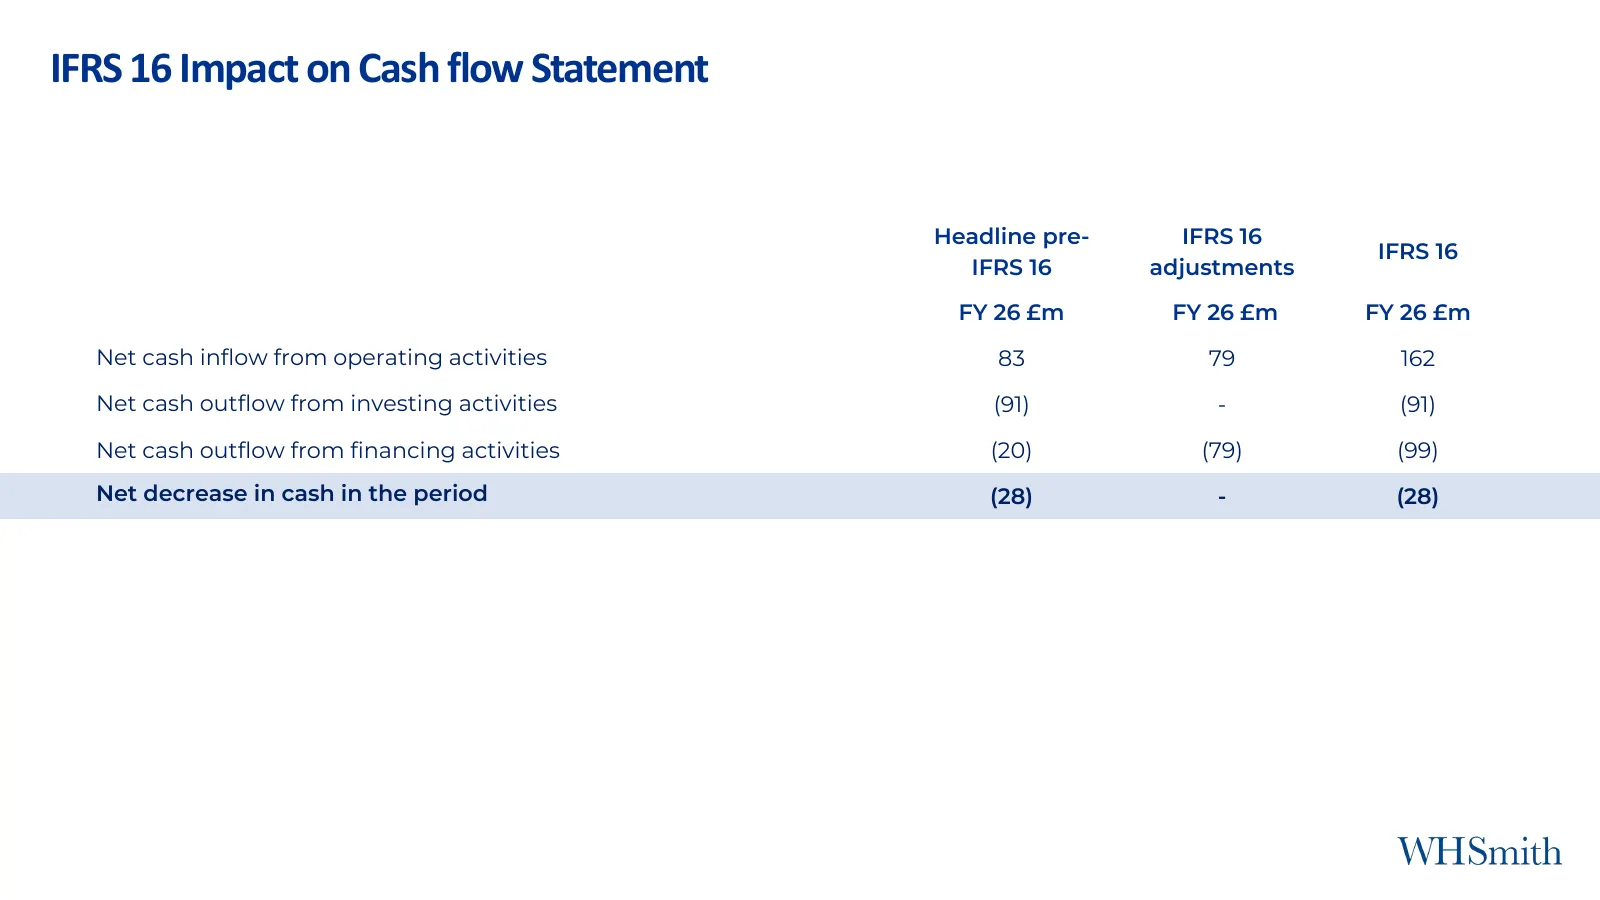
IFRS 16 Impact on Cash flow Statement Headline pre- IFRS 16 IFRS 16 IFRS 16 adjustments FY 26 £m FY 26 £m FY 26 £m Net cash inflow from operating activities 83 79 162 Net cash outflow from investing activities (91) - (91) Net cash outflow from financing activities (20) (79) (99) Net decrease in cash
Slide 34: IFRS 16 Impact on Balance sheet
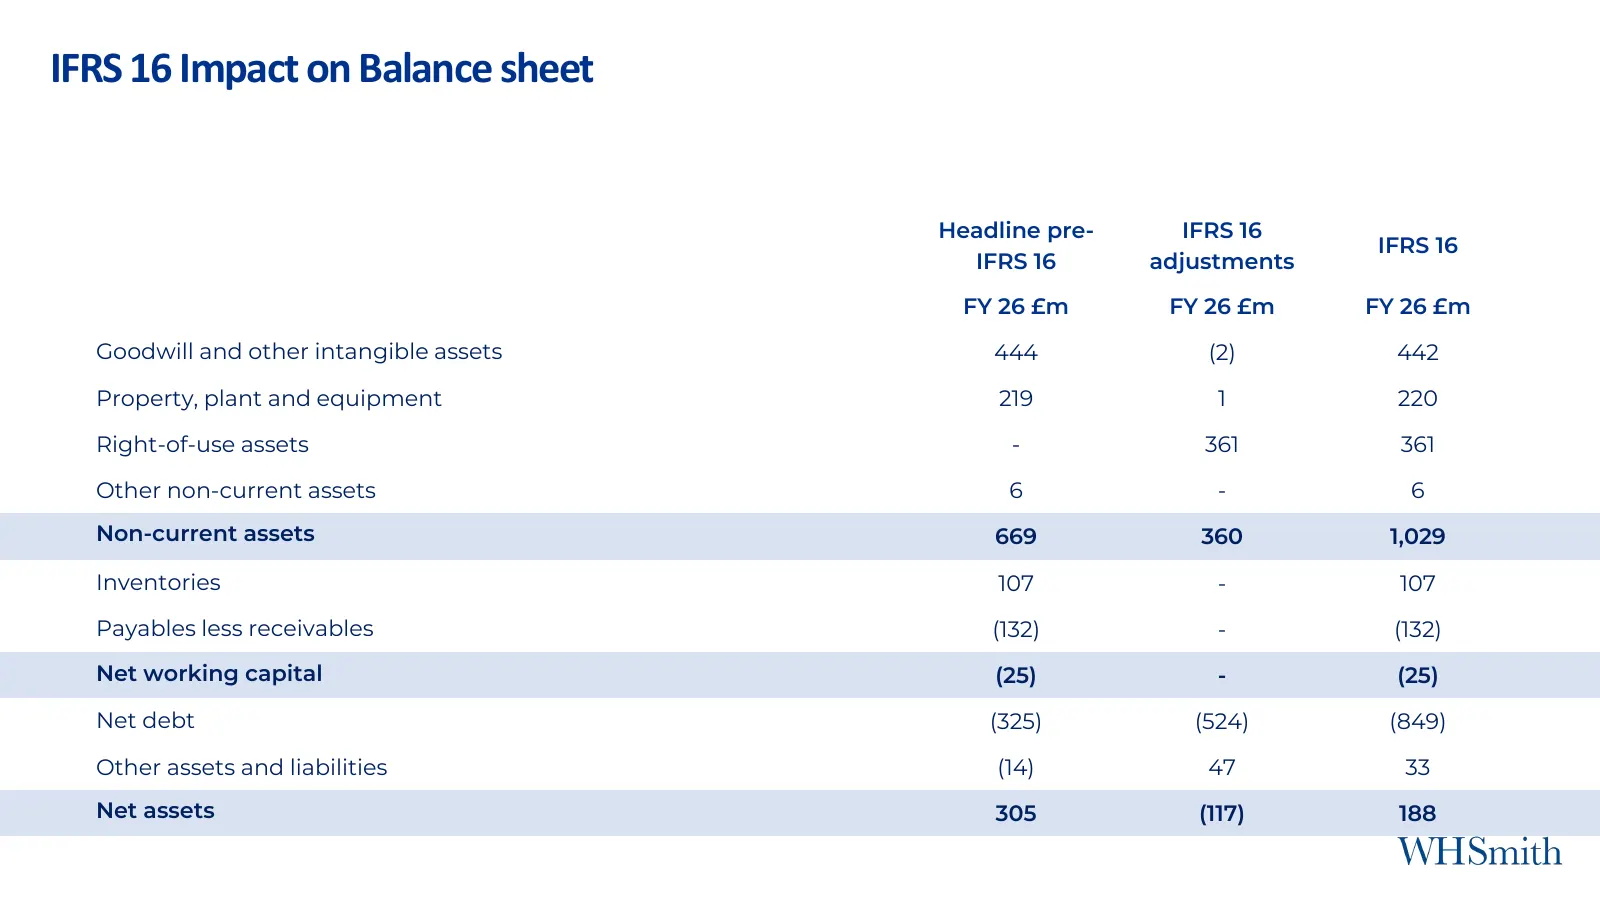
IFRS 16 Impact on Balance sheet Headline pre- IFRS 16 IFRS 16 IFRS 16 adjustments FY 26 £m FY 26 £m FY 26 £m Goodwill and other intangible assets 444 (2) 442 Property, plant and equipment 219 1 220 Right-of-use assets - 361 361 Other non-current assets 6 - 6 Non-current assets 669 360 1,029 Inventor
Source: company website
More decks from WH Smith PLC
 H1 2026 Earnings Presentation32 slides · 2026
 H1 2025 Earnings Presentation40 slides · Apr 16, 2025
 FY2023 Earnings Presentation51 slides · Nov 9, 2023
 FY2022 Earnings Presentation40 slides · Nov 10, 2022
 H1 2022 Earnings Presentation43 slides · Apr 27, 2022
 FY2021 Earnings Presentation45 slides · Nov 11, 2021